Embed Size (px)
Citation preview
7/26/2019 ABSORPTION STUDIES OF CREATININE USING SINGLE-REAGENT AND SINGLE WAVE LENGTH METHOD BY OPTICAL INTERFERENCE WAVELENGTH …
http://slidepdf.com/reader/full/absorption-studies-of-creatinine-using-single-reagent-and-single-wave-length 1/6
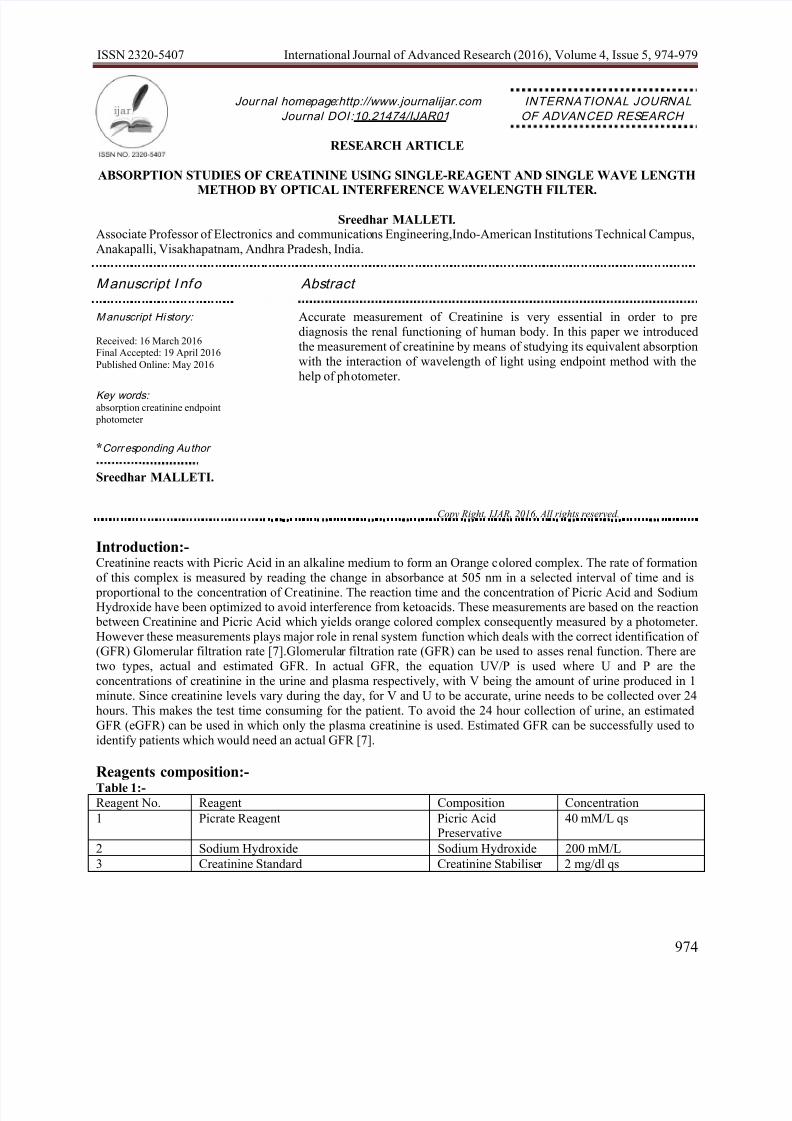
ISSN 2320-5407 International Journal of Advanced Research (2016), Volume 4, Issue 5, 974-979
974
Journal homepage :http://www.journalijar.com INTERNATIONAL JOURNAL
Journal DOI :10.21474/IJAR01 OF ADVANCED RESEARCH
RESEARCH ARTICLE
ABSORPTION STUDIES OF CREATININE USING SINGLE-REAGENT AND SINGLE WAVE LENGTHMETHOD BY OPTICAL INTERFERENCE WAVELENGTH FILTER.
Sreedhar MALLETI . Associate Professor of Electronics and communications Engineering,Indo-American Institutions Technical Campus,
Anakapalli, Visakhapatnam, Andhra Pradesh, India.
Manuscript I nfo Abstract
Manuscript History:
Received: 16 March 2016Final Accepted: 19 April 2016
Published Online: May 2016
Key words:absorption creatinine endpoint
photometer
*Corresponding Author
Sreedhar MALLETI.
Accurate measurement of Creatinine is very essential in order to pre
diagnosis the renal functioning of human body. In this paper we introduced
the measurement of creatinine by means of studying its equivalent absorption
with the interaction of wavelength of light using endpoint method with the
help of photometer.
Copy Right, IJAR, 2016, All rights reserved.
Introduction:- Creatinine reacts with Picric Acid in an alkaline medium to form an Orange colored complex. The rate of formation
of this complex is measured by reading the change in absorbance at 505 nm in a selected interval of time and is
proportional to the concentration of Creatinine. The reaction time and the concentration of Picric Acid and SodiumHydroxide have been optimized to avoid interference from ketoacids. These measurements are based on the reaction
between Creatinine and Picric Acid which yields orange colored complex consequently measured by a photometer.
However these measurements plays major role in renal system function which deals with the correct identification of(GFR) Glomerular filtration rate [7].Glomerular filtration rate (GFR) can be used to asses renal function. There are
two types, actual and estimated GFR. In actual GFR, the equation UV/P is used where U and P are the
concentrations of creatinine in the urine and plasma respectively, with V being the amount of urine produced in 1
minute. Since creatinine levels vary during the day, for V and U to be accurate, urine needs to be collected over 24
hours. This makes the test time consuming for the patient. To avoid the 24 hour collection of urine, an estimated
GFR (eGFR) can be used in which only the plasma creatinine is used. Estimated GFR can be successfully used to
identify patients which would need an actual GFR [7].
Reagents composition:-
Table 1:-Reagent No. Reagent Composition Concentration
1 Picrate Reagent Picric AcidPreservative
40 mM/L qs
2 Sodium Hydroxide Sodium Hydroxide 200 mM/L
3 Creatinine Standard Creatinine Stabiliser 2 mg/dl qs
7/26/2019 ABSORPTION STUDIES OF CREATININE USING SINGLE-REAGENT AND SINGLE WAVE LENGTH METHOD BY OPTICAL INTERFERENCE WAVELENGTH …
http://slidepdf.com/reader/full/absorption-studies-of-creatinine-using-single-reagent-and-single-wave-length 2/6
ISSN 2320-5407 International Journal of Advanced Research (2016), Volume 4, Issue 5, 974-979
975
Working reagent preparation:-Prepare Working Reagent by mixing equal volume of Reagent 1 (Picrate Reagent) with Reagent2(Sodium
Hydroxide) to make up the desired volume. Mix gently for 2 minutes. Reagent 3 is ready to use.
Reagent storage and stability:-
Prior to reconstitution:-Unopened Reagents 1, 2 are stable at Room Temperature (15 – 30 ºC) and reagent 3 is stable at 2-8 ºC until the
expiry date mentioned on the container label.
After reconstitution, The “Working Reagent” is stable for 7 days at 2-8ºC.
Equipment and specifications:- a. Light source:-
b. Inner Reaction bath window:-
c. Outer Reaction bath window:-d. lens system and photometer:-This system consists of
9 optical paths with interference filters
Wavelengths: 340 nm, 405nm, 450nm, 510nm, 546nm, 578nm, 630nm, 670nm, 700nm
Half band width: ≤12nm
Measurement range: 0.1-4.0 Abs
Lamp: 12 V 50 VA tungsten-halogen
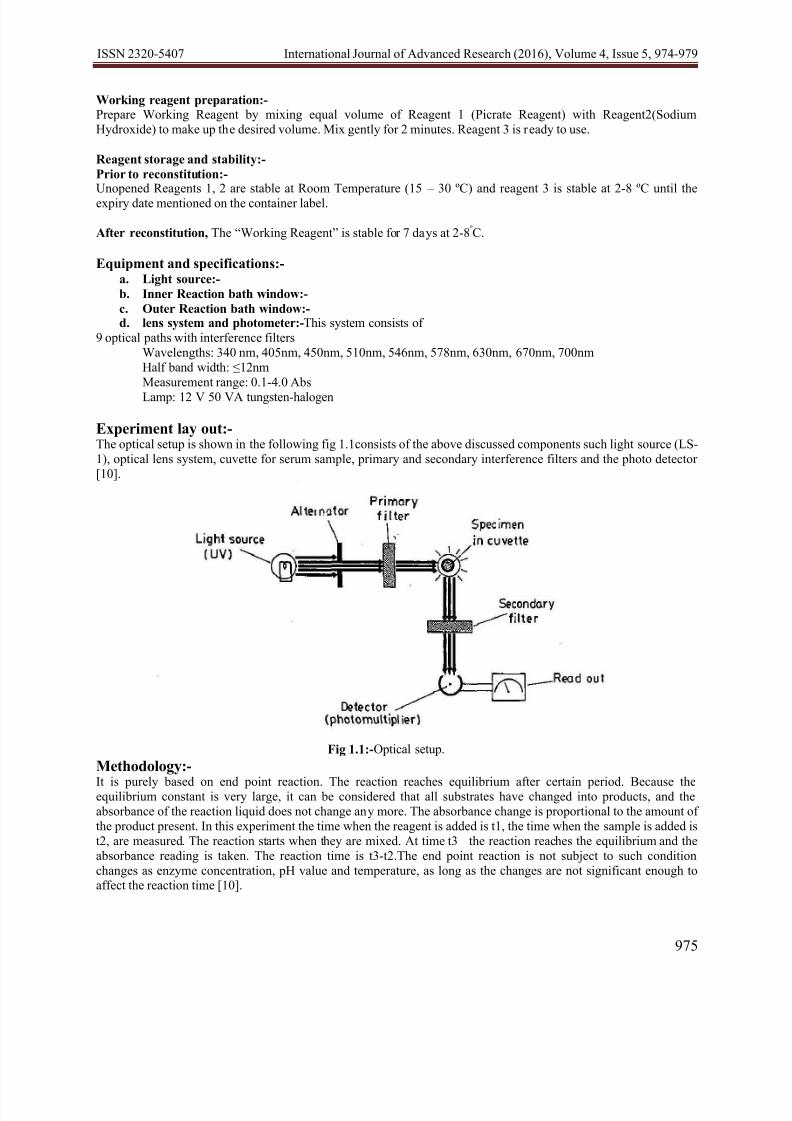
Experiment lay out:-The optical setup is shown in the following fig 1.1consists of the above discussed components such light source (LS-
1), optical lens system, cuvette for serum sample, primary and secondary interference filters and the photo detector
[10].
Fig 1.1:-Optical setup.
Methodology:-
It is purely based on end point reaction. The reaction reaches equilibrium after certain period. Because theequilibrium constant is very large, it can be considered that all substrates have changed into products, and the
absorbance of the reaction liquid does not change any more. The absorbance change is proportional to the amount of
the product present. In this experiment the time when the reagent is added is t1, the time when the sample is added is
t2, are measured. The reaction starts when they are mixed. At time t3 the reaction reaches the equilibrium and the
absorbance reading is taken. The reaction time is t3-t2.The end point reaction is not subject to such condition
changes as enzyme concentration, pH value and temperature, as long as the changes are not significant enough toaffect the reaction time [10].
7/26/2019 ABSORPTION STUDIES OF CREATININE USING SINGLE-REAGENT AND SINGLE WAVE LENGTH METHOD BY OPTICAL INTERFERENCE WAVELENGTH …
http://slidepdf.com/reader/full/absorption-studies-of-creatinine-using-single-reagent-and-single-wave-length 3/6
ISSN 2320-5407 International Journal of Advanced Research (2016), Volume 4, Issue 5, 974-979
976
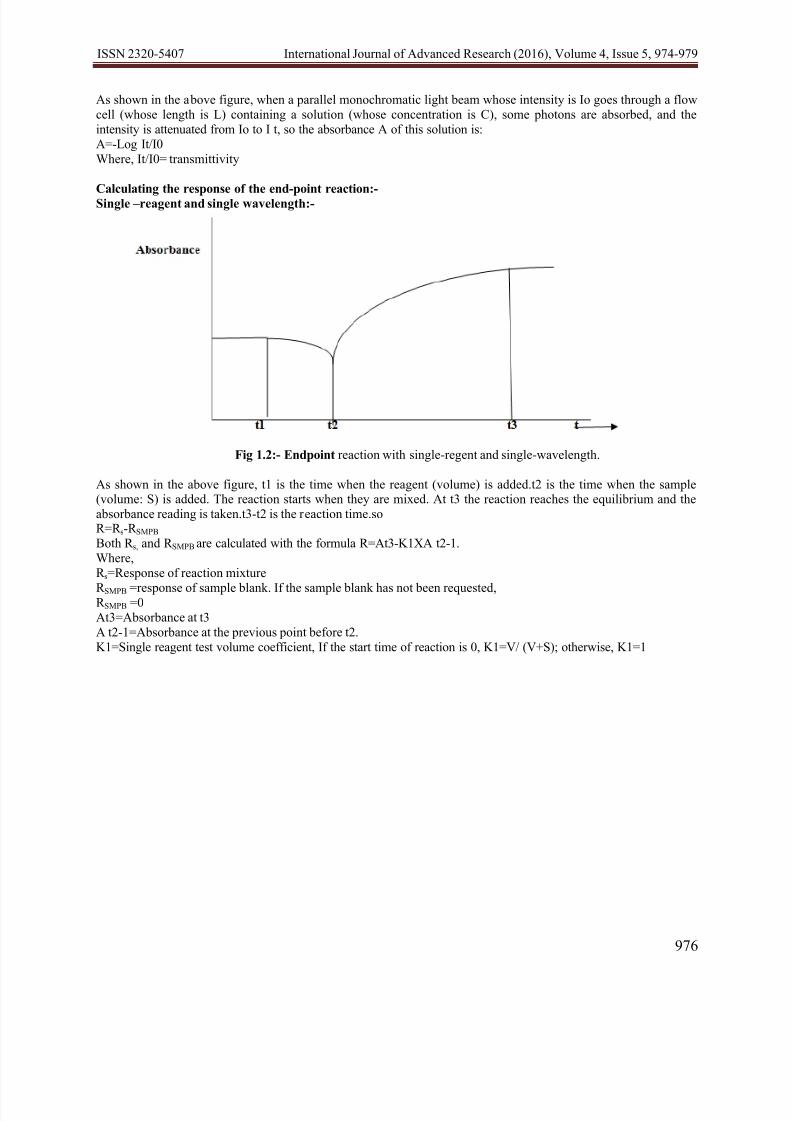
As shown in the above figure, when a parallel monochromatic light beam whose intensity is Io goes through a flow
cell (whose length is L) containing a solution (whose concentration is C), some photons are absorbed, and the
intensity is attenuated from Io to I t, so the absorbance A of this solution is:
A=-Log It/I0
Where, It/I0= transmittivity
Calculating the response of the end-point reaction:-
Single –
reagent and single wavelength:-
Fig 1.2:- Endpoint reaction with single-regent and single-wavelength.
As shown in the above figure, t1 is the time when the reagent (volume) is added.t2 is the time when the sample(volume: S) is added. The reaction starts when they are mixed. At t3 the reaction reaches the equilibrium and the
absorbance reading is taken.t3-t2 is the reaction time.soR=R s-R SMPB
Both R s, and R SMPB are calculated with the formula R=At3-K1XA t2-1.
Where,
R s=Response of reaction mixture
R SMPB =response of sample blank. If the sample blank has not been requested,R SMPB =0
At3=Absorbance at t3
A t2-1=Absorbance at the previous point before t2.
K1=Single reagent test volume coefficient, If the start time of reaction is 0, K1=V/ (V+S); otherwise, K1=1
7/26/2019 ABSORPTION STUDIES OF CREATININE USING SINGLE-REAGENT AND SINGLE WAVE LENGTH METHOD BY OPTICAL INTERFERENCE WAVELENGTH …
http://slidepdf.com/reader/full/absorption-studies-of-creatinine-using-single-reagent-and-single-wave-length 4/6
ISSN 2320-5407 International Journal of Advanced Research (2016), Volume 4, Issue 5, 974-979
977
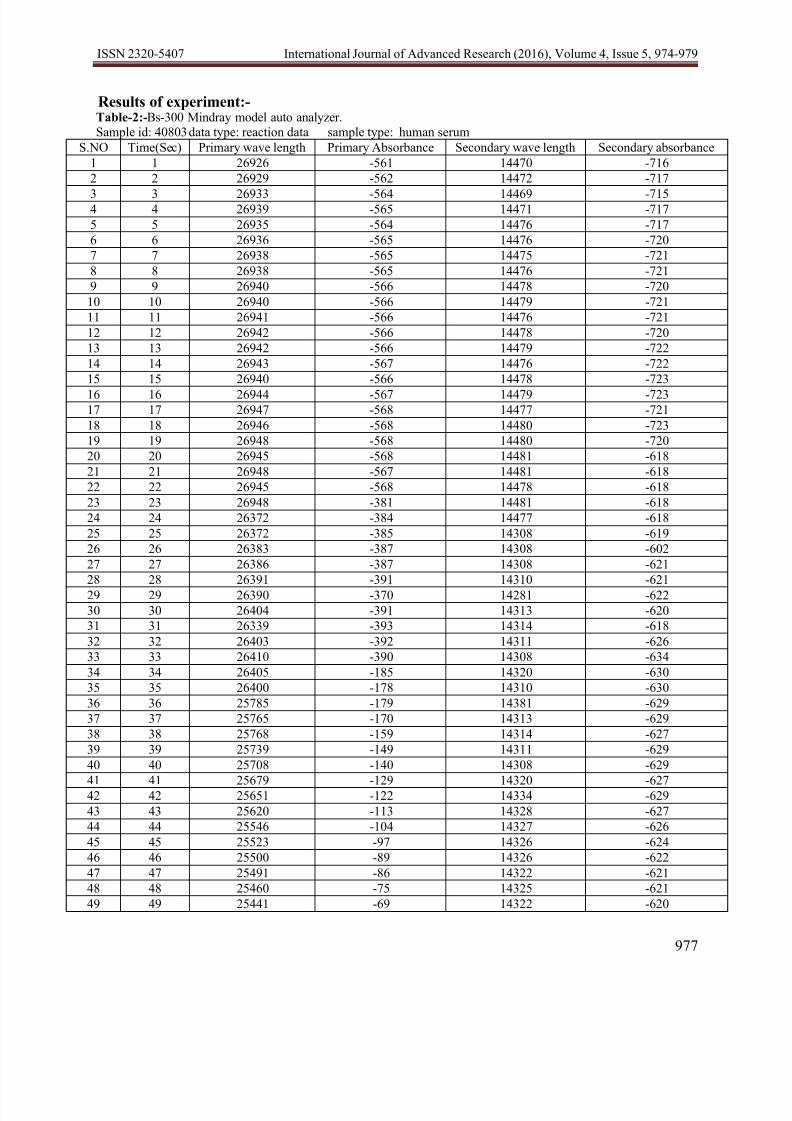
Results of experiment:- Table-2:-Bs-300 Mindray model auto analyzer.
Sample id: 40803 data type: reaction data sample type: human serum
S.NO Time(Sec) Primary wave length Primary Absorbance Secondary wave length Secondary absorbance
1 1 26926 -561 14470 -716
2 2 26929 -562 14472 -717
3 3 26933 -564 14469 -7154 4 26939 -565 14471 -717
5 5 26935 -564 14476 -717
6 6 26936 -565 14476 -720
7 7 26938 -565 14475 -721
8 8 26938 -565 14476 -721
9 9 26940 -566 14478 -720
10 10 26940 -566 14479 -721
11 11 26941 -566 14476 -721
12 12 26942 -566 14478 -720
13 13 26942 -566 14479 -722
14 14 26943 -567 14476 -722
15 15 26940 -566 14478 -723
16 16 26944 -567 14479 -72317 17 26947 -568 14477 -721
18 18 26946 -568 14480 -723
19 19 26948 -568 14480 -720
20 20 26945 -568 14481 -618
21 21 26948 -567 14481 -618
22 22 26945 -568 14478 -618
23 23 26948 -381 14481 -618
24 24 26372 -384 14477 -618
25 25 26372 -385 14308 -619
26 26 26383 -387 14308 -602
27 27 26386 -387 14308 -621
28 28 26391 -391 14310 -621
29 29 26390 -370 14281 -622
30 30 26404 -391 14313 -620
31 31 26339 -393 14314 -618
32 32 26403 -392 14311 -626
33 33 26410 -390 14308 -634
34 34 26405 -185 14320 -630
35 35 26400 -178 14310 -630
36 36 25785 -179 14381 -629
37 37 25765 -170 14313 -629
38 38 25768 -159 14314 -627
39 39 25739 -149 14311 -629
40 40 25708 -140 14308 -629
41 41 25679 -129 14320 -62742 42 25651 -122 14334 -629
43 43 25620 -113 14328 -627
44 44 25546 -104 14327 -626
45 45 25523 -97 14326 -624
46 46 25500 -89 14326 -622
47 47 25491 -86 14322 -621
48 48 25460 -75 14325 -621
49 49 25441 -69 14322 -620
7/26/2019 ABSORPTION STUDIES OF CREATININE USING SINGLE-REAGENT AND SINGLE WAVE LENGTH METHOD BY OPTICAL INTERFERENCE WAVELENGTH …
http://slidepdf.com/reader/full/absorption-studies-of-creatinine-using-single-reagent-and-single-wave-length 5/6
ISSN 2320-5407 International Journal of Advanced Research (2016), Volume 4, Issue 5, 974-979
978
In this experiment the time when the reagent is added is t1=20 sec
The time when the sample is added is t2=22 sec
The reaction starts when they are mixed. At t3= 47 sec the reaction reaches the equilibrium and the absorbance
reading is taken. The reaction time is t3-t2= 47-22=25 sec
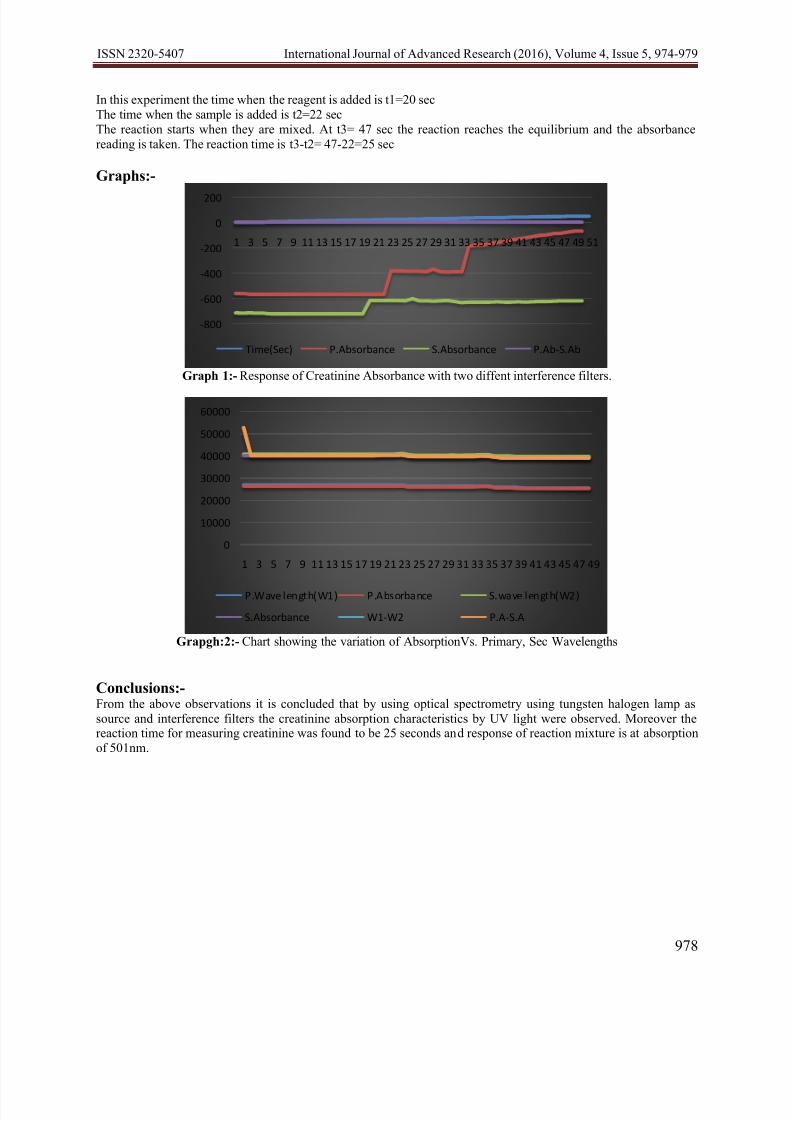
Graphs:-
Graph 1:- Response of Creatinine Absorbance with two diffent interference filters.
Grapgh:2:- Chart showing the variation of AbsorptionVs. Primary, Sec Wavelengths
Conclusions:-From the above observations it is concluded that by using optical spectrometry using tungsten halogen lamp as
source and interference filters the creatinine absorption characteristics by UV light were observed. Moreover thereaction time for measuring creatinine was found to be 25 seconds and response of reaction mixture is at absorption
of 501nm.
-800
-600
-400
-200
0
200
1 3 5 7 9 11 13 15 17 19 21 23 25 27 29 31 33 35 37 39 41 43 45 47 49 51
Time(Sec) P.Absorbance S.Absorbance P.Ab-S.Ab
0
10000
20000
30000
40000
50000
60000
1 3 5 7 9 11 13 15 17 19 21 23 25 27 29 31 33 35 37 39 41 43 45 47 49
P.Wave length(W1) P.Absorbance S.wave length(W2)
S.Absorbance W1-W2 P.A-S.A
7/26/2019 ABSORPTION STUDIES OF CREATININE USING SINGLE-REAGENT AND SINGLE WAVE LENGTH METHOD BY OPTICAL INTERFERENCE WAVELENGTH …
http://slidepdf.com/reader/full/absorption-studies-of-creatinine-using-single-reagent-and-single-wave-length 6/6
ISSN 2320-5407 International Journal of Advanced Research (2016), Volume 4, Issue 5, 974-979
979
References:-1. Myers GL, Miller WG, Coresh J, et al. Recommendations for improving serum creatinine measurement: A
report from the Laboratory Working Group of the National Kidney Disease Education Program. Clin Chem.
2006; 52:5 – 18.
2. National Kidney Foundation. K/DOQI clinical practice guidelines for chronic kidney disease: evaluation,
classification and stratification. Kidney Disease Outcome Quality Initiative. Am J Kidney Dis. 2002; 39:S1 –
S246.3.
Welch MJ, Cohen A, Hertz HS, et al. Determination of serum creatinine by Isotope dilution mass spectrometry
as a candidate definitive method. Anal Chem. 1986; 58:1681 – 5.
4.
Stokes P, O’Connor G. Development of a liquid chr omatography-mass Spectrometry method for high-accuracy
determination of creatinine in Serum. J Chromatograph B Analytic Techno Biomed Life Sci. 2003; 794:125 – 36.
5.
Owen LJ, Wear JE, Keevil BG. “Validation of a liquid chromatography Tandem mass spectrometry assay for
serum creatinine and comparison with Enzymatic and Jaffe methods”. Ann Clin Biochem. 2006; 43:118– 23.6.
J E Haddow, G J Knight, G E Palomaki, L M Neveux and BA Chilmonczyk “Replacing creatinine
measurements with specific gravity values to adjust Urine cotinine concentrations”. Foundation for Blood
Research, Scarborough, ME 04070-0190.
7. Mathew TH. “Australasian Creatinine Consensus Working Group. Chronic Kidney disease and automatic
reporting of estimated glomerular filtration Rate: a position statemen t”Med J Aust. 2005; 183:138– 41.
8. Levey AS, Coresh J, Greene T, et al. “Expressing the MDRD study equation for estimating GFR with IDMS
traceable (gold standard) serum creatinine Values” J Am Soc Nephron. 2005; 16:69A.
9.
Edmund J. Lamb, Andrew S. Levey, and Paul E. Stevens The Kidney Disease Improving Global Outcomes
(KDIGO) Guideline Update for Chronic Kidney Disease: Evolution not Revolution, Clinical Chemistry 2013; v.59, p.462-465.
10.
M.Sreedhar, Dr.P.L.H.Varaprasad, Dr.A.Bhujangarao, M.Saradadevi, Absorption studies of creatinine usingkinetic reaction method by optical interference wavelength filters. International journal of scientific and
engineering research publications ISSN 2229-5518 vol.6 issue 2, February 2015, page nos 148 to 153, Country:
France (Impact factor 2013-14: 3.2).
11.
M.Sreedhar, Dr.P.L.H.Varaprasad, Dr.A.Bhujangarao M.Saradadevi Absorption studies of creatinine using
End-point Method by optical interference wavelength filters. International journal of scientific and research
publications ISSN 2250-3153 vol.5, issue 2, page nos:1 to 4, Country: Joint collaboration between USA &
India, February 2015(Impact factor 2013:1.22).3.International journal of applied engineering research ISSN
0973-4562 vol.6