Embed Size (px)
Citation preview

2
Abstract
An in situ study was designed to investigate naturally developed demineralisation in
human enamel in a widely non-destructive manner in combination with X-ray
microtomography. Samples of human enamel were carried in the oral cavity of
participants for 24 hours daily for either 21 or 29 days using so-called intraoral
mandibular appliances (ICTs). Demineralisation was thereby generated in a natural
way without causing caries in the subjects’ dentition. By employing synchrotron-
based X-ray microtomography (XMT) in combination with volume image analysis, a
quantification and three-dimensional visualisation of different stages of mineral
density loss was possible. Basic features of the demineralized samples were similar
to those reported in earlier in vitro studies. However, the analysed samples showed
significant differences in the morphology of surface attack and the degree of mineral
density loss depending on the carrier, the exposure time and the position within the
ICT. In particular, the varying local conditions within a carrier’s oral cavity seem to be
different than in an in vitro study. Our results show that the combination of ICTs and
quantitative image analysis applied to XMT data provides an analytical tool which is
highly suited for the fundamental investigation of naturally developed
demineralisation processes.
Keywords: caries, mineral concentration, intraoral appliance, intra-oral cariogenicity test system, synchrotron radiation, quantitative image analysis.

3
1. Introduction
Several studies attempting to understand the kinetics of early demineralisation which
starts underneath the enamel surface have been performed in the past. Imaging
techniques such as optical microscopy (Darling, 1958) and electron microscopy
(Haikel et al., 1983; Hicks and Silverstone, 1985; Jones and Boyde, 1987; Pearce
and Nelson, 1989; Shellis and Hallsworth, 1987; Boyde et al., 1995, 1999) were
frequently used. Those techniques have the disadvantage of penetrating the material
under study a few nanometres to 1 µm only. Therefore, the resulting two-dimensional
images provided a limited insight into the lesion development and required invasive
tissue preparation for the investigation of structural changes below the surface of the
specimens (Baumgartner et al., 2000).
An alternative approach is the application of X-ray micro computed tomographic
(XMT) techniques which provide three-dimensional images of the scanned specimen.
Numerous articles are reporting on enamel demineralisation using high resolution
computed tomography have been published which (e.g., Bing He et al., 2011; Hamba
et al., 2011; Schwass et al., 2009; Tanaka et al., 2010). Frequently synchrotron
radiation is employed for XMT in order to achieve higher spatial resolution and
contrast (Bonse and Busch, 1996). At a synchrotron light source the available photon
flux density (Photons/mm2/s) is orders of magnitude higher and the beam
propagation is quasi parallel. The latter allows for extending the distance between
source and sample up to several 100 m. Consequently, unlike in conventional
radiography which is based on X-ray tubes, the influence of the finite X-ray source on
the image resolution is surpressed (cf., e. g., Rack et al., 2008). Furthermore, the
high flux allows the use of monochromators. Monochromatic radiation increases the
contrast while reducing beam-hardening artefacts (Brooks and Di Chiro, 1976).
Today, X-ray microtomography (XMT) is a mature technique with high potential for
dental research (Delbem et al., 2009). Working in absorption contrast, the images
acquired with (quasi-) monochromatic radiation allow for a quantitative measure of
changes in the degree of demineralisation inside, e.g., enamel tissue. Several
studies attempting to understand the three dimensional kinetics of demineralisation
have been performed using XMT (Kernen et al., 2008; Kinney et al., 1994, 1995;
Anderson and Elliott, 2000; Stock et al., 2003; Farah et al., 2009; Huang et al., 2007;
Dowker et al., 2006; Delbem et al., 2009; Mitropoulos et al., 2010; Tafforeau and
Smith, 2007; Dowker et al., 2003; Davis and Wong, 1996; Dowker et al., 2004; Elliott

4
et al., 1994), even though extrapolating the three-dimensional de- and
remineralisation processes from such a measurement is a non-trivial task (Dowker et
al., 2003).
Some studies found in the literature are based on in vitro investigations, i.e. the
demineralisation is artificially produced outside the oral cavity. Obviously, the clinical
relevance of in vivo studies is significantly higher, in particular due to the multi-
factorial nature of dental caries (ten Cate, 1994; Zero, 1995). Unfortunately, XMT is
inapplicable for human dental in vivo studies for multiple reasons. One reason is the
high mutagen potential of the employed hard X-ray radiation. Hence, demineralised
teeth have to be extracted prior to imaging (Dowker et al., 2004, Huang et al., 2007,
2010). This makes time-resolved investigations of demineralisation processes
impossible. Furthermore, information on the duration of and the conditions during
demineralisation is limited.
As an alternative, we propose an in situ study using intraoral appliances (intra-oral
cariogenity test systems, ICT) which allow for an exposure of enamel samples to the
human oral cavity over longer periods of time. Consequently, they represent
promising tools to study naturally developed demineralisation in human oral cavities
without causing any decay of the natural dentition (Koulourides and Volker, 1964,
Koulourides and Chien, 1992). Thus, in situ studies combining ICTs with XMT
imaging of the demineralised samples may bridge the gap between the highly
controlled laboratory condition in vitro and the uncontrolled clinical situation in vivo. It
is the aim of our pilot study to test the applicability of these techniques for the
investigation of natural demineralisation processes. To the best of our knowledge
such studies have not been performed so far. Of particular interest is whether the
enamel demineralisation differs in its morphology from artificially generated lesions.
Furthermore, commonly earlier studies focused mainly on the evaluation the three-
dimensional (3D) image data by means of volume renderings and density profiles
along line sections. In our work methods from quantitative volume image analysis are
introduced. Their application allows one to fully exploit the information provided by
the 3D image data.
2. Materials and Methods
2.1. Preparation of specimens and intraoral appliance

5
Eight caries free third molars were extracted and stored for 24 h in Ringer’s solution
(DAB 7; Delta-Pharma, Pfullingen, Germany). After extraction the remaining tissue
was removed with a scalpel under running water. With a diamond-coated wire saw
(wire: 300 µm; saw: Type 4240, Well, Mannheim, Germany) the crowns were
separated from the roots. During the sawing process the teeth were wetted
constantly with phosphate enriched Na-Cl solution. 33 cubes of roughly 1 mm3
volume consisting of enamel of the occlusal surfaces and parts of contiguous dentine
were prepared.
The specimens were covered with a varnish coat on five faces, leaving only the
natural outer (occlusal) enamel surface free (Nail varnish: Nivea, Beiersdorf,
Hamburg, Germany). The cubes were sterilised for 25 min at 1.8 bar and 122 °C
(Technoclav 50, Technomara, Fernwald, Germany).
Afterwards 32 samples were randomly integrated into four removable ICTs, as shown
in Fig. 1. The assembled samples were covered with a gold-micro mesh that allowed
for accumulation of plaque on the specimen surface.
Fig. 1: Design of the intraoral mandibular appliances (ICT). The removable appliance is designed for the mandibular jaw. On the lingual side of the 3rd and 4th quadrand four samples of human enamel are polymerised below the micromesh (photograph).
2.2. Participants and experimental setup
Four participants volunteered for the pilot-study (3 female, 1 male, age: 23-27 years).
The participants signed appropriate information consent forms. They were in good
general health, had no infectious diseases and did neither take antibiotics nor
medications that affect salivary flow for at least twelve months before and during the
study. All participants were non-smokers and had moderate past caries experience
with restored decays. If necessary, radiographs were taken to exclude caries and all

6
carious lesions were restored by a dentist of the Department of Conservative and
Preventive Dentistry, RWTH Aachen University, Germany. The participants had a
minimum of 28 natural teeth and generally good periodontal health. They wore the
ICT day and night and removed it only for individual oral hygiene with fluoride
toothpaste and to clean the ICT twice a day with fluoride-free toothpaste. To allow
plaque to grow under the micro mesh the participants were instructed to clean the
area of the specimens only by using running water. We chose different time periods
of carrying the samples, presuming demineralisation to emerge after a period of at
least three and at most four weeks. Since the time period for the XMT measurement
was constricted to several hours during one day, all samples had to be removed from
the ICTs on the same day. Therefore, two research subjects (participants A and B)
started with the in situ study 21 days and two subjects (participants C and D) 29 days
before the day of measuring. After extraction and during XMT measurement each
sample was stored in a labelled closed container filled with Ringer’s solution. A total
of seven samples from participant A, eight from participant B, seven from participant
C and one from participant D were scanned by XMT.
2.3. Synchrotron-based microtomography using hard X-rays
The XMT measurements were carried out at the BAMline, the first hard X-ray
beamline of the BESSY–II light source (Helmholtz Zentrum für Materialien und
Energie, Berlin, Germany, cf. Rack et al., 2008b). Quasi-monochromatic radiation of
25 keV X-ray photon energy was attained by setting a double-multilayer
monochromator (approximately 1% energy bandwidth). Attenuators were inserted to
block photons passing the monochromator by means of total reflection. To convert
the synchrotron light after transmitting the sample into visible light, a 7-µm-thick
YAG:Ce (Ce-doped Y3Al5O12) single-crystal scintillator was used. The scintillator was
coupled via diffraction-limited visible light optics to a CCD camera (VersArray: 2048B,
2048×2048 pixel, Princeton Instruments). The indirect detector samples the visible
light image with 1.6 µm effective pixel size. The spatial resolution achieved is
approximately 7-8 µm. The images were taken in absorption mode, i.e. the detector
was placed close downstream of the samples, which allows for neglecting coherence
effects on our results, i.e. X-ray inline phase contrast. Each specimen was scanned
with 900 projections over a 180° rotation. Three-di mensional data sets were
reconstructed using the filtered backprojection algorithm (Kak and Slaney, 1988)

7
implemented in the software package PyHST of the SciSoft group of the European
Synchrotron ESRF (Banhart, 2008; Mirone et al., 2012).
2.4. Image analysis
Tomographic reconstruction yields volume image data represented as a three-
dimensional matrix of grey values. In our case, each point in this matrix (a three-
dimensional pixel which is called voxel) corresponds to (1.6 µm)³ of material. Our
image analysis is based on the assumption that the value associated with each voxel
is approximately proportional to the local attenuation coefficient (LAC) of the material
which is directly connected to its local physical density. Dowker et al., 2003
introduced a method for the reconstruction of the mineral concentration from the LAC
modelling enamel as a two-phase system. Since the parameters of this model are
unknown an uncertainty is introduced into the analysis results.
In this article, an alternative approach is proposed. Making sure that sound (non-
demineralised) enamel is always included in the image we can normalise and
therefore measure the relative density loss due to demineralisation in a quantitative
manner (Rack et al., 2008a).
a) b)
Fig. 2. Sectional images of the original grey value image (a) and the original image masked with reconstructed surface (b) for sample C1.
In a first step, relevant regions were cropped from the volume images. After
denoising the resulting images by application of a 3x3x3 mean-filter, they were
binarised using a simple threshold. The exposed enamel surface was identified by a
morphological closure (Ohser and Schladitz, 2009). The distance of each enamel
voxel to the sample surface was computed using the Euclidean distance transform.
This transform determines for each foreground (enamel) voxel the distance to the
closest background (liquid) voxel (Ohser and Schladitz, 2009). Finally, for all voxels
with the same distance value the grey values in the original image were counted.
Hence, the distribution of grey values, i.e. the degree of demineralisation, for points
with a given distance to the surface was investigated. For processing and analysis of
8
the volume images we used the MAVI software package (MAVI, 2012). Sectional
images of an original image and the reconstructed surface are shown in Fig. 2.
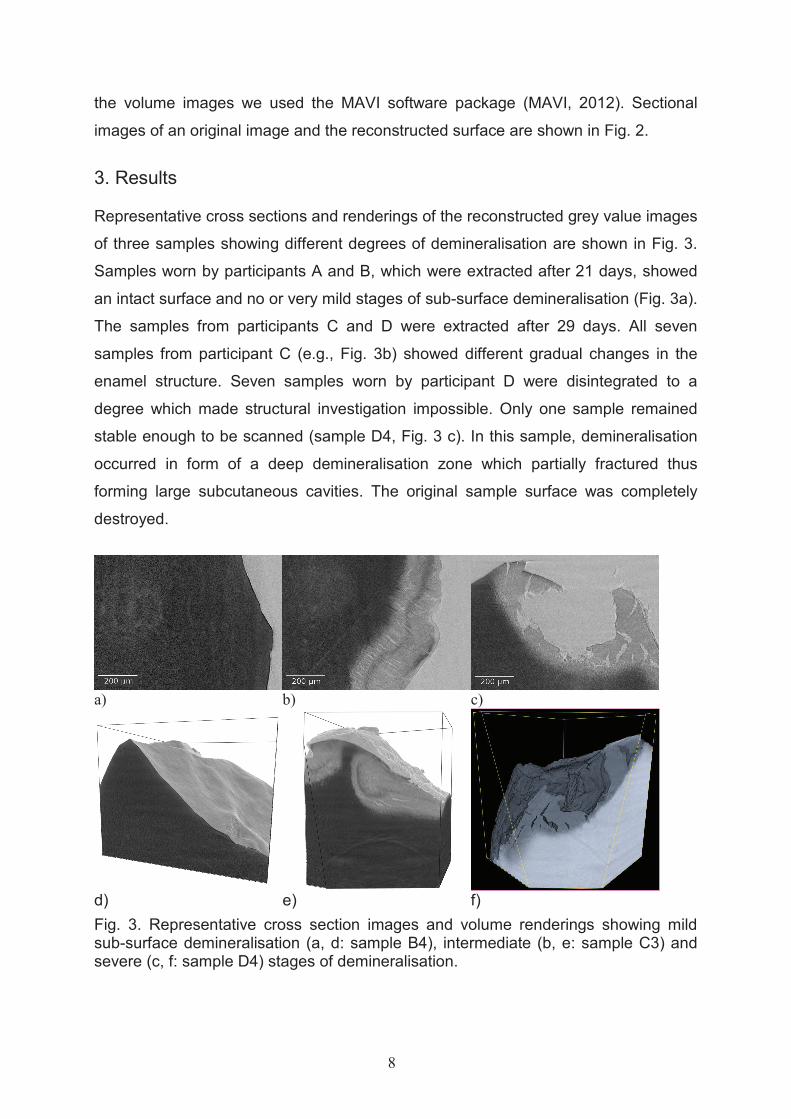
3. Results
Representative cross sections and renderings of the reconstructed grey value images
of three samples showing different degrees of demineralisation are shown in Fig. 3.
Samples worn by participants A and B, which were extracted after 21 days, showed
an intact surface and no or very mild stages of sub-surface demineralisation (Fig. 3a).
The samples from participants C and D were extracted after 29 days. All seven
samples from participant C (e.g., Fig. 3b) showed different gradual changes in the
enamel structure. Seven samples worn by participant D were disintegrated to a
degree which made structural investigation impossible. Only one sample remained
stable enough to be scanned (sample D4, Fig. 3 c). In this sample, demineralisation
occurred in form of a deep demineralisation zone which partially fractured thus
forming large subcutaneous cavities. The original sample surface was completely
destroyed.
a) b) c)
d) e) f)
Fig. 3. Representative cross section images and volume renderings showing mild sub-surface demineralisation (a, d: sample B4), intermediate (b, e: sample C3) and severe (c, f: sample D4) stages of demineralisation.

9
The images were analysed using the image processing techniques described above.
Since all samples worn by participants A and B showed a similar structure, only one
sample for each of these participants was included in the analysis. For participant C,
one sample was excluded from the analysis due to inappropriate sample geometry.
The remaining six samples were analysed. For the remaining sample of participant D,
a morphological reconstruction of the sample surface was not possible.
Fig. 4 shows the mean relative grey value (the mean grey value in a given depth
divided by grey value for sound enamel) as a function of the distance to the
reconstructed sample surface. Since mean grey values for consecutive distance
values varied to a certain degree a smoothing spline was fit to the observations to
obtain the curves shown in Fig. 4. Bright areas close to the sample surface (see e.g.
Fig. 2 or Fig. 3 a) were partly levelled out by this procedure.
Fig. 4. Relative mean grey value (mean grey value divided by grey value for sound enamel) as a function of the distance to the sample surface. High grey values correspond to high enamel density; lower grey values indicate demineralisation of the material. Subjects A and B exposure time 21 days, C 29 days.
In the plots, a value of one corresponds to sound enamel. The difference from one
can be used as a measure for the degree of demineralisation of the sample. Ring

1
artefacts, which are a common type of artefacts in tomographic image data (see Fig.
3 e or Fig. 5 b below), only appeared at relatively large distances to the
demineralised zone such that they did not affect the analysis.
Further results of the analysis are summarized in Table 1. In this table the depth of
demineralisation is defined as the minimal distance to the sample surface such that
the relative mean grey value shown in Fig. 4 reaches the value of 1.
Table 1
Degree and depth of demineralisation for the analysed samples
Sample Analysed volume
[voxel]
Maximal reduction
of mean grey value
[%]
Depth of
demineralisation
[µm]
A4(1d) 738 x 783 x 1053 12.4 201
B4(2d) 747 x 955 x 1040 9.5 158
C1(3a) 453 x 330 x 666 42.1 267
C3(3c) 571 x 579 x 772 43.4 243
C4(3d) 721 x 552 x 490 32.4 252
C5(3e) 580 x 227 x 453 25.6 135
C7(3g) 693 x 533 x 542 40.0 269
C8(3h) 542 x 736 x 748 51.5 210
The results show significant differences in tissue loss between different exposure
times and carriers. However, also in samples worn by the same person for the same
period differences in degree and morphology of the demineralisation were observed.
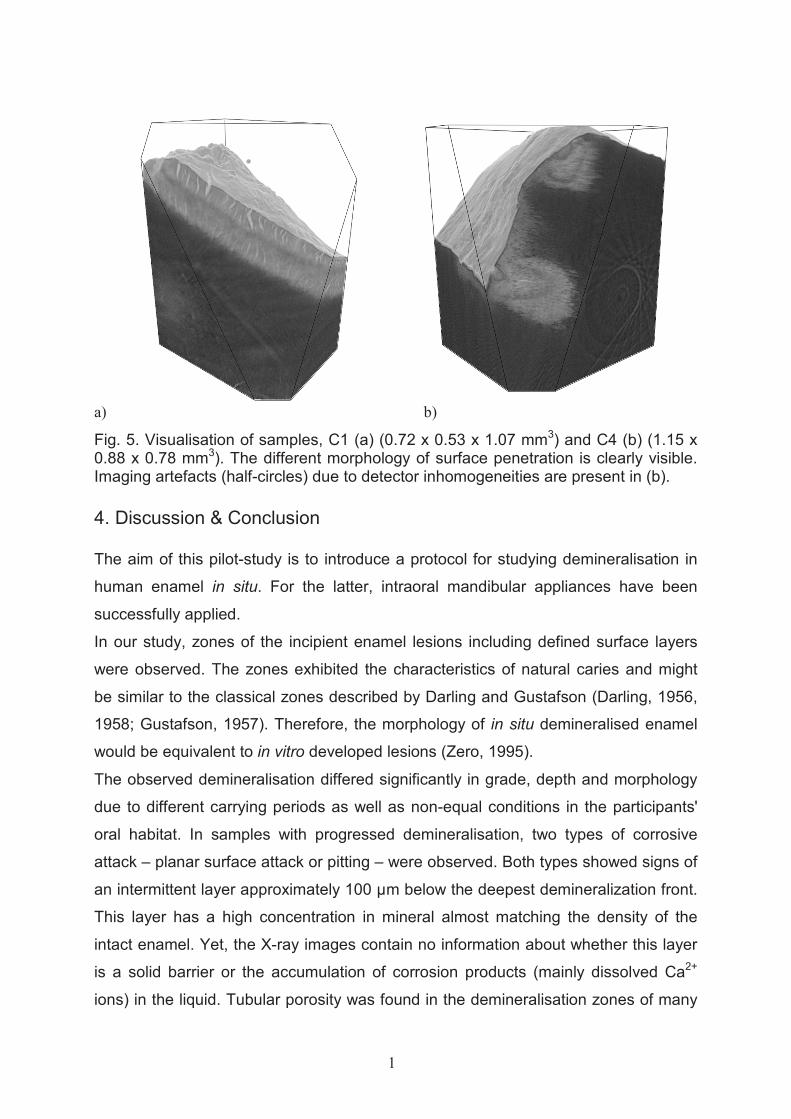
To further illustrate these differences, Fig. 5 shows volume renderings of samples C1
and C4. Sample C1 shows a well-organized progress of demineralisation which can
be divided into two zones at different depth separated by a bright intermittent layer of
almost full mineral density which is located approximately 100 µm below the enamel
surface. In addition to the obvious loss of mineral density subcutaneous porosities
were observed in the form of elongated pores which extend perpendicular to and
approximately 100-200 µm underneath the enamel surface.
Contrary, the acid-attack on sample C4 is more localised. Areas with deeply
penetrating demineralisation alternate with areas with only mild stages of
demineralisation. Note that this local attack results in a comparably low degree of
demineralisation as measured by the volume image analysis and shown in Fig. 4 for
this sample. Highly demineralised areas show a similar layer structure as the
homogeneous sample C1. However, the amount of subcutaneous pores in this
sample is much lower than in sample C1.
1
a) b)
Fig. 5. Visualisation of samples, C1 (a) (0.72 x 0.53 x 1.07 mm3) and C4 (b) (1.15 x 0.88 x 0.78 mm3). The different morphology of surface penetration is clearly visible. Imaging artefacts (half-circles) due to detector inhomogeneities are present in (b).
4. Discussion & Conclusion
The aim of this pilot-study is to introduce a protocol for studying demineralisation in
human enamel in situ. For the latter, intraoral mandibular appliances have been
successfully applied.
In our study, zones of the incipient enamel lesions including defined surface layers
were observed. The zones exhibited the characteristics of natural caries and might
be similar to the classical zones described by Darling and Gustafson (Darling, 1956,
1958; Gustafson, 1957). Therefore, the morphology of in situ demineralised enamel
would be equivalent to in vitro developed lesions (Zero, 1995).
The observed demineralisation differed significantly in grade, depth and morphology
due to different carrying periods as well as non-equal conditions in the participants'
oral habitat. In samples with progressed demineralisation, two types of corrosive
attack – planar surface attack or pitting – were observed. Both types showed signs of
an intermittent layer approximately 100 µm below the deepest demineralization front.
This layer has a high concentration in mineral almost matching the density of the
intact enamel. Yet, the X-ray images contain no information about whether this layer
is a solid barrier or the accumulation of corrosion products (mainly dissolved Ca2+
ions) in the liquid. Tubular porosity was found in the demineralisation zones of many

1
samples in this study whereby the radial orientation of the pores most likely follows
the patterning of the enamel crystalline rods in the corresponding zone.
From our observation on the samples exposed for 29 days we postulate a four-layer
structure of demineralization: close to the enamel surface, demineralization creates a
layer of strongly reduced density marking the beginning decay. At ~ 100 µm depth a
higher density layer is observed followed by another porous low density layer. The
final fourth layer is formed by sound enamel. Due to the averaging properties of the
employed volume analysis algorithm, the intermittent zone between the two
demineralisation layers which is visible in the images did not show up as clearly in
the density profiles in Fig. 4.
It is well established that the lesion development depends on different individual
factors, e.g., salivary rate, mineral concentration of the salivary, buffering capacity
and nutrition behaviour (Silverstone et al., 1988). Under certain in vivo conditions a
demineralisation can even stagnate, or furthermore regress in terms of
remineralisation (Robinson, 2009). Significant differences in demineralisation, in
particular between participants C and D, were also found in our study. However, due
to the small number of research subjects, a detailed investigation of the influence of
individual factors was not possible. For this purpose, it is desirable to perform a study
including a much larger number of research subjects with differing individual
conditions. Besides the progress of demineralisation, the remineralising role of
fluoride in caries prevention in human subjects can be studied in a precise way. A
detailed analysis of in situ remineralisation of enamel will be the topic of our future
research.
Due to insufficient information on the development of natural demineralisation
processes, it was found challenging to select the optimal point in time for sample
removal. Two different carrying periods were selected assuming that demineralisation
occurs after at least two and at most four weeks. Additionally, only a single time
window was available for the XMT measurements such that the in situ part of our
study had to be completed up to a hard deadline. Our results show that a period of
three to four weeks is a critical time window for start and development of
demineralisation processes and seems to be most suited for sample removal. For
future studies, it is advisable to remove samples at multiple time points in order to
follow the demineralisation process in different individuals. Even a reintegration of
scanned samples into the ICT can be considered.

1
5. Summary
We have presented a pilot study aiming at the development of a protocol which
allows for the investigation of natural demineralisation processes in human enamel.
For this purpose, enamel samples were inserted in the oral habitat of four research
subjects using ICTs. After a certain carrying period, the samples were scanned by
XMT and the degree of demineralisation was quantified using methods from 3D
image analysis.
The ICT was found to be an instrument well-adapted for the investigation of in situ
development of naturally demineralised enamel. The chosen dimension of the
samples was well suited for fitting into the ICTs and subsequently into the XMT
detector’s field of view. ICTs provided environmental conditions for natural plaque
formation on the sample surface without causing decay on the participants’ dentition.
Access of dietary substrate and salivary was given, which resulted in plaque
accumulation that led to a diagnosable demineralisation.
Synchrotron XMT provided highly resolved images clearly showing the density
variations within the enamel structure. Methods from quantitative image analysis do
not only allow for a visualisation but also for a quantification of the degree of
demineralisation in different samples. In contrast to classical two-dimensional
imaging techniques, XMT captures the fully three-dimensional morphology of the
demineralised areas. Furthermore, the degree of demineralisation in a given distance
to the true (typically non-planar) sample surface can be investigated in a three-
dimensional manner.
Acknowledgements
The authors would like to thank Dr. A. Haibel and Dr. I. Manke (Hahn Meitner
Institute, Berlin, Germany) as well as Dr. H. Riesemeier (Federal Institute of Materials
Research and Testing (BAM), Berlin, Germany) for their support and suggestions
during the experiments as well as for discussion. Beamtime at the BAMline was
provided by the BESSY II light source (Helmholtz-Zentrum Berlin, Germany). Special
thanks go to Maximilian Lautensack, Aglaia Rack, Elina Redenbach.
1
References
Anderson, P., Elliott, J.C., 2000. Rates of mineral loss in human enamel during in vitro demineralisation perpendicular and parallel to the natural surface. Caries Res. 34, 33–40.
Banhart, J., 2008. Advanced Tomographic Methods in Materials Research and Engineering. Oxford University Press.
Baumgartner, A., Dichtl, S., Hitzenberger, C.K., Sattmann, H., Robl, B., Moritz, A., Fercher, A.F., Sperr, W., 2000. Polarization-sensitive optical coherence tomography of dental structures. Caries Res. 34, 59–69.
Bing, H., Shengbin, H., Chaoliang, Z., Junjun, J., Yuqing, H., Liying, X., Xuedong, Z., 2011. Mineral densities and elemental content in different layers of healthy human enamel with varying teeth age. Arch. Oral. Biol., Mar 14, 2011. [Epub ahead of print].
Bonse, U., Busch, F., 1996. X-ray computed microtomography (µCT) using synchrotron radiation (SR). Prog. Biophys. Molec. Biol. 65, 133-169.
Boyde, A., Davy, K.W.M., Jones, S.J., 1995. Standards for mineral quantification of human bone by analysis of backscattered electron images. Scanning. 17, 6-7.
Boyde, A., Travers, R., Glorieus, F.H., Jones, S.J., 1999. The mineralization density of iliac crest bone from children with osteogenesis imperfect. Calcif Tissue Int. 64, 185-190.
Brooks, R. A. and Di Chiro, G., 1976. Beam hardening in X-ray reconstructive tomography. Phys. Med. Biol. 21, 390-398.
Buzug, T.M, 2008. Computed Tomography. From Photon Statistics to Modern Cone-Beam CT. Springer Verlag, Heidelberg, Germany. ISBN: 978-3-540-39407-5.
Darling, A.I., 1956. Studies of the early lesion of enamel caries with transmitted light, polarised light and radiography. Br. dent. J. 101, 289- 299.
Darling, A.I., 1958. Studies of the early lesion of enamel caries. Its nature, mode of spread and points of entry. Br. dent. J. 105, 119-135.
Davis, G.R., Wong, F.S., 1996. X-ray microtomography of bones and teeth. Physiol. Meas. 17, 121–146.
Delbem, A.C.B., Sassaki, K.T., Vieira, A.E.M., Rodrigues, E., Bergamaschi, M., Stock, S.R., Cannon, M.L., Xiao, X., De Carlo, F., Delbem, A.C.B., 2009. Comparison of methods for evaluating mineral loss: Hardness versus synchrotron microcomputed tomography. Caries Res. 43, 359–365.
Di Masi, E., 2005. Synchrotron imaging of biominerals highlights new results and challenges. Synchr. Rad. News. 18, 17–22.

1
Dowker, S.E.P., Elliott, J.C., Davis, G.R., Wilson, R.M., Cloetens, P., 2004. Synchrotron Xray microtomographic investigation of mineral concentrations at micrometre scale in sound and carious enamel. Caries Res. 38, 514–522.
Dowker, S.E.P., Elliott, J.C., Davis, G.R., Wassif, H.S., 2003. Longitudinal study of the three-dimensional development of subsurface enamel lesions during in vitro demineralization. Caries Res. 37, 237–245.
Farah, R.A., Swain, M.V., Drummond, B.K., Cook, R., Atieh, M., 2009. Mineral density of hypomineralised enamel. J. Dentist. 38, 50–58.
Gustafson, G., 1957. The histopathology of caries of human dental enamel. With special reference to the division of the carious lesion into zones. Acta. Odontol. Scand. 15, 13–55.
Hamba, H., Nikaido, T., Inoue, G., Sadr, A., Tagami, J., 2011. Effects of CPP-ACP with sodium fluoride on inhibition of bovine enamel demineralization: A quantitative assessment using micro-computed tomography. J. Dent. [Epub ahead of print].
Haikel, Y., Frank, R.M., Voegel, J.C., 1983. Scanning electron microscopy of the human enamel surface layer of incipient carious lesions. Caries Res. 17, 1–13.
Hicks, M.J., Silverstone, L.M., 1985. Internal morphology of surface zones from acid-etched caries-like lesions: a scanning electron microscopic study. J. Dent. Res. 64, 1296–1301.
Hsieh, J., 2009. Computed Tomography: Principles, Design, Artifacts and Recent Advances, 2nd edn. SPIE., Bellingham.
Huang, T.T., Jones, A.S., He, L.H., Darendeliler, M.A., Swain, M.V., 2007. Characterisation of enamel white spot lesions using X-ray micro-tomography. J. Dent. 35, 737-743. Huang, T.T., He, L.H., Darendeliler, M.A., Swain, M.V., 2010. Correlation of mineral density and elastic modulus of natural enamel white spot lesions using X-ray microtomography and nanoindentation. Acta Biomater. 6, 4553-4559.
Jones, S.J., Boyde, A., 1987. Scanning microscopic observations on dental caries. Scanning Microsc. 1, 1991–2002.
Kak, A.C., Slaney, M., 1988. Principles of Computerized Tomographic Imaging. IEEE Press, New York.
Kernen, F., Waltimo, T., Deyhle, H., Beckmann, F., Stark, W., Müller, B., 2008. Synchrotron radiation-based micro computed tomography in the assessment of dentin de- and remineralization. Proc. Of SPIE. 7078, 1-9.
Kielbassa, A.M., Schendera, A., Schulte-Mönting, J., 2000. Microradiographic and microscopic studies on in situ induces initial caries in irradiated and nonirradiated dental enamel. Caries Res. 34, 41–47.

1
Kinney, J.H., Marshall, Jr. G.W., Marshall, S.J., 1994. Three dimensional mapping of mineral densities in carious dentin: Theory and method. Scanning Microsc. 8, 197–205.
Kinney, J.H., Balooch, M., Haupt, Jr. D.L., Marshall, S.J., Marshall, Jr. G.W., 1995. Mineral distribution and dimensional changes in human dentine during demineralization. J. Dent. Res. 74, 1179-1184.
Koulourides, T., Volker, J.F., 1964. Changes of enamel microhardness in the human mouth, Alabama. J. Med. Sci. 1, 435–347.
Koulourides, T., Chien, M.C., 1992. The ICT in situ experimental model in dental research. J. Dent. Res. 71, 822–827.
Mirone, A., Wilcke, R., Hammersley, A., Ferrero, C., 2012. PyHST - High Speed Tomographic Reconstruction. http://www.esrf.eu/UsersAndScience/Experiments/TBS/SciSoft/.
MAVI, 2012. Modular Algorithms for Volume Images, Fraunhofer ITWM, www.mavi-3d.de. Ohser, J., Schladitz, K., 2009. 3D Images of Material Structures. Wiley, Weinheim.
Pearce, E.I., Nelson, D.G., 1989. Microstructural features of carious human enamel imaged with backscattered electrons. J. Dent. Res. 68, 113–118.
Rack, A., Riesemeier, H., Zabler, S., Weitkamp, T., Müller, B.R., Weidemann, G., Modregger, P., Banhart, J., Helfen, L., Danilewsky, A.N., Gräber, H.G., Heldele, R., Mayzel, B., Goebbels, J., Baumbach, T., 2008a. The high resolution synchrotron-based imaging stations at the BAMline (BESSY) and TopoTomo (ANKA). Proc. SPIE. vol. 7078, 70780X-1– 70780X-9. Rack, A., Zabler, S., Müller, B.R., Riesemeier, H., Weidemann, G., Lange, A., Goebbels, J., Hentschel, M., Görner, W., 2008b. High resolution synchrotron-based radiography and tomography using hard X-rays at the BAMline (BESSY II). Nucl. Instr. Meth. Phys. Res. A. 586, 327-344.
Robinson, C., Shore, R.C., Brookes, S.J., Strafford, S., Wood, S.R., Kirkham, J., 2000. The chemistry of enamel caries. Crit. Rev. Oral. Biol. Med. 11, 481–495.
Robinson, C., 2009. Fluoride and the caries lesion: interactions and mechanism of action. Eur. Arch. Paediatr. Dent. 10, 136-140.
Schwass, D.R., Swain, M.V., Purton, D.G., Leichter, J.W., 2009. A System of Calibrating Microtomography for Use in Caries Research. Caries Res. 43, 314-321.
Shellis, R.P., Hallsworth, A.S., 1987. The use of electron microscopy in studying enamel caries. Scanning Microsc. 1, 1109–1123.

1
Silverstone, L.M., Hicks, M.J., Featherstone, M.J., 1988. Dynamic factors affecting lesion initiation and progression in human dental enamel. The dynamics and nature of enamel caries. Quintessenz Int. 19, 683–710.
Stock, S.R., Ignatiev, K.I., Dahl, T., Veis, A., De Carlo, F., 2003. Three-dimensional microarchitecture of the plates (primary, secondary, and carinar process) in the developing tooth of Lytechinus variegatus revealed by synchrotron X-ray absorption microtomography (microCT). J. Struct. Biol. 144, 282–300.
Stock, S.R., 2008. MicroComputed Tomography: Methodology and Applications. CRC Press. London, New York, Boca Raton.
Tanaka, R., Shibata, Y., Manabe, A., Miyazaki, T., 2010. Micro-structural integrity of dental enamel subjected to two tooth whitening regimes. Arch. Oral Biol. 55, 300-8.
Zabler, S., Cloetens, P., Zaslansky, P., 2007. Fresnel-propagated submicrometer x-ray imaging of water-immersed tooth dentin. Optics Lett. 32, 2987-2989.
Zero, D.T., 1995. In situ caries models. Adv. Dent. Res. 9, 214–230.