Embed Size (px)
Citation preview

1
Experimental Study on the Stability of the Transmission Tower with Hybrid Slab
Foundation
Guanglin Yuan 1, Biao Yang
1, Zhaohui Huang
2,*, Xiaozhe Tan
1
1 State Key Laboratory for Geomechanics & Deep Underground Engineering, School of Mechanics &
Civil Engineering, China University of Mining & Technology, Xuzhou, Jiangsu 221116, China.
2 Department of Civil and Environmental Engineering, College of Engineering, Design and Physical
Science, Brunel University, Uxbridge, Middlesex, UB8 3PH, U.K.
Abstract
In this paper, a 1:5 scaled tower model for a typical 220 kV single-circuit power transmission
tower with hybrid slab foundation has been designed and tested. The scaled tower model was
tested under the movement of horizontal ground surface stretching with normal working
loading conditions. One of the main objectives of this research is to investigate the stability of
the power transmission tower subjected to horizontal ground movement by using hybrid slab
foundation. The deformations of the tested tower model and stresses and strains within the
different structural members of the tower and the reinforced concrete slab of the foundation
have been fully measured. A large mount comprehensive test data has been generated. The
research clearly indicated that compared to the isolated tower leg’s foundation the proposed
hybrid slab foundation has very good resistance, in terms of truss members’ deformations and
stresses, to the ground movement.
Keywords:Power transmission tower; hybrid slab foundation; ground movements; scaled
tower model.
* Corresponding author, Email: [email protected]

2
Highlights:
Conduct a test on the 1:5 scaled tower model of 220 kV power transmission tower
with hybrid slab foundation;
Investigate the stability of the tower subjected to horizontal ground surface motion;
Generates a series of valuable test data on the behaviour of the tower;
Compare the behaviour of the scaled tower model with different type foundations.

3
1. Introduction
In recent years, with increasing power demands, the safety of the power transmission line is
vital important. Hence, the structural behaviour of transmission towers subjected to different
loading and environmental conditions is an important research area which attracts many
researchers [1-6]. In some countries, such as China, many transmission towers have to pass
across coal mining areas, where ground surface cracking, subsidence, non-uniform settlement,
etc. have caused partial or overall damage of many transmission towers [7-9]. The
construction of ultra-high-voltage transmission systems requires even higher reliability of
transmission towers.
Bruhn et al. [10] have studied the structural behaviour of lattice steel transmission tower
under the ground surface’s motion in the mining areas. Sun [11] proposed a composite
reinforced concrete slab foundation to enhance the resistance of the transmission towers on
the ground deformations. Li et al. [12] have analysed the structural responses of transmission
towers under coupled actions between the tower and the transmission wires using FE method.
Based on FE analysis, Yang et al. [13] suggested that the resistance of transmission towers on
ground deformation could be increased considerably by using large scale flat-slab foundation.
Shu et al. [14] have proposed a method for determining the thickness of the slab foundation
based on a series of FE analyses. Yuan et al. [15] conducted an experimental test on a 500 kV
self-supporting transmission tower to study the structural behaviour of the tower subjected to
the stretching and compressing of the tower’s supports. Moon et al. [16] conducted an
experiment on a half-scaled sub-structure of transmission tower to investigate the failure
mode of the tower under wind load. Prasad Rao et al. [17-18] have carried out a series of
full-scale tests on the transmission towers to study the early failure modes of the towers and
the causes of failure. Also they have conducted a series of numerical analyses on the
transmission towers using software NE-Nastran. The numerical results have been compared
with the calculations from different design codes.
As mentioned above, the majority of the studies conducted on the behaviour of transmission
tower subjected to ground deformations were mainly focused on FE numerical analysis. Very

4
limited researches have been done to experimentally investigate the impact of ground surface
deformations on the structural stability of transmission towers. Therefore, the main objectives
of this research are:
Conduct a large-scale test on a 1:5 scaled sub-structure tower model for a typical 220
kV transmission tower with hybrid slab foundation for the first time. The test
simulates the horizontal motion of ground surface.
Investigate the stability of the 220 kV power transmission tower subjected to
horizontal ground surface motion by adopting the newly proposed hybrid slab
foundation. The test generates a series of valuable data on the behaviour of the tower,
stress and strain states within the structural members and foundation of the tower. The
test data can be used to validate numerical models developed by the follow research in
the field.
Compare the behaviour of the scaled tower model with different type foundations of
the transmission tower, and assess the tower’s resistance to the ground movements by
employing hybrid slab foundation.
2. Design of Experiment
The influences of the ground surface deformations, such as the ground surface level
movement, horizontal tensile and compression deformations, and the tilting, etc., on the
behaviour of the transmission tower in mining area are very complex. To design a large-scale
test on the transmission tower which can consider the influence of tensile force of the
conductors and ground-wire subjected to ground motion is very complicate and difficult. Due
to the limitation of current structural lab’s conditions in this research only self-weights of the
tower and conductors and ground-wire were considered. Therefore the shift in tower center of
gravity due to horizontal ground movement was negligible under only vertical loading
conditions. This has been proved by previous test [19]. The more feasible way to investigate
the behaviour of transmission tower under real loading conditions is to use FE analysis which
needs to be validated under more simple loading conditions by using available test data.
Therefore, in this research a typical 1:5 scale tower model, which represent the bottom part of
a real 220 kV power transmission tower, was tested. The self-weights of the upper structure

5
components including the conductors and ground-wire were considered. All loads were
applied to the corresponding nodes on the top of the test tower model. Hence, the influence of
tensile forces within the conductor and ground wire were ignored in the test.
2.1. Test-rig for generating ground motion
Based on the current laboratory conditions it is very difficult and complex to simulate a real
ground movement for a full scaled original tower. Previous research [19] indicated that most
significant impact on the behaviour of the tower is the ground horizontal movement. Hence,
this research focused on this kind of ground movement conditions. Other ground movement
conditions will be investigated in next phase of research by using FE modelling.
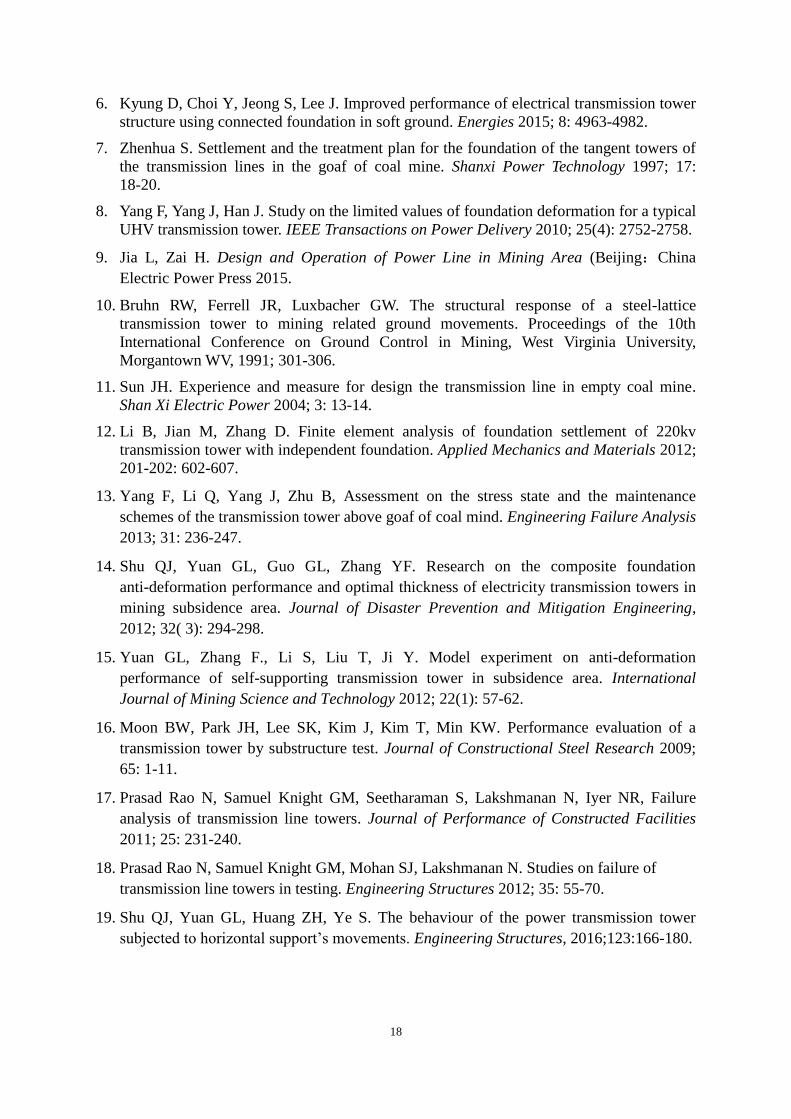
Fig. 1 shows a large-scale test rig which has been specially designed and constructed for
simulating the horizontal motion of the ground surface. As shown in Fig. 1a, the test rig
consists of two parts, a fixed box (bolted to the strong ground floor) and a movable box
(equipped with rollers on the bottom). Two jacks were installed with reaction frame at two
sides of the movable box which propel the movable box apart from the fixed box for
simulating the horizontal ground motion.
2.2. Design of the scaled tower model
The prototype of the scaled tower model is a typical 220 kV power transmission tower. As
shown in Fig. 2, the overall height of the tower is 46.3 m, the nominal height is 38 m. The
dimensions of the tower at the support level for both along and perpendicular to the power
line direction are both 7.845 m.
Considering the structural lab’s test conditions, only the lower part of the tower (within the
rectangular dash line, as shown in Fig. 2) was selected as the prototype of the scaled tower
model. In order to represent the stiffness provided by the upper part of the whole tower
structure to the scaled tower model, the additional horizontal diaphragms were added to the
scaled tower model. Based on a series FE analyses by using the finite element software
ANSYS for both real tower and scaled tower model, It was reasonable to select the steel bar
member with the cross-section of L18 x 1.4 on the top of scaled tower model as additional
diaphragms to simulate the stiffness provided by the upper part of the tower which was not
included in the tested tower. The mass of the upper part of the original tower was considered
in the test loading condition.

6
In order to design scaled tower model, the same steel material of the real tower was used for
the scale tower model. So the design of the scale tower model was based on the geometric
shrinkage ratio. The scaled tower model was reduced to 1:5 compared to the real tower.
Hence, the cross-section area of steel bar members of the scale tower model was 1/25 of the
original one. For calculating the loads applied to the scale tower model it is assumed that the
axial stress of the steel bar members was the same compared to the real tower. As a result, the
slenderness ratios of the steel bar members for the scaled tower model was the same as the
original tower. This was validated by FE analyses for both scaled and real tower model.
In the actual engineering design, it is always to adopt the principle of strong joint with weak
structural member to prevent the failure of joint before the failure of the members. Hence, in
order to prevent the joints’ failure in this experiment, 8.8 high strength bolt was used to
replace 5.6 ordinary bolt of original tower. The details of the scaled tower model are shown in
Fig. 3.
The legs of the scaled tower model were made of hot-rolled equal angle steel. Other truss
members were made of cold worked angle steel. Table 1 lists the cross sectional properties of
the whole tower and the scaled tower model. In order to avoid shear failure of the bolts, the
high strength bolts M3 and M4 of Grade 8.8 were used. The tightening moments were 0.6
N·m for M3 and 2.0 N·m for M4, respectively. The scaled tower model was fabricated by the
State Grid Jiangsu Huadian Steel Tower Manufacturing Co. Ltd.
2.3. Validation of the scaled tower model
In order to make sure that the scaled tower model can reasonably represent the behaviour of
the whole tower subjected to the horizontal ground movements, both the whole tower and
scaled tower model were modelled using ANSYS, respectively. The comparisons of
deformations for the whole tower and scaled tower model under horizontal stretching of the
supports, along the direction perpendicular to the power line, are presented in Figs. 4a and 4b.
In the figure the different colours in the horizontal legend represent the magnitudes of axial
stresses within the structural members. It is evident that the deformations in both cases are
agreed reasonably well.
Based on the similarity law, the results obtained from the modelling of the scaled tower
model can be converted into the data which can be used to compare with the results obtained

7
from the modelling of the whole tower. Fig. 5 shows the comparison of the predicted forces
in different members (see Fig. 11 for the members’ positions) between the whole tower and
scaled tower model. It can be seen that the axial forces in the tower’s legs, horizontal
diaphragms, diagonal trusses are reasonable agreed each other. However the axial forces in
the cross bracing members (AX1 and AX3) have some discrepancies, especially at support
displacement around 600 mm. This is mainly due to the size of the tower legs’ member was
not exactly reduced to 1/5 of real tower leg’s member. The support’s reaction forces differ at
initial stage, but have the same trend. The possible reason to explain it is that the loads
applied on the whole tower were more evenly distributed, compared to scaled test tower
model in which the concentrated loads were applied. However, in the later stage, the
stretching of the supports becomes dominant, leading to similar force-displacement curve.
Based on the validations presented above it can be concluded that the scaled tower model
used can reasonably represent the behaviour of the whole tower. The boundary conditions
designed in the test can reasonably simulate the real situation.
2.4. Design of hybrid slab foundation for the scaled tower model
The slab foundation for real whole tower was designed according to Chinese code. In Chinese
code the main design criteria for slab foundation is the minimum reinforcement ratio. Hence,
the reinforcement ratio of the scaled slab foundation was designed to be above the code
requirement. The prototype of the hybrid slab foundation is an integrated reinforced concrete
slab casted in-situ under the bottom of four isolated tower leg’s foundations. The size of the
slab is 11645 mm by 11645 mm (with a 4045 mm by 4045 mm opening at the middle). The
slab is 400 mm thick. A 100 mm thick pebble and sand bedding is paved as a slip layer
between the concrete slab and each of the isolated tower leg’s foundations.
The same concrete and steel reinforcement materials were used for the foundation of the
scaled tower model. As shown in Fig. 6a, the size of the foundation for the scaled tower
model was reduced to 1:5. The size of the scaled hybrid slab foundation model was 2321 mm
by 2321 mm, with a 801 mm by 801 mm opening at the centre and the slab’s thickness of 80
mm. The size of the slip layer for each isolated tower leg’s foundation (called isolated

8
foundation in the rest of the paper) is 600 mm×600 mm with 20 mm thickness and material of
medium size sand. The reinforcement used in the RC slab was determined based on the same
reinforcement ratio compared to the original foundation. Hence, Ø6 steel bar with the bar
spacing of 250 mm was used. The yield strength and the ultimate strength of the
reinforcement are 339.2 MPa and 482.1 MPa, respectively. The slab and the isolated
foundations were casted using grade C20 concrete, in which the 28 day cubic compressive
strength is 23.7 MPa. The details of the isolated foundation are showed in Fig. 6b.
2.5. Fabrication of the hybrid slab foundation model
For this test, only the horizontal ground movement was considered. The impact of the ground
vertical movement was not investigated. To avoid the moving of the ground boxes during the
filling of soil, the fixed box and the movable box were tied together via bolts (see Fig. 1a).
There were two steps for the soil filling process. The first step was to fill and compact the soil
up to 600 mm thick as the bottom part, which was done by filling 200 mm thick and then
compacting to 150 mm thick layer by layer. The compactness coefficient was 0.91. The
measured compact soil properties are as follows:
Cohesive strength: 33 kPa;
Angle of internal friction: 17°;
Moisture content (by weight): 23.2%;
Density: 1960 kg/m3
After the bottom part was ready, 10 mm thick bedding cushion using M15 cement mortar was
paved on the top, then the RC slab was casted on the top of them. When the RC slab was
harden, the 20 mm thick slip layer was paved around the positions of four isolated
foundations. After that four isolated reinforced concrete foundations were casted on the top of
the slip layer.
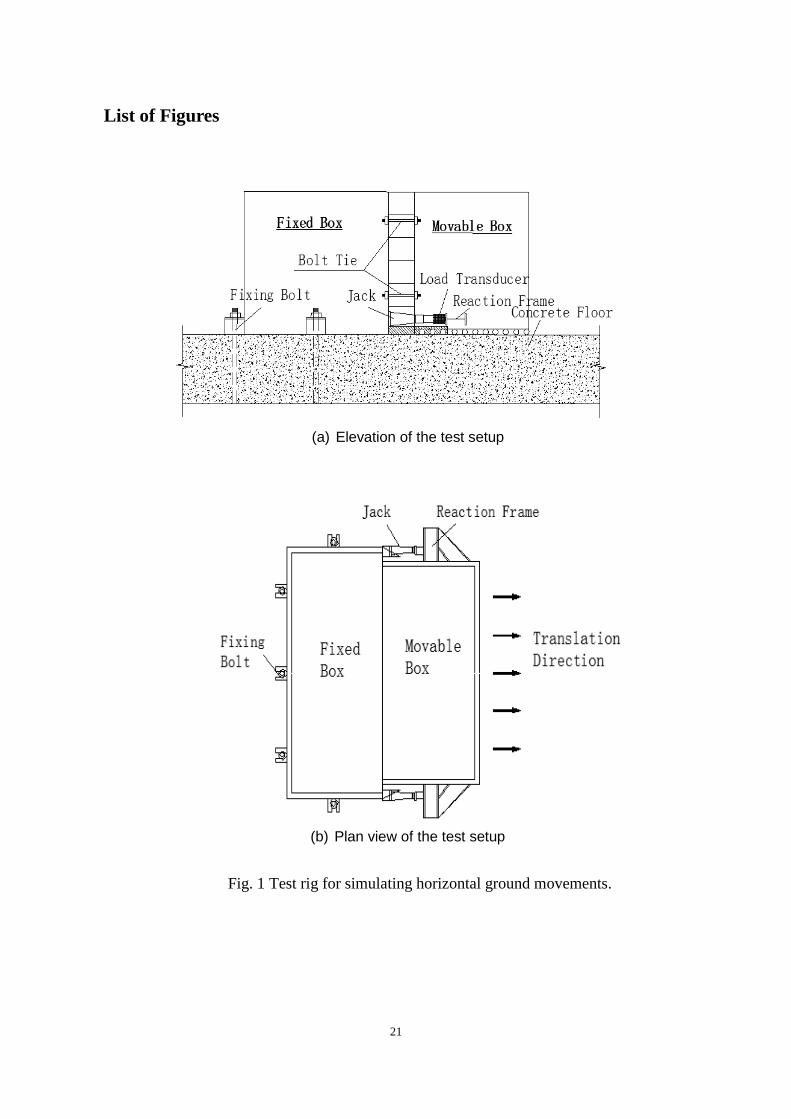
Before constructing the isolated RC foundations, the positions of the four isolated
foundations were located first. Then colligating steel bars, and burying transmission tower
anchor bolts, putting formworks, pouring concrete were carried out. After 7 days’ basic

9
maintenance the formworks were dismantled (see Fig. 7).
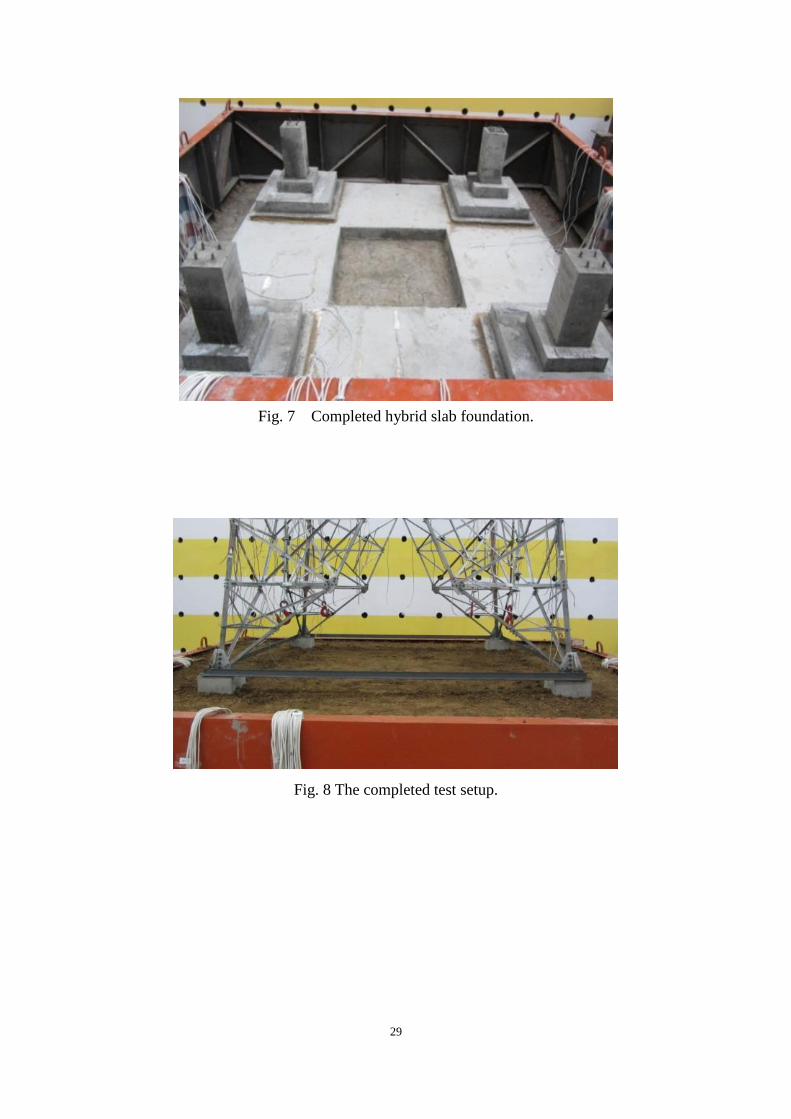
For connecting the scaled tower onto the foundation, the bottom of the scaled tower legs was
welded on the tower foot boots plates which were bolted with the bolts embedded in the
foundation. The joints of the steel truss members of the tower were bolted using 8.8 M3 and
M4 high strength bolt. After 4 isolated RC foundations were completed, the upper layer soil
was filled into the ground boxes. In order to prevent the difficulty for the installation of the
scaled tower model on the isolated foundations, the scaled tower model was lifted to the right
positions and fixed with the tower anchor bolts before casting concrete. The completed test
setup is showed in Fig. 8.
2.6. Material properties of the scaled tower model
The tested material properties of the angle steel used for the scaled tower model are given in
Table 2.
3. Loading and Measuring
3.1. Loading scheme
Under real working condition, the imposed loads acting on the transmission tower are wind,
ice and earthquake. And the dead loads are self-weights of wire and the tower itself. Normally,
the tower is working under the condition of 15 ℃ with no wind and no ice, which is the
condition assumed in this study. The design loads used are given in Table 3, which are based
on the recommendations from the handbook of “Typical Designs of Transmission and
Transformation Engineering of State Grid – 220 kV Transmission Line”. The actual vertical
loads on the scaled tower model were calculated according to the loads of the prototype of
whole tower multiplied by a constant determined using the similar law.
Vertical loads were applied using equivalent weights hanging at the four top corners of the
scaled tower model. The vertical load at each corner was 160 kg. As shown in Fig. 1, the
Jacks were mounted onto fixed box and used to push the moveable box horizontally moving
apart from the fixed box (in the direction perpendicular to the power line). The displacement
loading was applied step by step to simulate the horizontal ground surface movements. For
each loading step 1 mm displacement was applied.

10
3.2. Measuring scheme
In order to assess the stresses within the foundation RC slab, strain gauges were used to
measure the strains within the steel reinforcing bars (see Fig. 9) and on the surface of the slab
(see Fig. 10). Also strain gauges were used to measure the strains in the truss members of the
scaled tower model. The arrangement of the strain gauges is illustrated in Fig. 11. The black
filled dots along the tower’s legs (see Fig. 11) mean that there are three strains gauges fixed at
that position. Two of them fixed at each external surface of the angle member, and another
one fixed at one internal surface of the angle member. All three strains gauges were orientated
in the axial direction of the angle member for measuring the axial force and bending moment
in the tower’s legs. For the partial black filled dots, they represent only two strain gauges are
used. They were attached at each external surface of the angle member and orientated in the
axial direction of the angle member for measuring the axial force. For the no black filled dots,
they mean only one strain gauge is used, which was attached at one external surface of the
angle members and orientated in the axial direction of the angle members for measuring the
axial force.
Three YHD-200 displacement meters were arranged on the each top surface of the isolated
foundations to record vertical and horizontal (along and normal to the power line direction)
displacements. Four YHD-200 displacement meters were mounted on the movable box to
monitor each displacement loading step. Two DH801-750 guyed displacement meters were
used to measure the horizontal displacements at the top of the scaled tower model in the
directions along and perpendicular to the power line.
4. Test Procedure and Observations
4.1. Test procedure
The test was carried out in the structural lab at China University of Mining & Technology
(CUMT). The testing procedure is as follows:
(1) Setting up the scaled tower model on the test platform, calibrating the elevation of
each supports;
(2) Mounting jacks, strain gauges, displacement meters and data acquisition equipment;
11
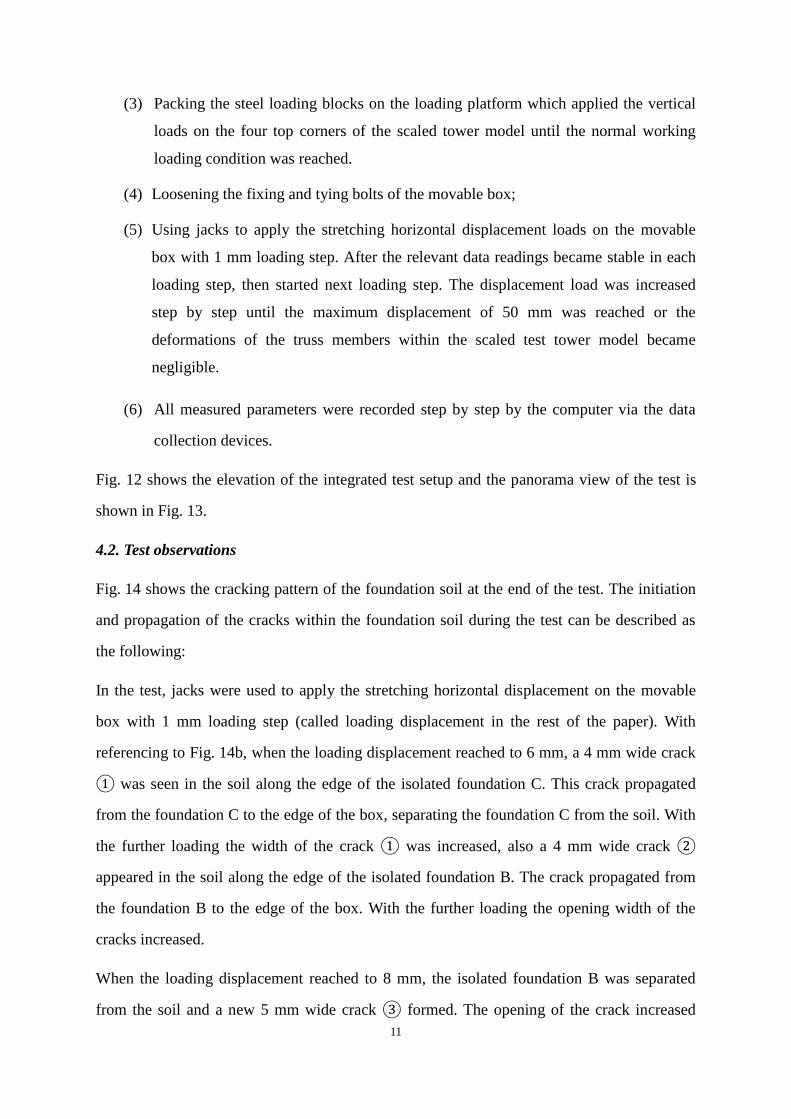
(3) Packing the steel loading blocks on the loading platform which applied the vertical
loads on the four top corners of the scaled tower model until the normal working
loading condition was reached.
(4) Loosening the fixing and tying bolts of the movable box;
(5) Using jacks to apply the stretching horizontal displacement loads on the movable
box with 1 mm loading step. After the relevant data readings became stable in each
loading step, then started next loading step. The displacement load was increased
step by step until the maximum displacement of 50 mm was reached or the
deformations of the truss members within the scaled test tower model became
negligible.
(6) All measured parameters were recorded step by step by the computer via the data
collection devices.
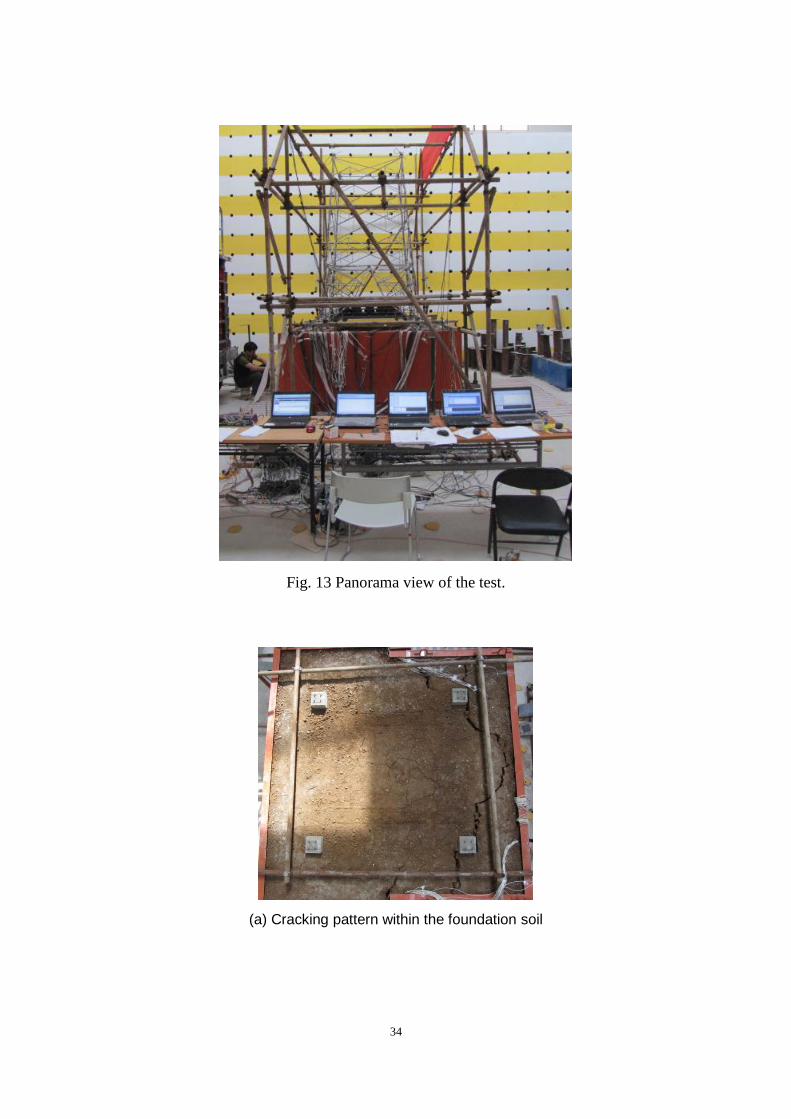
Fig. 12 shows the elevation of the integrated test setup and the panorama view of the test is
shown in Fig. 13.
4.2. Test observations
Fig. 14 shows the cracking pattern of the foundation soil at the end of the test. The initiation
and propagation of the cracks within the foundation soil during the test can be described as
the following:
In the test, jacks were used to apply the stretching horizontal displacement on the movable
box with 1 mm loading step (called loading displacement in the rest of the paper). With
referencing to Fig. 14b, when the loading displacement reached to 6 mm, a 4 mm wide crack
① was seen in the soil along the edge of the isolated foundation C. This crack propagated
from the foundation C to the edge of the box, separating the foundation C from the soil. With
the further loading the width of the crack ① was increased, also a 4 mm wide crack ②
appeared in the soil along the edge of the isolated foundation B. The crack propagated from
the foundation B to the edge of the box. With the further loading the opening width of the
cracks increased.
When the loading displacement reached to 8 mm, the isolated foundation B was separated
from the soil and a new 5 mm wide crack ③ formed. The opening of the crack increased

12
with the displacement. With a further loading, a 3 mm wide crack ④ appeared near the
isolated foundation A, but the opening of the crack did not increase with the subsequent
loading.
When the loading displacement reached to 11 mm, near the juncture of the two boxes,
adjacent to the jack 2, a 3 mm wide diagonal crack ⑤ formed. With the further loading the
opening of the crack was widened and the crack propagated towards the isolated foundation
C. Meanwhile, the crack ③ propagated towards foundation C, and a crack ⑥ was formed
and propagated towards the isolated foundation B. The openings of cracks ③ and ⑥ were
increased with the further loading. When the loading displacement reached to 15 mm, the
crack ⑤ reached to the isolated foundation C.
When the loading displacement reached to 14 mm, a tiny crack ⑦ appeared between the
isolated supports A and B and the crack ⑥ near the isolated support C propagated diagonally.
When the loading displacement reached to 17 mm, the crack ③ near the isolated support B
diverted diagonally. When the loading displacement reached to 19 mm, a new diagonal crack
⑧ formed and joined with the crack ⑥. When the loading displacement reached to 24 mm,
a diagonal crack ⑨ near the isolated support B formed and merged with the crack ③. When
the loading displacement reached to 31 mm the cracks ⑧ and ⑨ between the isolated
supports B and C merged. After this point, no new cracks formed with further loading but the
openings of the cracks between the isolated supports B and C were increased.
It was observed that there were very little deformations of all members of the scaled tower
model above the isolated foundations during the test. The relative movements of the isolated
foundations were very small. The damage pattern of the soil at the foundation after test is
shown in Fig. 14. It can be seen from Figs. 14a and 14b that the cracks are along the edges of
the isolated foundations. From Figs. 14c and 14d, it is clear that the cracking of soil started
along the juncture between the two boxes. However, due to the foundation RC slab under the
four isolated foundations, the crack could not propagate upwards through the RC slab, but to
propagate along the edge of the slab. The cracking underneath the RC slab basically follows
the pattern showed in Fig. 14c. After the test, the overlying soil was removed from the
foundation RC slab for observation. There were no any cracks found in the foundation RC
slab. This suggests that under the ground horizontal deformation, the foundation RC slab

13
significantly reduced the impacts of ground movement on the isolated four independent
foundations of the tower.
5. Analysis of Test Results
5.1. Horizontal displacements of the scaled tower’s supports
Fig. 15 shows the horizontal displacements of the scaled tower’s supports along loading
displacement direction. It can be seen that the maximum displacement of the supports was
less than 2.5 mm. This indicates that the foundation RC slab which was underneath of the
isolated foundations can effectively minimize the influence of deformation of the ground on
the supports of the scaled tower model. When the loading displacement was beyond 10 mm,
the displacements of the supports B and C were almost no change. For the supports A and D,
their displacements were decreased after the loading displacement was greater than 8 mm.
This is due to the cracking happened within the soil around the isolated foundations. Hence,
the influence of the foundation soil on the isolated foundations became weaker and weaker.
Consequently, the impact of the ground movement on the supports of the scaled tower was
very limited due to the hybrid slab foundation used in this study.
The reason for the displacements of the supports A and D reduced after the loading
displacement was greater than 8 mm is due to the soil in the fixed box sprang back after
cracking formed near the juncture of the two boxes (see Fig. 14d) which dragged the supports
A and D backward. When the loading displacement reached beyond 15 mm, the
displacements of the supports A and D stabilized at 0.25 mm and the displacements of the
supports B and C stabilized at 2.2 mm, respectively. This means that the further displacement
loading has little influence on the supports of the scaled tower model and the tower structures
above the supports. Therefore, the use of hybrid slab foundation proposed in this research can
effectively minimize the effect of the ground movements on the structural behaviour and
stability of the transmission tower.
5.2. Subsiding at supports and horizontal displacement at the top of the scaled tower model
Fig.16 shows the vertical subsidence of the supports against the loading displacement. It can
be seen that the vertical displacements of the supports B and C are very similar with the

14
maximum displacement of 2.4 mm. The vertical displacements of the supports A and D are
almost same with the maximum displacement of 0.35 mm. The difference between supports
A-D and B-C indicates the non-uniform subsidence of the supports. This was mainly caused
by the cracking of foundation soil. However, overall the vertical subsidence of the supports
was very small and the influence on the structural behaviour of the scaled tower model
should be negligible.
Fig. 17 shows the horizontal displacements along the direction of the loading displacement at
four top corners of the scaled tower model. It can be seen that maximum displacements of 5.5
mm and 5.0 mm appeared at the tops of the tower’s legs 1 and 2 and the tower’s legs 3 and 4,
respectively. The difference of the horizontal displacements between the top and the supports
of the scaled tower model was mainly due to the non-uniform vertical subsidence of the
supports. The test results indicated that there were no obvious deformations happened within
the members of the scaled tower model. Hence, the impact of horizontal ground motions on
the scaled tower model with hybrid slab foundation proposed in this research is insignificant.
5.3. Stresses in the RC slab
Due to the interaction between the foundation RC slab and soil, the stresses developed within
the RC slab were caused by the loading displacement. Fig. 18 shows the tensile stresses
developed in the reinforcing steel bars along the loading displacement direction at the
positions of SB-2-3 (top layer) and XB-2-3 (bottom layer) which was 1155 mm away from
the edge of the RC slab within the fixed box (see Fig. 9). The maximum tensile stresses were
about 120 MPa at the bottom layer, and 100 MPa at the top layer, respectively.
Fig. 19 shows the compressive stresses developed in the reinforcing steel bars normal to the
loading displacement direction at the positions of SB-2-2 (top layer) and XB-2-2 (bottom
layer) which was 385 mm away from the edge of the RC slab within the fixed box (see
Fig. 9). The maximum compressive stresses were about 74 MPa at the top layer, and 35 MPa
at the bottom layer, respectively.
From Figs. 18 and 19 it can be seen that the stresses of top and bottom layers were changed
considerably different at the loading displacement of 25 mm. This is due to a major crack

15
formed under the RC slab at the positions of the strain gages (see Fig. 14). This resulted the
loading condition on the RC slab changed and the RC slab was subjected to certain degree of
bending at the positions of the strain gages.
It is evident that the stresses in the reinforcing steel bars were all well below the yield
strength. This confirms that reinforcement ratio used for the foundation RC slab is adequate
and the slab has had enough strength for resisting the ground motions.
6. Comparison of Resistances to Ground Deformation for Two Type Foundations
Yuan et al. [19] have conducted a test on the transmission tower with isolated leg’s
foundation subjected to ground movements. In order to assess the ground deformation
resistance for different type foundations the results generated from that research are used to
compare the test data obtained from this research. Fig. 20 shows the comparison of failure
mode of the scaled tower model with isolated foundations against the maximum deformed
profile of the scaled tower with hybrid slab foundation. It can be seen from Fig. 20(b) that the
deformations of the scaled tower with hybrid slab foundation were small.
6.1. Support’s displacements
According to the test results presented by Yuan et al. [19] and current research the
displacements of the supports A and D within the fixed box are very small and can be
neglected. Therefore, here only the displacements of the supports B and C within the movable
box are considered for the comparison (see Fig. 1b and Fig. 11e for the positions).
Fig. 21 shows the horizontal displacement of the supports B and C with different type
foundations against the loading displacement. It can be seen that the displacements of the
supports B and C with the hybrid slab foundation used in this research are about 2 mm.
However, the displacements of the supports B and C with the isolated foundation used by
Yuan et al. [19] are linearly increased with the loading displacement. It can be seen that for
the case with isolated foundation the displacements of the supports B and C are almost to
equal the loading displacement. This indicates that the isolated foundation has very little
resistance to ground deformation. For the hybrid slab foundation used in this research the
maximum displacements of the supports B and C were less than 2.0 mm. Hence, the hybrid

16
slab foundation proposed in this research has very good resistance to the ground movement
and the impact due to the ground movement on the structural behaviour of the transmission
tower can be significantly reduced.
6.2. Stresses within the structural members of the scaled tower model
The comparison of the axial stresses within the scaled tower model’s legs at the positions L14,
L24, L34 and L44 (see Fig. 11 for the locations) for the two type foundations is shown in
Fig. 22. It can be seen that for the case with isolated foundation the axial stresses of the
tower’s legs increase linearly with the loading displacement. When the loading displacement
reached to 50 mm the maximum stress was around 290 MPa. In contrast, the case with the
hybrid slab foundation, very little stresses within the tower’s legs were generated by the
loading displacement.
Fig. 23 shows the axial stresses of the first cross bracing members AX1 and CX1 (see Fig. 11
for the members’ positions) against the loading displacement for the two type foundations.
Again the magnitude of the stresses in the members AX1 and CX1 for the isolated foundation
is significantly greater than the one with the hybrid slab foundation.
The results presented above further confirm that the hybrid slab foundation proposed in this
research has superior capability to insulate the impact of the ground movement on the
structure of the tower above the supports. However, the isolated foundation has very little
resistance to the ground movement. Therefore the impact of the ground movement on the
tower structures above the supports is very significant if the isolated foundation is employed.
7. Conclusions
It is well known that the influences of the ground surface deformations on the behaviour of
the transmission tower in mining area are very complex. At present the majority of the studies
conducted for investigating the behaviour of transmission tower subjected to ground
deformations were mainly focused on FE numerical analysis. Very limited researches have
been done to experimentally investigate the impact of ground surface deformations on the
structural stability of the transmission towers. In this paper a 1:5 scaled tower model for a
typical 220 kV single-circuit self-supporting transmission tower with hybrid slab foundation

17
was designed and fabricated. The scaled tower model was tested subjected to the horizontal
ground surface movements under the only gravity loading condition. The research first time
to experimentally investigate the influence of different tower leg’s foundation on the
resistance of horizontal ground motion. The research generated valuable test data which can
be used for the validation of FE numerical models. Then the validated FE models will be
adopted to analyse the real transmission towers subjected to ground motion under more
complex loading condition. The validation of developed FE model and a series of
comprehensive parametric studies by using the validated FE model on the behaviours of the
transmission tower under different ground movements and foundations will be published in
another paper. Compared to the isolated tower leg’s foundation the proposed hybrid slab
foundation has very good resistance to the ground movement. The impact of ground
movements on the tower structures above the supports can be significantly reduced by using
this kind of foundation. It is therefore suggested that the hybrid slab foundation proposed in
this research can be used for the transmission tower in the mining areas with significant
ground deformations.
Acknowledgement
This research was supported by the science and technology projects of China's State Grid
Company (Grant No. SGSXYQ00XTJS-(2015)-215). The authors gratefully appreciate this
support.
References
1. Battista RC, Rodrigues RS, Pfeil MS. Dynamic behavior and stability of transmission line
towers under wind forces. Journal of Wind Engineering and Industrial Aerodynamics
2003; 91: 1051–1067.
2. Kudzys A. Safety of power transmission line structures under wind and ice storms.
Engineering Structures 2006; 28: 682–689.
3. Savory E, Parke GAR, Disney P, Toy N. Wind-induced transmission tower foundation
loads: A field study-design code comparison, Journal of Wind Engineering and Industrial
Aerodynamics 2008; 96: 1103–1110.
4. Albermani F, Kitipornchai S, Chan RWK. Failure analysis of transmission towers.
Engineering Failure Analysis 2009; 16: 1922–1928.
5. Hamada A, El Damatty AA. Behaviour of guyed transmission line structures under
tornado wind loading. Computers and Structures 2011; 89: 986–1003.
18
6. Kyung D, Choi Y, Jeong S, Lee J. Improved performance of electrical transmission tower
structure using connected foundation in soft ground. Energies 2015; 8: 4963-4982.
7. Zhenhua S. Settlement and the treatment plan for the foundation of the tangent towers of
the transmission lines in the goaf of coal mine. Shanxi Power Technology 1997; 17:
18-20.
8. Yang F, Yang J, Han J. Study on the limited values of foundation deformation for a typical
UHV transmission tower. IEEE Transactions on Power Delivery 2010; 25(4): 2752-2758.
9. Jia L, Zai H. Design and Operation of Power Line in Mining Area (Beijing:China
Electric Power Press 2015.
10. Bruhn RW, Ferrell JR, Luxbacher GW. The structural response of a steel-lattice
transmission tower to mining related ground movements. Proceedings of the 10th
International Conference on Ground Control in Mining, West Virginia University,
Morgantown WV, 1991; 301-306.
11. Sun JH. Experience and measure for design the transmission line in empty coal mine.
Shan Xi Electric Power 2004; 3: 13-14.
12. Li B, Jian M, Zhang D. Finite element analysis of foundation settlement of 220kv
transmission tower with independent foundation. Applied Mechanics and Materials 2012;
201-202: 602-607.
13. Yang F, Li Q, Yang J, Zhu B, Assessment on the stress state and the maintenance
schemes of the transmission tower above goaf of coal mind. Engineering Failure Analysis
2013; 31: 236-247.
14. Shu QJ, Yuan GL, Guo GL, Zhang YF. Research on the composite foundation
anti-deformation performance and optimal thickness of electricity transmission towers in
mining subsidence area. Journal of Disaster Prevention and Mitigation Engineering,
2012; 32( 3): 294-298.
15. Yuan GL, Zhang F., Li S, Liu T, Ji Y. Model experiment on anti-deformation
performance of self-supporting transmission tower in subsidence area. International
Journal of Mining Science and Technology 2012; 22(1): 57-62.
16. Moon BW, Park JH, Lee SK, Kim J, Kim T, Min KW. Performance evaluation of a
transmission tower by substructure test. Journal of Constructional Steel Research 2009;
65: 1-11.
17. Prasad Rao N, Samuel Knight GM, Seetharaman S, Lakshmanan N, Iyer NR, Failure
analysis of transmission line towers. Journal of Performance of Constructed Facilities
2011; 25: 231-240.
18. Prasad Rao N, Samuel Knight GM, Mohan SJ, Lakshmanan N. Studies on failure of
transmission line towers in testing. Engineering Structures 2012; 35: 55-70.
19. Shu QJ, Yuan GL, Huang ZH, Ye S. The behaviour of the power transmission tower
subjected to horizontal support’s movements. Engineering Structures, 2016;123:166-180.

19
List of Tables and Figures
Table 1 The sectional properties of the members for the whole tower and scaled tower
model.
Table 2 Measured yield strength of angle steel (MPa).
Table 3 Wire loads under normal working condition.
Fig. 1 Test rig for simulating horizontal ground movements.
Fig. 2 The prototype of the 220 kV transmission tower used (all dimensions in mm).
Fig. 3 Details of the 1:5 scaled tower model (all dimensions in mm).
Fig. 4 Deformed diagrams of: (a) the sub-structure of whole tower analysed; (b) the
scaled tower model (magnified by 5 times).
Fig. 5 Comparison of the predicted forces against the support’s displacements between the
whole tower and scaled test tower model.
Fig. 6 Details of the proposed hybrid slab foundation model (all dimensions in mm).
Fig.7 Completed hybrid slab foundation.
Fig. 8 The completed test setup.
Fig. 9 Arrangement of strain gauges attached to the reinforcing steel bars in the foundation
RC slab (SB-top layer; XB-bottom layer).
Fig. 10 Arrangement of strain gauges on the surface of the foundation RC slab.
Fig. 11 Strain gauges arrangement and member’s labels on the scaled tower model.
Fig. 12 Elevation of the integrated test setup.
Fig. 13 Panorama view of the test.
Fig. 14 Cracking pattern within the foundation soil.
Fig. 15 Horizontal support’s displacement against loading displacement.
Fig. 16 Vertical subsidence of the supports against loading displacement.
Fig. 17 Horizontal displacements at the top corners of the scaled tower model against
loading displacement.
Fig. 18 Stresses within the reinforcing steel bars against loading displacement.
Fig. 19 Stresses within the reinforcing steel bars against loading displacement.
Fig. 20 Comparison of failure mode of the scaled tower model with isolated foundations
against the maximum deformed profile of the scaled tower with hybrid slab foundation.
Fig. 21 The horizontal displacements of the supports with different foundations.
Fig. 22 Stresses within the tower legs’ members with different type foundations
(IF = isolated foundation; HSF = hybrid slab foundation).
Fig. 23 The stresses in the first cross bracing members with different type foundations
(IF = isolated foundation; HSF = hybrid slab foundation).

20
List of Tables
Table 1 The sectional properties of the members for the whole tower and scaled tower model.
Member
classification Steel
Whole tower Scaled tower model
Section size
(mm×mm)
Section area
(mm2)
Section size(mm×mm) Section area
(mm2)
Tower’s leg Q345 L140×10 2737 L25×3 143
Horizontal
diaphragm Q235 L90×7 1230 L18×1.5 54
Bracing Q235
L75×5 741 L15×1 30
L70×5 688 L14×1 28
L63×5 614 L13×1 26
Auxilliary
member Q235
L45×4 349 L9×0.8 14.4
L40×4 309 L8×0.8 12.8
L40×3 236 L8×0.8 12.8
Note: The angle of L140x10 is hot rolled, others are cold worked
Table 2 Measured yield strength of angle steel (MPa).
Hot-rolled Angle Steel L25×3 Cold-worked Angle
Steel, 1.5mm thick
Cold-worked Angle
Steel, 1mm thick
Cold-worked Angle
Steel, 0.8mm thick
344 313 336 342
Table 3 Wire loads under normal working condition.
Conductors (N) Ground Wire (N)
Vertical Horizontal Vertical Horizontal
33015 0 10355 0
21
List of Figures
(a) Elevation of the test setup
(b) Plan view of the test setup
Fig. 1 Test rig for simulating horizontal ground movements.

22
7845
5000
3000
6000
6000
6000
6000
4300
1700
4100
4200
38000
8300
7845
100
Selectedsubstructure
Fig. 2 The prototype of the 220 kV transmission tower used (all dimensions in mm).

23
1569
1000
600
600
600
1149
Additional Diaphragm
Cross Bracing
Auxiliary Diagonal Trussof Cross Bracing
Horizontal Diaghram
Leg
Auxiliary DiagonalTruss of Leg
L15×
1.2
L15×
1
L18×1.4
L14×1
L14×1
L15×1
L13×1
L8×0.8
L8×0.8
L13×1
L14×1
L14×1
L13×2
L8×0.8
L8×0.8
L8×
0.6
L9×0.8
L9×0.8
L8×
0.6
L8×0.8
L8×0.8
L8×
0.6
Fig.3 Details of the 1:5 scaled tower model (all dimensions in mm).

24
(a)
(b)
Fig.4 Deformed diagrams of: (a) the sub-structure of whole tower analysed; (b) the
scaled tower model (magnified by 5 times).
Magnitude of average
axial stresses in the
structural members.
Magnitude of average
axial stresses in the
structural members.

25
(a) Axial force in the first bracing member AX1
(b) Axial force in the second bracing member AX3
-25
-20
-15
-10
-5
0
0 200 400 600 800
Axia
l fo
rce
(K
N)
Support's displacement (mm)
Whole tower
Scaled test tower
-4
0
4
8
12
16
0 200 400 600 800
Axia
l fo
rce
s (
KN
)
Support's displacement (mm)
Whole tower
scaled test tower

26
(c) Axial force in the horizontal diaphragm member AW1
(d) Axial force in the diagonal truss member AL1 to the tower’s leg 1
-10
0
10
20
30
40
0 200 400 600 800
Axia
l F
orc
es (
KN
)
Support's displacement (mm)
Whole tower
Scaled test tower
-2
0
2
4
6
8
10
0 200 400 600 800
Axia
l fo
rce
(K
N)
Support's displacement (mm)
Whole tower
Scaled test tower

27
(e) Moment at the position of L24 of the tower’s leg 2
(f) Reaction force at Support B
Fig.5 Comparison of the predicted forces against the support’s displacements
between the whole tower and scaled test tower model.
-50
0
50
100
150
200
250
0 200 400 600 800
Mo
me
nt
(KN
-m)
Support's displacement (mm)
whole tower
Scaled test tower
-6
-3
0
3
6
0 200 400 600 800
Su
pp
ort
's r
eactio
n f
orc
e (
KN
)
Support's displacement (mm)
Whole tower
Scaled test tower

28
20 mm medium size sand
M15 cement mortar
(a) Hybrid slab foundation model
8080
340
460
40
68
140 60 160 60 140
560
4M10
8 8
7 6@708 6 12 6
(b) Isolated foundation model
Fig. 6 Details of the proposed hybrid slab foundation model (all dimensions in mm).
29
Fig. 7 Completed hybrid slab foundation.
Fig. 8 The completed test setup.

30
SB-1-1XB-1-1
SB-1-2XB-1-2
SB-1-3XB-1-3
SB-1-4XB-1-4
SB-2-1XB-2-1
SB-2-2XB-2-2
SB-2-3XB-2-3
SB-2-4XB-2-4
SB-2-5XB-2-5
SB-2-6XB-2-6
SB-2-7XB-2-7
SB-3-1XB-3-1
SB-3-2XB-3-2
SB-3-3XB-3-3
SB-3-4XB-3-4
SB-4-1XB-4-1
SB-4-2XB-4-2
SB-4-3XB-4-3
SB-5-1XB-5-1
SB-5-2XB-5-2
SB-5-3XB-5-3
SB-5-4XB-5-4
SB-5-5XB-5-5
SB-5-6XB-5-6
SB-5-7XB-5-7
Fig. 9 Arrangement of strain gauges attached to the reinforcing steel bars in the foundation
RC slab (SB-top layer; XB-bottom layer).
DB-1 DB-2
DB-5
DB-4DB-3
DB-8
DB-7DB-6
DB-11
DB-10DB-9
DB-22
DB-21DB-20
DB-19
DB-18DB-17
DB-16
DB-15DB-14
DB-27
DB-26DB-25
DB-30
DB-29DB-28
DB-33
DB-32DB-31
DB-23 DB-24
DB-13DB-12
DB-37 DB-38 DB-39
DB-34 DB-35 DB-36
DB-40
DB-41
DB-42
Fig. 10 Arrangement of strain gauges on the surface of the foundation RC slab.

31
Support A
Leg 1
AX5Leg 2
AX6L18-1,2 L28-1,2
AX5-1
AX3
AX4
AX3-1,
2
AX6-1
AX4-1,2AX2 AX1
L17-1,2
L16-1,2,3
L15-1,2,3
L14-1,2,3
L13-1,2,3
L12-1,2,3
L27-1,2
L26-1,2,3
L25-1,2,3
L24-1,2,3
L23-1,2,3
L22-1,2,3
AX1-1,
2 AX2-1,2
AW1-1,2 AW2-1,2
AL1 AL2
Support B
AF1
(a) Measuring positions and labels in Plane A-B
Leg 2 Leg 3BX5
BX6
BX3
BX4
BX2 BX1
BX-5-1
BX-3-1
,2
BX-1-1
,2 BX-2-1,2
BW1-1,2 BW1-1,2
BL1 BL2
Support B Support C
(b) Measuring positions and labels in Plane B-C

32
Leg 3
CX5Leg 4
CX6L38-1,2 L48-1,2
CX5-1
CX3
CX4
CX3-1
CX6-1
CX4-1CX2 CX1
L37-1,2
L36-1,2,3
L35-1,2,3
L34-1,2,3
L33-1,2,3
L31-1,2,3
L47-1,2
L46-1,2,3
L45-1,2,3
L44-1,2,3
L43-1,2,3
L41-1,2,3
CX1-1,
2 CX4-1,2
CW1-1,2 CW2-1,2
L32-1,2,3 L42-1,2,3
CL1 CL2
Support C Support D
CF2
CF1
(c) Measuring positions and labels in Plane C-D
L e g 4 L e g 1D X 5
D X 6
D X 3
D X 4
D X 2 D X 1
D X - 4 - 1
D X - 3 - 1
D X - 1 - 1 , 2
D X - 2 - 1 , 2D W 1 - 1 , 2 D W 1 - 1 , 2
DL1
DL2
S u p p o r t D S u p p o r t A
(d) Measuring positions and labels in Plane D-A

33
Leg 4 Leg 3
Leg 1 Leg 2
CH-N-2 CH-N-1
DH-N-1 BH-N-2
DH-N-2
AH-N-1 AH-N-2
BH-N-1
Support A
Support B
Support CSupport D
(e) Measuring positions and labels in horizontal diaphragms
Fig. 11 Strain gauges arrangement and member’s labels on the scaled tower model.
Fixing bolt
Weights
Loading chassis
Isolated foundation
Roller
Foundation RC slab
Hole
Vertical displacementtransducer
Horizontaldisplacementtransducer
Fig. 12 Elevation of the integrated test setup.
34
Fig. 13 Panorama view of the test.
(a) Cracking pattern within the foundation soil

35
(b) Sketch of cracking pattern within foundation soil (plan view)
(c) Cracking pattern of foundation soil under the foundation RC slab
Cracking in the soil under
the composite slab

36
Juncture between
the two boxes Crack
Crack
(d) Sketch of the cracking pattern within the soil under the foundation RC slab (Section
view)
Fig. 14 Cracking pattern within the foundation soil.
Fig. 15 Horizontal support’s displacement against loading displacement.
0
0.5
1
1.5
2
2.5
0 10 20 30 40 50
Ho
rizo
nta
l su
pp
ort
's d
isp
lacem
ent (m
m)
Loading displacement (mm)
Support A
Support B
Support C
Support D

37
Fig. 16 Vertical subsidence of the supports against loading displacement.
Fig. 17 Horizontal displacements at the top corners of the scaled tower model against
loading displacement.
0
0.5
1
1.5
2
2.5
3
0 10 20 30 40 50
Ve
rtic
al su
bsid
en
ce
of th
e s
up
po
rts (m
m)
Loading displacement (mm)
Support A
Support B
Support C
Support D
-1.5
0
1.5
3
4.5
6
0 10 20 30 40 50
Ho
rizo
nta
l d
isp
lace
me
nt a
t th
e to
p c
on
ne
rs (
mm
)
Loading displacement (mm)
Tower leg 1
Tower leg 2
Tower leg 3
Tower leg 4

38
Fig. 18 Stresses within the reinforcing steel bars against loading
displacement.
Fig. 19 Stresses within the reinforcing steel bars against loading displacement.
0
25
50
75
100
125
0 10 20 30 40 50
Str
ess w
ith
in r
ein
forc
ing
ste
el b
ar
(MP
a)
Loading displacement (mm)
XB-2-3
SB-2-3
-80
-60
-40
-20
0
20
0 10 20 30 40 50
Str
ess w
ith
in r
ein
forc
ing
ste
el b
ar
(MP
a)
Loading displacement (mm)
XB-2-2
SB-2-2

39
(a) Failure mode of the scaled tower model with isolated concrete foundation
(b) Maximum deformed profile of the scaled tower model with hybrid slab foundation
Fig. 20 Comparison of failure mode of the scaled tower model with isolated foundations
against the maximum deformed profile of the scaled tower with hybrid slab foundation.
Failed leg member
Bending deformation of
diaphragm members

40
Fig. 21 The horizontal displacements of the supports with different foundations.
Fig. 22 Stresses within the tower legs’ members with different type foundations
(IF = isolated foundation; HSF = hybrid slab foundation).
0
15
30
45
60
75
0 10 20 30 40 50
Ho
rizo
nta
l su
pp
ort
's d
isp
lace
men
t (m
m)
Loading displacement (mm)
Support B (isolated foundation)
Support C (isolated foundation)
Support B (hybrid slab foundation)
Support C (hybrid slab foundation)
-100
0
100
200
300
400
0 10 20 30 40 50
Str
ess in
th
e to
we
r le
g's
me
mb
er
(mm
)
Loading displacement (mm)
L14-IF
L24-IF
L34-IF
L44-IF
L14-HSF
L24-HSF
L34-HSF
L44-HSF

41
Fig. 23 The stresses in the first cross bracing members with different type foundations
(IF = isolated foundation; HSF = hybrid slab foundation).
-25
-20
-15
-10
-5
0
5
0 10 20 30 40 50
Str
ess in
th
e b
racin
g m
em
be
r (M
Pa
)
Loading displacement (mm)
AX1 - IF
CX1 - IF
AX1 - HSF
CX1 - HSF