Embed Size (px)
Citation preview

1
Inter-laboratory standardization of the sandwich ELISA designed for MATS, 1
a rapid, reproducible method for estimating the strain coverage of investigational vaccines 2
3
Brian D. Plikaytis1, Maria Stella2, Giuseppe Boccadifuoco2, Lisa M. DeTora2, Mauro Agnusdei2, Laura 4
Santini2, Brunella Brunelli2, Luca Orlandi2, Isabella Simmini,2 Marzia Giuliani2, Morgan Ledroit3, Eva 5
Hong3, Muhamed-Kheir Taha3, Kim Ellie1, Gowrisankar Rajam1, George M. Carlone1, Heike Claus4, Ulrich 6
Vogel4, Ray Borrow5, Jamie Findlow5, Stefanie Gilchrist5, Paola Stefanelli6, Cecilia Fazio6, Anna 7
Carannante6, Jan Oksnes7, Elisabeth Fritzsønn7, Anne-Marie Klem7, Dominique A. Caugant7, Raquel 8
Abad8, Julio A. Vázquez8, Rino Rappuoli2, Mariagrazia Pizza2, John J. Donnelly2 and Duccio Medini2* 9
10
1 Division of Bacterial Diseases, National Center for Immunization and Respiratory Diseases, Centers for 11
Diseases Control and Prevention, Atlanta, GA 30333 USA 12
2 Novartis Vaccines & Diagnostics, Via Fiorentina 1, Siena, Italy 13
3 Institut Pasteur, Invasive Bacterial Infections unit and National Reference Centre for meningococci, Paris, 14
France 15
4 University of Würzburg, Institute for Hygiene and Microbiology, National reference laboratory for 16
meningococci, Germany 17
5 Health Protection Agency, Manchester Royal Infirmary, Manchester, UK 18
6 Dept. of Infectious Parasitic & Immune-mediated Diseases, Istituto Superiore di Sanità, Rome,Italy 19
7 Norwegian Institute of Public Health, Department of Bacteriology and Immunology, Oslo, Norway 20
8 Institute of Health Carlos III, Madrid, Spain 21
22
* Corresponding author: [email protected] 23
Copyright © 2012, American Society for Microbiology. All Rights Reserved.Clin. Vaccine Immunol. doi:10.1128/CVI.00202-12 CVI Accepts, published online ahead of print on 8 August 2012
on Septem
ber 3, 2018 by guesthttp://cvi.asm
.org/D
ownloaded from

2
ABSTRACT 24
The Meningococcal antigen typing system (MATS) sandwich ELISA was designed to measure 25
immunologic cross-reactivity and quantity of antigens in target strains of a pathogen. It was first used to 26
measure the factor H binding protein (fHbp), Neisserial adhesin A (NadA), and Neisserial heparin binding 27
antigen (NHBA) content of serogroup B meningococcal (MenB) isolates relative to a reference strain, or 28
“relative potency” (RP). With the PorA genotype, RPs were then used to assess strain coverage by 4CMenB, 29
a multicomponent MenB vaccine. In preliminary studies, MATS accurately predicted killing in the serum 30
bactericidal assay using human complement (hSBA), an accepted correlate of protection for meningococcal 31
vaccines. 32
A study across seven laboratories assessed the reproducibility of RPs for fHbp, NadA, and NHBA and 33
established qualification parameters for new laboratories. RPs were determined in replicate for 17 MenB 34
reference strains at laboratories A-G. The reproducibility of RPs among laboratories and against consensus 35
values across laboratories were evaluated using a mixed-model analysis of variance (ANOVA). Inter-36
laboratory agreement was very good; Pearson correlation coefficients, coefficients of accuracy and 37
concordance correlation coefficients exceeded 99%. Summary measures of reproducibility, expressed as 38
between-laboratory coefficients of variation, were 7.85% (fHbp), 16.51% (NadA), and 12.60% (NHBA). 39
Overall within-laboratory measures of variation adjusted for strain, and laboratory, were 19.8% (fHbp), 40
28.8% (NHBA) and 38.3% (NadA). The MATS ELISA was successfully transferred to six laboratories, and 41
a further laboratory was successfully qualified. 42
on Septem
ber 3, 2018 by guesthttp://cvi.asm
.org/D
ownloaded from

3
INTRODUCTION 43
Serogroup B Neisseria meningitidis (MenB) is a worldwide public health threat that accounts for 44
90% of infant meningococcal disease cases in many European countries (7, 26, 13, 23). Unlike serogroups 45
A, C, W-135 and Y, for which broad-coverage polysaccharide protein conjugate vaccines are available, 46
MenB has presented unique challenges to vaccine development because its polysaccharide capsule mimics 47
the human neural cell adhesion molecule (N-CAM) (10). Therefore, various sub-capsular targets have been 48
investigated since the 1980’s (10, 5, 15, 1, 25). 49
To date, three licensed vaccines against invasive serogroup B meningococcal disease based on wild 50
type outer membrane vesicles (OMVs) have successfully contained clonal outbreaks in Cuba, Norway, New 51
Zealand, parts of Latin America, and Normandy, France (26, 23, 5, 15). However, these OMV vaccines do 52
not provide protection against strains carrying PorA serosubtypes that differ from that in the vaccine (26, 23, 53
5, 15, 1, 25, 9, 20, 21, 27). To provide protection against genetically diverse MenB strains, several 54
investigational vaccines, including formulations with multiple OMVs, recombinant OMVs, multiple PorA 55
and FetA components, or antigens discovered through genome mining, have been developed (26, 23, 10, 5, 56
15, 1, 25, 9, 20, 21, 27). Of the several investigational formulations that have entered the clinic, two 57
vaccines that contain factor H binding protein (fHbp), a novel protein antigen, have entered late-stage 58
clinical trials (26, 1, 25). Additional investigational MenB vaccines assessed in the clinic include bi- and 59
hexavalent PorA outer membrane vesicle (OMV) vaccines (26, 23, 9, 20, 21, 27). However, only a single 60
vaccine, 4CMenB, has completed phase 3 clinical trials and is under consideration for licensure, while a 61
bivalent fHbp vaccine has entered late-stage clinical trials (1, 25). 4CMenB has four primary antigenic 62
components: OMV from the New Zealand outbreak strain NZ 98/254, fHbp, Neisserial adhesin A (NadA), 63
and Neisseria-heparin binding antigen (NHBA) (23, 1, 25, 11, 2). 64
Genotyping based on sequence variation of housekeeping genes (multilocus sequence typing; 65
MLST) or surface expressed proteins such as PorA and FetA shows high genetic diversity among 66
meningococcal populations (19, 16). These patterns of variation do not account for additional surface 67
proteins such as the three recombinant antigens included in 4CMenB (2), because of the high rates of 68
recombination affecting the meningococcal chromosome (8, 4). Moreover, MLST and antigen genotyping 69
on Septem
ber 3, 2018 by guesthttp://cvi.asm
.org/D
ownloaded from
4
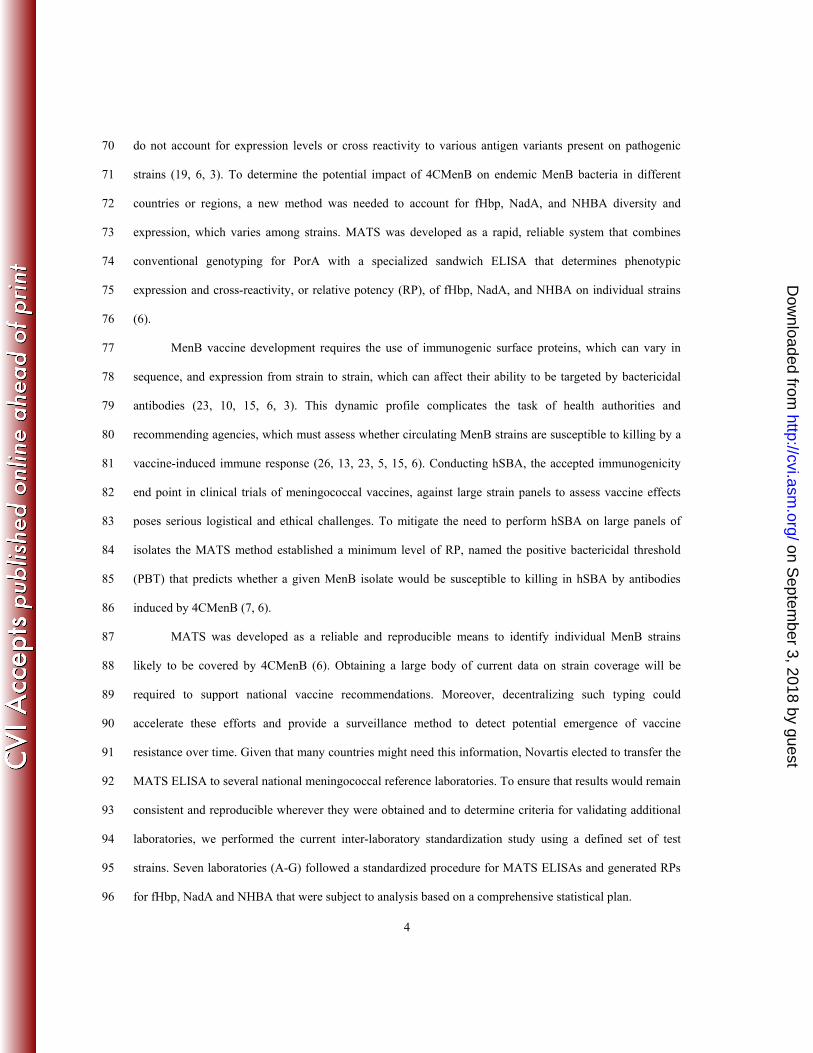
do not account for expression levels or cross reactivity to various antigen variants present on pathogenic 70
strains (19, 6, 3). To determine the potential impact of 4CMenB on endemic MenB bacteria in different 71
countries or regions, a new method was needed to account for fHbp, NadA, and NHBA diversity and 72
expression, which varies among strains. MATS was developed as a rapid, reliable system that combines 73
conventional genotyping for PorA with a specialized sandwich ELISA that determines phenotypic 74
expression and cross-reactivity, or relative potency (RP), of fHbp, NadA, and NHBA on individual strains 75
(6). 76
MenB vaccine development requires the use of immunogenic surface proteins, which can vary in 77
sequence, and expression from strain to strain, which can affect their ability to be targeted by bactericidal 78
antibodies (23, 10, 15, 6, 3). This dynamic profile complicates the task of health authorities and 79
recommending agencies, which must assess whether circulating MenB strains are susceptible to killing by a 80
vaccine-induced immune response (26, 13, 23, 5, 15, 6). Conducting hSBA, the accepted immunogenicity 81
end point in clinical trials of meningococcal vaccines, against large strain panels to assess vaccine effects 82
poses serious logistical and ethical challenges. To mitigate the need to perform hSBA on large panels of 83
isolates the MATS method established a minimum level of RP, named the positive bactericidal threshold 84
(PBT) that predicts whether a given MenB isolate would be susceptible to killing in hSBA by antibodies 85
induced by 4CMenB (7, 6). 86
MATS was developed as a reliable and reproducible means to identify individual MenB strains 87
likely to be covered by 4CMenB (6). Obtaining a large body of current data on strain coverage will be 88
required to support national vaccine recommendations. Moreover, decentralizing such typing could 89
accelerate these efforts and provide a surveillance method to detect potential emergence of vaccine 90
resistance over time. Given that many countries might need this information, Novartis elected to transfer the 91
MATS ELISA to several national meningococcal reference laboratories. To ensure that results would remain 92
consistent and reproducible wherever they were obtained and to determine criteria for validating additional 93
laboratories, we performed the current inter-laboratory standardization study using a defined set of test 94
strains. Seven laboratories (A-G) followed a standardized procedure for MATS ELISAs and generated RPs 95
for fHbp, NadA and NHBA that were subject to analysis based on a comprehensive statistical plan. 96
on Septem
ber 3, 2018 by guesthttp://cvi.asm
.org/D
ownloaded from

6
MATERIAL AND METHODS 99
Bacterial strains used. MenB strains (Table S1) were obtained under Materials Transfer Agreements from 100
the Norwegian Institute of Public Health, Oslo, Norway; the Health Protection Agency, Manchester, UK; 101
and the Centers for Disease Control and Prevention, Atlanta, USA. These strains were selected to provide 102
examples of a range of MATS ELISA values and not as representative of any particular country, region, or 103
RP distribution. 104
MATS ELISA. To measure RP for fHbp, NHBA and NadA, ELISAs were performed as described 105
previously (23). Precoated microtiter plates, antibody reagents, substrate buffer, washing buffer and a 106
written set of instructions were provided in kit form by Novartis Vaccines & Diagnostics. Briefly, bacteria 107
were cultured overnight on chocolate agar (Biomérieux) and then suspended in Mueller-Hinton broth 108
(Difco) to a defined optical density, OD600=0.4. Empigen BB (Sigma) was added, then the bacterial 109
suspensions were incubated for 1 hour as described below for inactivation by the lysis buffer. Serial 110
dilutions of the bacterial lysate were then transferred to microtiter plates previously coated with rabbit 111
polyclonal antibodies specific for fHbp, NHBA or NadA. The plates were incubated, washed, and an 112
antigen-specific secondary antibody, also prepared in rabbits and labeled with biotin, was used to detect the 113
bound antigens. The plates were developed with streptavidin – HRP and ortho-phenylene diamine substrate 114
(Sigma), the reactions were stopped with H2SO4, and the plates were read at 492 nm. Results were analyzed 115
with StatLIA (Brendan Technologies, Carlsbad, CA USA), by calculating the RP of the test strain bacterial 116
lysate compared with that of a reference strain that was treated identically and assayed in each microtiter 117
plate (H44/76 for fHbp, NGH38 for NHBA and 5/99 for NadA). 118
In each laboratory, at least 12 assays considered acceptable, based on visual evaluation of the 119
dilution curves, were used to constitute a reference dataset used by StatLIA to determine mean-variance 120
regressions and typical variability of the standard curve. On this basis, a weighted five-parameter logistic 121
regression was performed for the ODs of the test and of the reference samples of each assay, and RP was 122
determined by parallelism analysis of the regressions for the test and the reference strain (18, 14). For all 123
laboratories, acceptance criteria previously defined and based on StatLIA p-values (6) were used to 124
determine acceptability of each microtiter plate and individual test strain. The following laboratories 125
on Septem
ber 3, 2018 by guesthttp://cvi.asm
.org/D
ownloaded from
7
participated in the study: the Division of Bacterial Diseases, Centers for Disease Control and Prevention, 126
Atlanta, Georgia (USA), Novartis Vaccines & Diagnostics (Siena, Italy), the National Reference Centre for 127
meningococci, IBI unit, Institut Pasteur, Paris (France), the Reference Laboratory for Meningococci, 128
Institute of Health Carlos III, Madrid (Spain), the National reference laboratory for meningococci, 129
University of Würzburg, Institute for Hygiene and Microbiology (Germany), the Manchester Laboratory of 130
the Health Protection Agency (UK), the Department of Infectious Diseases, Istituto Superiore di Sanità, 131
Rome (Italy), and the Department of Bacteriology and Immunology, Norwegian Institute of Public Health, 132
Oslo (Norway). Laboratories participating to the standardization study were randomly designated A-G. A 133
laboratory that performed the qualification study was designated H. 134
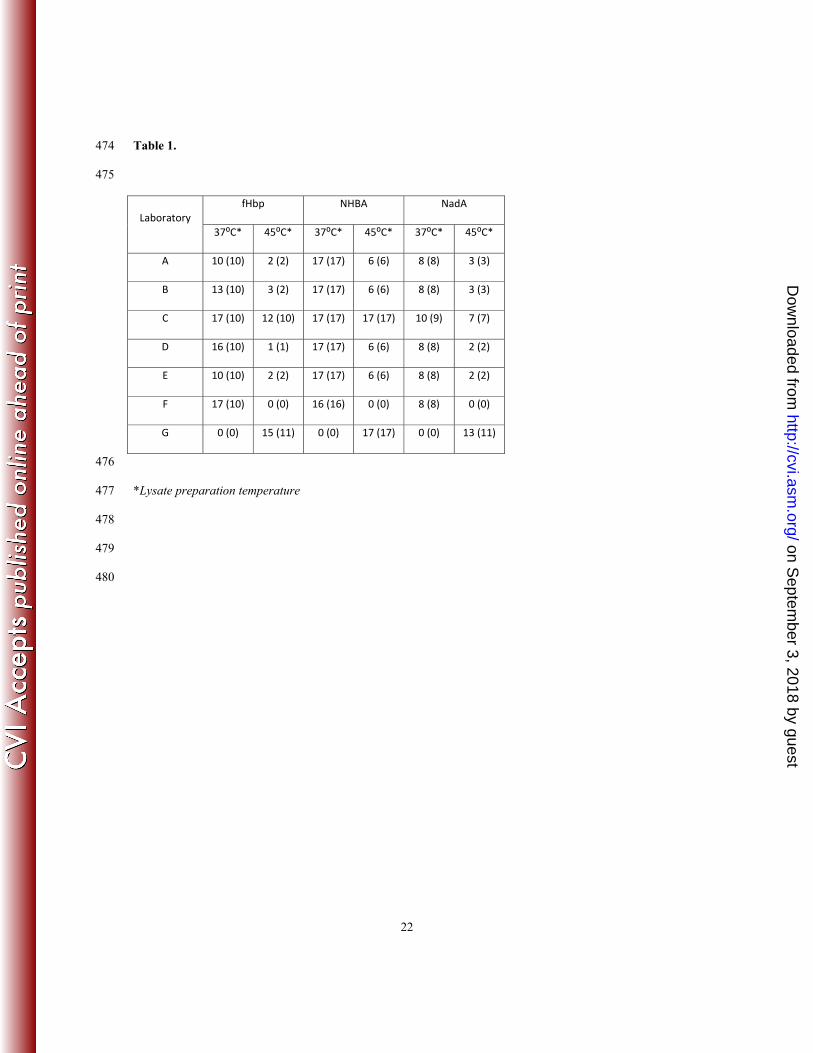
Study design. Seven laboratories (A-G) performed multiple MATS ELISA tests for fHbp, NHBA and 135
NadA on 17 shared strains (Table S1 and Table 1). 136
We previously (6) defined provisional lower limits of quantitation (LLOQs) for fHbp, NadA, and 137
NHBA based on data from one laboratory. In the present study, ANOVA models employing data from 138
laboratories A-G were used to redefine those limits as 0.009, 0.04, and 0.0009 for fHbp, NHBA, and NadA, 139
respectively. RP values less than these were excluded from the present analysis. 140
During the current study, antigen extraction at 37°C (room temperature) permitted survival of small 141
numbers of bacteria at some laboratories, which could potentially pose a safety risk for laboratory workers. 142
Retesting revealed that antigen extraction at 45°C for 1 hour resulted in complete inactivation of bacterial 143
suspensions for all laboratories. Therefore, the temperature for bacterial lysate preparation was changed to 144
45°C. Five laboratories assayed strains at both temperatures to determine possible effects on RP values. Lab 145
G used 45°C and Lab F used 37°C only (Table 1) 146
Construction of a core of reference MATS strains. RPs below the LLOQ were excluded from all 147
analyses. For fHbp and NadA, all replicate RPs for several strains were below the LLOQ, leaving core sets 148
of 10 (fHbp), 17 (NHBA), and 8 (NadA) strains (See Figure 1A, B, and C, respectively). 149
Statistical Analysis. RPs were log10 transformed prior to analysis. For the 17 test strains, consensus RP 150
values were estimated across the laboratories A-G, using an analysis of variance (ANOVA) mixed-effects 151
model. Consensus RPs were then used to quantify accuracy, reproducibility, repeatability, precision and bias 152
on Septem
ber 3, 2018 by guesthttp://cvi.asm
.org/D
ownloaded from
8
within and among the laboratories. Accuracy, defined as the closeness of a laboratory-assayed value to the 153
consensus value, was measured using Lin’s coefficient of accuracy (Ca) (25). Precision, a measure of how 154
far a set of observations deviate from a fitted straight line, was quantified using Pearson’s correlation 155
coefficient (r). Lin’s Concordance Correlation Coefficient (rc), a combination of Ca and r, was employed to 156
form a single statistic describing accuracy and precision. Repeatability, a measure of intra-laboratory 157
variation (for replicate assays), and reproducibility, a measure of inter-laboratory variation (an estimate of 158
the overall error) of the assay, were expressed as coefficients of variation (CV). Bias is a measure of 159
directional error (consistent offset) of the laboratory titer compared to the consensus RP (26). 160
Linear mixed-effects ANOVA models were used to estimate consensus values for each strain and 161
antigen as well as assay repeatability and reproducibility. All models were fit independently by antigen and 162
included strain and laboratory as random effects. Since each strain was assayed in replicate, a single 163
predicted RP was estimated using the ANOVA models to represent the replicate values for analysis and 164
comparison of laboratories in the figures and tables. Prediction intervals used to develop acceptance criteria 165
for future laboratories were also derived from these ANOVA models. 166
The estimated values from the ANOVA models were used to assess and evaluate the ability of 167
laboratories A-G to reproduce RPs and to test the consistency of the RPs with consensus values. Laboratory 168
bias was quantified by comparing observed laboratory values to consensus values. For each individual 169
antigen, the mean bias was expected to be zero. 170
Development of qualification criteria for new laboratories. Anticipating the need for additional 171
laboratories to use the MATS ELISA, the present data were used to suggest qualification criteria. A protocol 172
was then set up to ensure that new laboratories produced results within tolerance limits defined by the 173
variability measured in the present study. This approach also would ensure that new laboratories developed 174
adequate proficiency to qualify to use the MATS ELISA. A laboratory that meets these specifications will 175
be considered qualified to assay new strains, and the resulting RPs would be considered consistent with 176
those measured by laboratories A-G in this study. 177
178
on Septem
ber 3, 2018 by guesthttp://cvi.asm
.org/D
ownloaded from

9
RESULTS 179
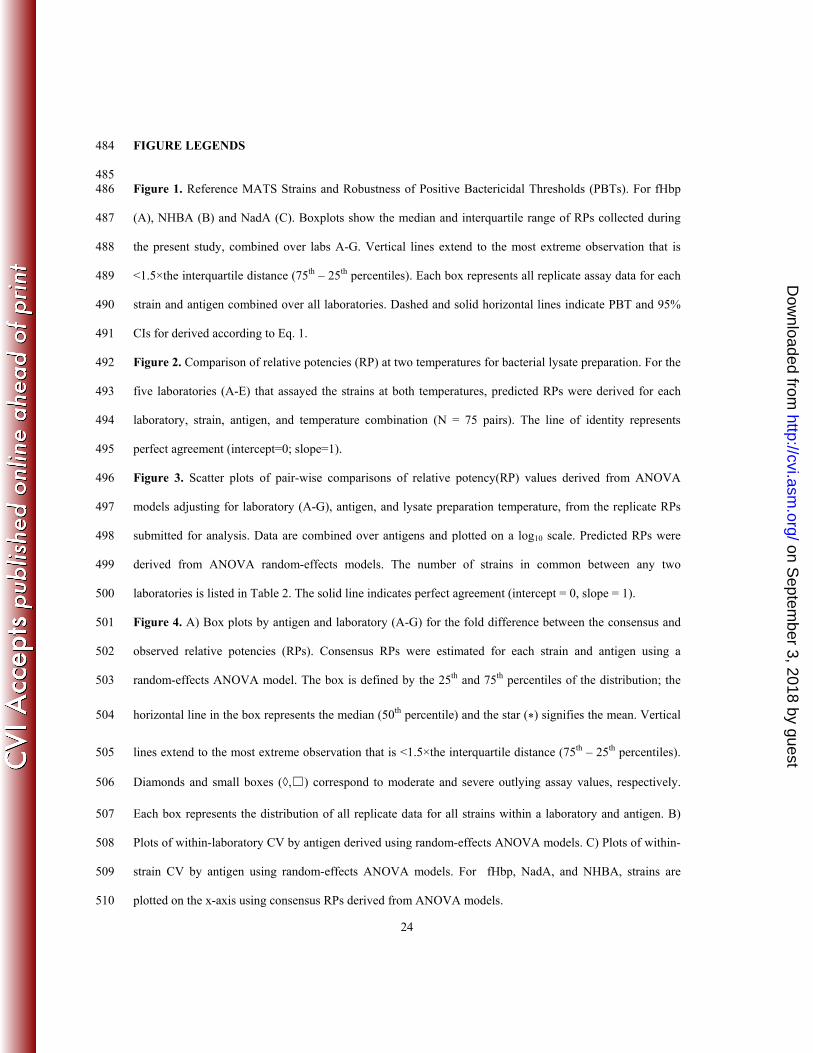
MATS strains span a wide assay range. Figure 1 displays the distribution of RPs for each strain and 180
antigen. Each box represents all replicate assay data for each strain and antigen combined over all 181
laboratories. 182
MATS RPs were robust to temperature change during lysate preparation. ANOVA models were 183
constructed adjusting for laboratory (A-G), antigen, and lysate preparation temperature, from the replicate 184
RPs submitted for analysis. For the five laboratories that assayed the strains at both temperatures, predicted 185
RPs were derived for each laboratory, strain, antigen, and temperature combination yielding 75 pairs of 186
measurements which were plotted in Figure 2. In this scatterplot, the line of identity represents perfect 187
agreement (intercept=0; slope=1). Agreement was generally excellent, with data clustered tightly over the 188
line of identity. Lin’s coefficient of accuracy (Ca) was 0.999 (95% CI, 0.997, 1.00). Precision was high; the 189
Pearson correlation coefficient was 0.993 (95% CI, 0.988, 0.995) and the combined concordance correlation 190
coefficient (rc) was 0.992 (95% CI, 0.987, 0.995). Due to this high level of agreement, we combined results 191
at 37°C and 45°C for all remaining analyses. 192
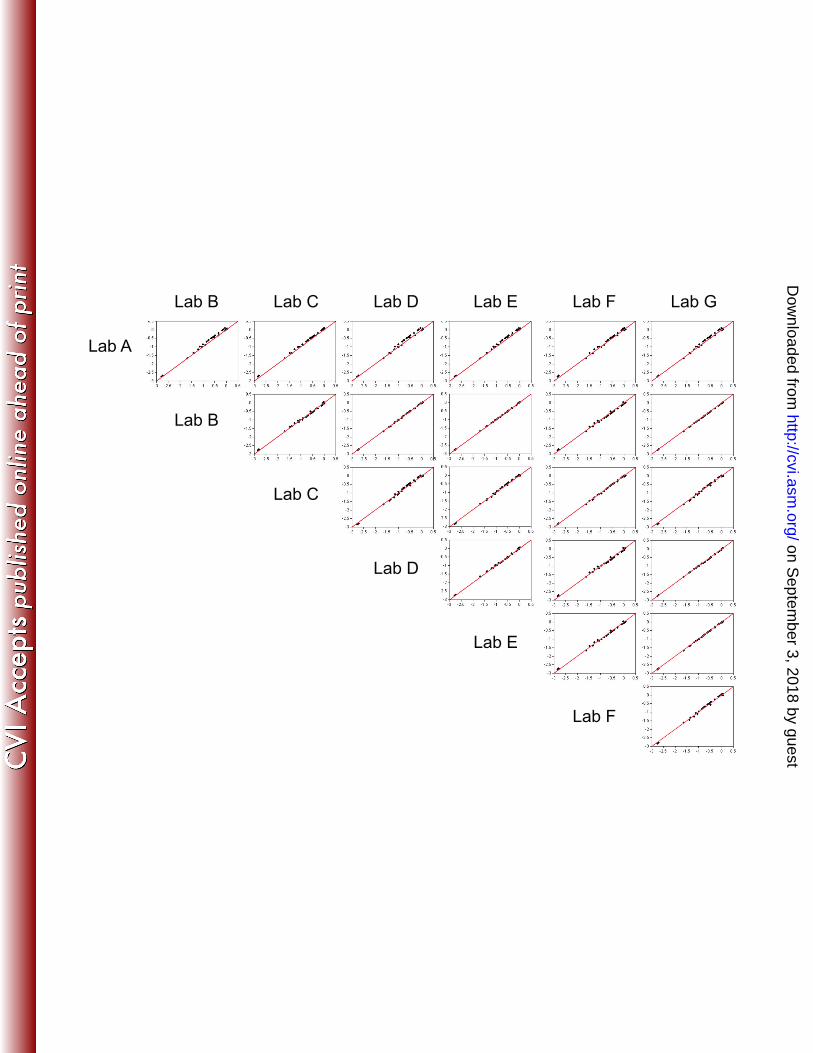
Inter-laboratory correlations of MATS RPs were close to identity. ANOVA models were used to 193
estimate single RPs for each strain by laboratory and antigen. Scatter plots comparing these predicted RPs 194
between laboratories A-G and combined over the three antigens are in Figure 3. Most lab-to-lab 195
comparisons yielded clusters of points centered over the line of identity (which represents perfect 196
agreement), indicating good agreement between laboratories A-G. Table 2 presents a comparison of RPs 197
between laboratories A-G for accuracy (Ca), precision (Pearson’s r) and concordance correlation coefficient 198
(rc), combined over the three antigens. Accuracy, precision, and concordance were all high and exceeded 199
0.99. RPs for Lab A were slightly higher than those of the laboratories B-G, as indicated by the small 200
upward shift in the point clusters in Figure 3; however, no significant impact on the quality of the inter-201
laboratory correlations, whose 95% lower confidence bounds (LCB) remained ≥ 0.984, was detected (Table 202
2). 203
MATS repeatability supports within-laboratory discriminatory power for RPs. ANOVA models were 204
used to estimate consensus RPs for each antigen and strain. Box plots displaying the distribution of fold 205
on Septem
ber 3, 2018 by guesthttp://cvi.asm
.org/D
ownloaded from

10
differences between the individual laboratory-reported and consensus RPs by antigen are shown by antigen 206
in Figure 4A. The total span of the box-plot including the vertical lines above and below the inter-quartile 207
range is a direct indicator of within-laboratory variability (repeatability, see Table S2 for variances and 208
coefficients of variation). For example, boxes centered about the gray dotted line (which represents the 209
consensus value) with vertical lines extending between ½ and 2 indicate an experimental distribution of RPs 210
within a ± 2-fold difference from the consensus value. The experimental ranges of the assay from LLOQ to 211
the maximum observed RP were 200- 50- and 2000-fold for fHbp, NHBA and NadA, respectively The 212
largest within-laboratory variability (or worst repeatability) for NHBA was observed in Lab F, which had a 213
±2.3 fold difference between the two ends of the vertical lines of the box. The 50-fold experimental range 214
for NHBA can be subdivided in approximately 11 non-overlapping 4.6-fold ranges from LLOQ to the 215
maximum RP observed, which represent the minimum discriminatory power of a standardized laboratory for 216
NHBA-RPs. For fHbp and NadA, which each had a wider experimental range, a better within-lab 217
discriminatory power can be calculated in the same way. A quantitative measure of within-laboratory CV’s 218
by antigen and adjusted for strain is in Figure 4B. For laboratories A-G, fHbp displayed the lowest degree of 219
within-laboratory variance, NHBA and intermediate level and NadA the highest degree of variance, 220
although Lab F reported a slightly higher CV for NHBA than for NadA. 221
MATS RPs are not affected by a systematic bias. Within-laboratory bias per antigen was also estimated 222
from the ANOVA models, as illustrated in Figure 4A by the distance of the mean (*) from the gray dotted 223
line at 1, for each laboratory (A-G) and antigen (FHbp, NadA, and NHBA). The mean bias varied across 224
antigens and laboratories and did not display any systematic patterns or associations between bias and 225
variability. For example, Lab A had substantial positive bias and high variability for NadA, positive bias and 226
lower variability for NHBA, and virtually no bias and low variability for fHbp. Conversely Lab F had 227
negative bias and high variability for NadA, no bias and high variability for NHBA, and positive bias and 228
low variability for fHbp. 229
Between-laboratory variation had only a minor impact on MATS RPs. In Figure 4A the relative 230
positioning of the boxes about the gray dotted line for a given antigen across laboratories A-G gives a visual 231
indication of the between-laboratory variability. Table S2 lists the between-laboratory CVs for each antigen. 232
on Septem
ber 3, 2018 by guesthttp://cvi.asm
.org/D
ownloaded from

11
Table S2 also tabulates the within-laboratory CV for each lab and antigen. Finally, Table S2 lists the overall 233
within-laboratory CV for each antigen adjusted for laboratory and strain. Within-strain CV is plotted 234
opposite predicted relative potencies in Figure 4C This plot provides the opportunity to observe if there is a 235
relationship between variability and the magnitude of the RP. In general, samples with the lowest RP values 236
exhibited the greatest degree of within-strain variability. 237
Between-laboratory CVs for each antigen were 7.85% (fHbp), 12.60% (NHBA) and 16.51% (NadA). 238
Overall within-laboratory CVs estimated from ANOVA models adjusted for strain and laboratory, were 239
19.8%, 28.8% and 38.3% for fHbp, NHBA and NadA, respectively. The between-laboratory CVs were 240
lower than the within-laboratory CVs for each of the three antigens. This indicates that intrinsic biological 241
variables such as bacterial growth contributed more to the overall variability of the assay than did 242
differences between the laboratories. 243
Interlab-derived 95% confidence intervals (CI95%) for the PBT provided robust vaccine strain 244
coverage predictions. As previously described, any strain with an RP above the PBT for any antigen is 245
predicted to be covered by 4CMenB (23). To assess 95% confidence bounds of strain coverage, a sufficient 246
number of replicate assays for each strain could be performed to estimate a 95% confidence interval (CI95% ) 247
for the RP of each strain to be compared with the PBT; however, this strategy is not feasible with large 248
panels of strains. Alternatively, a CI95% for the PBT could be used to assess coverage with 95% confidence 249
for single RPs from individual strains. Using data from the current study, we derived an empirical estimate 250
of the CI95% around the PBT as: 251 % 10^ log 1.96 · (1) 252
As the PBT is strain-independent, in Eq. 1 we used the overall within-laboratory variances for fHbp, 253
NadA, and NHBA adjusted for strain and laboratory as estimated by our ANOVA models described above 254
(Table S2). The individual PBT CI95% ranges obtained for fHbp (0.014 - 0.031, point estimate = 0.021), 255
NadA (0.004 - 0.019, point estimate = 0.009) and NHBA (0.169 - 0.511, point estimate = 0.294) are shown 256
in Figure 1. 257
We propose using the PBT CI95% to define empirical limits to predict strain coverage by 4CMenB. 258
Comparing individual RPs from tested strains to the PBT CI95% bounds will account for boundaries around 259
σ 2
on Septem
ber 3, 2018 by guesthttp://cvi.asm
.org/D
ownloaded from

12
the estimate of strain coverage, defined in terms of both within- and between-laboratory variances. If the 260
number of strains used to generate the estimate is significantly smaller than the population of strains for 261
which vaccine strain coverage is being estimated, then additional corrections may be needed. 262
One possible limitation of the PBT CI95% bounds is that among replicate RPs from a single strain 263
some could be both above and below these bounds, which would indicate that the strain is simultaneously 264
covered and not covered and thereby invalidate the model. To confirm that the PBT CI95% bounds provide a 265
robust measurement for strain coverage, we examined the empirical distribution of experimental RPs at or 266
above LLOQ for all laboratories and strains tested, as shown in Figure 1. No strain had replicate RPs both 267
above the 95% upper confidence bound (UCB) and below the 95% LCB, either within or across 268
laboratories, indicating that the empirical PBT CI95% is robust and capable of accounting for within-lab and 269
between-lab variation. 270
Qualification guidelines for new laboratories. Based on our results, we propose the following criteria be 271
used to qualify a laboratory to perform the MATS ELISA to assess 4CMenB. 272
(i) Use the 12 quality-control strains defined in Table S3, spanning the range of RPs for fHbp (8/12 strains), 273
NHBA (12/12 strains) and NadA (6/12 strains). 274
(ii) Collect a minimum of 12 assays (microtiter plates) per antigen that have been deemed reasonable by 275
visual evaluation of the reference dilution curves, then build a reference dataset and analyze the assays in 276
StatLIA. 277
(iii) Retest test strains that fail StatLIA acceptance criteria (6) to collect a minimum of 5 acceptable results 278
above the LLOQ per strain, per antigen for those with positive results. 279
(iv) For fHbp, NadA, and NHBA, ensure that all strains display a geometric mean of RPs within the range 280
reported in Table S3, and a CV equal to or lower than the maximum CV reported in Table S3. For 281
failures, identify and solve the source of the problem, and repeat the test. A deviation in one of these 282
criteria by a small amount for a single strain per antigen is acceptable. 283
(v) For fHbp, NadA, and NHBA, ensure that at least 95% of RPs are within the 95% prediction intervals 284
reported in Table S3 and also that at most one RP per strain falls outside the 95% prediction intervals. For 285
on Septem
ber 3, 2018 by guesthttp://cvi.asm
.org/D
ownloaded from

13
any failures, identify and solve the source of the problem, then repeat testing for the failed strains starting 286
with those having the largest deviation from predicted values, until both criteria are met. 287
These proposed laboratory qualification criteria were tested using Lab H. Figure S1 shows the distribution 288
of geometric means, CVs and assay values, relative to the range of geometric means, of CVs and to the 95% 289
prediction intervals listed in Table S3. The RPs produced in Lab H were consistent with those produced in 290
the standardized laboratories, and qualify Lab H to perform the MATS ELISA and therefore to use the 291
MATS method to assess strain coverage by 4CMenB. As additional laboratories provide data, refinements 292
may be made to the proposed qualification criteria. 293
294
DISCUSSION 295
Statistical methodologies used in this investigation have been applied previously in similar studies. 296
In characterizing a new human pneumococcal standard reference serum, Goldblatt, et al. (12) performed a 297
study bridging the new reference sera (007sp) with the one in current use (89SF). Five laboratories 298
performed the WHO reference pneumococcal ELISAs on a panel of 12 WHO calibration sera for 13 299
pneumococcal serotypes. Kapasi, et al. (22) enrolled four laboratories to perform a comparative study of 300
four different sources of pertussis toxin (PT) in an IgG anti-PT ELISA. Rose, et al. (17) examined the level 301
of agreement among six laboratories measuring antibody-mediated killing of Streptococcus pneumoniae 302
(pneumococcus) by phagocytes using each laboratory’s own optimized opsonophagocytic assay (OPA) on a 303
panel of 16 WHO calibration reference sera for 13 pneumococcal serotypes. In (12) and (22) concordance 304
correlation results were very good as lab-to-lab rc exceeded 0.96 and 0.97 respectively among all labs. In 305
(17), due to the lack of assay standardization and the inherent variability of OPA, concordance was 306
somewhat reduced: lab-to-lab rc ranged from 0.67-0.99 for all six laboratories with five of the six labs 307
exhibiting an rc > 0.80. 308
Lab-to-lab rc measured during the present interlaboratory standardization of the MATS ELISA 309
exceeded 0.99 for all labs, indicating an excellent agreement within and across all participating laboratories 310
for all three antigens, equal or higher than that observed in the similar studies mentioned above. 311
on Septem
ber 3, 2018 by guesthttp://cvi.asm
.org/D
ownloaded from

14
Of note, in this study MenB strains with unknown RPs were used for all antigens, and the ANOVA 312
mixed model provided a mechanism to estimate consensus values that served as assigned values for each 313
strain for the duration of this study. The choice to use a consensus value rather than establishing a definitive 314
RP in the laboratory where MATS was initially developed reflects the desire to develop a real-world assay 315
whose standardization and qualification criteria are co-owned by the laboratories that perform it. 316
Mixed-model analysis of variance allowed us to partition the total variance to measure 317
reproducibility and repeatability. Within laboratory variation was 2 to 2.5 times higher than between-318
laboratory variation for each antigen, indicating a very good level of assay standardization across 319
laboratories but also a significant level of intrinsic variability in the assay. Within-strain CVs measured for 320
each antigen show that variability is slightly increased for low RPs and that CVs varied significantly from 321
strain to strain, but also that – for each antigen – the less variable strain had a CV higher than the between-322
laboratory CV. Taken together these results suggest that, even though strain-specific characteristics and the 323
biochemistry of the assay at low concentrations may have an impact on MATS variability, a major source of 324
assay variation is intrinsic to the experimental procedure, and may be associated with the quantification of 325
the bacterial suspension that is processed in the assay, due to the biological variability of bacterial growth. 326
An interesting and unanticipated finding in this study was that a small number of bacteria survived 327
Empigen lysis at room temperature in some collaborating laboratories. Exposure to live meningococci is an 328
unacceptable health risk to laboratory workers; therefore, the lysate preparation temperature was adjusted to 329
ensure the safety of MATS operators. This effect is probably strain-dependent and indicates that safety 330
precautions need to be evaluated for larger panels of meningococcal strains. Subsequent analysis showed 331
that changing the lysate preparation temperature to 45°C had no significant effect on RPs and supported 332
combining data from all assays in this study. 333
One important goal of the current study was to provide additional national laboratories with an 334
opportunity to obtain the MATS ELISA without additional inter-laboratory studies. Therefore, a set of 335
qualification criteria were established to permit a laboratory to test its proficiency in MATS relative to the 336
laboratories (A-G) standardized in the present study. A volunteer national laboratory (H) followed the 337
qualification procedure and obtained MATS ELISA results that were highly consistent with those in the 7 338
on Septem
ber 3, 2018 by guesthttp://cvi.asm
.org/D
ownloaded from
15
standardized laboratories. As additional laboratories provide assay data, the qualification criteria presented 339
here may be refined. 340
Strain coverage is a critical component in estimating the potential clinical effects of vaccines against 341
MenB, a pathogen characterized by dynamic mutability and strain epidemiology as well as a propensity 342
among its more virulent encapsulated strains to cause prolonged epidemic disease. Due to this diversity, the 343
amount of serum required for testing using the existing correlate of protection, the hSBA, is prohibitively 344
high, particularly in trials of infants. In previous studies (6) a minimum MATS RP, the PBT, was established 345
to indicate that a given MenB strain was susceptible to killing in the SBA by antibodies induced by 346
4CMenB. In the present study a heuristic method based on inter-laboratory variation was developed to 347
derive “95% Coverage Intervals” for PBTs of the three antigens. Results of this study demonstrate that 348
MATS RPs produced in each standardized or qualified laboratory can be compared to the PBTs defined in 349
one of the participating laboratories to obtain estimates of vaccine strain coverage that are consistent among 350
them, within the 95% intervals defined. 351
The PBTs used to define vaccine strain coverage were derived by comparing MATS to pooled hSBA 352
titers on a panel of 57 MenB strains. The use of a broader strain panel and comparison with hSBA data from 353
individual subjects, may further support the use of MATS to assess MenB strain coverage independent of 354
clinical sera. This might allow clinical trials to predict vaccine efficacy using a limited number of strains. In 355
addition, the extremely good agreement observed in this study among different laboratories suggests that the 356
technology adopted in the MATS ELISA could be successfully employed to perform similar testing with 357
different antigens or pathogens, providing a general platform for bacterial antigen phenotyping. 358
A possible area for future investigation with MATS is as a means of post-implementation 359
surveillance of the genetic profiles of fHbp, NadA, and NHBA on circulating meningococcal strains, 360
allowing reference laboratories to monitor the antigenic profile of pathogenic isolates in real time (24). In 361
addition, MATS might be used to assess the actual nature of potential vaccine failures, which has added 362
importance for outer membrane protein vaccines against MenB, given that not all circulating strains will 363
necessarily be covered. Post implementation surveillance data based on a standardized assay could allow an 364
on Septem
ber 3, 2018 by guesthttp://cvi.asm
.org/D
ownloaded from

16
indirect comparison of immunization policies across countries and regions, providing a precious basis for 365
rapid adaptation of public health policies based on world-wide quantitative data. 366
In summary, the results reported indicate that MATS is a standardized, reproducible antigen typing 367
system that robustly predicts 4CMenB strain coverage in different geographical regions. These results 368
suggest that MATS may have utility in epidemiologic surveillance of meningococci and could be adapted to 369
assess other pathogens. 370
371
References 372
1. Bai X, Findlow J, Borrow R. Recombinant protein meningococcal serogroup B vaccine combined 373
with outer membrane vesicles. Expert Opin Biol Ther. 2011 Jul;11(7):969-85. 374
2. Bambini S, Muzzi A, Olcen P, Rappuoli R, Pizza M, Comanducci M. Distribution and genetic 375
variability of three vaccine components in a panel of strains representative of the diversity of 376
serogroup B meningococcus. Vaccine. 2009 May 11;27(21):2794-803. 377
3. Brehony C, Jolley KA, Maiden MC. Multilocus sequence typing for global surveillance of 378
meningococcal disease. FEMS Microbiol Rev 31 (2007) 15–26. 379
4. Budroni S, Siena E, Hotopp JC, Seib KL, Serruto D, Nofroni C, Comanducci M, Riley DR, 380
Daugherty SC, Angiuoli SV, Covacci A, Pizza M, Rappuoli R, Moxon ER, Tettelin H, Medini D. 381
Neisseria meningitidis is structured in clades associated with restriction modification systems that 382
modulate homologous recombination. Proc Natl Acad Sci U S A. 2011 Mar 15;108(11):4494-9. 383
5. Caron F, Chatelet I, Leroy P, et al. From tailor-made to ready-to-wear meningococcal B vaccines: 384
longitudinal study of a clonal meningococcal B outbreak. Lancet Infec. Dis. 2011 Jun; 11(6): 455-385
463. 386
6. Donnelly J, Medini D, Boccadifuoco G, Biolchi A, Ward J, Frasch C, Moxon ER, Stella M, 387
Comanducci M, Bambini S, Muzzi A, Andrews W, Chen J, Santos G, Santini L, Boucher P, Serruto 388
D, Pizza M, Rappuoli R, Giuliani MM. Qualitative and quantitative assessment of meningococcal 389
antigens to evaluate the potential strain coverage of protein-based vaccines. Proc Natl Acad Sci U S 390
A. 2010 Nov 9;107(45):19490-5. 391
on Septem
ber 3, 2018 by guesthttp://cvi.asm
.org/D
ownloaded from

17
7. eCDC. Surveillance of invasive bacterial diseases in Europe 2008-2009. 392
http://www.ecdc.europa.eu/en/publications/Publications/1107_SUR_IBD_2008-09.pdf 393
8. Feil EJ, Holmes EC, Bessen DE, et al. Recombination within natural populations of pathogenic 394
bacteria: short-term empirical estimates and long-term phylogenetic consequences. Proc Natl Acad 395
Sci U S A 2001, 98(1), 182-187. 396
9. Findlow J, Lowe A, Deane S, Balmer P, van den Dobbelsteen G, Dawson M, Andrews N, and 397
Borrow R. 2005. Effect of sequence variation in meningococcal PorA outer membrane protein on the 398
effectiveness of a hexavalent PorA outer membrane vesicle vaccine in toddlers and school children. 399
Vaccine 23:2623-2627. 400
10. Finne J, Bitter-Suermann D, Goridis C, Finne U. An IgG monoclonal antibody to group B 401
meningococci cross-reacts with developmentally regulated polysialic acid units of glycoproteins in 402
neural and extraneural tissues. J Immunol. 1987 Jun 15;138(12):4402-7 403
11. Giuliani MM, Adu-Bobie J, Comanducci M, Aricò B, Savino S, Santini L, Brunelli B, Bambini S, 404
Biolchi A, Capecchi B, Cartocci E, Ciucchi L, Di Marcello F, Ferlicca F, Galli B, Luzzi E, 405
Masignani V, Serruto D, Veggi D, Contorni M, Morandi M, Bartalesi A, Cinotti V, Mannucci D, 406
Titta F, Ovidi E, Welsch JA, Granoff D, Rappuoli R, Pizza M. A universal vaccine for serogroup B 407
meningococcus. Proc Natl Acad Sci U S A. 2006 Jul 18;103(29):10834-9. 408
12. Goldblatt D, Plikaytis BD, Akkoyunlu M, Antonello J, Ashton L, Blake M, Burton R, Care R, 409
Durant N, Feavers I, Fernsten P, Fievet F, Giardina P, Jansen K, Katz L, Kierstead L, Lee L, Lin J, 410
Maisonneuve J, Nahm MH, Raab J, Romero-Steiner S, Rose C, Schmidt D, Stapleton J, and Carlone 411
GM. Establishment of a New Human Pneumococcal Standard Reference Serum, 007sp. Clin. 412
Vaccine Immunol. 2011 18:1728–1736. 413
13. Harrison LH, Trotter CL, Ramsay ME. Global epidemiology of meningococcal disease. Vaccine. 414
2009 Jun 24;27 Suppl 2:B51-63. 415
14. Heyden Y and Smeyers-Verbeke J. 2007. Set-up and evaluation of interlaboratory studies. J. 416
Chromatogr. A. 1158: 158-167. 417
on Septem
ber 3, 2018 by guesthttp://cvi.asm
.org/D
ownloaded from

18
15. Holst J, Martin D, Arnold R, Huergo CC, Oster P, O'Hallahan J, Rosenqvist E. Properties and 418
clinical performance of vaccines containing outer membrane vesicles from Neisseria meningitidis. 419
Vaccine. 2009 Jun 24;27 Suppl 2:B3-12. 420
16. Jolley KA, Brehony C, Maiden MC. Molecular typing of meningococci: recommendations for target 421
choice and nomenclature. FEMS Microbiol Rev. 2007 Jan;31(1):89-96. 422
17. Kapasi A, Meade BD, Plikaytis BD, Pawloski L, Martin MD, Yoder S, Rock MT, Coddens S, 423
Haezebroeck V, Fievet-Groyne F, Bixler G, Jones C, Hildreth S, Edwards KM, Messonnier NE, and 424
Tondella ML. Comparative Study of Different Sources of Pertussis Toxin (PT) as Coating Antigens 425
in IgG Anti-PT Enzyme-Linked Immunosorbent Assays. Clin. Vaccine Immunol. 2012 19:64–72. 426
18. Lin, LIK. A concordance correlation coefficient to evaluate reproducibility. Biometrics 1989 45: 427
255-268. 428
19. Maiden MC, Bygraves JA, Feil E, Morelli G, Russell JE, Urwin R, Zhang Q, Zhou J, Zurth K, 429
Caugant DA, Feavers IM, Achtman M, Spratt BG. Multilocus sequence typing: a portable approach 430
to the identification of clones within populations of pathogenic microorganisms. Proc Natl Acad Sci 431
U S A. 1998 Mar 17;95(6):3140-5 432
20. Martin DR, Ruijne N, McCallum L, O'Hallahan J, and Oster P. The VR2 epitope on the PorA P1.7-433
2,4 protein is the major target for the immune response elicited by the strain-specific group B 434
meningococcal vaccine MeNZB. Clin. Vaccine Immunol. 2006 13:486-491. 435
21. Martin SL, Borrow R, van der Ley P, Dawson M, Fox AJ, and Cartwright KA. Effect of sequence 436
variation in meningococcal PorA outer membrane protein on the effectiveness of a hexavalent PorA 437
outer membrane vesicle vaccine. Vaccine 2000 18:2476-2481. 438
22. Rose CE, Romero-Steiner S, Burton RL, Carlone GM, Goldblatt D, Nahm MH, Ashton L, Haston M, 439
Ekstrom N, Haikala R, Kayhty H, Henckaerts I, Durant N, Poolman JT, Fernsten P, Yu X, Hu BT, 440
Jansen KU, Blake M, Simonetti ER, Hermans PWM, and Plikaytis BD. Multilaboratory Comparison 441
of Streptococcus pneumonia Opsonophagocytic Killing Assays and Their Level of Agreement for 442
the Determination of Functional Antibody Activity in Human Reference Sera. Clin. Vaccine 443
Immunol. 2011 18:135–142. 444
on Septem
ber 3, 2018 by guesthttp://cvi.asm
.org/D
ownloaded from

19
23. Sadarangani M, Pollard AJ. Serogroup B meningococcal vaccines-an unfinished story. Lancet Infect 445
Dis. 2010 Feb;10(2):112-24. 446
24. Snape MD, Medini D, Halperin SA, DeTora L, Drori J, Moxon ER. The challenge of post-447
implementation surveillance for novel meningococcal vaccines, Vaccine 2012, in press 448
25. Su EL, Snape MD. A combination recombinant protein and outer membrane vesicle vaccine against 449
serogroup B meningococcal disease. Expert Rev Vaccines. 2011 May;10(5):575-88. 450
26. Tan LK, Carlone GM, Borrow R. Advances in the development of vaccines against Neisseria 451
meningitidis. N Engl J Med. 2010 Apr 22;362(16):1511-20. 452
27. Tappero JW, Lagos R, Ballesteros AM, Plikaytis B, Williams D, Dykes J, Gheesling LL, Carlone 453
GM, Høiby EA, Holst J, Nøkleby H, Rosenqvist E, Sierra G, Campa C, Sotolongo F, Vega J, Garcia 454
J, Herrera P, Poolman JT, and Perkins BA. Immunogenicity of 2 serogroup B outer-membrane 455
protein meningococcal vaccines: a randomized controlled trial in Chile. JAMA 1999 281:1520-1527. 456
457
on Septem
ber 3, 2018 by guesthttp://cvi.asm
.org/D
ownloaded from

20
ACKNOWLEDGMENTS 458
We thank the Active Bacterial Core Surveillance (ABCs) Team and the Emerging Infection Programs (EIP) 459
Network, E. Richard Moxon, Diana Martin and Geoff Hogg for providing N. meningitidis strains used in the 460
present study, Stefania Bambini, Sara Comandi and Maurizio Comanducci for their molecular typing, Fabio 461
Rigat for useful discussions. 462
463
on Septem
ber 3, 2018 by guesthttp://cvi.asm
.org/D
ownloaded from

21
TABLE LEGENDS 464
Table 1. Laboratories A-G participating in the inter-laboratory study and the number of strains assayed at 465
two temperatures for bacterial lysate preparation. The number of strains with assayed values above LLOQ 466
that define the core of reference MATS isolates appear in parenthesis. 467
Table 2. Relative potency (RP) comparison between laboratories for accuracy (Ca), precision (Pearson’s r) 468
and concordance correlation coefficient (rc) combined over antigens for Labs A-G. Predicted RPs were 469
obtained for Labs A-G by sample within an antigen for each series of replicate values using random-effects 470
ANOVA models. N represents the number of strains in common over the three antigens with a maximum of 471
35 (10-fHbp + 17-NHBA + 8-NadA). 472
473
on Septem
ber 3, 2018 by guesthttp://cvi.asm
.org/D
ownloaded from
22
Table 1. 474
475
Laboratory fHbp NHBA NadA
37⁰C* 45⁰C* 37⁰C* 45⁰C* 37⁰C* 45⁰C*
A 10 (10) 2 (2) 17 (17) 6 (6) 8 (8) 3 (3)
B 13 (10) 3 (2) 17 (17) 6 (6) 8 (8) 3 (3)
C 17 (10) 12 (10) 17 (17) 17 (17) 10 (9) 7 (7)
D 16 (10) 1 (1) 17 (17) 6 (6) 8 (8) 2 (2)
E 10 (10) 2 (2) 17 (17) 6 (6) 8 (8) 2 (2)
F 17 (10) 0 (0) 16 (16) 0 (0) 8 (8) 0 (0)
G 0 (0) 15 (11) 0 (0) 17 (17) 0 (0) 13 (11)
476
*Lysate preparation temperature 477
478
479
480
on Septem
ber 3, 2018 by guesthttp://cvi.asm
.org/D
ownloaded from

23
Table 2. 481
482
Statistic Lab B Lab C Lab D Lab E Lab F Lab G
Lab A
N 35 35 35 35 34 35
Accuracy (Ca) 0.995 0.997 0.996 0.996 0.999 0.999
Precision (r) 0.997 0.999 0.995 0.998 0.997 0.997
CCC (rc) 0.992 0.996 0.991 0.995 0.996 0.995
(95% CI) (0.986, 0.996) (0.993, 0.998) (0.984, 0.995) (0.99, 0.997) (0.992, 0.998) (0.991, 0.998)
Lab B
N
35 35 35 34 35
Accuracy (Ca) 0.999 1 1 0.998 0.999
Precision (r) 0.998 1 1 0.998 1
CCC (rc) 0.998 1 1 0.996 0.999
(95% CI) (0.996, 0.999) (0.999, 1) (1, 1) (0.993, 0.998) (0.998, 0.999)
Lab C
N
35 35 34 35
Accuracy (Ca) 0.999 1 0.999 0.999
Precision (r) 0.997 0.999 0.999 0.998
CCC (rc)
0.996 0.999 0.999 0.997
(95% CI) (0.993, 0.998) (0.997, 0.999) (0.998, 0.999) (0.995, 0.999)
Lab D
N
35 34 35
Accuracy (Ca) 1 0.998 0.999
Precision (r) 0.999 0.998 1
CCC (rc)
0.999 0.996 0.999
(95% CI) (0.998, 1) (0.993, 0.998) (0.999, 1)
Lab E
N
34 35
Accuracy (Ca) 0.999 0.999
Precision (r) 0.998 1
CCC (rc)
0.997 0.999
(95% CI) (0.995, 0.998) (0.999, 1)
Lab F
N
34
Accuracy (Ca) 0.999
Precision (r) 0.999
CCC (rc)
0.998
(95% CI) (0.996, 0.999)
483
on Septem
ber 3, 2018 by guesthttp://cvi.asm
.org/D
ownloaded from
24
FIGURE LEGENDS 484
485 Figure 1. Reference MATS Strains and Robustness of Positive Bactericidal Thresholds (PBTs). For fHbp 486
(A), NHBA (B) and NadA (C). Boxplots show the median and interquartile range of RPs collected during 487
the present study, combined over labs A-G. Vertical lines extend to the most extreme observation that is 488
<1.5×the interquartile distance (75th – 25th percentiles). Each box represents all replicate assay data for each 489
strain and antigen combined over all laboratories. Dashed and solid horizontal lines indicate PBT and 95% 490
CIs for derived according to Eq. 1. 491
Figure 2. Comparison of relative potencies (RP) at two temperatures for bacterial lysate preparation. For the 492
five laboratories (A-E) that assayed the strains at both temperatures, predicted RPs were derived for each 493
laboratory, strain, antigen, and temperature combination (N = 75 pairs). The line of identity represents 494
perfect agreement (intercept=0; slope=1). 495
Figure 3. Scatter plots of pair-wise comparisons of relative potency(RP) values derived from ANOVA 496
models adjusting for laboratory (A-G), antigen, and lysate preparation temperature, from the replicate RPs 497
submitted for analysis. Data are combined over antigens and plotted on a log10 scale. Predicted RPs were 498
derived from ANOVA random-effects models. The number of strains in common between any two 499
laboratories is listed in Table 2. The solid line indicates perfect agreement (intercept = 0, slope = 1). 500
Figure 4. A) Box plots by antigen and laboratory (A-G) for the fold difference between the consensus and 501
observed relative potencies (RPs). Consensus RPs were estimated for each strain and antigen using a 502
random-effects ANOVA model. The box is defined by the 25th and 75th percentiles of the distribution; the 503
horizontal line in the box represents the median (50th percentile) and the star (*) signifies the mean. Vertical 504
lines extend to the most extreme observation that is <1.5×the interquartile distance (75th – 25th percentiles). 505
Diamonds and small boxes (◊,☐) correspond to moderate and severe outlying assay values, respectively. 506
Each box represents the distribution of all replicate data for all strains within a laboratory and antigen. B) 507
Plots of within-laboratory CV by antigen derived using random-effects ANOVA models. C) Plots of within-508
strain CV by antigen using random-effects ANOVA models. For fHbp, NadA, and NHBA, strains are 509
plotted on the x-axis using consensus RPs derived from ANOVA models. 510
on Septem
ber 3, 2018 by guesthttp://cvi.asm
.org/D
ownloaded from
H44/76
A B C
M01-240149
M01390
NZ98/254
M01390
NZ98/254
M01-240149
H44/76
961-5945
5/99
5/99
961-5945
on Septem
ber 3, 2018 by guesthttp://cvi.asm
.org/D
ownloaded from

Mean log
10 r
esults a
t 45°C
Mean log10 results at 37°C
on Septem
ber 3, 2018 by guesthttp://cvi.asm
.org/D
ownloaded from
Lab A
Lab B Lab FLab ELab DLab C Lab G
Lab B
Lab F
Lab E
Lab D
Lab C
on Septem
ber 3, 2018 by guesthttp://cvi.asm
.org/D
ownloaded from