Embed Size (px)
Citation preview

Collaborative Study and Paired Test Taking in Collegiate Level Linear Programming
Instruction
by
N. Faye Angel
B. June Schmidt, Chair
Division of Vocational and Technical Education
(ABSTRACT)
The purpose of this investigation was to examine the effects of collaborative
learning strategies on formulating solutions to linear programming word problems
that were designed to incorporate problem-solving skills. Forty-six students majoring
in business at a small southwest college in Virginia participated in the study. After an
instruction session, a study period, and a question and answer discussion,
participants completed the test instrument based upon random assignment to three
treatment groups. These included individual study with individual test taking (control),
paired study with individual test taking, and paired study with paired test taking. All
participants returned in 17 days to complete a posttest individually having received no
further instruction in linear programming theory.
The following null hypothesis was examined: No differences in treatment
means measuring problem-solving abilities would be found based on students’ test
and posttest scores using two treatment groups of collaborative study, with
collaborative or individual test taking, and a control group of individual study with
individual test taking. After satisfying the assumptions of no difference in ability in the
treatment groups, establishing significant influence of ability on test score and
posttest score variables, and establishing homogeneity of regression, an analysis of
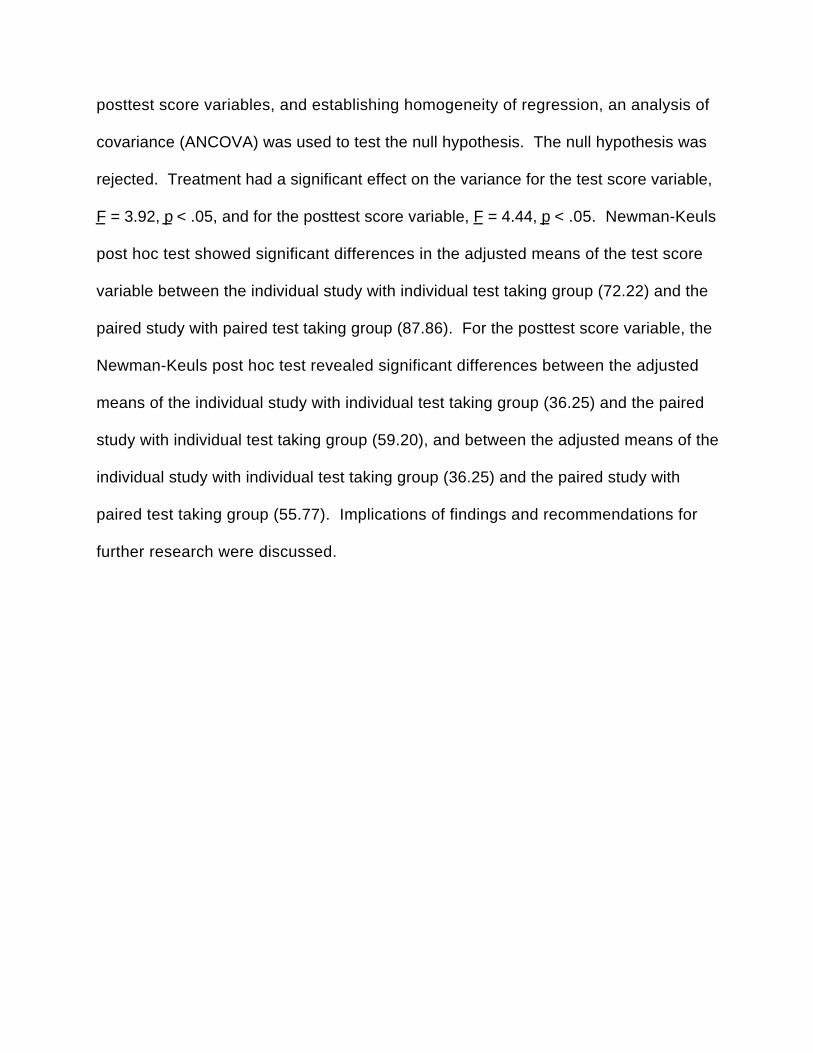
covariance (ANCOVA) was used to test the null hypothesis. The null hypothesis was
rejected. Treatment had a significant effect on the variance for the test score variable,
F = 3.92, p < .05, and for the posttest score variable, F = 4.44, p < .05. Newman-Keuls
post hoc test showed significant differences in the adjusted means of the test score
variable between the individual study with individual test taking group (72.22) and the
paired study with paired test taking group (87.86). For the posttest score variable, the
Newman-Keuls post hoc test revealed significant differences between the adjusted
means of the individual study with individual test taking group (36.25) and the paired
study with individual test taking group (59.20), and between the adjusted means of the
individual study with individual test taking group (36.25) and the paired study with
paired test taking group (55.77). Implications of findings and recommendations for
further research were discussed.

iv
DEDICATION
This dissertation is dedicated to my family who have provided me with untiring
support. My husband, Gary, and two children, Stuart and Brynn, found a level of
patience and understanding for which I will always be grateful. And to my wonderful
parents, Robert and Bernadine Stephens, who gave me the confidence to reach my
goals by always insisting that I could accomplish anything. To all of you, I extend my
love and gratitude.

v
ACKNOWLEDGEMENTS
I wish to thank my advisor and committee chair, Dr. B. June Schmidt, for her
guidance during the completion of this study. She kept me focused and always
forward-headed. I am fortunate to have such an outstanding committee chair. I owe
special appreciation to Dr. James Hoerner, Dr. Susan Magliaro, Dr. Kusum Singh,
and Dr. Daisy Stewart for their valuable contributions to this investigation and my
academic progress during the completion of my program of study. I also want to
thank Dr. Jane Abraham for her insightful comments when she served as a member
of the defense committee and the late Dr. Nevin Frantz who was always an inspiration
and made anything seem possible.
Special appreciation is extended to Mr. James Foreman who served as the
second grader for the test and posttest. His countless hours and rigorous dedication
to detail were instrumental to the successful completion of this dissertation.
Finally, I wish to thank the library staff at Ferrum College, in particular Ms.
Susan Stephenson and Mr. George Loveland. They never tired of helping me locate
information and obtaining countless interlibrary loans that made this study richer and
more meaningful.
vi
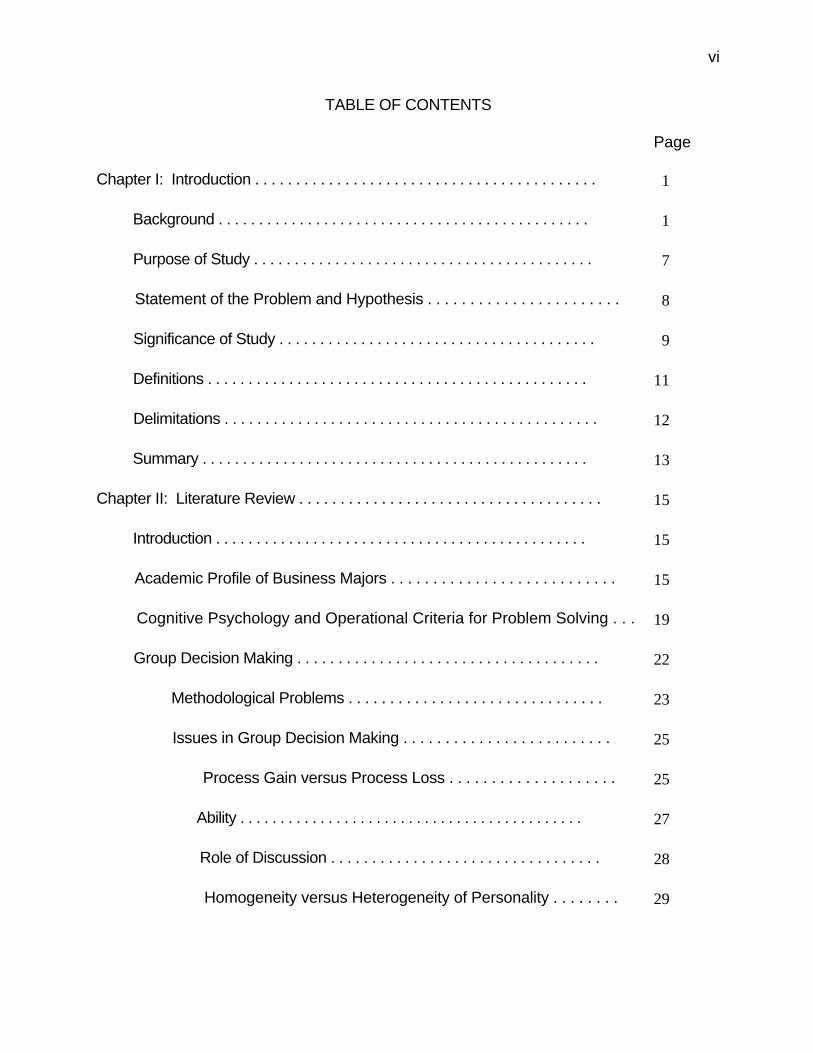
TABLE OF CONTENTS
Page
Chapter I: Introduction . . . . . . . . . . . . . . . . . . . . . . . . . . . . . . . . . . . . . . . . . . 1
Background . . . . . . . . . . . . . . . . . . . . . . . . . . . . . . . . . . . . . . . . . . . . . . 1
Purpose of Study . . . . . . . . . . . . . . . . . . . . . . . . . . . . . . . . . . . . . . . . . . 7
Statement of the Problem and Hypothesis . . . . . . . . . . . . . . . . . . . . . . . 8
Significance of Study . . . . . . . . . . . . . . . . . . . . . . . . . . . . . . . . . . . . . . . 9
Definitions . . . . . . . . . . . . . . . . . . . . . . . . . . . . . . . . . . . . . . . . . . . . . . . 11
Delimitations . . . . . . . . . . . . . . . . . . . . . . . . . . . . . . . . . . . . . . . . . . . . . . 12
Summary . . . . . . . . . . . . . . . . . . . . . . . . . . . . . . . . . . . . . . . . . . . . . . . . 13
Chapter II: Literature Review . . . . . . . . . . . . . . . . . . . . . . . . . . . . . . . . . . . . . 15
Introduction . . . . . . . . . . . . . . . . . . . . . . . . . . . . . . . . . . . . . . . . . . . . . . 15
Academic Profile of Business Majors . . . . . . . . . . . . . . . . . . . . . . . . . . . 15
Cognitive Psychology and Operational Criteria for Problem Solving . . . 19
Group Decision Making . . . . . . . . . . . . . . . . . . . . . . . . . . . . . . . . . . . . . 22
Methodological Problems . . . . . . . . . . . . . . . . . . . . . . . . . . . . . . . 23
Issues in Group Decision Making . . . . . . . . . . . . . . . . . . . . . . . . . 25
Process Gain versus Process Loss . . . . . . . . . . . . . . . . . . . . 25
Ability . . . . . . . . . . . . . . . . . . . . . . . . . . . . . . . . . . . . . . . . . . . 27
Role of Discussion . . . . . . . . . . . . . . . . . . . . . . . . . . . . . . . . . 28
Homogeneity versus Heterogeneity of Personality . . . . . . . . 29
vii
Cooperative and Collaborative Learning . . . . . . . . . . . . . . . . . . . . . . . . 31
Cooperative Learning . . . . . . . . . . . . . . . . . . . . . . . . . . . . . . . . . . 32
Collaborative Learning . . . . . . . . . . . . . . . . . . . . . . . . . . . . . . . . . 38
Differences in Cooperative and Collaborative Learning . . . . . . . . 42
Summary . . . . . . . . . . . . . . . . . . . . . . . . . . . . . . . . . . . . . . . . . . . . . . . . . 45
Chapter III: Methodology . . . . . . . . . . . . . . . . . . . . . . . . . . . . . . . . . . . . . . . . 47
Participants . . . . . . . . . . . . . . . . . . . . . . . . . . . . . . . . . . . . . . . . . . . . . . . 48
Instructional Treatment . . . . . . . . . . . . . . . . . . . . . . . . . . . . . . . . . . . . . . 49
Test Instrument . . . . . . . . . . . . . . . . . . . . . . . . . . . . . . . . . . . . . . . . . . . . 52
Test Administration . . . . . . . . . . . . . . . . . . . . . . . . . . . . . . . . . . . . . . . . . 54
Posttest Administration . . . . . . . . . . . . . . . . . . . . . . . . . . . . . . . . . . . . . . 55
Pilot Study . . . . . . . . . . . . . . . . . . . . . . . . . . . . . . . . . . . . . . . . . . . . . . . . 56
Data Analysis . . . . . . . . . . . . . . . . . . . . . . . . . . . . . . . . . . . . . . . . . . . . . 57
Summary . . . . . . . . . . . . . . . . . . . . . . . . . . . . . . . . . . . . . . . . . . . . . . . . . 57
Chapter IV: Results . . . . . . . . . . . . . . . . . . . . . . . . . . . . . . . . . . . . . . . . . . . . 59
Demographics . . . . . . . . . . . . . . . . . . . . . . . . . . . . . . . . . . . . . . . . . . . . . 59
Second Grader and Test/Posttest Scores . . . . . . . . . . . . . . . . . . . . . . . . 59
Comments on Recorded Collaborative Study and Test Taking . . . . . . . 61
Data Analysis . . . . . . . . . . . . . . . . . . . . . . . . . . . . . . . . . . . . . . . . . . . . . 63
No Significance in Ability Means for Treatment Groups . . . . . . . . . 64
Significance of Ability Covariate . . . . . . . . . . . . . . . . . . . . . . . . . . . 64
viii
Homogeneity of Regression . . . . . . . . . . . . . . . . . . . . . . . . . . . . . . 69
Significance of Treatment . . . . . . . . . . . . . . . . . . . . . . . . . . . . . . . 69
Summary . . . . . . . . . . . . . . . . . . . . . . . . . . . . . . . . . . . . . . . . . . . . . . . . . 75
Chapter V: Summary, Implications, Recommendations, and Conclusion . 77
Summary . . . . . . . . . . . . . . . . . . . . . . . . . . . . . . . . . . . . . . . . . . . . . . . . . 77
Implications of Findings . . . . . . . . . . . . . . . . . . . . . . . . . . . . . . . . . . . . . 79
Test Score Variable Results . . . . . . . . . . . . . . . . . . . . . . . . . . . . . . 80
Differences between the Individual Study with Individual Test
Taking and Paired Study with Paired Test Taking . . . . . . . . . . . 80
Differences between the Individual Study with Individual Test
Taking and Paired Study with Individual Test Taking . . . . . . . . 82
Differences between the paired study with individual test
taking and paired study with paired test taking . . . . . . . . . . . . . 82
Posttest Score Variable Results . . . . . . . . . . . . . . . . . . . . . . . . . . . 83
Differences between the Individual Study with Individual Test
Taking and Paired Study with Paired Test Taking . . . . . . . . . . . 83
Differences between the Individual Study with Individual Test
Taking and Paired Study with Individual Test Taking . . . . . . . . 85
Differences between the paired study with individual test
taking and paired study with paired test taking . . . . . . . . . . . . . 85
General Issues Associated with Collaborative Strategies . . . . . . . 87

ix
Recommendations for Further Research . . . . . . . . . . . . . . . . . . . . . . . . 88
Ethnicity and Gender . . . . . . . . . . . . . . . . . . . . . . . . . . . . . . . . . . . 89
Enhanced Learning for Drill and Practice Items . . . . . . . . . . . . . . . 89
Effect upon Problem Solving in Other Disciplines . . . . . . . . . . . . . 90
Other Treatments . . . . . . . . . . . . . . . . . . . . . . . . . . . . . . . . . . . . . . 91
Perceptions of Students . . . . . . . . . . . . . . . . . . . . . . . . . . . . . . . . . 93
Conclusion . . . . . . . . . . . . . . . . . . . . . . . . . . . . . . . . . . . . . . . . . . . . . . . 93
References . . . . . . . . . . . . . . . . . . . . . . . . . . . . . . . . . . . . . . . . . . . . . . . . . . . 98
Appendix A: Types of Knowledge in Test and Posttest Conforming to
Problem Solving Criteria . . . . . . . . . . . . . . . . . . . . . . . . . . . . . . 104
Appendix B: Model Formulation Instructions . . . . . . . . . . . . . . . . . . . . . . . . . 107
Appendix C: Linear Programming Study Problems . . . . . . . . . . . . . . . . . . . . 117
Appendix D: Instrument for Test . . . . . . . . . . . . . . . . . . . . . . . . . . . . . . . . . . . 124
Appendix E: Criteria to Evaluate Performance on Test Instrument . . . . . . . . 129
Appendix F: Grades Assigned and Reconciled by Researcher and Second
Grader . . . . . . . . . . . . . . . . . . . . . . . . . . . . . . . . . . . . . . . . . . . . 131
Appendix G: Recorded Times for Completing Test . . . . . . . . . . . . . . . . . . . . 134
Appendix H: Instrument for Posttest . . . . . . . . . . . . . . . . . . . . . . . . . . . . . . . . 137
Appendix I: Pledge . . . . . . . . . . . . . . . . . . . . . . . . . . . . . . . . . . . . . . . . . . . . . 142
Appendix J: Recorded Times for Completion of Posttest . . . . . . . . . . . . . . . . 144
Appendix K: Criteria to Evaluate Performance on Posttest Instrument . . . . . 147

x
Vita . . . . . . . . . . . . . . . . . . . . . . . . . . . . . . . . . . . . . . . . . . . . . . . . . . . . . . . . . 149

xi
LIST OF TABLES
Page
Table 1: Differences in Cooperative and Collaborative Learning . . . . . . . . . . . 43
Table 2: Demographic Composition of Treatment Groups . . . . . . . . . . . . . . . . 60
Table 3: Analysis of Variance for Ability (Covariate) and Treatment Levels . . 65
Table 4: Analysis of Covariance for Test. . . . . . . . . . . . . . . . . . . . . . . . . . . . . . 66
Table 5: Analysis of Covariance for Posttest . . . . . . . . . . . . . . . . . . . . . . . . . . . 67
Table 6: Number of Participants, Range of Scores, and Unadjusted and
Adjusted Means for the Test and Posttest Scores . . . . . . . . . . . . . . 68
Table 7: Analysis of Covariance for Testing the Homogeneity of Regression
for the Three Levels of Treatment for the Test. . . . . . . . . . . . . . . . . . . 70
Table 8: Analysis of Covariance for Testing the Homogeneity of Regression
for the Three Levels of Treatment Groups for the Posttest . . . . . . . . . 71
Table 9: Differences in Means of the Treatment Groups and Results of
Newman-Keuls Post Hoc Test for the Test . . . . . . . . . . . . . . . . . . . . 73
Table 10: Differences in Means of the Treatment Groups and Results of
Newman-Keuls Post Hoc Test for the Posttest . . . . . . . . . . . . . . . . . 74

CHAPTER I
Introduction
A merely well-informed man is the most useless bore on God’searth. . . . Education with inert ideas is not only useless: it is,above all things, harmful. . . . But if education is not useful, what isit? Is it a talent, to be hidden away in a napkin? . . . theoreticalideas should always find important applications within the pupil’scurriculum (Whitehead, 1929, p. 3).
Background
Many businesses share this view of education and think that theoretical
ideas are not always applied in the curriculum of four-year colleges and
universities. A study conducted by the Business Higher Education Forum (1997)
likened the chasm between business and higher education as two continents,
both experiencing considerable movement. Some of these disturbances
resemble violent earthquakes invalidating old rules while leaving no new structure
to take their place. Uncertainty is enhanced as new rules evolve only slowly and
painfully (Reich, 1991; Thurow, 1996). Primary and secondary educational leaders
are well underway with school reform to address workforce needs in the changing
environment (Center for Applied Technology and Career Exporation, 1997;
Lankard, 1995; National Skill Standards Board, n.d.; Reddy, 1997). However,
leading educators and businesspeople agree that institutions of higher education
have been slow to respond to corporate needs. An extensive study, conducted by
Gardiner (1994) for the Association for Study of Higher Education, found that
“crucial skills…are poorly developed in many college and university students” (p.
1). Young, the director of the Potomac Knowledge Way project, makes the point
more bluntly, “…everyone is at the hand-wringing stage: The only way we’re going

2
to get enough people fast enough is if business takes charge” (“Changing
Nature,” 1997, p. 4). However, others (Business Higher, 1997; Reich, 1990;
Useem, 1989) have found that colleges and universities are preparing their
graduates for the work world, at least or perhaps, better than in the past. Having
stated this, employers, employees, and educators find their current efforts
inadequate, given rapid and abrupt work environment changes. They cited such
curricular problems as content brokering, boring lectures, standardized tests, little
group work, compartmentalized disciplines, weak courses and teachers, rote
memorization for learning, and unproductive “busy work” among others (Business
Higher, 1997; Gardiner, 1994; Green & Seymour, 1991; Lankard, 1994).
Baccalaureate degrees have continued to be highly coveted and many
graduates reported that additional education added value to their personal and
professional lives. Surveyed alumni, including graduates from expensive private
institutions, (Business Higher, 1997) reported that the benefits of their
undergraduate education outweighed the costs and provided them with superior
opportunities that helped prepare them for the workplace. “However, most of them
also suggested that their education would have been more useful if their colleges
had done a better job teaching skills needed in the work world” (Business Higher,
p. 31). Graduates from four-year colleges and universities continue to enjoy higher
income levels than other educational groups and have not seen the overall decline
in their standard of living (“American Workers,” 1997; Reich, 1991; Thurow, 1996).
In addition, economic development, workforce preparation, human capital
(measured by the percent of the population with a college degree), and income

3
growth of city residents have been tightly intertwined with postsecondary
education, including an increase of 2.8% in productivity for each year of additional
education (“High Stakes, High Skills,” 1997).
Although a four-year college degree is an important credential in one’s job
portfolio, it no longer guarantees a “good” job. Organizational infrastructures have
become flatter and workers at all levels continue to be held increasingly
accountable for what they know how to do. “Degrees are less important than
competencies…Today’s Web masters, for example, didn’t learn their craft in any
degreed program; they’re largely self-taught” (“High Stakes, High Skills,” p. 4). As
evidence of this trend, the share of the postsecondary market garnered by four-
year institutions is shrinking while community college share is flat, and the share
for proprietary schools awarding certificates is increasing (“Who’s Training
Technical Workers,” 1997). Companies want performers with a strong knowledge
base. Esther Lam, vice president of human resource at Itel Containers
International Corporation, emphasized:
We are not interested in hiring technicians, people who have managed tocram enough facts in their head to pass an accounting or managementexam. The degree…doesn’t impress me. It is the skills that they haveacquired that are key to this company. We look for people who can thinkon their feet…We want people that dig in with a team spirit (Green &Seymour, 1991, p. 17).
The continued vitality of the American economy depends upon college
graduates, among others, possessing competencies and skills that will provide a
seamless transition into the world of work. A review of the literature exposes
numerous recommendations of what these workplace competencies should
include. A long, but incomplete, list could contain critical thinking, problem solving

4
without supervision, technical skills, collaboration, worker autonomy, verbal and
written communication, creativity, interpersonal skills with the ability to work in
diverse teams, and flexibility (American Workers and Economic Change, 1996;
Bridges, 1994; Gardiner, 1994; National Skill Standards Board, 1994; Useem,
1989; “High Stakes, High Skills,” 1997; Wall, 1998). Regardless of the source,
problem solving and collaboration/teamwork, the focus of this study, were
considered necessary to be successful in the workplace.
The skill of problem solving has become so important that some
companies place higher significance on it than on having knowledge of their
industry (Green & Seymour, 1991). As job descriptions blur and specific sets
of work quickly enter and exit the work place, the ability to understand the
relationship between situational variables in order to facilitate creative
solutions is crucial. Workers in the 21st century will be required to analyze and
integrate data into knowledge. Mathematical algorithms and scientific
principles remain important tools in problem solvers’ arsenals and the ability
to use them pivotal to their success. Reich (1991) wrote of symbolic analysts,
[they] solve [and] identify problems by manipulating the symbols. Theysimplify reality into abstract images that can be rearranged, juggled,experimented with, communicated to other specialists, and then,eventually, transformed back into reality. The manipulations are donewith analytic tools…(p. 178).
In an attempt to select employees with complex problem-solving skills
and strong analytic abilities, an increasing number of companies use the
“analytic interview.” It is not unusual to hear about a job candidate being
placed in a room with some eclectic material and instructed to “do something

5
with it.” In order for college graduates to make a successful transition to the
world of work, they must be “able to take data from several different sources
and combine them into new and interesting combinations” (Bridges, 1994, p.
86).
Reich (1991) equates collaboration with teamwork and communicating
abstract ideas to others. While other countries have successfully
implemented self-managed teams, much work remains to be done in many
American organizations. Businesses and nonprofit companies continue to
spend millions of dollars in an attempt to inculcate the advantages of
collaboration and teamwork. However, concepts of rugged individualism and
authoritarian management styles interfere with progress in this arena.
At Southwest Airlines collaboration is indistinguishable from leadership
where “leadership is practiced through collaborative relationships” (Frieberg &
Frieberg, 1996). This partnership binds workers at all levels, not just to be
effective problem solvers, but to reach higher levels of motivation and
development. All individuals become an integral part of the organization and
peer learning is enhanced. For the Matsushita Electric Industrial Company
(Panasonic), collaboration and teamwork have become ingrained into its
corporate culture. Speaking to U.S. business leaders in 1979, Konosuke
Matsushita, chairman of Panasonic, outlined the differences between
Japanese and American management.
For us [in Japan], the core of management is…pulling together theintellectual resources of all employees….Because we [in Japan] haveexamined [better than our U. S. counterparts] the scope of the new…challenges….Only by drawing on the combined brainpower of all its

6
employees can a firm face up to the turbulence and constraints oftoday’s environment (Green & Seymour, 1991, p. 63).
Nevertheless, “the ability to function together as a single unit is essential”
(Green & Seymour, 1991, p. 70) if American companies are to be competitive
in the rapidly changing global economy.
Many leading educators and businesspeople believe that spanning the
chasm and making the academic connections are essential components for
successful transition from college to a high-performance work environment.
Echoed throughout the literature was the need for college graduates to be better
prepared to work and solve problems collaboratively in self-managed teams.
Currently, the majority of students sit quietly in lecture-based courses, completing
course requirements individually, memorizing facts and statistics to be
regurgitated on a standard test being taught by professors whose educational
experiences have been very similar to this scenario (Business Higher, 1997;
Boyett & Boyett, 1995; Green & Seymour, 1991; Reich, 1991). This chasm will only
be narrowed by altering the curriculum; however, few are proposing radical
changes. The task force on high performance work and workers suggested that
“corporate needs can be satisfied by making relatively modest curricular
adjustments” (Business Higher, 1997, p. 23). This reference noted, for example,
that although individual competition has been strongly encouraged on college
campuses, it is antagonistic to the collaborative abilities and teamwork needed in
the corporate world. Hoerner (1995) has been critical of the no help, no sharing of
knowledge approach that occurs in classrooms of higher education and
recommended several methods for upgrading curriculum to make it more relevant
7
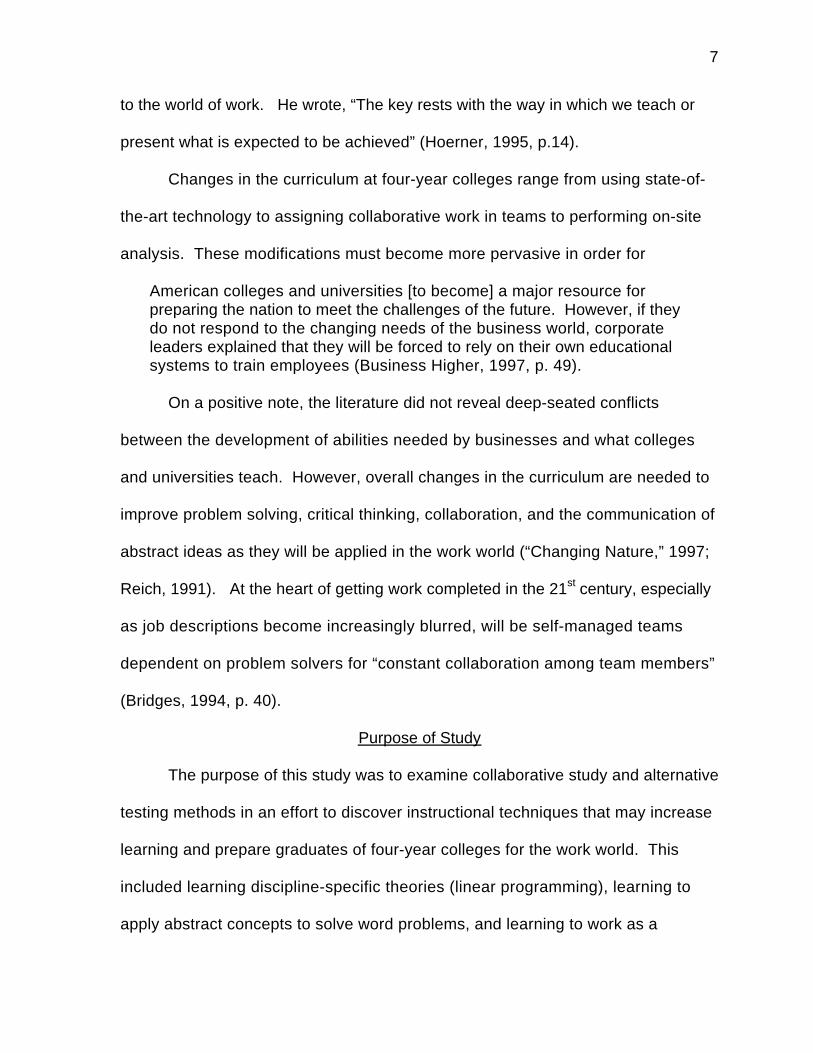
to the world of work. He wrote, “The key rests with the way in which we teach or
present what is expected to be achieved” (Hoerner, 1995, p.14).
Changes in the curriculum at four-year colleges range from using state-of-
the-art technology to assigning collaborative work in teams to performing on-site
analysis. These modifications must become more pervasive in order for
American colleges and universities [to become] a major resource forpreparing the nation to meet the challenges of the future. However, if theydo not respond to the changing needs of the business world, corporateleaders explained that they will be forced to rely on their own educationalsystems to train employees (Business Higher, 1997, p. 49).
On a positive note, the literature did not reveal deep-seated conflicts
between the development of abilities needed by businesses and what colleges
and universities teach. However, overall changes in the curriculum are needed to
improve problem solving, critical thinking, collaboration, and the communication of
abstract ideas as they will be applied in the work world (“Changing Nature,” 1997;
Reich, 1991). At the heart of getting work completed in the 21st century, especially
as job descriptions become increasingly blurred, will be self-managed teams
dependent on problem solvers for “constant collaboration among team members”
(Bridges, 1994, p. 40).
Purpose of Study
The purpose of this study was to examine collaborative study and alternative
testing methods in an effort to discover instructional techniques that may increase
learning and prepare graduates of four-year colleges for the work world. This
included learning discipline-specific theories (linear programming), learning to
apply abstract concepts to solve word problems, and learning to work as a
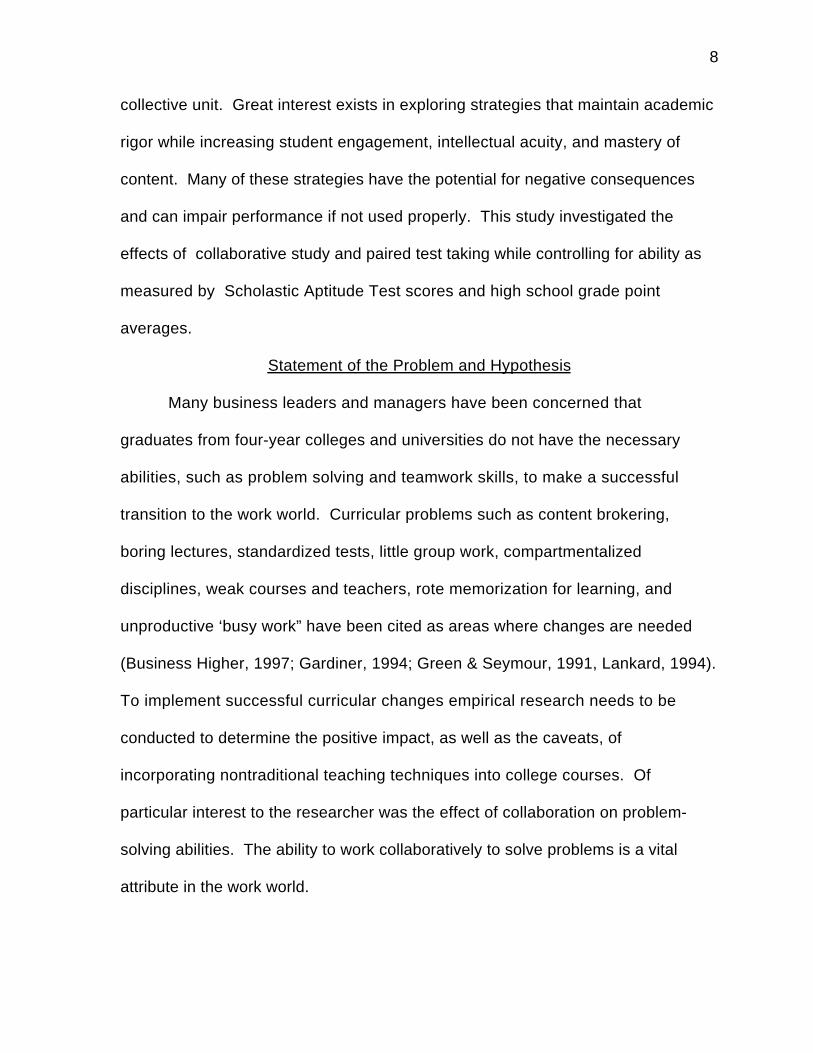
8
collective unit. Great interest exists in exploring strategies that maintain academic
rigor while increasing student engagement, intellectual acuity, and mastery of
content. Many of these strategies have the potential for negative consequences
and can impair performance if not used properly. This study investigated the
effects of collaborative study and paired test taking while controlling for ability as
measured by Scholastic Aptitude Test scores and high school grade point
averages.
Statement of the Problem and Hypothesis
Many business leaders and managers have been concerned that
graduates from four-year colleges and universities do not have the necessary
abilities, such as problem solving and teamwork skills, to make a successful
transition to the work world. Curricular problems such as content brokering,
boring lectures, standardized tests, little group work, compartmentalized
disciplines, weak courses and teachers, rote memorization for learning, and
unproductive ‘busy work” have been cited as areas where changes are needed
(Business Higher, 1997; Gardiner, 1994; Green & Seymour, 1991, Lankard, 1994).
To implement successful curricular changes empirical research needs to be
conducted to determine the positive impact, as well as the caveats, of
incorporating nontraditional teaching techniques into college courses. Of
particular interest to the researcher was the effect of collaboration on problem-
solving abilities. The ability to work collaboratively to solve problems is a vital
attribute in the work world.

9
This experimental study was conducted to examine the influence of
collaborative study and paired test taking on problem-solving development and
group-to-individual transfer within a discipline-specific domain while controlling for
ability. By applying their collective knowledge, students should acquire a more
thorough understanding of the concepts and domain-specific content, increasing
individual mastery of the desired competencies. The target population was
business students at a four-year, liberal arts college. Linear programming theory
was selected as the domain because it is a required core course in the business
curriculum and presents a formidable challenge for many business majors. The
following null hypothesis was tested: No differences in treatment means
measuring problem-solving abilities would be found based on students’ test and
posttest scores using two treatment groups of collaborative study, with
collaborative or individual test taking, and a control group of individual study with
individual test taking.
Significance of the Study
In the college classroom, collaborative learning continues to be the
exception, while lecture, individual study, and individual test taking persist as the
norm. This entrenched educational paradigm is preserved by faculty and college
administrators who continue to “do business as usual.” As discussed previously,
the passive learning model has not been successful for preparing some groups of
students, including many majoring in business, with needed competencies to be
competitive in the global marketplace. Experimentation and innovation in higher
10
education supported by empirical research are needed to develop educationally
sound approaches to learning.
As an instructional strategy, collaborative learning and paired test taking
have the potential to provide students, faculty, and administrators with a
mechanism for developing essential competencies including enhanced problem-
solving abilities and learning to work in teams composed of diverse members.
However few empirical studies, especially at the collegiate level, have been
conducted to establish the most effective ways of using collaborative learning in
the classroom. This investigation examined paired study and paired test taking
and the effect of collaboration on group-to-individual transfer. This study will
contribute to an accumulating body of knowledge of collaborative learning. It has
specific implications for the following areas:
1. Indicating effectiveness of collaborative learning and paired test taking for
students who frequently encounter difficulty in problem solving with traditional
instructional methods.
2. Understanding the impact of group-to-individual transfer for collaborative paired
groups to determine if students both increase their understanding of the
content and their ability to solve problems.
3. Indicating value of collaborative learning and paired test taking for students of
varying ability levels. This information will help instructors determine whether
to use collaborative learning and paired test taking.
11
4. Exploring the level of responsibility that students can assume for their learning
and the level of authority that instructors can allot to students studying
collaboratively and taking tests in pairs.
5. Using outcomes as a basis for establishing instructional policy related to
collaborative study and paired test taking.
6. Aiding in establishing professional development programs that will assist
prospective and practicing teachers in the implementation of collaborative
study and paired test taking.
7. Providing guidelines for curriculum design as educational institutions at all
levels are searching for instructional strategies that encourage students to be
actively involved in learning.
Definitions
Many of the words and phrases used in this study have multiple meanings
and some are being used for the first time. To clarify the meanings of these words
and phrases and provide a common basis of understanding, definitions as they
applied to this study are provided below:
1. Collaborative learning: Two or more students mutually engaged in mastering
a particular set of concepts to achieve a common goal in an unstructured
learning environment (Bruffee, 1994; Gokhale, 1995; Rau & Heyl, 1990;
Schrage, 1990). It frequently requires that learners participate in oral
discussion.
2. Individualized study: Students receive no assistance from a peer or instructor
during the study sessions when solving linear programming word problems.

12
3. Individualized test taking: Each student in the control group will complete a
criterion-referenced test with no human or other resource assistance.
4. Paired or collaborative study: Two students collaborating during a study
session.
5. Paired test taking: Two students collaborating on taking a criterion-referenced
test where one grade is assigned to both students.
6. Problem solving: Students analyzing word problems, formulating them into
mathematical models, and understanding their comparison relationships
(Snow & Lohman, 1989; Mayer, 1983; Trabasso, 1977). For this study, linear
programming theory was used to formulate mathematical models from word
problems.
Delimitations
The participants in the pilot, treatment, and control groups were selected as
a convenience sample. They were students taking required classes in the
business curriculum at a liberal arts college in southwest Virginia. Their
participation was on a volunteer basis, and they received bonus points for
completing the requirements of the study. Thus, the generalizability of the results
was limited. Although the participants were not randomly selected, they were
randomly assigned to the treatment and control groups. Further, the lack of being
able to conduct the study within an actual classroom resulted in a simulated
environment. Laboratory environments seldom capture dynamics of actual
situations.

13
Another delimitation of this study was that very little has been formally
undertaken with collaborative paired study and paired test taking, especially at the
four-year college level. The study, therefore, was exploratory and attempted to add
knowledge to the area of collaborative study and achievement testing by identifying
some of the salient characteristics of this instructional technique. Collaborative
learning has been a recent arrival to higher education and the theoretical base has
not been established. To confound further the application of collaboration, some
researchers have discussed it as simply mutual engagement for a common
cause (Gokhale, 1995), while others have interwoven it with epistemology and the
meaning of knowledge (Brufee, 1995; Romer & Whipple, 1991). Gamson (1994),
one of the first proponents of collaborative learning, wrote that there has been no
“theoretical basis for understanding how and why [the effects] occur. It is time for
us to explore some promising theoretical approaches that might help make sense
of the effects of collaboration” (p. 6). As sound research accumulates, theoretical
approaches can be explored to explain and provide additional insights into the
effects of collaborative learning. Given the other delimitations of the study, this
lack of an established theoretical framework has suggested that the results of this
study must be interpreted with caution.
Summary
American businesses must compete in the world marketplace and having
poorly prepared college graduates as managers and decision makers can only
lead to a disadvantaged position for those businesses. As Whitehead (1929)
suggested in the opening quote to this chapter, inert ideas or those ideas that
14
cannot be applied are not only useless, they are harmful. Instructional innovation
and experimentation are needed in higher education to develop pedagogies that
will help baccalaureate degree students majoring in business acquire essential
workplace skills. Collaborative study and paired test taking may offer a strategy to
increase learning, augment problem-solving skills, facilitate successful teamwork,
and prepare for the work world.
Little research on the effects of collaboration on learning, problem solving,
and facilitating teamwork has been undertaken at the collegiate level. Thus, this
investigation studied the outcomes of individual study with individual test taking,
paired study with individual test taking, and paired study with paired test taking for
students majoring in business at a four-year college. Its results should contribute
to the accumulating body of knowledge on the effects of collaboration in general as
well as for students continuing their postsecondary education at a baccalaureate
institution.
15
CHAPTER II
Review of Literature
School achievement is no longer to be understood as simply theaccretion of facts and content specific skills. Certainly, bits andamorphous masses of information are internalized, and specifichabits of thought and action are acquired. But educational learning isnot just cumulative in the old associationistic sense; a significant partof the learner’s task is continually to assemble, reassemble,structure, and tune the cumulating body of knowledge into functionalsystems for use in thought, and in further learning (Snow, 1980, p.43).
Introduction
This study focused on collaborative learning in a collaborative study and
paired test taking environment involving problem-solving abilities. The literature
review examined the academic profile of business majors at four-year colleges,
cognitive psychology and measurement of problem-solving abilities, group
decision making, and cooperative and collaborative learning.
Academic Profile of Business Majors
At a time when education in general is being closely scrutinized, the
academic preparation of students majoring in business at four-year colleges has
been increasingly questioned. In a study commissioned by the American
Assembly of Collegiate Schools of Business, Green (1992) asserted “business
draws a smaller proportion of academically talented students than other majors”
(p. 41). A report by the American Assembly of Collegiate Schools of Business
(1992) stated
As a group, business students have lower high school gradesthan students planning to major in the liberal arts andengineering; they are also more likely than their peers in almost allfields . . . to anticipate needing remedial work in English during
16
their college years...During high school, business majors spentless time on homework and more time “partying” than studentsplanning to major in other fields (p. 3).
Additionally, Green’s (1992) research indicated that 25% of business majors
needed remediation in math, only 8.2% did extra reading or classroom work, and
only 40% used the computer frequently (even though this is an essential
competency for business majors). No research surfaced concerning the
narrowing of the academic gap between business graduates and graduates with
other majors. However, business majors scored consistently lower than other
majors on the Graduate Record Examination, Graduate Management Admissions
Test, and Law Scholastic Aptitude Test (Graduate Management Programs, 1995;
Law School Admission Council, 1995), which are taken near or after graduation.
This situation has been problematic since the number of undergraduate
management degrees has more than doubled between the years of 1971 and
1990, business is the most popular undergraduate major, and one-fourth of all
bachelor’s degrees are awarded in business and management. Thus, significant
numbers of four-year college graduates present an academic profile that poses
challenges to academic institutions and perhaps to the workplace.
Although the reasons business majors are not stronger academically are
unclear, Green (1992) offered some additional insights: 38% of freshmen
business majors indicated that they were first generation college attendees and
43% ranked their intellectual self-confidence below all other students, except for
students studying education. “These ‘new students’ to higher education often face
unique challenges in their quest for a degree: conflicting obligations, false

17
expectations, and lack of preparation or support are among the factors that may
hinder their success” (Hsiao, 1992, p. 1). The social origins of many of these first-
generation students include minorities, women, and those from blue-collar
backgrounds. Green (1992) reported that enrollment of minorities in business
programs is over 20% and that women have been entering the major in record
numbers. As Hsiao (1992) wrote about first-generation students, “they…face a
daunting array of challenges in their pursuit of a postsecondary education” (p. 3).
Perhaps this partially explains why business majors rank second on the percent of
students dropping out of college (Green, 1992).
The perceptions of employers have been that business graduates
frequently need additional education or training in academic and workplace skills
before they are able to be significant contributors to the organization (Business
Higher, 1997; Green, 1992; Green & Seymour, 1991; Porter & McKibbin, 1988).
Green and Seymour linked data from Porter and McKibbin (1988) and Useem
(1989) to produce a comparison of employers’ perceptions of the strengths and
weakness of college graduates—business majors compared to liberal arts
majors. It is important to note that although these studies were completed
independently and cannot be directly compared, their findings provided a sense of
what employers think are the attributes that the different majors bring to the
workplace. Both of these studies were based upon surveys with Likert scales
where employers rated each attribute. The Porter and McKibbin study (1988)
investigated employers’ ratings of the perceived major strengths of business
graduates while the Useem study (1989) examined employers’ ratings of the
18
above average qualities of liberal arts graduates. A few comparisons should
illustrate the differences. The highest rating for the business majors was that 38%
of employers thought that their motivation to work was a major strength. However,
only 19% of employers thought that analytic skills were a major strength for
business majors as compared to 43% of employers that found analytic skills to be
an above average quality for liberal arts majors. The gap was wider for
communication skills, 14% and 85% respectively, and leadership skills, 7% and
51% respectively. Green (1992) admitted, “the surveys are not identical. But, in
general terms, the juxtaposition of the Porter-McKibbin and Useem data should
send a chilling message to business school deans and faculty” (p. 91). Thus, the
data suggested that business students who graduate from a four-year college
may not have the abilities to become the problem solvers and decision makers
demanded by the competitive global marketplace in the 21st century.
The data suggest that students majoring in business have an academic
profile similar to at-risk students who do not usually respond positively to the
traditional lecture, passive acquisition of content, and standard individual test
taking after cramming the night before. These are the courses where the
professor functions as a content broker and little else as J. L. Hoerner (personal
communication, April, 1996), a prominent school-to-work advocate, has noted. As
a result, at-risk students frequently do not acquire the basic academic
competencies needed in the workplace.

19
Cognitive Psychology and Operational Criteria for Problem Solving
Because measurement, and specifically collaborative (paired) test taking to
measure problem-solving abilities, was central to this study, cognitive psychology
and testing for educational purposes were reviewed. Historically, tests have
served two broad purposes: to measure aptitude and to measure achievement.
Since aptitude is not the concern of this investigation, it was omitted from the
discussion. The literature review, thus, focused on measuring achievement in a
problem-solving context.
For this study, the impact of collaborative learning on the learner’s
understanding of linear programming knowledge and its application (i.e., problem
solving) was examined through the use of a measurement instrument developed
by the researcher. A review of the literature provided the theoretical base for
developing the instrument to ensure that the appropriate problem-solving
constructs were measured, to provide a basis for reproducing the study, and to
provide operational criteria that allowed the study to move forward in a logical
manner.
Although the literature addressed the influence of studying and working in
groups and pairs on performance as measured by individual test scores
(Gokhale, 1995; Johnson & Johnson, 1991; Rau & Heyl, 1990; Yager, Johnson, &
Johnson, 1985), no studies were uncovered that had paired groups completing a
traditional, in-class test. Measurement of cognitive psychological constructs is still
emerging especially as they relate to achievement testing. In an extensive
literature review, Snow and Lohman (1989) acknowledge that cognitive
20
psychology is not a well-defined discipline and researchers investigate quite
disparate problems. However, cognitive processes incorporate “attention,
perception and memory, thinking, reasoning and problem solving, and the
acquisition, organization, and use of knowledge” (p. 264). Problem solving based
upon mathematical abilities, an essential part of this study, has received
considerable attention from those investigating educational measurement in
cognitive psychology.
Although difficulties determining and measuring problem solving exist, the
work of Mayer (1985), Sadler (1983), Snow and Lohman (1989), and Trabasso
(1977) were synthesized to establish criteria for such assessment. These criteria
were developed to ensure that the measurement instruments used in this study
conformed to well-defined problem-solving criteria. Since evaluating the
performance of college students on linear programming problem-solving tests for
achievement was an essential component in this study, establishing operational
criteria was essential for the reasons outlined by Sadler (1983).
Once criteria are identified, they serve to (1) provide a rationale for thecurrent judgment so that others may understand the reasons, (2)foreshadow future valuations, making them more, but not absolutelypredictable, and (3) invite others to judge similarly. (p. 66)
The first five criteria were based on Mayer’s (1985) work with problem
solving and word problems and the last one on Trabasso’s (1977) investigation of
problem solving and encoding of relational facts. Both emphasize the role that
organized knowledge plays in problem solving. After completing their extensive
literature review, Snow and Lohman (1989) acknowledged that even general
problem-solving capabilities were impacted by the particular knowledge domains.
21
The criteria given below include examples of how they are applicable for
modeling linear programming word problems. As stated earlier, linear
programming word problems were used for this study because they are part of a
required course in the business curriculum at most four-year colleges and
universities.
1. linguistic knowledge such as meaning of words in a business orientedcontext
2. factual knowledge such as units of resources available, resource use,and profit per unit
3. schema knowledge for mathematical problem types such aminimization of cost or maximization of profit
4. strategic knowledge such as resolving what decisions to make anddetermining the use of scarce resources
5. algorithmic knowledge of how to perform an operation such as applyinglinear programming principles to business problems by identifyingdecision variables, developing the objective function, and determiningthe system constraints
6. abstract knowledge such as comparison relationship betweenvariables, resources, and products to be produced
Word problems have presented students with a high level of difficulty that
increased when comparison relations were incorporated into them. “Word
problems are difficult because they require coordination of several different types
of mathematical, linguistic, and world knowledge” (Snow & Lohman, 1989, p. 305).
In addition, several researchers (Mayer, 1985; Snow & Lohman, 1989; Trabasso,
1977) acknowledged that students of all ages have difficulty representing
relational mathematical expressions. Adding abstract knowledge to Mayer’s types
of knowledge needed for problem solving disallowed rote memorization of the
premises as adequate to demonstrate problem-solving abilities. Since
mathematical knowledge has been necessarily abstract, it “depends for its
development on the individual’s ability to understand and manipulate increasingly

22
abstract concepts” (Snow & Lohman, 1989, p. 305) and these include comparison
relationships. Therefore, if instruments have these knowledge criteria
incorporated into word problems, they should measure the ability of the test takers
to employ problem-solving skills. Examples were included in Appendix A showing
how each type of knowledge for problem solving was incorporated into the test and
posttest instruments.
Measurement in cognitive psychology continues to emerge and instructional
theories of testing remain incomplete. Nevertheless, the available literature
provided important criteria for developing achievement instruments to measure
problem solving. Since the test and posttest instruments for this study provided
the data for assessing the impact of collaborative learning on problem-solving
abilities as defined by paired test taking, it was essential that they were
constructed based upon well-defined criteria.
Group Decision Making
Contrary to popular belief, group decision making is not always the optimal
method for solving a problem or increasing performance, and is multifaceted and
quite complex. Societies have used groups to make important decisions
throughout the centuries. In modern times, small groups decide the guilt or
innocence of individuals, who is included or ostracized, what bills are referred to
Congress, etc. However, the issue of whether groups outperform individuals in
various decision making situations has not been resolved, even though many
researchers suggest that they do. Studies reproduced with similar problems,
such as the Painter-Inspector Problem, Thumbs Problem, and NASA Moon

23
Problem have produced conflicting results (Hoffman & Maier, 1961; Salazar, 1995;
Waugh, 1996). One of the reasons may be the lack of control the researchers
exercised over the many and complex variables--methodological problems.
Before discussing these issues involved with group decision making, these
methodological considerations should be examined to put the findings of the
literature review and this study in perspective.
Methodological Problems
One of the problems with studies on group decision making and
performance was the selection of samples. Some were convenience samples
consisting of students in psychology classes at major universities (Goldman,
1965; Hoffman & Maier,1961), some tried to control for confounding variables
through random assignment (Yager, Johnson, & Johnson, 1985), and in others
students chose their own groups (Gokhale, 1995; Webb, Ender, & Lewis, 1995).
The lack of rigor in selecting participants for their studies may have compromised
their findings.
The role of ability was investigated with psychology students at University of
Missouri at Kansas City (Goldman, 1965). However, ability levels were chosen in
an arbitrary manner as students were divided into high, moderate, and low ability
based upon scores received on the Wonderlic Intelligence Test. Yet, ability levels
in these classes were not representative of the population at large. Students who
had been identified as low ability at a major university were significantly above the
ability level of low ability individuals found in the population. Based upon this
24
standardized test score, students were divided equally into the various groups,
without consideration to criteria that would constitute a particular ability level.
Age was another variable that did not seem to receive more than casual
consideration. Sometimes ages were stated (Webb, Ender, & Lewis, 1986) and in
others they were more general such as college-age students (Goldman, 1965;
Hoffman & Maier, 1961) or second-grade students (Yager, Johnson, & Johnson,
1985). Based upon cognitive abilities, as shown with the work of Piaget (1959),
age can make a substantial difference in the performance of certain tasks. Webb,
Ender, and Lewis (1986) conducted a study with students that ranged in age from
11 to 14 involving BASIC computer programming. They discovered that few of the
students used abstract problem-solving abilities as designated by defining
hierarchical planning strategies. An important consideration might be whether this
age group of students is cognitively ready to develop such abstract strategies.
Another serious concern was that very few of the studies have been
conducted in the classroom, many have been done in the laboratory (Goldman,
1965; Hoffman & Maier, 1961; Waugh, 1996). Exceptions include studies by
Johnson, Johnson, and Smith (1991) and Johnson and Johnson (1994) who have
done extensive work with elementary students. However, even their research has
been criticized for its methodological treatment of the participants and data (Slavin,
1990) Others have decision making as a secondary outcome (Johnson and
Johnson, 1985; Klemm, 1994; Slavin, 1990) The concern of these studies was the
more humanistic goals of helping others achieve success whether it is decision
making, learning content, or improving social interaction. Given these problems

25
with research and the complex nature of group decision making, several findings
or counter findings did consistently appear in the literature. These have been
discussed as key features in the next several paragraphs.
Issues in Group Decision Making
An examination of the literature revealed that the effect of group decision
making on performance remains controversial and continues to need empirical
study. Issues that impact group decision making were discussed in subsequent
sections and included process gain versus process loss, the influence of ability,
the role of discussion, and homogeneity versus heterogeneity of personality.
Process gain versus process loss. Much of the literature on group
decision making and performance addressed the extent to which group decisions
were better or worse than would be expected given the abilities of the members of
the group. Numerous studies found one or the other or both. Three excellent
literature reviews served as the basis for much of the information in this section--
Hill (1982), Stasson and Bradshaw (1995), and Salazar (1995). Process gain
occurs when the decisions of the group are superior in quality to the decisions that
would have been made based upon the individual abilities brought to the group.
Process loss occurs when the decisions are of less quality than would have been
predicted based upon the abilities of the members of the group. The decisions
predicted from the “best member” or majority rule models are used to compare the
decisions of the group to determine process gain or process loss.
Salazar (1995) provided support for process gain. Exams given to college
age students as individuals and in groups found a process gain in 97% of the

26
groups with the average gain of about 9% points above the best member. In
solutions given to the NASA Moon Problem, group performance was better than
best member performance only 33% to 72% of the time. Waugh (1996) found
process gain in a majority of the groups he studied after investigating the role of
instruction and consensus in decision making.
Libby, Trotman, and Zimmer (1987) studied the accuracy of loan officers
predicting bankruptcy based upon financial profiles of several companies. The
prediction of the group was inferior to the predictions of the best members. Hill’s
(1982) rather extensive literature review concluded that although groups would
consistently outperform the average member, they would seldom have higher
quality decisions than the best member. This meant process loss occurred when
the best member became part of a group. Hill (1982) proclaimed that individuals
are better at arriving at quality solutions than groups.
Stasson and Bradshaw (1995) found support for both process gain and
process loss when group decision making was employed. Participants were
given a pretest and then immediately divided into groups of five. The test was
either repeated by groups of five or by individuals. When the group contained one
or more members that had correctly solved the problem initially, the group
selected the incorrect answer 14% of the time. Even more surprising was that in
groups that contained only one member that had correctly solved the problem on
the pretest, the group answered incorrectly 35% of the time. The group frequently
outperformed the average member. The groups that outperformed the best

27
member had individuals who had complementary knowledge, so that they could
answer questions that the best member could not answer.
Ability. The studies on the influence of ability on decision making were quite
complex as various ability levels were “mixed and matched” and the findings for
each did not fall into consistent patterns. Goldman (1965) conducted analyses of
data that were collected on undergraduate psychology students who were divided
into paired homogenous ability groups and paired heterogeneous ability groups.
He found that performance was improved for all levels (high, medium, and low) of
the homogenous ability groups compared to their performance as individuals.
Although high scorers helped their partners more than low scorers helped their
partners, the low ability pairs improved more than the high ability pairs. (High
ability groups had less room to move upward.) However, Bracey (1994) found that
low ability dyads mutually extinguished each other’s achievement.
Goldman (1965) discovered that high ability individuals significantly
improved their decision making capabilities regardless of which ability group
they were assigned. However, high ability individuals did not improve more
when working with another high ability person as compared to a low ability
person. Hill (1982), however, showed that high ability individuals suffer “a
process loss” when working with those of lower ability levels. In fact, she found
that a group with only one high ability member did not perform better than a
group with no high ability member; in heterogeneous groups, high ability
members were detrimentally affected unless there were three or more high
ability members. However, Goldman (1965) reported that high ability
28
individuals working alone outperformed middle ability pairs and middle ability
individuals outperformed low ability pairs. Also, the middle ability pairs
outscored the pairs composed of one middle ability and one low ability
performer that scored at the level of the homogenous low ability pairs. A similar
result was described by Hill (1982). These findings might suggest that there
was “process loss” when a middle ability person was placed in a group with
lower ability individuals.
Hill (1982) cited a study by Tuckman and Lorge (1962) that employed the
Mined Road Problem where 11% of the time groups scored lower than their best
members’ performance. When summarizing the findings from the literature
review, Hill (1982) concluded that the concept of process loss frequently occurred
in groups and thus lowered individual productivity. However, she concluded that
group performance was better than the average individual and as such decisions
may be improved with a group approach.
Role of discussion. Several researchers (Hoffman and Maier, 1961;
Salazar, 1995; Yager, Johnson, and Johnson, 1985) have found that discussion
and communications play an important role in groups making a decision and in
the quality of that decision. When group members have substantially different
perspectives or the problem is ambiguous, members of the group must
communicate with each other to grasp the problem intially. Explanations and
checking for errors expressed by others help group members develop a deeper
understanding of the “big picture”. Others (Lambert, 1978; Zaleska, 1978) found
that discussion influenced whether the majority would decide the solution. In

29
Lambert’s study (1978), the majority rule was not used as often for decision
making when there was discussion; whereas, Zaleska (1978) found that the
discussions supporting the most frequent responses ruled the decision.
Interestingly, a computer programming study conducted by Webb (1986) involving
students age 11 to 14 failed to find a positive relationship between group
members giving explanations and improved achievement. But, responses to
specific questions did improve performance. Interaction appeared to be important
for writing a quality program, but a lengthy explanation was not.
Salazar (1995) identified the process of communications and the
opportunity for members of the group to discuss relevant issues important in
arriving at group decisions that led to process gain or process loss. This process
was governed by three influences--disruptive, facilitative, and counteractive.
Disruptive influences led to process loss by detracting from the task at hand such
as turning power over to one individual in the group, making derogatory remarks
about other members, and not allowing adequate discussion of the problem. In
other words, they inhibited discussion and communication. Facilitative influences
encouraged process gain and promoted careful examination of the many facets of
the problems such as resolving disagreements, answering questions, and
providing positive or negative feedback. Counteractive influences led to process
gain when they were exerted to get the group back to the task of solving the
problem.
Homogeneity versus heterogeneity of personality. Hoffman and Maier
(1961) expanded upon a previous study of Hoffman’s to determine if the quality of

30
solutions produced by groups of dissimilar personalities (heterogeneous groups)
differed from groups of like personalities (homogeneous groups). The
participants were students in psychology classes at the University of Michigan.
Problems were employed that required new-modified or integrative solutions (i.e.,
Mined Road, Painter-Inspector Argument). For all the problems, the solutions for
the heterogeneous groups were significantly better or the same as the
homogenous groups; whereas, the homogenous groups never outperformed or
made better decisions than the heterogeneous groups. In addition, one mixed-
sex group outperformed all-male groups.
Hoffman and Maier (1961) concluded that the heterogeneous groups
brought many more directions and perceptions to the decision making process,
resulting in more discussion and seeking more possible options. In
homogeneous groups, the decision may be made prior to discussion since the
group members had similar perceptions. Therefore, the number of options
considered was limited and lowered the quality of the solutions. Interestingly, few
groups were able to understand the issues involved with the overall problems or
the “big picture” and generally dealt with only the initial problem. It appeared that
homogenous groups with limited perspectives had more difficulty generating high
quality decisions.
This was not the finding of Waugh (1996) when he reproduced the NASA
Moon Problem study. His investigation introduced two variables not present in the
Hoffman and Mayer research--instruction and consensus requirement. No
process loss occurred in any of the homogeneous-instructed groups while 33% of

31
the heterogeneous-instructed groups experienced a process loss. However, 56%
of the homogeneous-noninstructed group experienced a process loss. The
heterogeneous-noninstructed groups had the weakest performance.
The results discussed in this section punctuate the complex nature of group
decision making and the importance of identifying the multitude of variables that
affect performance. The literature review suggested that just grouping students
may hinder decision making and performance resulting in process loss.
However, this outcome is in opposition to the current goals of education. As four-
year business programs search for ways to promote problem-solving abilities and
to develop academic competencies, it is imperative that group activities, such as
collaborative study and paired test taking, result in process gain for students.
Decrements in performance for some group members are unacceptable and
research must be conducted to understand what variables (i.e., ability, discussion,
homogeneity of group members) impact the learning environment so that
graduates from four-year business programs can have opportunities to develop to
their fullest potential and have adequate preparation for entering the workforce.
Cooperative Learning and Collaborative Learning
Although many authors and educators have found little difference between
cooperative and collaborative learning, a review of the literature indicated major
divisions between the two. In a subsequent section, these differences will be
delineated. However, the next two sections discuss the major elements and
characteristics of cooperative learning and collaborative learning.

32
Cooperative Learning
Authors frequently begin their writings on cooperative learning with a
definition. This is a fairly straightforward process since cooperative learning has
become highly structured and defined. Although many definitions found in the
literature are adequate, Slavin’s definition (1988) incorporated the basic
components. Cooperative learning consists of “instructional methods in which
students of all performance levels work together in small groups toward a group
goal. The essential feature of cooperative learning is that the success of one
student helps other students to be successful” (p. 8). Johnson and Johnson
(1994), Johnson, Johnson, and Smith (1991), Yager, Johnson, and Johnson
(1985), and Slavin (1988, 1990, 1995) have researched and promoted cooperative
learning and have written excellent books and journal articles on the topic. It is
from their work that much of the discussion of cooperative learning was drawn.
At the root of cooperative learning is the differentiation of three goal
structures for learning—cooperative, competitive, and individualistic. Competition
is viewed as harmful and inhibits learning for the majority of students. In
competition, winning is a scarce commodity and coveted—the winners can only be
successful if several others lose. This creates a system of “I’m better, and
smarter, and more worthwhile than you.” “Losers” quickly buy into this scenario
and “just want to sink into their seats.” This is a torturous situation that occurs on
a daily basis for many students. “Thus a student may spend twelve years in public
schools being confronted daily with the fact that he is a ‘loser’” (Johnson &
Johnson, 1994, p. 160). The outcome is often avoidance of failure that leads to

33
such behaviors as pervasive cheating, interference with problem solving, low self
esteem, feelings of worthlessness, and high anxiety levels (Hamm & Adams,
1992; Hilke, 1990; Johnson & Johnson, 1991; Slavin, 1995).
Individualistic learning as a goal structure means that students learn on
their own with assistance only from the classroom teacher. Student outcomes
have no relationship to the fate of other students and learners have no interaction
with each other. Their performance is judged on a criterion-referenced evaluation
system for excellence. However, for students to achieve at a high level they must
perceive the task as relevant and important. Frequently the benefits apply only for
short term tasks that can be completed within a specified time frame. An unlimited
number of students can achieve success, but the responsibility for learning and
completing the tasks rests with the students who work at their own pace. Johnson
and Johnson (1994, pp. 154-155) identified potential problems with individualistic
learning:
1. Talking and interacting with others--The more socializing, the lower the
productivity.
2. Competing with others--Persons working in close proximity tend to begin to
compete with others.
3. Complex or new tasks--Individualistic learning is more appropriate for simple
tasks, but inadequate for complex tasks.
4. Unimportant goal--Attention and effort quickly wane if goal is perceived as
unimportant.
34
5. Unclear rules and procedures--Authority figure may not have time to explain
tasks until they are clearly understood.
6. Lack of materials, resources, and skills--Every person is a self-contained unit
and without adequate resources efforts to complete tasks stop.
“All cooperative learning methods share the idea the students work together
to learn and are responsible for their teammates’ learning as well as their own”
(Slavin, 1995, p. 5). In fact, success is only achieved and the work considered
completed when all students in the group have mastered the task. Johnson and
Johnson (1994) and Johnson, Johnson, and Smith (1991) identified five key
components of cooperative learning and Slavin (1988) defined six principal
characteristics. However, many researchers, educators, and authors (Hamm &
Adams, 1992; Klemm, 1994; Rau & Heyl, 1990) referred to elements discussed by
Johnson and Johnson (1994) and those elements will also be used in this study.
They included positive goal interdependence, face-to-face promotive interaction,
individual accountability, social skills, and group processing. In order for
cooperative learning to achieve the expected outcomes, all of these components
must be organized into a highly structured learning environment.
A brief discussion of the five elements was necessary to understand the
structure of successful cooperative learning. Positive interdependence is best
characterized by the phrase “sink or swim together.” All group members are
aware that they are directly accountable for the learning of their teammates. They
have two responsibilities that include recognizing that each group member’s
efforts are required and each group member has a contribution to make.

35
Promotive interaction encourages students to do their “real work” together. It is
distinguished by the oral discussions between the students as they explain how
they reached a conclusion, solved a problem, or found an answer. This activity is
frequently completed when students summarize their learning tasks. Individual
accountability makes each student personally responsible for his or her
performance to guard against the effects of “free loading.” In order to counter
some of these negative consequences, individual performance is assessed and
linked to a group reward. Interpersonal and small group skills must be taught to
group members. Students do not instinctively know how to interact with each other
to accomplish tasks effectively and efficiently. Group members are frequently
assigned specific functions or roles such explainer, listener, checker, observer,
etc. Group processing is the final step and involves the reflection of groups,
individuals, and teachers on how cooperative learning is working and how it can
be improved.
Cooperative learning has been zealously advocated by some for the
realization of benefits for students and society (Hamm & Adams, 1992; Johnson &
Johnson, 1994; Johnson, Johnson, & Smith, 1991, Slavin, 1988). One benefit that
has been of obvious concern is achievement. However, another equally important
objective to some educators has been to “teach children that all
people—regardless of race, ethnicity, or gender—can achieve their goals in
society if they aim high and are tenacious” (Hamm & Adams, 1992, p. v). This
commitment to a diverse school population has required that group members be
as heterogeneous as possible. School desegregation and an increasing minority
36
population have made positive intergroup relations a top priority for cooperative
learning. An extension of this concept has been the acceptance of academically
and physically handicapped students as they have been mainstreamed into
regular classrooms.
Many educators and researchers credit cooperative learning with advancing
a vital psychological outcome—improved self-esteem (Hamm & Adams, 1992;
Johnson & Johnson, 1990; Slavin, 1995). “Students’ beliefs that they are valuable
and important individuals are of critical importance for their ability to withstand the
disappointments of life, to be confident decision makers, and ultimately to be
happy and productive individuals” (Slavin, 1995, p. 60). Along this same line of
acquiring life skills, students were found to be more cooperative, altruist, and able
to take another’s perspective when they had participated in cooperative learning
groups.
Among the studies that showed significant academic gains due to
cooperative learning were Hamm and Adams (1992), Johnson and Johnson
(1994), Johnson, Johnson, and Smith, (1991), Klemm, 1994, and Slavin (1988,
1990, 1995). Much of the research has shown significant gains for students in
academic achievement. Interestingly, studies have shown overwhelming success
even though those who passionately advocate its practice confess that it takes
significant training and years of experience to become a competent practitioner.
Hamm and Adams (1992), Johnson and Johnson (1994), Johnson, Johnson,
Smith (1991), and Slavin (1988; 1990; 1995) mention, in passing, some possible
problems and hazards usually related to “social loafing” or “free riding.” However,

37
one teacher/researcher (Melton, 1996) gave a realistic account of her struggles
and failures encountered when she attempted to institute cooperative learning in a
mathematics class composed largely of minority students. In the final analysis
she declared cooperative learning pedagogies to be successful, but it was only
her strong determination to see the process through to the end and the
establishment of short-term goals that provided even a limited victory.
Few studies were found suggesting that cooperative learning outcomes
were no different than the control groups. Slavin (1995) addressed this issue in
more detail in his book Cooperative Learning: Theory, Research, and Practice. In
fact, he is critical of the methodology employed by Johnson and Johnson who have
made a significant contribution to the body of knowledge on cooperative learning
(Slavin, 1990, 1995). Slavin completed an extensive review of the literature and
summarized the results in concise, easy to understand format. He selected only
studies that met his rigorous criteria for methodologically sound research. None
of the Johnson and Johnson studies qualified for review under Slavin’ well-defined
standards. Only one study came close to qualifying for his review and that was the
Yager, Johnson, and Johnson study (1985).
Even though the Yager, Johnson, and Johnson (1985) study was
methodologically adequate, a brief discussion may illuminate some of the lack of
attention to detail that may call some of their results into question. In the study,
Oral Discussion, Group-to-Individual Transfer, and Achievement in Cooperative
Learning Groups, the researchers wrote, “The results indicate a very powerful
group-to-individual transfer effect resulting from learning in cooperative

38
groups….This was true for high-, medium-, and low ability students” (p. 63). The F
tests showed significant ability effects, but the researchers did not elaborate on
where the effects were greatest. Such questions as what was the ratio of high,
medium, and low achievers in each group, did this ratio seem to influence the
results, which ability group seemed to benefit the most, which ability group
seemed to benefit the least, or did all ability groups receive the same benefit were
not addressed.
Collaborative Learning
Collaborative learning as an instructional method has only recently been
officially recognized. Gamson (1994), a leading proponent of collaborative
learning, states that she first encountered the term in 1983 when she was invited
to address a conference on collaborative learning. In preparation for the speech
she found herself looking up the word “collaboration” in the dictionary. The first
meaning is “to work together, especially in an intellectual endeavor.” Based upon
what many others described as collaborative, “intellectual” is an essential
component. Another phrase associated with collaboration is “mutual
engagement.” Michael Shrage (1990) characterized the art of collaboration as “an
act of shared creation, and/or shared discovery” (p. 6). The literature provided a
multitude of definitions (Gokhale, 1995; Matthews, Cooper, Davidson, & Hawkes,
1995; Bruffee, 1995) which can be quite different. One of the reasons for multiple
definitions is that collaborative learning has not been as thoroughly researched
and as a result it is not as highly structured as cooperative learning. Another
reason that collaborative learning is not as clearly defined is that some writers

39
want to make it a philosophical issue. Bruffee (1995) questioned what embodies
knowledge and Hawkes (1993) wanted to redefine classroom authority. These
were not issues with cooperative learning where the empirical research and the
major proponents (Johnson & Johnson, 1991; Slavin, 1988) were allowed to
define cooperative learning, and the classroom authority remained unquestionably
with the teacher. Smith and MacGregor (1992) are frequently referenced in the
literature for their definition of collaborative learning. They wrote,
“Collaborative learning” is an umbrella term for a variety of educationalapproaches involving joint intellectual effort by students, or students andteachers together. In most collaborative learning situations students areworking in groups of two or more, mutually searching for understanding,solutions, or meanings, or creating a product . . . most should center onthe students’ exploration or application of the course material. . . . Learningunfolds in the most public of ways (p. 10).
Although collaborative learning has been used in many contexts,
educational approaches, and different disciplines, a number of assumptions or
themes provided a working foundation for educators to draw upon as they
experiment with making the learning experience a more positive one for students.
These have been primarily synthesized from the works of Smith and MacGregor
(1992), Schrage, (1990), and Brufee (1994, 1995). The categories developed by
Smith and MacGregor (1992) will serve as a basis for the assumptions. Others
were added to expand their offerings.
Learning is an active, constructive process. Students reorganize or
reconceptualize prior knowledge to construct new meanings. Many times this
involves accepting uncertainty and viewing problems to be solved as opportunities
(Schrage, 1990).

40
Learning depends on rich contexts. Learning is embedded in context and
application of theories and facts. Bruffee (1994) referred to this as “making the
most of knowledgeable peers.” Schrage (1990) termed it competence and stated,
“A collaboration of incompetents, no matter how diligent or well meaning, cannot
be successful” (p. 152).
Learners are diverse. Diversity of backgrounds allows students to bring
many rich experiences to the learning process. However, as Schrage (1990)
emphasized it is important that the collaborators have mutual respect, tolerance,
and trust in order for the task to be completed successfully. He reminded his
audience that successful collaborators do not have to be friends as long as trust
can be maintained.
Learning is inherently social. Communication, both verbal and nonverbal, is
essential to acquiring in-depth understandings and creating new ideas for many
learners. It is at the basis of constructing meaning and knowledge by creating
intellectual synergy. Bruffee (1994) credited this sharing of knowledge as
essential for learning how to exercise judgment in a field of expertise.
Learning has affective and subjective dimensions. Learners shift the
authority for their intellectual development from others to themselves (Bruffee,
1994; Gamson, 1994). The collaborators become “creators of their own
knowledge and meaning” (Smith & MacGregor, 1990, p. 11). Clear lines of
responsibility remain, but there are no restrictive boundaries because
“collaborative relationships are not managed” (Schrage, 1990, p. 158). This is a
shift that is crucial to the development of learning for one’s lifetime.

41
Decisions do not have to be made by consensus. It is common for
collaborators to disagree on major issues that frequently stimulate learners to
take new ideas into unexplored territory or discover new creations. However, as
Schrage (1990) succinctly stated, “If collaborators consistently diverge, the
collaboration ultimately dissolves” (p. 159).
As has been acknowledged in the literature, few scientifically controlled
studies on collaborative learning have been undertaken at the college or university
level. The exceptions to this are researchers who have actively investigated the
role of intelligent educational systems as co-learners (Blandford, 1994;
Dillenbourg, 1996) The findings of two collegiate studies have been encouraging
and provided strong support for the role of collaborative learning in college
classrooms, even when the sections were large (Gokhale, 1995; Rau & Heyl,
1990). Gokhale (1995) compared collaborative learning to individual learning in a
technology class on electric circuits. He examined its effect on “drill and practice”
items and on critical thinking items. Students in the collaborative learning groups
outperformed individual learners on the critical thinking items, but no statistical
difference was found on the “drill and practice” items. Rau and Heyl (1990) found
students in sociology classes performed significantly better on test questions that
had been studied in a collaborative environment than the ones that had been
studied individually. However, they compared undergraduates with graduates,
used many of the elements associated with cooperative learning, and did not use
a control group.
42
Differences in Cooperative and Collaborative Learning
A review of the literature revealed that some authors used the terms
cooperative and collaborative learning almost interchangeably (Hamm & Adams,
1992; Klemm, 1994; Johnson, Johnson, & Smith 1991) while others insisted that
they are completely different approaches (Bruffee, 1994, 1995; Gamson, 1994;
Matthews, Cooper, Davidson, & Hawkes, 1995). To confuse the issue further,
Smith and MacGregor (1992) in a publication “What is Collaborative Learning?”
listed cooperative learning as a type of collaborative learning. A review of the
literature highlighted some essential differences that have been summarized in
Table 1. Differentiating between cooperative learning and collaborative learning is
important so that each can be employed in its proper context to maximize its
positive impact. Table 1 shows that they have several contrasting attributes that
have significant implications for implementing the two learning strategies.
This study focused on using the knowledge within the paired groups as
resources to be shared for achieving mutual gains. Gains that may not be
possible when business students work in isolation on tests measuring linear
programming knowledge and problem-solving abilities. Not only has the
instructor’s authority been relinquished, there may not be individual accountability
as the grade on the test instrument was assigned to both test takers. However,
the individually completed posttest taken in this study provided information on how
well collaborative study and paired test taking facilitated using problem-solving
skills in a linear programming knowledge domain to promote individual process
gain.

43
Table 1
Differences in Cooperative and Collaborative Learninga
Cooperative Learning Collaborative Learning
Highly structured Few structures or rules
Groups size usually four members Group size varies from two to eightmembers—can include entire class
Teacher actively monitors groupactivities
Instructor takes hands-offapproach—students organize, govern,and pace own work
Individual accountability within the group May be no individual accountability
Group accountability with group awards May be no group accountability
Students assigned specific social roleswithin group
Students determine own socialstructure within group
Students receive training in small-groupsocial skills
No formal training in socialskills—students rely on previouslyacquired skills
Teachers’ training and experienceessential elements for success
Instructors may not receive any formaltraining in social skills or small groupprocesses
Students perform group processingtasks including how to improveperformance
No formal group processing—studentsresolve group conflicts on participationissues
Teachers evaluate group processingtasks
Teachers only become involved inextreme cases ofconflict—reassignment of groupmembers undesirable
Considered useful for mastering lower-order and basic academic skills
Considered useful for masteringhigher-order and conceptual skills (table continues)

44
Table 1 (continued)
Cooperative Learning Collaborative Learning
Generally designed and useful forelementary and middle school students
Generally designed and useful foradolescents and adults
Frequently work in parallel with othergroup members and consult otherswhen having difficulty
More interactive exchange and sharingof ideas throughout the group work
Encourages group consensus Encourages dissent and controversy
Group members carefully selectedbased on diversity of race, ethnicity,gender, ability, socioeconomicbackground
Group members can be assigned byself-selection, randomly, or criterion-based
Highly developed programs such asStudent Teams—Achievement Division,Teams—Games—Tournaments
No well-defined programs
Facilitates foundational education Facilitates nonfoundational education
Aim is basically to eliminate competitionin the classrooms
Shift nature of competition frombetween individuals to between groups
Group relationships closely managedby teacher
Group relationships are not managed
Classroom authority remains withteacher
Authority shifts from teachers tostudents as students confront issues ofpower and authority
Well-established body of empiricalresearch
Few empirical research studies
aThis summary was developed by the researcher and reflects findings from the
review of literature.

45
Summary
This study examined the impact of collaborative learning and paired test
taking on problem-solving abilities within the domain of linear programming
knowledge. Since problem solving was a vital component of the investigation,
well-defined operational criteria were developed. They provided the rationale for
constructing the test and posttest instruments, and allowed others to evaluate and
reproduce the study. Mayer’s (1983) work with problem solving and word
problems and Trabasso’s (1977) investigation of problem solving and encoding of
relational facts served as the basis for the operational criteria.
Even though group decision making has been promoted as a way to get
work done effectively, a review of the literature showed that group members could
have decrements in performance. Many variables influenced the outcome of group
decisions, but middle ability individuals were more at risk than either high or low
ability level individuals for experiencing process loss. Many students majoring in
business at four-year colleges are considered to possess moderate academic
abilities, and they have increasingly been assigned group work. Some of these
team assignments may be limiting their educational development. This study
examined the influence of collaborative learning in a collaborative study and paired
test taking environment while controlling for ability level differences of students
majoring in business at a small liberal arts college in southwest Virginia.
Collaboration as an instructional strategy is a recent arrival to higher
education. Nevertheless, it holds promise for intellectually engaging students in
an active learning environment, especially those who have difficulty in the

46
traditional lecture, passive learning classrooms. Sharing knowledge in groups for
mutual gain can increase understanding of course material and improve problem-
solving abilities. When knowledge is used as a resource in a test taking situation,
collaborative study and paired test taking can provide business students with the
opportunity to take responsibility for their learning and assume ownership of the
linear programming material, thereby increasing their performance. Educators
must not accept limited mastery of analytical, communication, and leadership
skills. Four-year colleges and universities must enter an era of experimentation in
instructional methods that incite learning. Instructional experimentation along with
new methods of assessment can be the key to assuring that college graduates
develop essential skills.
47
CHAPTER III
Methodology
An experimental study was conducted to examine the influence of
collaboration on problem-solving abilities within a discipline-specific domain for
business students at a four-year, liberal arts college. Educators and managers
frequently embrace teamwork and collaboration in an effort to motivate students
and workers to reach higher levels of achievement. These efforts have frequently
been encouraged without careful study of the literature on decision making and
collaboration.
Educators, employers, and students recognize the urgency for college
graduates, and especially business majors (the concern of this study), to have
mastery of essential competencies such as analytical problem-solving abilities
and communication skills, including working in teams. Collaborative learning may
be one method to facilitate learning abilities needed in the workplace in the
college classroom. Thus, this study examined collaborative learning and paired
test taking under three levels of treatment while controlling for ability. The
treatment groups were studying individually and completing the test individually
(the control group), studying in paired groups and completing the test in paired
groups, and studying in paired groups and completing the test individually.
The relationship between collaboration and problem-solving ability within a
discipline-specific domain of linear programming theory was examined at two time
periods—test and posttest. The test was administered immediately after a
learning session, study period, and question-and-answer discussion.
48
Completing the test involved collaborative study and paired or individual test taking
by two experimental groups (studying in paired groups and completing the test in
paired groups, and studying in paired groups and completing the test individually)
and a control group (individual study with individual test taking). To evaluate
group-to-individual transfer of linear programming concepts from the use of
collaborative learning strategies, a posttest was administered 17 days later with
no subsequent instruction. All participants completed the posttest individually.
The following null hypothesis was tested: No differences in treatment means
measuring problem-solving abilities would be found based on students’ test and
posttest scores using two treatment groups of collaborative study, with
collaborative or individual test taking, and a control group of individual study with
individual test taking.
Participants
The participants selected for the study were students who had declared a
major in business and who were enrolled in at least one class in the business
program in the fall semester of 1997 at a liberal arts college located in southwest
Virginia. The declared major of the participants was coordinated with the
registrar’s records to ensure that participants were current business majors.
Students participating in the study were allotted 10 extra points that were added to
a test of choice for a course within the business curriculum. In order to encourage
students to do their best and to hold students individually accountable, participants
scoring at least 90 points out of 100 on the posttest earned an additional five
bonus points.

49
Since the content area for the study was linear programming theory,
students who had taken or were taking the linear programming course in the fall of
1997 were eliminated from the study. They were assigned to a separate group
that was used for the pilot study. All participants were randomly assigned to the
treatment and control groups, and to the pairs within the treatment groups.
Data collected on each participant consisted of age, gender, class status,
ethnicity, Scholastic Aptitude Test scores, and high school grade point averages.
Thirty-three students participated in the pilot study. There were 11 participants in
the individual study with individual test taking (control) group, 12 students in the
paired study with individual test taking group, and 10 students in the paired study
and paired test taking group. Forty-six students took part in the experimental study.
There were 14 participants in the individual study with individual test taking group,
16 participants in the paired study with individual test taking group, and 16
participants in the paired study with paired test taking group. Human Subjects
Clearance was obtained from the Institutional Review Board for Research
Involving Human participants at Virginia Tech and the Academic Dean of the liberal
arts college in southwest Virginia where the study was conducted.
Instructional Treatment
The instructions, as given in Appendix B, were given to students
participating in the pilot and experimental studies. Students were supplied with all
materials needed for taking part in the study. The diagram below outlines the
various sessions and their respective time allotments.
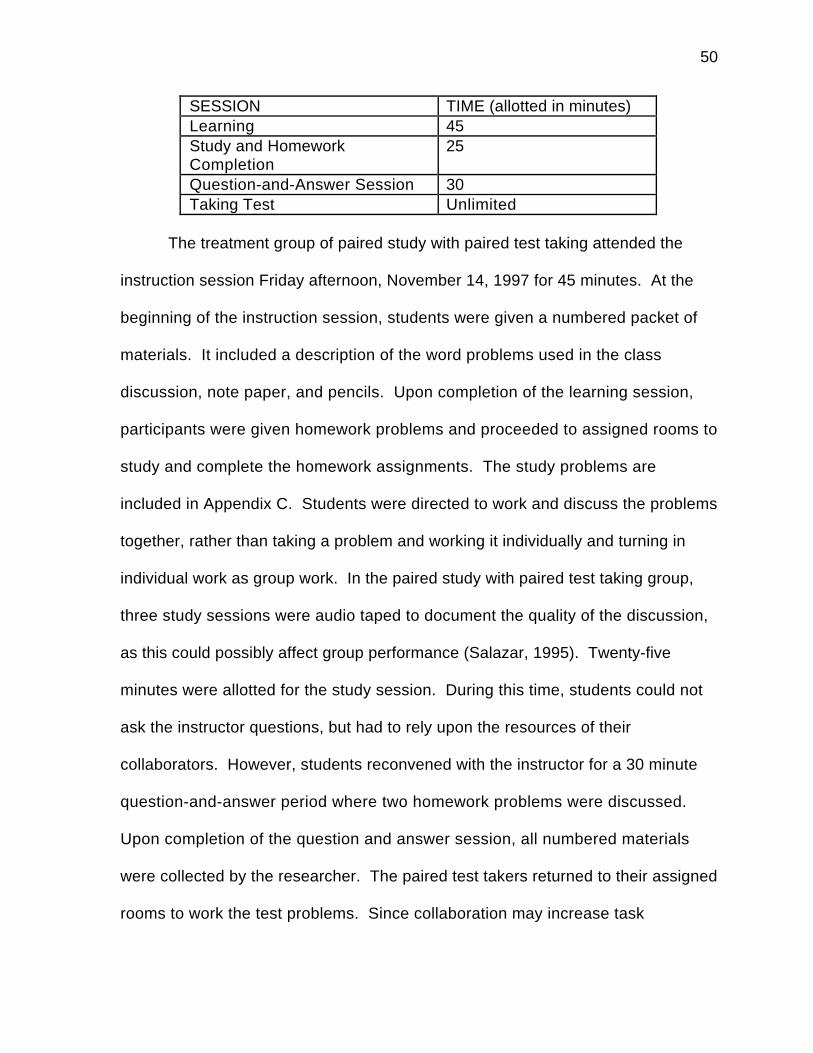
50
SESSION TIME (allotted in minutes)Learning 45Study and HomeworkCompletion
25
Question-and-Answer Session 30Taking Test Unlimited
The treatment group of paired study with paired test taking attended the
instruction session Friday afternoon, November 14, 1997 for 45 minutes. At the
beginning of the instruction session, students were given a numbered packet of
materials. It included a description of the word problems used in the class
discussion, note paper, and pencils. Upon completion of the learning session,
participants were given homework problems and proceeded to assigned rooms to
study and complete the homework assignments. The study problems are
included in Appendix C. Students were directed to work and discuss the problems
together, rather than taking a problem and working it individually and turning in
individual work as group work. In the paired study with paired test taking group,
three study sessions were audio taped to document the quality of the discussion,
as this could possibly affect group performance (Salazar, 1995). Twenty-five
minutes were allotted for the study session. During this time, students could not
ask the instructor questions, but had to rely upon the resources of their
collaborators. However, students reconvened with the instructor for a 30 minute
question-and-answer period where two homework problems were discussed.
Upon completion of the question and answer session, all numbered materials
were collected by the researcher. The paired test takers returned to their assigned
rooms to work the test problems. Since collaboration may increase task

51
completion time, no time constraints were established for completion of the test
instrument.
On Saturday afternoon, November 15, 1997 the above process was
repeated for the treatment group of paired study with individual test taking. The
exception to the above procedure was that students studied in pairs, but
completed the test instrument individually. Three of the study sessions were
audio taped.
On Sunday afternoon, November 16, 1997, the process was repeated for
the control group in the afternoon. These participants studied individually and
completed the word problem test individually. The diagram below contains the
dates that each group received the instructions and completed the test.
GROUP TEST DATEPilot Study November 7, 1997Treatment of Paired Study/Paired Test Taking November 14, 1997Treatment of Paired Study/Individual Test Taking November 15, 1997Control November 16, 1997
At the completion of each question-and-answer session, participants were
instructed that they would have no further verbal contact with the researcher. In
other words, the researcher would not address questions or clarify any content in
the instrument. Students in the treatment and control groups were instructed not
to work on linear programming word problems between completion of the test and
reconvening to complete the posttest. No additional instruction was given
between the test and posttest sessions and no question-and-answer session
was conducted. The researcher taught all of the learning sessions based upon
well-defined instruction and conducted all the question and answer meetings to
52
control for influences introduced by the instructor. However, the instructions as
given in Appendix B were reviewed by an associate professor of business familiar
with linear programming theory and a research colleague with business subject
teaching experience at the collegiate level.
In order to maintain a manageable class size for instructional treatment, the
control group and both treatment groups received the instructions during separate
learning sessions. Learning linear programming theory to construct mathematical
models requires that students be able to request clarification or pose questions
for enhanced understanding. This means that the participants in the different
groups may not have received exactly the same set of instructions because of the
interaction between the instructor and the students. Documentation of any
instructional differences were maintained by audio recordings from the learning
sessions and the question-and-answer discussions for all groups.
Test Instrument
The test instrument consisted of the word problem provided in Appendix D.
It was developed and formulated based upon principles of linear programming
model formulation. The researcher wrote the test instrument to ensure that
students did not have prior access to the actual test question, to control the
appropriate level of difficulty, and to ensure that all elements of the problem-
solving criteria were included. The instruments included the following prompts for
information: date, time started, time completed, and name(s). The test instrument
was reviewed by an associate professor of business and a research colleague

53
with collegiate teaching experience in order to insure that it followed linear
programming protocol.
Students taking the test in pairs received the same test score in order to
increase the interdependence of the test takers. Those completing the test
individually received individual scores. The possible range of scores on the test
was 0 to 100. The model formulation components including defining the decision
variables, developing the objective function, advancing the constraints, and
determining the correct relational sign were assigned a specified number of
points as shown in Appendix E.
The formulation of linear programming models was used as the content
area for the instruction and the test instrument because it is a part of the core
curriculum at the participating college and many other collegiate business
programs. Mastering linear programming theory presents a challenge for many
business students. The design of the test instrument was congruent with the
operational definition of problem solving defined in the review of literature.
In order to guard against grade bias, the students’ completed tests and
posttests were graded by the researcher and another college professor familiar
with linear programming theory. The performance evaluation by the researcher
and the second grader were compared for interrater agreement. These data are
provided in Appendix F. Disagreements were resolved through consensus
reached by the researcher and the second grader.

54
Test Administration
The test was administered on the dates previously displayed. Participants
receiving the treatment of paired test taking were assigned a separate room per
pair within the same building. This physical arrangement allowed robust oral
discussion and sharing of knowledge and resources without disrupting other test
takers. Collaboration frequently increases task completion time. In order to
minimize negative consequences related to time, tests given to treatment and
control groups were untimed. Completion times were recorded and appear in
Appendix G.
The researcher delivered each test taking pair a numbered test and a
congruently numbered answer sheet. The participants recorded the date and time
in the appropriate space, placed both of their names on the test and answer sheet,
and began working on the instrument. The answer sheet was used to formulate
and write the linear programming model generated by the linear programming
word problem. Frequent monitoring was performed by the researcher. Upon
completion of the tests, both participants returned the test to the researcher and
the time of completion was recorded on the instrument. These recorded times
were placed in Appendix G.
Students completing the test individually (control group and one treatment
group) were asked to assemble in another room in the same building after the
question and answer session. This was done to maintain similar activities
between the control and treatment groups. Numbered tests with congruently-
numbered answer sheets were placed face down on the desk. At the designated
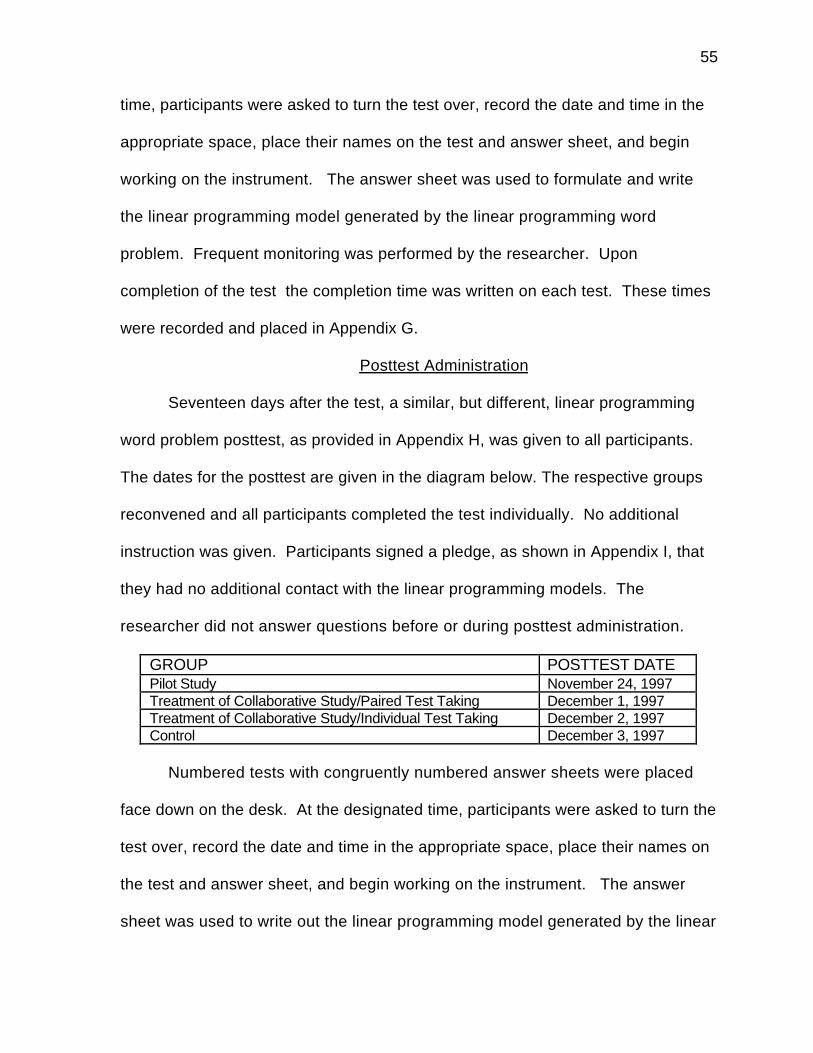
55
time, participants were asked to turn the test over, record the date and time in the
appropriate space, place their names on the test and answer sheet, and begin
working on the instrument. The answer sheet was used to formulate and write
the linear programming model generated by the linear programming word
problem. Frequent monitoring was performed by the researcher. Upon
completion of the test the completion time was written on each test. These times
were recorded and placed in Appendix G.
Posttest Administration
Seventeen days after the test, a similar, but different, linear programming
word problem posttest, as provided in Appendix H, was given to all participants.
The dates for the posttest are given in the diagram below. The respective groups
reconvened and all participants completed the test individually. No additional
instruction was given. Participants signed a pledge, as shown in Appendix I, that
they had no additional contact with the linear programming models. The
researcher did not answer questions before or during posttest administration.
GROUP POSTTEST DATEPilot Study November 24, 1997Treatment of Collaborative Study/Paired Test Taking December 1, 1997Treatment of Collaborative Study/Individual Test Taking December 2, 1997Control December 3, 1997
Numbered tests with congruently numbered answer sheets were placed
face down on the desk. At the designated time, participants were asked to turn the
test over, record the date and time in the appropriate space, place their names on
the test and answer sheet, and begin working on the instrument. The answer
sheet was used to write out the linear programming model generated by the linear

56
programming word problem. Again, frequent monitoring was performed by the
researcher. When the participants completed the tests, the completion time was
written on each test. Posttest completion times were recorded and details were
placed in Appendix J. Participants were assigned individual grades that were not
related to the previous collaborative or individual test grades. The model
formulation components for the posttest including defining the decision variables,
developing the objective function, advancing the constraints, and determining the
correct relational sign were assigned a specified number of points as shown in
Appendix K. This scoring scheme was used to evaluate the performance on the
posttest.
Pilot Study
The pilot study was conducted to evaluate the procedures described in the
Instructional Treatment, Test Administration, and Posttest Administration Sections.
The test dates for the pilot study were November 7, 1997 and November 24, 1997.
The 31participants were business majors that were eliminated from the
experimental study because of their previous exposure to linear programming
theory. They were divided into the same groups as those defined for the
experimental study: paired study with paired test taking, paired study with
individual test taking, and individual study with individual test taking. The groups
were composed of 10 students, 12 students, and 11 students respectively. These
participants received the same set of instructions, homework problems, test and
posttest instruments, and procedural considerations as their respective groups in
the experimental study.

57
The pilot study revealed that the original amount of time allocated for the
learning session needed to be decreased from 70 minutes to 45 minutes. It also
confirmed that the instructional treatment, test administration, and posttest
administration could proceed as designed as no other problems surfaced.
Data Analysis
An analysis of covariance (ANCOVA) was selected for data analysis to
partial out the influence of ability to reduce variance due to error. By adjusting the
means of the test and posttest scores, the variance due to treatment was more
accurately measured. The following null hypothesis was tested: No differences in
treatment means measuring problem-solving abilities would be found based on
students’ test and posttest scores using two treatment groups of collaborative
study, with collaborative or individual test taking, and a control group of individual
study with individual test taking.
The independent variable consisted of treatment at three levels: paired
study with paired test taking, paired study with individual test taking, and individual
study with individual test taking. Ability was the single covariate. The dependent
variables are shown in the diagram below.
DEPENDENT VARIABLE TYPE OF VARIABLE RANGE OF SCORE
Test Score Continuous 0 - 100
Posttest Score Continuous 0 - 100
Summary
This study examined collaborative learning (paired study and/or paired test
taking) while controlling for ability as a covariate. The treatment levels were
individual study and individual test taking (the control group), paired study with

58
individual test taking, and paired study with paired test taking. A posttest, that was
completed individually by all participants, was administered 17 days after the initial
test to provide information about group-to-individual transfer and individual
accountability. It was important to determine if both members of the paired test
taking group were benefiting from the collaborative learning environment,
mastering the linear programming content, and increasing their ability to apply
those concepts in problem-solving situations. If learning is facilitated through
collaborative test taking, educators at all educational levels may need to rethink
traditional achievement testing.

59
CHAPTER IV
Results
This chapter discusses the attributes of the participants, the role of the
second grader, the audio taped recordings of the collaborative pairs, and the data
analysis using ANCOVA. It addresses the assumptions of no differences on the
ability covariate among the three treatment groups, the significance of ability on the
test score and posttest score variables, and homogeneity of regression.
Demographics
Forty-six business majors participated in this experimental study that was
divided into a control and two treatment groups. For the demographic composition
of each group, refer to Table 2. Twenty-seven of the participants were males
(58.7%) and nineteen were females (41.3%). Their ages ranged from 18 to 24
with a mean age of 20.5 and a standard deviation of 1.26. Ethnicity included
Caucasian and African-American students, 35 participants (76.1%) and 11
participants (23.9%), respectively. Although 25 of the 46 participants had junior
status (54.4%), 2 were freshmen (4.3%), 8 were sophomores (17.4%), and 11
were seniors (23.9%).
Second Grader and Test/Posttest Scores
To guard against researcher bias in evaluating the test and posttest
instruments, a second grader scored both test independently. The scores of the
first and second grader, as well as the assigned scores, appear in Appendix F.
The same score was assigned to 21 out of 46 tests (45.7%). In 22 out of 46 tests
(47.8%), there were two points or less difference and the first grader’s

60
Table 2
Demographic Composition Of Treatment Groups
Groups Gender Ethnicity Age Academic Status
Male FemaleAfrican-American
Cauca-sian FR SO JR SR
n n n n M SD n n n n
Individual Study/Individual TestTaking 7 7 3 11 19.9 1.10 2 3 7 2
Paired Study/Individual TestTaking 11 5 3 13 20.9 1.40 0 2 10 4
Paired Study/Paired TestTaking 9 7 5 11 20.7 1.10 0 3 8 5
Total 27 19 11 35 20.5 1.26 2 8 25 11

61
score was used. Only three out of 46 tests (6.5%) had a difference in the scores of
greater than two points. These three tests were evaluated jointly by the first and
second graders and an agreed upon reconciled score was assigned.
The same score was assigned to 23 out of 46 posttests (50%). In 20 out of
46 posttests (43.5%), there were two points or less difference and the first
grader’s
score was used. Only three out of 46 posttests (6.5%) had a difference in the
scores of greater than two points. These three tests were graded jointly by the first
and second graders and an agreed upon reconciled score was assigned.
Comments on Recorded Collaborative Study and Test Taking
Studies conducted by Salazar (1995) indicated that the process by which
individuals communicate can influence group decision making outcomes. He
categorized the types of communication into facilitative, disruptive, and
counteractive. Others (Hoffman & Maier, 1961; Salazar, 1995; Webb, 1986; Yager,
Johnson, & Johnson, 1985) discussed providing explanations and error checking
to improve group decision making. During the study sessions, three pairs of the
paired study with paired test taking and the three pairs of the paired study with
individual test taking were audio taped to provide insights into the decision making
process of the pairs. The same three pairs of the paired study with paired test
taking groups were audio taped during the completion of the test instrument.
Of the six pairs that were audio taped, a dominant member emerged in five
of them. In only one pair did both members seem to be roughly equivalent
partners in the development of a solution. In four of the five groups with dominant

62
members, the leader attempted to include the other member in the problem-
solving process. The most common ways of engaging the other member of the
pair were explaining the concepts to promote understanding so the nondominant
member could become a contributor, and error checking by asking questions that
required a response and participation from the nondominant member. These
questions were generally effective as the nondominant members increased their
participation in solving the problem. By the end of the study session, the level of
participation was generally equal among the group members for the four groups
that initially had dominant members. In the one pair whose level of participation
was equivalent from the beginning of the study session, they remained equal
partners until its completion. However, the interaction, i.e., the number and detail
of the explanations and error checking, between the members of the taped group
especially during the study sessions, indicated ability differences.
After reading the problems, the periods of silence were approximately 20 to
65 seconds although a few were as long as two minutes. These periods of
silence did not appear to be disruptive to the participants. The type of
communication used in the paired groups was overwhelmingly
facilitative—members stayed on task, did not try to avoid working the problem, and
shared information. However as the collaboration continued, the participants
seemed to become more interactive and more equivalent in their contribution of
information toward formulating a solution. The exception was in one of the
recorded groups during the study session where the participants were to take their
tests individually. The dominant member exhibited disruptive communication
63
behavior when she refused to allow her partner to contribute his ideas. In the
beginning of the process, he tried to be part of the decision making process and
take counteractive behavior to find a satisfactory solution. However, she stated “I
just kinda got on a roll” (Sessions, 1997) and she continued to work alone. As this
behavior continued, her partner emitted fewer responses and little collaborative
work was accomplished in this pair. Although the female participant’s ability score
was 124.52 compared to 97.15 for the male participant, it is unclear if the
difference in ability level contributed to the disruptive behavior. However, their test
and posttest scores were equivalent: 95 test and 74 posttest scores for the
female participant, and 91 test and 74 posttest scores for the male participant.
The audio recordings from paired groups during test taking revealed
marked differences from the paired groups during the study session in the
interaction and status of the paired group members. Members assumed more
equal roles and it was more difficult to determine the dominant member. Both
shared information immediately, error checking was decreased, and explanations
were briefer and less detailed. On several occasions the member who had been
nondominant in the study session provided complementary information that
augmented the problem-solving process.
Data Analysis
Before ANCOVA could be used to analyze the data, assumptions had to be
satisfied including determining the significance of ability covariate on variance in
test and posttest scores, establishing that mean level of ability level was equal
across the treatment groups, and determining the homogeneity of regression.

64
After meeting these assumptions, an ANCOVA was conducted to reveal the effect
of treatment on the variance of the test and posttest scores. The ability covariate
was measured by dividing the Scholastic Aptitude Test score by 1600 and the high
school grade point average by 5.0 and summing the two values. SPSS, version
7.5, was used to analyze the data.
No Significance in Ability (Covariate) Means for the Treatment Groups
ANOVA was conducted to determine if the mean ability level was equal
across the three treatment groups. No significant difference was found among the
mean ability levels of the three groups, F (2,43) = 0.06, p = 0.94. The means for the
three groups were 107.5 for individual study with individual test taking, 106.4 for
paired study with paired test taking, and 105.3 for paired study with individual test
taking. Refer to Table 3.
Significance of Ability Covariate
Ability as a covariate must have a significant effect variance in the test score
and posttest score in order to use ANCOVA for data analysis. The ability covariate
was created by using Scholastic Aptitude Test scores and high school grade point
averages, both of which had been measured before treatment occurred.
Therefore, treatment could not have an effect on ability. Ability as a covariate had a
significant effect on the variance in the test scores, F (1,42) = 5.46, p = 0.02, and the
posttest scores, F (1,42) = 24.77, p = 0.00. Refer to ANCOVA Tables 4 and 5.
The unadjusted and adjusted means for the test and posttest scores are
given in Table 6. The ability covariate resulted in a larger adjustment in the means
for the posttest scores than for the test scores. The test and posttest scores

65
Table 3
Analysis of Variance for Ability (Covariate) and Treatment Levels
Source DF SS MS F
A (Treatment) 2 35.98 17.99 0.06
ERROR 43 13302.11 309.35
TOTAL(Adj.) 45 13338.09

66
Table 4
Analysis of Covariance for the Test
Source DF SS MS F
X (ABILITY) 1 1287.084 1287.084 5.46*
A (TREATMENT) 2 1847.791 923.8955 3.92*
ERROR 42 9907.532 235.8936
TOTAL (Adj) 45 12952.8
*p < .05

67
Table 5
Analysis of Covariance for the Posttest
Source DF SS MS F
X (ABILITY) 1 12492.15 12492.15 24.77*
A (TREATMENT) 2 4476.571 2238.285 4.44**
ERROR 42 21181.94 504.3319
TOTAL (Adj) 45 37476.98
*p < .01
**p < .05

68
Table 6
Number of Participants, Range of Scores, and Unadjusted and Adjusted Means for the Test and Posttest Scores
Test Scores Posttest Scores
Groups N RangeUnadjusted
MeanAdjusted
Mean N RangeUnadjusted
MeanAdjusted
Mean
Individual Study/Individual Test Taking 14 28 - 97 14 9 - 85 M 72.57 72.22 37.36 36.25 SE 4.31 4.10 7.48 6.00
Paired Study/Paired Test Taking 16 64 -
10016 12 - 97
M 87.88 87.86 55.81 55.77 SE 4.03 3.84 7.00 5.61
Paired Study/Individual Test Taking 16 42 -
10016 19 - 100
M 81.69 82.01 58.19 59.20 SE 4.03 3.84 7.00 5.61

69
increased as ability increased, but the effect of ability on posttest scores was
greater.
Homogeneity of Regression
Homogeneity of regression or the assumption that the slopes of the ability
covariate and test score variable, and of the ability covariate and posttest score
variable were equal across the three levels of treatment was tested. To this end,
interaction variables (C1 and C2) were created to test the interaction of the ability
covariate and the treatment (group) variables. For both the test and posttest,
membership dummy variables were developed by assigning three numeric values
to a column named T1, and three numeric values to a column named T2. These
assigned values were multiplied by the ability covariate values to create the
interaction variables, C1 and C2. Table 7 and Table 8 show the ANCOVA results
for the three levels of treatment for the test and posttest, respectively.
Equality of slopes for the three levels of treatment was tested using Tables
4 and 7 for the test, F = -0.28, and Tables 5 and 8 for the posttest, F = 0.24. Both F
values were less than F 0.5 (2,40) = 3.23. Based upon the respective F values, the
slopes were assumed to be parallel for all three levels of treatment indicating that
there was no interaction between the ability covariate and treatment.
Significance of Treatment
ANCOVA showed treatment had a significant effect on the variance in the
test scores, F = 3.92, p < .05, and the posttest scores, F = 4.44, p < .05. Therefore,
the null hypothesis that no differences in treatment means measuring problem-
solving abilities would be found based on students’ test and posttest scores using

70
Table 7
Analysis of Covariance for Testing the Homogeneity of Regression for the Three
Levels of Treatment for the Test
Source DF SS MS F
X (ABILITY) 1 1202.482 1202.482 4.92
X (C1) 1 .2334851 .2334851 0.00
X (C2) 1 124.2976 124.2976 0.51
A (TREATMENT) 2 271.9965 135.9982 0.56
ERROR 40 9771.903 244.2976
TOTAL (Adj) 45 12952.8

71
Table 8
Analysis of Covariance for Testing the Homogeneity of Regression for the Three
Levels of Treatment for the Posttest
Source DF SS MS F
X (ABILITY) 1 10403.52 10403.52 19.88
X (C1) 1 216.9613 216.9613 0.41
X (C2) 1 .3365562 .3365562 0.00
A (TREATMENT) 2 521.0632 260.5316 0.50
ERROR 40 20932.06 523.3015
TOTAL (Adj) 45 37476.98

72
two treatment groups of collaborative study, with collaborative or individual test
taking, and a control group of individual study with individual test taking was
rejected. Refer to Table 4 and Table 5. Newman-Keuls post hoc test showed
significant differences in the means between the groups for the test score variable
and the posttest score variable. Refer to Table 9 and Table 10.
Significant differences were found between the adjusted means of the
individual study with individual test taking group (72.22) and the paired study with
paired test taking group (87.86) for the test score variable. The paired study with
paired test taking group had the higher mean by 15.64 points. However, no
significant differences were found between the means of the individual study with
individual test taking group (72.57) and the paired study with individual test taking
group (81.69) even though the paired study with individual test taking group scored
9.79 points higher. The two paired study groups had no significant differences.
However, the paired study with paired test taking group scored 5.85 points higher
than the paired study with individual test taking group. Refer to Table 9.
For the posttest score variable, significant differences were found between
the adjusted means of the individual study with individual test taking group (36.25)
and the paired study with paired test taking group (55.77), and between the
individual study with individual test taking group (36.25) and paired study with
individual test taking group (59.20). In both collaborative study groups the means
were higher than in the individual study group, 19.52 and 22.91 points,
respectively. However, there was no significant difference in the means of the
paired study (collaborative) groups. Refer to Table 5. Although no significance

73
Table 9
Differences in Means of the Treatment Groups and Results of Newman-Keuls
Post Hoc Test for the Test
Differences in Means
Means Group 1a Group 3b Group 2c
Group 1a 72.22 __ 9.79 15.64*
Group 3b 82.01 9.79 __ 5.85
Group 2c 87.86 15.64* 5.85__
aIndividual study with individual test taking
bPaired study with individual test taking
cPaired study with paired test taking
*p< .05

74
Table 10
Differences in Means of the Treatment Groups and Results of Newman-Keuls
Post Hoc Test for the Posttest
Differences in Means
Means Group 1a Group 2b Group 3c
Group 1a 36.25 __ 19.52* 22.95*
Group 2b 55.77 19.52* __ 3.43
Group 3c 59.20 22.95* 3.43__
aIndividual study with individual test taking
bPaired study with paired test taking
cPaired study with individual test taking
*p< .05

75
was found between the means of the paired study with individual test taking group
(59.20) and the paired study with paired test taking group (55.77), the paired study
with individual test taking group had a higher mean by 3.43 points on the posttest
than the paired study with paired test taking group. Refer to Table 10.
Summary
No significant difference was found among the means of the ability levels
(covariate) of the three levels of treatment indicating that ability was equal across
the groups. However, the ability covariate significantly contributed to the variance
in the test and posttest scores and was partialled out to reduce the error variance.
The slopes of the three treatment groups were equal for both the test and the
posttest studies indicating that there was no interaction between the ability
covariate and treatment.
Having met the above prerequisites, ANCOVA was used for data analysis
and significant differences among the means were found between the treatment
groups for both the test and posttest scores. Both of the collaborative study
groups had higher adjusted means than the individual study group on both the test
and the posttest scores. Refer to Table 6. Newman-Keuls post hoc test showed
significant differences between the means of the test scores for the individual
study with individual test taking group and the paired study with paired test taking
group as shown in Table 9. Newman-Keuls post hoc test showed significant
differences between the means of the posttest scores of the individual study with
individual test taking group and paired study with paired test taking group, and

76
between means of the individual study with individual test taking group and paired
study with individual test taking group as shown in Table 10.
77
CHAPTER V
Summary, Implications, Recommendations, and Conclusion
The final chapter summarizes the investigation of the effects of collaborative
learning strategies on formulating solutions to linear programming problems,
discusses the implication of the findings, and suggests areas for future research.
Implications and suggestions for future research have focused on how the results
can be used by college practitioners and researchers, who teach in four-year
business programs, to increase problem-solving abilities while preparing
students for the work world through the application of collaborative learning
strategies.
Summary
Forty-six students majoring in business at a small liberal arts college in
southwest Virginia participated in the investigation that studied the effects of using
collaborative learning for formulating solutions to linear programming word
problems. Linear programming theory was selected because it is a required core
course in the business curriculum and presents a formidable challenge for many
business majors. Further, the word problems could be designed to require
problem-solving skills as defined by Mayer (1983) and Trabasso (1977). The
following null hypothesis was tested: No differences in treatment means
measuring problem-solving abilities would be found based on students’ test and
posttest scores using two treatment groups of collaborative study, with
collaborative or individual test taking, and a control group of individual study with
individual test taking. The test was completed in the treatment groups as defined

78
in the null hypothesis and the posttest was completed individually by all
participants. To provide additional insights into collaborative problem solving,
three pairs in the study sessions from both collaborative treatment groups were
audio taped.
Although the participants were not randomly selected, they were randomly
assigned to the three treatment groups and to the pairs within the treatment
groups. The tests and posttests were evaluated based upon well-defined criteria
that can be found in Appendix E and Appendix K. A second grader independently
scored the tests and posttests to guard against researcher bias. Tests or
posttests that had a difference in scores of more than two points were jointly
evaluated by the researcher and second grader; otherwise, the researcher’s score
was used. Analyses were completed that established that the means for ability
between the three groups were equal, that the ability covariate had a significant
effect on variance in the test and posttest scores, and that the slopes of the
treatment groups were parallel for the ability covariate and the test and posttest
variables.
An analysis of covariance (ANCOVA) was performed on the test and posttest
data to partial out variance due to ability to increase the precision of the variance
due to treatment. Differences between the means were found for both the test and
posttest score variables, F = 3.92, p < .05 and F = 4.44, p < .05, respectively.
Newman-Keuls post hoc test showed significant differences between the adjusted
means of the individual study with individual test taking group (72.22) and the
paired study with paired test taking group (87.86) for the test score variable.

79
Significant differences were found between the adjusted means of the individual
study with individual test taking group (36.25) and the paired study with paired test
taking group (55.77), and between the individual study with individual test taking
group (36.25) and paired study with individual test taking group (59.20) for the
posttest score variable.
Implications of Findings
The findings from this experimental study with two types of collaborative
treatment and a control group need to be examined at two levels, after differences
in ability were partialled out. Firstly, statistical significance between collaboration
and improved problem solving needed to be established. Secondly, just as
important is the practical impact on student achievement and problem-solving
abilities as measured by test and posttest scores.
This investigation was an experimental study that controlled for ability, as a
covariate, and consisted of two treatment levels and control group. In addition,
strict controls were maintained that included developing the test and posttest
instruments that were examined by colleagues in the area of linear programming,
administering the test and posttest instruments based upon well defined
procedures, assigning scores after being evaluated by a second grader, and
meeting the demanding assumptions of ANCOVA. Since empirical data on
collaborative learning and group decision making at the collegiate level is sparse,
the results of this experimental study contribute to the evidence supporting the use
of collaborative learning and group decision making at four-year colleges.
80
The outcomes raised some issues and concerns that need further
examination before these methodologies are imported into classroom
environments. The next three sections discuss implications for the use of
collaborative strategies emerging from this research. Two of them specifically
consider implications arising from results of the test and posttest where each
finding is discussed, and the other addresses more general issues of employing
collaborative learning strategies as was discussed in Chapter 1.
Test Score Variable Results
To determine the effect of treatment on the variance of the test score
variable, three outcomes need to be examined. These included differences, if any,
between the individual study with individual test taking group and paired study with
paired test taking group, individual study with individual test taking group and
paired study with individual test taking group, and paired study with individual study
group and paired study with paired test taking group. The implications of each
outcome are examined individually.
Differences between the individual study with individual test taking and
paired study with paired test taking. Significant differences were found between
these two groups, with means of 72.22 for the individual study with individual test
taking group and 87.86 for the paired study with paired test taking group. This
difference of more than 15 points, on a 100 point scale, could convert to more than
two letter grades higher. If grades adequately assess mastery of course material
including problem solving abilities, collaborative learning could be particularly
meaningful to college students with an academically at-risk profile. However,

81
individual accountability is difficult or impossible to determine as students
complete the test interactively and individual contribution is de-emphasized or
discouraged.
As educators continue to search for models that interface with the work
world, the collaborative model is more applicable than the old competitive model
for organizations that must successfully compete in the global marketplace
(American Workers and Economic Change, 1996; Boyett & Boyett, 1995;
“Changing Nature,” 1997). As the nature of work changes (Bridges, 1994; Freiberg
& Freiberg, 1996), teams of individuals are being assembled to work
collaboratively. The quality of the team’s work is what employers are assessing,
not each member's individual effort. There is more responsibility put on the team
to deal with members who are “loafers” because the team is accountable for the
results. The treatment group of paired study with paired test taking closely
resembles this team model that continues to evolve in the work world.
A reduction in test taking anxiety could also result when students study and
take the test collaboratively. Many students find test taking situations extremely
stressful and this interferes with their processing and articulation of information
(Paulman & Kennelly, 1984; Mealey & Hurt, 1992). Collaborative partners can
provide these students with a support system that could ease their apprehensions
and confirm their correct responses, not only during the test taking session but
during the study sessions providing them with positive feedback and assistance in
preparing for the test. Additionally, students can learn important abilities from their
collaborative partners through modeling. Some of these could include how to

82
reason through a problem or the development of people skills. These valuable
attributes help students in their transition to the work world. As discussed in the
Introduction, Chapter 1, learning to work in teams and improving problem-solving
abilities benefit preparation for entering the work world after obtaining a bachelor’s
degree (Bridges, 1994; Freiberg & Freiberg; 1996; Green & Seymour, 1991; “High
Stakes, High Skills,” 1997).
Differences between the individual study with individual test taking and
paired study with individual test taking. Even though there was a difference of 9.79
points, on a 100 point scale, between the individual study with individual test taking
group (72.22) and the paired study with individual test taking group (82.01), it was
not significant. This may have been due to the small number of participants in
each group (14 to 16) and to the range of scores on the criterion variable (28 to 97
and 42 to 100, respectively). However, on this traditional 100 point scale used in
many four-year colleges, an increase of 9.79 points could result in one letter grade
higher. This increase in the grades of at-risk students could make a difference in
their academic successful. Individual accountability is maintained with the
treatment group of paired study with individual test taking and, as such, would
appeal to educators who are not ready to embrace fully some aspects of
collaborative learning strategies. One difficulty with implementing this strategy is
ensuring that the students take the collaborative study seriously as they may not
see an immediate gain since they would take the test individually.
Differences between the paired study with individual test taking and paired
study with paired test taking. No difference was found between the collaborative
83
study groups (individual test taking with a mean of 82.01 and paired test taking
with a mean of 87.86). The participants in the two groups were 14 and 16,
respectively, and the ranges of scores on the criterion variable were 42 to 100 and
64 to 100, respectively. The increase of 5.85 points, though not statistically
significant, may have practical significance and could result in students receiving
one letter grade higher. Some possible reasons that the mean score for the
collaborative test taking group was higher are that students may have reduced test
anxiety, have complementary knowledge and were able to learn from each other
while taking the test, and approached the test taking situation with a positive
attitude instead of one of dread. These may have resulted in students feeling
more in control of their learning situation and this confidence may have been
reflected in their test scores.
Posttest Score Variable Results
The posttest was given 17 days after the instruction session and the test
instrument, and the posttest was completed individually. It had a maximum
possible score of 100 points. Because of the difficulty of the material (formulating
solutions to linear programming word problems) and lack of reinforcement, the
overall mean of the posttest scores for all treatment groups (51.02) was lower than
the overall mean of the test scores for all treatment groups (81.07). Although all
treatment groups had difficulty recalling and applying linear programming theory
on the posttest, greater losses were suffered by the control group.
Differences between the individual study with individual test taking and
paired study with paired test taking. When determining the effect of treatment on
84
the variance of the posttest score variable, significant differences were found
between the individual study with individual test taking group (36.25) and the
paired study with paired test taking group (55.77). The difference of 19.52 points
between means of the groups on the posttest was remarkable, especially given
that the posttest was completed individually. The difference between the means
was greater on the posttest (19.52) than the test (15.44) for these two groups.
Certainly the previous discussion on implications associated with the differences
in the test scores of the treatment groups is applicable for the posttest scores.
At the college level, many professors may be reluctant to use collaborative
strategies, particularly when administering criterion-related achievement tests
because individual accountability is difficult to evaluate. Professional integrity is
compromised when students successfully complete a course as determined by
their final grade (frequently based on tests) and at a later time appear not to have
an appropriate grasp of the content. This is particularly problematic when
employers are disappointed in the preparation of the college graduate. If the tests
are completed in pairs, the possibility exists that students could receive a high
passing grade (based upon the knowledge of the paired member) and would not
have mastered any of the material. However, the finding that the participants of the
paired study with paired test taking group scored almost 20 points higher on a
posttest that was completed individually is a strong indicator that individual
learning may be substantially enhanced by collaboration including collaborative
test taking. If achievement tests measure acquisition of knowledge, this numeric
difference in the posttest scores between the individual study with individual test

85
taking group and the paired study with paired test taking group would represent a
significant contribution to students’ mastery of domain-specific content.
Differences between the individual study with individual test taking and
paired study with individual test taking. Significant differences were found between
the individual study with individual test taking group (36.25) and the paired study
with individual test taking group (59.20). The difference of 22.95 points between
means of the groups on the posttest was substantial, especially given that the
posttest was completed individually. The difference between the means was
greater on the posttest (22.95) than the test (9.79) for these two groups. Certainly
the previous discussion on implications associated with the differences in the test
scores of the treatment groups is applicable for the posttest scores..
Although the researcher expected that the paired study with individual test
taking group would outperform the individual study with individual test taking group
on the posttest, the disparity in the means from the test score and posttest score
for the paired study with individual test taking group was unanticipated. The
adjusted mean scores were 36.25 for the individual study with individual test group
(control), and 59.20 for the paired study with individual test taking group. One
reason for this outcome may be that collaborative in conjunction with individual
effort plays a key role in mastering abstract theories and enhancing problem-
solving abilities.
Differences between the paired study with individual test taking and paired
study with paired test taking. No significant difference was found between the
paired study with individual test taking group (59.20) and the paired study with

86
paired test taking group (55.77) for the posttest outcome. However, the paired
study with individual test taking group had a higher mean than the paired study
with paired test taking group by 3.43 points.. This result was somewhat
unexpected, especially since the paired study with individual test taking group had
a mean of 5.85 points lower than paired study with paired test taking group on the
initial test instrument with scores of 82.01 and 87.86, respectively, and less time
was spent working collaboratively. Although no significant differences were found
between the two collaborative treatment groups, the small sample size and
extreme range of scores may have clouded the results.
A possible explanation for a higher mean on the posttest of the paired study
with individual test taking group is that those members encoded the information
differently during the group study session knowing they would be solely
responsible for their score on the initial test instrument. The paired test takers
may have relied more upon their partners because they did not feel the urgency of
being solely responsible for knowing the material. Therefore, the paired test
takers may have approached the study session differently. Even though all
participants understood that they would take the posttest individually, participants
in the paired test taking group may not have considered the impact of this during
the study sessions since the posttest was not to be taken for 17 days. However,
working individually with the linear programming concepts in conjunction with
collaborative study may be an important variable in developing proficiencies in
many disciplines. Even though additional research is needed to more clearly
define the relationship between individual work and collaboration, the results of

87
this study would indicate that educators can integrate collaboration into the college
classroom while still maintaining individual accountability.
General Issues Associated with Collaborative Strategies
When examining the test and posttest studies, the results suggest that
students majoring in business at a four-year college had significantly improved
performance when formulating solutions to linear programming word problems
when working collaboratively in paired groups. These are students, who as an
aggregate, present an academically at-risk profile. The difference between the
scores of the treatment groups on the posttest, that were taken individually, was
marked between 19.52 and 22.95 points increase over the control group. On the
traditional 100 point scale used in many four-year colleges and universities, this
improved performance could convert to more than a two letter grade difference.
Since the word problems were designed to incorporate problem-solving
abilities, the results on the posttest score would indicate that collaborative learning
strategies may be more effective than traditional instructional methods for
mastering domain-specific content and problem-solving skills. Further,
collaborative pairs, both study and test taking, had a positive impact on group-to-
individual transfer for increased understanding of domain-specific content as
suggested by the significantly higher posttest scores for both collaborative groups.
Although it is unclear as to the specific level of responsibility that students
can assume for their learning, the higher posttest scores suggest that allotting
students of college age authority for their learning can have a positive impact on
their performance. It was interesting to find that the paired study with individual

88
test taking group had a higher score on the posttest than the paired study with
paired test taking group. Continued research is needed to determine the mix of
individual and group responsibilities that would optimize performance.
At the instructional level, this study would indicate that college professors
and administrators need to consider other instructional strategies and move away
from “doing business as usual.” Administrators can offer incentives and provide
for professional development programs to encourage professors to embrace
collaborative strategies. These incentives could include release time for
instructors to research alternative strategies and develop appropriate courses or
attend conferences and workshops on collaboration, and perhaps a cash stipend
could be offered for incorporating collaborative learning strategies into the
curriculum. The outcomes of this study, along with an accumulating body of
evidence, can be used by college instructors to support instructional policies and
curriculum changes at the operational level--in the classroom. Group work,
including comprehensive projects, homework, class work, and tests, can become
integral to successful completion of course requirements.
Recommendation for Further Research
This study raised important issues and concerns that need further
investigation in order to optimize the benefits of collaborative learning and group
decision making strategies in a four-year college environment. The issues
addressed in this section have impact on the college age student and have been
of particular interest to the researcher. Future studies need to be designed using
larger samples so that their results will not be as limited in generalizability.

89
Ethnicity and Gender
The researcher found no studies that had been conducted on groups
composed of specific ethnic groups or females. Even the extensive studies
conducted by Hoffman and Maier (1961) included only one all female group in
more the two years of research. This is of particular importance as collaborative
and cooperative learning strategies have been used to advance the academic
skills of disadvantaged populations that include minority groups.
Enhanced Learning for Drill and Practice Items
The studies on group decision making and collaborative learning have
focused on improved performance for problem-solving or critical thinking abilities
(Goldman, 1965; Gokhale, 1995; Hoffman & Maier, 1961; Klemm, 1994; Libby,
Trotman, & Zimmer, 1987; Waugh, 1997; Webb, Ender, & Lewis, 1986). Much
domain-specific content of various disciplines, including business, has required
students to acquire knowledge, such as vocabulary and assumptions, that can be
classified as “drill and practice” information. Frequently, difficulty has arisen when
applying the discipline-specific theories to problem-solving situations when the
basic foundational information has not been mastered. Although this study did not
address this issue directly, application of linear programming principles requires
the retention of foundational information. Studies at the elementary level (Johnson
& Johnson, 1994; Johnson, Johnson, & Smith, 1991; Slavin, 1990; Yager,
Johnson, & Johnson, 1985) have shown that cooperative learning can enhance
learning “drill and practice” content. However, few studies have examined the
effect of collaborative learning and group decision making on retention of drill and
90
practice content for college age students. The one exception to this was
Gokhale’s study (1995) where no significant difference on “drill and practice” items
was found, F = 1.91, p > .05.
Effect upon Problem Solving in Other Disciplines
This study was narrowly focused on current business majors whose
academic profile suggests that traditional lecture classes as conducted in many
colleges may interfere with learning course content. There is some support
(Gokhale, 1995; Klemm, 1994; Rau & Heyl, 1990) that collaborative learning
strategies may increase the performance of college students, although these
alternative strategies have not become part of the mainstream on most
campuses. The results of the current study showed considerable improvement in
test and posttest scores on formulating solutions to linear programming word
problem solutions that required problem-solving abilities. Although additional
studies are needed to support these results for business majors, students
majoring in other areas such as the liberal arts may likewise receive similar
benefits. Studies (American Assembly, 1992; Green & Seymour, 1991; Porter &
McKibbin, 1988; Useem, 1989) suggested that liberal arts majors have academic
profiles indicative of stronger academic abilities. However, this should not indicate
that they cannot realize benefits that will increase their academic performance
while acquiring abilities needed in the work world. The researcher would like to
replicate the conditions of this study with a representative group of liberal arts
majors.
91
Other Treatments
Although the body of knowledge on collaborative learning has been
accumulating, it is a relatively recent arrival to the educational arena and lacks a
theoretical framework (Gamson, 1994). Researchers have proceeded to identify
variables that maximize performance when employing collaborative learning
strategies. Continued research is needed to isolate and determine the impact on
performance variables from the relevant treatment variables. The next paragraph
discusses variations in treatment that have been of particular interest to the
researcher.
Although no significant difference was found on the posttest score between
the paired study and individual test taking group and the paired study with paired
test taking group, the higher mean from the paired study with individual test taking
was unexpected. Because the paired study with paired test taking group had more
exposure working collaboratively, the researcher had anticipated that this group
would have the higher mean on the posttest score. This raised the issue as to
whether there might be an interaction between individual work and collaborative
work. Individual and collaborative effort need to be manipulated to determine what
ratio of these two variables optimizes learning. Performance from the use of
collaborative learning strategies might be improved if the strategies were
combined with some level of individual effort.
Another area for future research would be to include an accountability
variable such as peer evaluations where every member of the group evaluated
each member’s contribution to the final product. The audio taped sessions clearly

92
indicated, in all but one of the groups, a dominant member. If participants were
receiving a portion of their course grade based upon peer evaluations, their
behavior in the group study and test taking sessions may alter their participation
level and affect performance.
The optimal size of the group for maximizing performance has not been
determined from the extant research. In order for collaboration to be effective, all
members of the group must participate. The audio tapes indicated that even with
a two member group, participation was not equal. As the group size increased,
the incidence of “social loafing” would be expected to increase as well. With fewer
group members, there is a decreased likelihood of those members having
complementary knowledge and resources to bring to the learning situation. In the
studies reviewed in Chapter II, none investigated the effects of group size.
The effect of group composition has not been clarified. In fact, it seemed
that the more studies that have been completed, the more the issue has been
clouded (Goldman, 1965; Hill, 1982; Hoffman & Maier, 1961; Salazar, 1995;
Stasson & Bradshaw, 1995; Waugh, 1996). Many variables continue to need
examination, including ability, personality types, ethnicity, and gender. Although
research has yielded conflicting results on group composition, the effects from
selection of group members must continue to be examined to avoid process loss.
Collaborative learning and its influence on problem-solving abilities must
be studied in the classroom instead of simulated in a laboratory setting. Although
some researchers claim to have accomplished this (Gokhale, 1995; Klemm,
1994; Rau & Heyl, 1990), their studies were closely aligned with cooperative

93
learning and they did not control for collaboration outside the classroom. In fact,
one of the more difficult aspects of studying the effects of collaboration is how to
prohibit students from helping participants in other groups outside the classroom
or assigned study sessions. Collaboration across groups would certainly bias the
results. However, regardless of the obstacles, studies on collaborative learning in
actual learning situations should be conducted.
Perceptions of Students
Classroom and learning strategies have frequently been implemented
without obtaining input from the audience they are trying to help, in this case the
college age students. Participants could provide important insights into problems,
caveats, and strengths of a developing paradigm that would maximize benefits of
the collaborative learning and group decision making strategies. Not only does
this issue need to be studied with quantitative procedures, but qualitative studies
need to be undertaken to understand the perceptions of students involved in
collaborative learning. Some questions that should be researched include the
following: Do students feel as if they have a better grasp of the concepts? Are they
more satisfied with and more excited about the learning experience? Are they
more willing to do the work? Do they feel that they have more reliable support
systems? Is their test anxiety reduced? Do they feel like they have more control
over their learning and educational experience? Do they feel more confident taking
the test? What are the negative aspects of collaborative learning? How might they
be mitigated? If questions such as these could be answered after careful thought
and investigation, the positive impact of collaborative learning would encompass

94
more than increasing students’ achievement test scores. College students would
be developing attributes that would provide them with advantages in their work and
personal lives.
Conclusion
Based upon the results of this study, collaborative learning strategy seems
to be an effective method of learning linear programming theory and promoting
problem-solving abilities as the collaborative study groups had higher mean
scores for both the test and the posttest. A crucial point in this investigation was
that the posttest was taken individually by participants in all treatment groups after
a 17 day interlude between instruction and posttest completion. Numeric
differences between the means of the collaborative treatment groups and the
control group were greater for the posttest scores as compared to the test scores.
The following null hypothesis was tested using ANCOVA with ability as a
single covariate, and it was rejected: No differences in treatment means
measuring problem-solving abilities would be found based on students’ test and
posttest scores using two treatment groups of collaborative study, with
collaborative or individual test taking, and a control group of individual study with
individual test taking. Significant difference in the means of the test score variable
was found between the individual study with individual test taking group (72.22)
and paired study with paired test taking group (87.86). No differences were found
between the two groups taking the test individually (paired study and individual
study) or between the two paired study groups. Significant differences in the
means of the posttest score variable were found between the means of the
95
individual study with individual test taking group (36.25) and the paired study with
individual test taking group (59.20), and between the means of the individual study
with individual test taking group (36.25) and the paired study with paired test taking
group (55.77). Again, no difference in the means of the posttest score was found
between the paired study groups.
Collaborative learning resulted in larger numerical differences in the
adjusted test and posttest scores of paired study and test taking groups (paired
and individual) as compared to the individual study with individual test taking
group. The differences in the means of the test scores were 9.79 points between
the individual study with individual test taking group and paired study with
individual test taking group, and 15.84 points between individual study with
individual test taking group and paired study with paired test taking group. The
disparity between the collaborative groups and control group was even more
pronounced for the posttest scores. The differences between the individual study
with individual test taking group and the paired study with paired test taking group
were 19.52 points, and between the individual study with individual test taking
group and paired study and individual test taking group were 22.95 points. At the
actual classroom level, these increases in achievement test scores could have a
major impact on the academic status of students and indicate that college
professors should not “continue to do business as usual.” Many educators and
businesspeople think that only minor changes to courses may be necessary to
incorporate collaboration strategies at the classroom level (Business Higher,
1997; “Changing Nature,” 1997). However, changing the mindset of professors,
96
who have functioned as content brokers and become dependent upon historically
entrenched curricula, presents a formidable challenge for most four-year
institutions of higher education (Business Higher, 1997; Gardiner, 1994; Green &
Seymour, 1991). Resources need to be reserved for professional development to
advance the use of collaborative learning in the classroom. In the current climate
of reduced budgets, college administrators may be reluctant to reallocate funds
from publishing activities to those that would encourage new teaching strategies.
However, the advantages accruing to students involved in collaborative learning
would not only impact mastering the course content, but also help them develop
attributes that would be beneficial in the work world, i.e., teamwork and problem
solving.
Although this study may be limited in its generalizability, the findings can be
generalized to similar populations, including students at small colleges who are
taking courses that involve mastering domain-specific content that require
problem-solving abilities. Since business students (the participants for this
experiment), as an aggregate, present with an academically at-risk profile,
collaborative study and collaborative test taking have the potential for substantially
increasing their understanding of course material and promote their academic
success.
In addition, the study raised a number of issues and concerns that need
further examination to avoid any detrimental effects to students from using
collaboration and group decision making learning strategies. Some of these
include the effect on the performance of different ethnic groups, the applicability to

97
all types of learning including “drill and practice,” the perceptions of students and
potentially positive psychological outcomes, the ratio of individual and collaborative
work to optimize performance, and the effects of collaborative learning strategies
on outcomes of students from other disciplines.
The results of this investigation provide a contribution to the growing body
of knowledge on collaboration, especially regarding its feasibility at the collegiate
level for business majors. This group of college students need learning
strategies that can help them realize their potential while preparing them for the
work world and for being positive contributors to various organizations and society
at large. At the same time, strategies used to promote learning should be closely
examined before being implemented at the classroom level in order to avoid
individual process loss. This makes continued research on collaboration and
group decision making pivotal issues in developing effective learning strategies
and undertaking curriculum changes.

98
REFERENCES
American Assembly of Collegiate Schools of Business. (1992, April).Management Education Report, St. Louis, MO: Primis.
American workers and economic change. (1996). A statement by the Researchand Policy Committee of the Committee for Economic Development.Washington, D. C.
Blandford, A. E. (1994). Teaching through collaborative problem solving. Journalof Artificial Intelligence in Education, 5(1), 51-84.
Boyett, J. H., & Boyett, J. T. (1995). Beyond workplace 2000: Essential strategiesfor the new American corporation. New York: Plume Books.
Bracey, G. W. (1994). Achievement in collaborative learning. Phi Delta Kappan,76(3), 254-255.
Bridges, W. (1994). Job shift: How to prosper in a workplace without jobs. NewYork: Addison-Wesley Publishing Company.
Bruffee, K. A. (1994). Making the most of knowledgeable peers. Change, 26(3),39-45.
Bruffee, K. A. (1995). Sharing our toys: Cooperative learning versus collaborativelearning. Change, 27(1), http://sbweb2.med.iacnet.com/infotac /session/n260/43/4793963/4!xm_38&bkm_4.
Business Higher Education Forum in affiliation with the American Council inEducation. (1997, January). Spanning the chasm: Corporate and academiccooperation to improve work-force preparation. Washington, D. C.
Center for Applied Technology and Career Exploration. (1997). What isC.A.T.C.E.? [Brochure]. Rocky Mt., VA: Franklin County School System.
Changing nature of technical skills training. (1997, September). WorkAmerica,14(8), Washington, D. C.: National Alliance of Business
Dillenbourg, P., & Self, J. A. (1996). What if the computer doesn’t know theanswer? Communications of the ACM, 103(8), 103-105.
Freiberg, D., & Freiberg, J. (1996). Nuts! Southwest Airlines’ crazy recipe forbusiness and personal success. Austin, TX: Bard Press.
Gamson, Z. F. (1994). Collaborative learning comes of age. Change, 26(5), 44-50.
99
Gardiner, L. F. (1994). Redesigning higher education: Producing dramatic gainsin student learning. (ERIC Document Reproduction Service No. ED 3944441).
Gokhale, A. A. (1995). Collaborative learning enhances critical thinking. Journalof Technology Education, 7(1), http://scholar.lib.vt.rdu/rjournals/JTE/jte-v7n1/gokhale.jte-v7nl.html.
Goldman, M. (1965). A comparison of individual and groups performance forvarying combinations of initial ability. Journal of Personality and SocialPsychology. 1, 210-216.
Graduate Management Programs. (1995). GMAT total score means byundergraduate major, sex, and testing year. Princeton, NJ: Educational TestingService.
Green, K. C. (1992). After the boom: Management majors in the 1990’s. NewYork: McGraw-Hill.
Green, K. C., & Seymour, D. (1991). Who’s going to run General Motors?: Whatcollege students need to learn today to become the business leaders oftomorrow. Princeton, NJ: Peterson’s Guide.
Hamm, M., & Adams, D. (1992). The collaborative dimensions of learning.Norwood, NJ: Ablex Publishing Corporation.
Hawkes, P. (1993, September). When pedagogies collide: The issue of authorityin collaborative and cooperative learning. Paper presented at conference onCollaborative Learning, Pennsylvania State University, PA.
High stakes, high skills: How workforce skills can make or break local economic.(1997, September). Workforce Economics, 3(3), Washington, D. C.: NationalAlliance of Business.
Hilke, E. V. (1990). Cooperative learning. Bloomington, IN: Phi Delta KappaEducational Foundation.
Hill, G. W. (1982). Groups vs. Individual performance: Are N + 1 heads better thanone? Psychological Bulletin, 91, 517-539.
Hoerner, J. L. (1995). Work-based learning: The key to school-to-work transition.Westerville, OH: Glencoe/McGraw-Hill.
Hoffman, L. R., & Maier, R.F. (1961). Quality and acceptance of problem solutionsby members of homogeneous and heterogeneous groups. Journal ofAbnormal and Social Psychology, 62, 401-407.

100
Hsiao, K. P. (1992). First generation college students. (ERIC DocumentReproduction Service No. ED 351079)
Johnson, D. W., & Johnson, R. T. (1994). Learning together and alone:Cooperative, competitive, and individualistic learning. Boston: Allyn and Bacon.
Johnson, D. W., Johnson, R. T., & Smith, K. A. (1991). Active learning:Cooperation in the college classroom. Edina, MN: Interaction Book Company.
Klemm, W. R. (1994). Using a formal collaborative learning paradigm forveterinary medical education. Journal of Veterinary Medicine Education, 21(1),2-6.
Lambert, R. (1978). Situations of uncertainty: Social influence and decisionprocesses. In H. Brandstatter, J. H. Davis, & H. Schuler (Eds.), Dynamics ofgroup decisions (pp. 53-74). London: Sage Publications.
Lankard, B. A. (1995). Business/industry standards and vocational programaccountability. (ERIC Document Reproduction Service No. ED 383857)
Law School Admission Council. (1995). Distribution of majors for LSAT.Newtown, PA: Data Services Group.
Libby, R, Trotman, K. T., & Zimmer, I. (1987). Member variation, recognition ofexpertise, and group performance. Journal of Applied Psychology, 72, 81-87.
Matthews, R. S., Cooper, J. L., Davidson, N., Hawkes, P. (1995). Building bridgesbetween cooperative and collaborative learning. Change, 27(4), 34-38.
Mayer, R. E. (1983). Mathematical ability. In R. J. Sternberg (Ed.), Human abilities:An information processing approach (pp. 127-150). San Francisco: Freeman.
Measley, D. L., & Host, T.R. (1992). Coping with test anxiety. College Teaching,40(4), 147-150.
Melton, J. A. (1996). Does math performance improve when students select theirown partners? Teaching and Change, 3(3), 244-259.
National Skill Standards Board. (n.d.). New employees will benefit from skillstandards. Washington, D. C.
Paulman, R. G., & Kennelly, Kevin J. (1984). Test anxiety and ineffective test taking:Different names, same construct? Journal of Educational Psychology, 76(2),279-288.

101
Piaget, J. (1959). Judgment and reasoning in the child. Totowa, N. J.: Littlefield,Adams & Co.
Porter, L. W., & McKibbin, L. E. (1988). Management education and development:Drift or thrust into the 21st century? New York: McGraw-Hill.
Rau, W., & Heyl, B. S. (1990). Collaborative learning. Teaching Sociology,18(April), 141-155.
Reddy, L. (1997, March). Long-term policy issues for preparing a workforce.Paper presented at the National Policy Seminar sponsored by the AmericanVocational Association. Washington, D. C.
Reich, R. (1992). Work of nations. New York: Vintage Press.
Romer, K. T., & Whipple, W. R. (1991). Collaboration across the power line.College Teaching, 39, 66-70.
Sadler, D. R. (1983). Evaluation and the improvement of academic learning.Journal of Higher Education, 54(1), 65-79.
Salazar, A. G. (1995). Understanding the synergistic effects of communication insmall groups: Making the most out of group member abilities. Small GroupResearch, 26(2), 169-199.
Schrage, M. (1990). Shared minds: The new technologies of collaboration. NewYork: Random House.
Sessions from collaborative study and test taking. (1997). (Tape No. 5).Unpublished audio recording from collaborative study, Ferrum College, Ferrum,VA.
Slavin, R. E. (1988). Student team learning. Washington, D. C.: NationalEducational Association.
Slavin, R. E. (1990). Research on cooperative learning: Consensus andcontroversy. Educational Leadership, January, 54-56.
Slavin, R. E. (1995). Cooperative learning: Theory, research, and practice.Boston: Allyn and Bacon.
Smith, B. L., & MacGregor, J.T. (1992). What is collaborative learning? InCollaborative learning: A source book for higher education. University Park,Pennsylvania State University, National Center on Postsecondary Teaching,Learning, and Assessment.

102
Snow, R. E. (1980). Aptitude and achievement. New Direction for Testing andMeasurement, 5, 39-59.
Snow, R. E., & Lohman, D. F. (1989). Implications of cognitive psychology foreducational measurement. Educational Measurement. New York: MacmillanPublishing Company.
Stasson, M. F., & Bradshaw, S. D. (1995). Explanations of individual-groupperformance differences. What sort of “bonus” can be gained through groupinteraction? Small Group Research, 26(2), 296-308.
Thurow, L. C. (1996). The future of capitalism: How today’s economic forcesshape tomorrow’s world. New York: William Morrow & Company, Inc.
Trabasso, T. (1977). The role of memory as a system in making transitiveinference. In R. V. Kail & J. W. Hagen (Eds.), Perspectives on the developmentof memory and cognition (pp. 333-366). Hillsdale, NJ: Lawrence ErlbaumAssociates.
Tuckman, J., & Lorge, I. (1962). Individual ability as a determinant of groupsuperiority. Human Relations, 15, 45-51.
Useem, M. (1989). Liberal education and the corporation: The hiring andadvancement of college graduates. New York: Aldine de Gruyer.
Wall, J. E. (1998). We need a common language. Techniques, 73(1), 46.
Waugh, C. K. (1996). The joint effects of group composition and instruction inconsensus-seeking on decision quality. Unpublished doctoral dissertation,Virginia Polytechnic and State University, Blacksburg, VA.
Webb, N. M., Ender, P. & Lewis, S. (1986). Problem solving strategies and groupprocesses in small groups learning computer programming. AmericanEducational Research Journal, 23(2), 243-261.
Who’s Training Technical Workers. (1997, September). Workforce Economics,3(3), Washington, D. C.: National Alliance of Business.
Whitehead, A. N. (1929). The aims of education and other essays. New York:Macmillan Company.
Yager, S., Johnson, D. W., & Johnson, R. T. (1985). Oral discussion, group-to-individual transfer and achievement in cooperative learning groups. Journal ofEducational Psychology, 77(1), 60-66.

103
Zaleska, M. (1978). Some experimental results: Majority influence on groupdecisions. In H. Brandstatter, J. H. Davis, & H Schuler (Eds.), Dynamics of groupdecisions (pp. 67-74). London, Sage Publications.

104
Appendix A
Types of Knowledge in Test and Posttest Conforming to
Problem-Solving Criteria

105
TYPES OF KNOWLEDGE IN TEST AND POSTTEST CONFORMING TO PROBLEM-SOLVING CRITERIA
Test Instrument
Fresh Snackers, Inc. Linear Programming Word Problem
KNOWLEDGE EXAMPLE FROM TEST INSTRUMENTLinguistic “Snacks are produced in lots of 100 packages” means that
each time the snacks are made, there are 100 packagesmade of the same product.“…[H]ow many lots of each product to produce to maximizeprofits for a weekly time period” means that the decisionmaker wants to know how many 100-lot packages to produceover a seven-day period.
Factual Production of the three snacks cannot exceed the 640 poundsof flour because that is the total amount available for a weeklytime period.For every lot of Cookie Delight that is produced, $5.70 will beadded to profit.
Schema This type of problem is maximization of profit based uponlinear programming principles.
Strategic How many lots of 100 packages of Cup Cake Supremeshould be produced to maximize profits?How many pounds of chocolate are needed to produce theoptimal number of Cup Cake Supreme and Cookie Delight?
Algorithmic x1 = the number of 100-lot packages of Cup Cake Supreme tobe producedThe objective function is represented by Max Z = 6.00 x1 +7.39 x2 + 5.70 x3.
Abstract Management wants to have at least two times as manySnacker Crackers as Cup Cake Supreme. This comparisonrelationship is represented as x2/x1 > 2.Demand for Cookie Delight has never been greater than 12lots. This comparison relationship is represented as x3 < 12.
The format for delineating the types of knowledge was based upon the table used
by Mayer (1985, p. 131) in his work on problem solving.

106
Posttest Instrument
Sports Accessory R U, Inc. Linear Programming Word Problem
KNOWLEDGE EXAMPLE FROM POSTTEST INSTRUMENTLinguistic “The pieces of sports furniture are also popular as separate
items” means that customers can buy only one piece withoutpurchasing all three in a set.“The company refuses to take back orders” means that thecompany does not produce additional items of a produce tomeet a previous period’s demand.
Factual “The labor requirements for the baseball toy chest and thefootball chest are the same at 1.5 hours each” means that ittakes 1.5 hours of labor to produce each baseball toy chestand 1.5 hours of labor to produce each football chest.For each soccer end table that is produced, the cost will be$118 (which is have to be subtracted from profit).
Schema This type of problem is maximization of profit based uponlinear programming principles.
Strategic How many units of each piece of sports furniture need to beproduced to maximize profit?How many dollars are needed in the budget to produce theoptimal pieces of furniture given the other limited resources?
Algorithmic x2 = the number of football chest-of-drawers to produceThe budget constraint is represented by 65 x1 + 134 x2 + 118x3 < 7,000.
Abstract “Management does not want more than a three-to-one ratio offootball chests to soccer end tables. This comparisonrelationship is represented as x2/x3 < 3.The maximum demand for soccer end tables is about 40 perweek. This comparison relationship is represented as x3 <40.
The format for delineating the types of knowledge was based upon the table used
by Mayer (1985, p. 131) in his work on problem solving.

107
Appendix B
Model Formulation Instructions

108
MODEL FORMULATION INSTRUCTIONS
Brief Review of Models
All models deal with of variables, parameters, and the relationship between
the variables and parameters. Variables can take on an infinite number of values
depending upon the values of the parameter. Look at the example based on the
following equation:
12 x1 + 4 x2 = 32
If x1 = 2, then x2 = 2. However, if x1 = 1, then x2 = 5. We could even plug in such
numbers as .0001 for x1 and solve for x2. Variables are symbols that can assume
an infinite number of values.
Parameters are generally constant, numerical values that can change, but
only for different cases of the same problem. Many of the parameters are the
coefficients for the variables, but they can also exist alone as the number 32 does.
In the above example the numbers 12, 4, and 32 are the parameters. Parameters
can be changed to observe the effect on variables. If the parameters change, the
numeric values of the variables could change as well.
The relationship between the parameters and the variables must be
properly determined so that the model accurately represents the situation that it
defines. For example, if x1 represents the number of chairs to be produced and 12
pounds is the amount of wood to produce each chair, the relationship between the
wood and production of chairs is represented by 12 x1. However, if that
relationship should change and the pounds of wood to make each chair were 14
109
pounds, it is important that it be properly symbolized by 14x1. Otherwise, the
model would mispresent the actual situation.
Linear Models
Linear models are used by organizations, both profit and nonprofit, to extract
relevant elements from a decision making situation, manipulate them, and arrive
at a feasible solution. The bottom line is that linear models are used to help
businesses make decisions. They are mathematical models consisting of three
interacting components that includes:
• identifying the decision variables
• developing the objective function
• determining the systems constraints
Identifying the Decision Variables
Decision variables are mathematical symbols (i.e., x1, x2, and x3) that
represent problems to be solved or opportunities to be exploited. In other words,
they are things that managers make decisions about, and they are sometimes
referred to as solution variables. They represent some level of activity by an
organization and take on numeric values in the final solution. The final values of
the decision variables represent what the manager is making the decisions about.
Decision variables may be products to be produced, sales persons to be
allocated, money to be invested, and iron scrap to be minimized, to name a few.
For example in the equation 3x1 + 5x2 = 40, x1 could represent number of chairs to
be produced and x2 could represent number of tables. One possible solution

110
could be x1= 10 and x2 = 2 where 10 chairs and 2 tables were produced. The final
values of the decision variables constitute the decision.
Developing the Objective Function
The objective function mathematically represents the objective of the firm,
which is usually to maximize profit or minimize cost, although it can symbolize
such goals as minimizing iron scrap or maximizing the allocation of personnel.
The objective function describes this relationship in terms of the decision
variables and represents the sum total contribution of each decision variable
toward the objective of maximizing profit or minimizing cost. It is generally
measured in dollars and is represented by the symbol Z. However, because of the
limited time for conducting the learning sessions, only maximization problems will
be discussed.
An example of an objective function is Max Z = 100 x1 + 250 x2. Obviously,
this objective function is to maximize profit based upon two products: x1 (chairs)
and x2 (tables). The parameters represent the amount of profit per product
produced. Chairs (x1) contribute $100 per unit to profit and tables (x2) contribute
$250 per unit to profit. If, as given earlier, 10 chairs and 2 tables should be
produced to maximize profit, the Z value would be $1,500. Chairs would
contribute $1,000 to profit (100 x 10) and tables would contribute $500 to profit
(250 x 2).

111
Determining the Constraints
The last component of linear models is determining the system constraints.
The constraints represent the limited available resources that cannot be exceeded
or conditions that must exceed a minimum requirement. Usually the constraints
are inequalities, either >= or <=. Occasionally, the constraint is an equality, but that
greatly reduces the feasible solutions.
An example of a constraint is 3x1 + 4x2 <= 80 where 80 represents available
pounds of wood. As previously stated, x1 is the number of chairs to be produced
and x2 is the number of tables to be produced. It is important to remember that
profit can be maximized or cost minimized without using all 80 pounds of the
wood, which is the reason for using <= instead of =. The parameter 3 represents
the pounds of wood needed to produce each chair. If 10 chairs were produced,
the amount of wood to produce those 10 chairs is 30 pounds. The amount of
wood to produce each table is 4 pounds. The amount of wood to produce 2 tables
is 8 pounds. In this case, 38 pounds of wood would be used to produce the chairs
and tables. This product mix would not use all the available wood.
Each time you have an available resource or a minimum requirement, it will
need to be modeled as a constraint involving parameters, variables, and the
relationship between them. In addition, the constraints are to be preceded by
“subject to” or “s. t.” because the objective function is maximized based upon the
resources needed for each decision variable and the available resources as they
are presented in the constraints.
112
Problems for Learning Session Work
The problems in the learning session were worked following the linear
programming guidelines by identifying the decision variables, developing the
objective function, and determining the systems constraints. Several of the
problems were taken from the Quantitative Methods text used at the liberal arts
college where the research was conducted (Taylor, 1996). They were used in the
regular, semester class and the researcher wanted to provide as much similarity
between the actual class and the investigation as possible.
Various parts of the word problem were analyzed to reduce them to
manageable units. They were then synthesized into a coherent model
representing the problem to be solved or the opportunity to be exploited. The
discussion included how to determine the decision variables and the objective
function, as well as how to symbolize the relationship between the parameters
and the decision variables in both the objective function and the constraints. Each
student participating in the study was given a copy of each problem to refer to
throughout the learning session.
First Learning Session Problem
The Colonial Pottery Company produces designer bowls and mugs. The
company has limited amounts of three resources used in the production of these
products—clay, labor, and solvent. Given these limited resources, the company
wants to know how many bowls and mugs to produce each day in order to
maximize profit. Resource utilization for each product and the total available units
of each resource are given in the diagram below.

113
Product Labor(hours/unit)
Clay(pounds/unit)
Solvent(ounces/unit)
Bowl 1 4 5Mug 2 3 3.5
Total Available 40 120 65
The profit from each bowl is $40 and from each mug is $55.
Identify decision variables
x1 = number of bowls to produce
x2 = number of mugs to produce
Develop the objective function
Max Z = 40x1 + 55x2
Develop the system constraints
subject to
x1 + 2x1 <= 40 labor constraint
4x1 + 3x2 <= 120 clay constraint
5x1 + 3.5 x2 <= 65 solvent constraint
Second Learning Session Problem
An investor has $70,000 to invest in several alternatives. They include
municipal bonds with a return of 6.5%, certificates of deposit with a return of 8.3%,
treasury bills with a return of 7.8%, and growth stock with a return of 12%. The
amount of time until maturity is the same for each alternative. However, each
investment alternative has a different perceived risk to the investor, and as a result
she wants to diversify. The investor wants to know how much to invest in each

114
alternative to maximize the return. She has five requirements. They are given
below.
1) No more than 20% of the total investment should be in growth stock.
2) The amount invested in certificates of deposits should not exceed the amount
invested in the other three alternatives.
3) At least 30% of the investment should be in treasury bills and certificates of
deposit.
4) The ratio of the amount invested in municipal bonds to the amount invested in
treasury bills should not exceed one to three.
5) The investor wants to invest the entire $70,000.
Identify the decision variable
x1 = dollars invested in municipal bonds
x2 = dollars invested in certificates of deposit
x3 = dollars invested in treasury bills
x4 = dollars invested in growth stock
Develop the objective function
Max Z = .065 x1 + .083 x2 + .078 x3 + .12 x4
Determine the systems constraints
subject to
x4 <= 14,000 invested in growth stock
x2 <= x1 + x3 + x4 invested in certificates of deposit
converted to x2 - x1 - x3 - x4 <= 0

115
x3 + x2 >= 21,000 invested in certificates of deposit and treasury bills
x1/x3 <= 1/3 ratio of municipal bonds to treasury bills
converted to 3x1 - x3 <= 0
x1 + x2 + x3 + x4 = 70,000 total invested
Explain why this constraint would be better represented with <= inequality.
Third Learning Session Problem
Quik Screen is a clothing manufacturing company that specializes in
producing commemorative shirts immediately following major sporting events like
the World Series, Super Bowl, and Final Four. The company has been contracted
to produce a standard set of shirts for the winning team, either State University or
Tech, following a college football bowl game on New Year’s Day. The items
produced include two sweatshirts, one with silk screen printing on the front and
one with print on both sides, and two T-shirts of the same configuration. The
company has to complete production of the sweatshirts and T-shirts within 72
hours after the game. At that time, a trailer truck will pick up the shirts. The
company will work around the clock. The truck has enough capacity to
accommodate 1,200 standard-size boxes. A standard-size box holds 12 T-shirts,
whereas a box of one dozen sweatshirts is three times the size of a standard box.
The company has budgeted $25,000 for the production run. They have 500 dozen
blank sweatshirts and 500 blank T-shirts each in stock ready for production. The
processing time (in hours) for sweatshirts (per dozen) printed on the front is 0.10,
for sweatshirts printed on front/back is 0.25, for T-shirts printed on the front is .08,
and for T-shirts print on front/back is 0.21. The cost (in dollars) to produce the

116
shirts (per dozen) is $36 for sweatshirts printed on the front, $48 for sweatshirts
printed on front/back, $25 for T-shirts printed on the front, and $35 for T-shirts
printed on front/back. Profit (per dozen) is $90 from the sweatshirts printed on the
front, $125 for sweatshirts printed on front/back, $45 for T-shirts print on the front,
and $65 for T-shirts printed on the front/back.
The company wants to know how many dozens (boxes) of each type of shirt
to produce to maximize profit.
Identify the decision variables
x1 = number of dozens of sweatshirts with front printing
x2 = number of dozens of sweatshirts with front/back printing
x3 = number of dozens of T-shirts with front printing
x4 = number of dozens of T-shirts with front/back printing
Develop the objective function
Max Z = 90 x1 + 125 x2 + 45 x3 + 65 x4
Determine the systems constraints
subject to
0.10 x1 + 0.25 x2 + 0.08x3 + 0.21x4 <= 72 Processing hours
3x1 + 3x2 + x3 + x4 <= 1,200 Truck storage—capacity in standard size boxes
36 x1 + 48 x2 + 25 x3 + 35 x4 <= 25,000 Budget
x1 + x2 <= 500 Total sweatshirts available
x3 + x4 <= 500 Total T-shirts available

117
Appendix C
Linear Programming Study Problems

118
Linear Programming Study Problems
Problem #1
A publishing house publishes three weekly magazines--Daily Life,
Agriculture Today, and Surf’s Up. Publication of the magazines requires
production time, paper, and storage. Daily Life requires 0.01 hour of production
time; Agriculture Today, 0.03; and Surf’s Up, 0.02. The paper requirement for Daily
Life is 0.2 pounds; Agriculture Today, 0.5 pounds; and Surf’s Up, 0.3 pounds. The
storage requirements for Daily Life are 0.125 square feet; Agriculture Today, 0.2
square feet; and Surf’s Up, 0.125 square feet.
Each week the publisher has 120 hours of production time and 3,000
pounds of paper available to produce the magazines. Total circulation for all three
magazines must exceed 5,000 issues per week if the company is to keep its
advertisers. Total storage space is 4,000 square feet. The selling price per issue
is $2.25 for Daily Life, $4.00 for Agriculture Today, and $1.50 for Surf’s Up. Based
on past sales, the publisher knows that the maximum weekly demand for Daily
Life is 3,000 issues; for Agriculture Today, 2,000 issues; and for Surf’s Up, 6,000
issues. The production manager wants to know the number of weekly issues of
each magazine to produce to maximize total sales revenues.
Formulate a linear programming model for this problem.
Solution #1
Identify the decision variable
x1 = number of Daily Life
x2 = number of Agriculture Today

119
x3 = number of Surf’s Up
Develop the objective function
Max Z = 2.25 x1 + 4.00 x2 + 1.50 x3
Determine the system constraints
subject to
.01 x1 + .03 x2 + .02 x3 <= 120 hours of production
.2 x1 + .5 x2 + .3 x2 <= 3,000 pounds of paper
.125 x1 + .2 x2 + .125 x3 <= 4,000 square feet of storage
x1 + x2 + x3 > 5,000 minimum total circulation
x1 <= 3,000 maximum demand for Daily Life
x2 <= 2,000 maximum demand for Agriculture Today
x3 <= 6,000 maximum demand for Surf’s Up
Problem #2
The Southfork Feed Company makes three types of feed mix, Ultra
Supreme, Premium, and Budget, in 100 pound bags. Four ingredients, consisting
of oats, corn, soybeans, and a vitamin supplement, are used in varying amounts
for each of the three types of feed. The company has 1300 pounds of oats, 1400
pounds of corn, 1600 pounds of soybeans, and 1150 pounds of vitamin
supplement available for the mixes.
Each bag of Ultra Supreme takes 40 pounds of vitamin supplement, each
bag of Premium takes 25 pounds, and each bag of Budget takes 5 pounds. Corn
is the cheapest ingredient. Each bag of Ultra Supreme takes 10 pounds of corn,

120
each bag of Premium takes 20 pounds of corn, and Budget takes 50 pounds of
corn. Each bag of Ultra Supreme takes 25 pounds of oats, each bag of Premium
takes 20 pounds of oats, and each bag of Budget gets 20 pounds of oats.
Soybeans are an essential ingredient because they contain vital ingredients for
farm animals. Each bag of Ultra Supreme takes 25 pounds of soybeans, each
bag of Premium takes 45 pounds, and each bag of Budget takes 20 pounds.
Southfork’s management has decided that the production must include at least
175 bags of feed and at least 70 bags need to be the Budget line of feed. The
maximum demand for Ultra Supreme is 50 bags. The ratio of Budget to Premium
feed cannot exceed 2 to 1. The cost to produce a bag of Ultra Supreme is $3.75, a
bag of Premium is $3.25, and a bag of Budget is $1.50. The feed company has a
budget of $5,000 to produce the feed. The profit from a bag of Ultra Supreme is
$9.50, from a bag of Premium is $7.75, and from a bag of Budget is $5.00. The
production manager at Southfork Feed Company wants to know how many bags of
each type of feed to produce to maximize profit.
Formulate a linear programming model for this problem.
Solution #2
Identify the decision variable
x1 = number of 100 pound bags of Ultra Supreme
x2 = number of 100 pound bags of Premium
x3 = number of 100 pound bags of Budget
Develop the objective function
Max Z = 9.50 x1 + 7.75 x2 + 5.00 x3

121
Determine the systems constraints
subject to
25 x1 + 20 x2 + 20 x3 <= 1300 pounds available oats
10x1 + 20 x2 + 50 x3 <= 1400 pounds available corn
25 x1 + 45 x2 + 20 x3 <= 1600 pounds available soybeans
40 x1 + 25 x2 + 5 x3 <= 1150 pounds available vitamin supplement
x1 + x2 + x3 >= 175 total bags of feed
x3 >=70 bags of Budget feed
x1 <= 50 maximum demand for Ultra Supreme feed
x3/x2 <= 2 ratio of Budget to Premium feed
converted to x3 - 2x2 <= 0
3.75 x1 + 3.25 x2 + 1.5 x3 <= 5000 total budget for production of feed
Problem #3
The Friendly family grows apples on its farm, which they harvest each fall
and make into three products, apple butter, applesauce, and apple jelly. They sell
these three items at several local grocery stores, at craft fairs in the region, and at
their Friendly Farm Pumpkin Festival which lasts for two weeks in October. Their
primary resources are cooking time in their kitchen, their own labor time, and the
apples, They have a total of 500 cooking hours available, and it requires 3.5 hours
to cook a 10-gallon batch of apple butter, 5.2 hours to cook 10 gallons of
applesauce, and 2.8 hours to cook 10 gallons of jelly. A 10-gallon batch of apple
butter requires 1.4 hours of labor, a batch of sauce takes 0.8 hour, and a batch of

122
jelly requires 1.5 hours. They have 240 hours of labor available during the fall.
They produce about 6,500 apples each fall. A batch of apple butter requires 40
apples, a 10-gallon batch of applesauce requires 55 apples, and a batch of jelly
requires 20 apples. After the products are canned, a batch of apple butter will
generate $190 in sales revenue, a batch of applesauce will have a revenue of
$170, and a batch of jelly will generate sales revenue of $155. The apple jelly has
the greatest demand so the Friendlys want a least 30% of the product mix to be
apple jelly. There is a budget of $15,000 and the cost of producing a 10-gallon
batch of apple butter is $100, a batch of applesauce is $65, and a batch of apple
jelly is $60. Demand for apple butter is at least 32 10-gallon batches.
The Friendlys want to know how many batches of apple butter, sauce, and
jelly to produce to maximize their profit.
Formulate a linear programming model for this problem.
Solution #3
Identify the decision variables
x1 = number of 10-gallon batches of apple butter
x2 = number of 10-gallon batches of applesauce
x3 = number of 10-gallon batches of apple jelly
Develop the objective function
Max Z = 90 x1 + 105 x2 + 95 x3
Determine the system constraints
subject to
3.5 x1 + 5.2 x2 + 2.8 x3 <= 500 hours of cooking

123
1.4 x1 + 0.8 x2 + 1.5 x3 <= 240 hours of labor
40 x1 + 55 x2 + 20 x3 <= 6,500 apples
x3 >= .3 (x1 + x2 + x3) ratio of apple jelly to product mix
converted to -0.3x1 - 0.3 x2 + .7 x3 >= 0
100 x1 + 65 x2 + 60 x3 <= 15,000 dollars in budget
x1 >= 32 demand for apple butter

124
Appendix D
Instrument for Test

125
INSTRUMENT FOR TEST
Description of Problem
Fresh Snackers, Inc. produces three snack products, Cup Cake Supreme,
Snacker Crackers, and Cookie Delight, to serve a small, regional district. The
main ingredients are flour, sugar, chocolate, milk, eggs, salt, and cream cheese.
The main processes are preparation hours and packaging hours. The snacks are
produced in lots of 100 packages.
The flour requirement for Cup Cake Supreme is 17 pounds, Snacker
Crackers is 15.1 pounds, and Cookie Delight is 16 pounds. Cup Cake Supreme
requires 17 pounds of sugar, Snacker Crackers takes 10 pounds, and Cookie
Delight takes 16 pounds. Chocolate is only used to make Cup Cake Supreme
and Cookie Delight using 7 pounds and 4 pounds, respectively. Milk requirement
is in gallons and Cup Cake Supreme needs 5 gallons, Snacker Crackers need 3
and Cookie Delight needs 2. Snacker Crackers and Cookie Delight both require
one dozen eggs, while Cup Cake Supreme takes 2 dozen. All three products take
0.4 ounces of salt per batch per product. Snacker Cracker requires 15 pounds of
Cream Cheese. Cup Cake Supreme requires 1 hour of preparation time, while
both Snacker Crackers and Cookie Delight both require 2 hours each. All three
products each require 1 hour of packaging to prepare them for the grocery stores
and vending machines.
Each lot of Cup Cake Supreme requires 0.025 transportation storage
space, Snacker Crackers require 0.01 transportation storage space, and Cookie
Delight requires 0.015 transportation storage space. Management has the

126
following resources available: 640 pounds of flour, 800 pounds of sugar, 150
pounds of chocolate, 400 gallons of milk, 80 dozens of eggs, 20 ounces of salt,
255 pounds of cream cheese, 80 hours of preparation time, 80 hours of
packaging, and 4 delivery trucks.
Fresh Snackers has a budget of $2,700 for the weekly production. It cost
$23.50 to produce each lot of Cup Cake Supreme, $21.00 for Snacker Crackers,
and $25.30 for Cookie Delight. The revenues from a lot of Cup Cake Supreme are
$29.25; from Snacker Crackers, $28.39; and from Cookies Delight, $31.00.
Snacker Crackers are the most popular product and Cup Cake Supreme the least
demanded. Management wants to product all three products to maintain a diverse
product line, and wants to have at least two times as many Snacker Crackers as
Cup Cake Supreme. In addition, demand for Cookie Delight has never been
greater than 12 lots.
Management wants to know how many lots of each product to produce each
week to maximize profits. Formulate the word problem based upon the linear
programming principles.

127
Model Solution
Identify The Decision Variables
x1 = number of 100 item lots of Cup Cake Supreme
x2 = number of 100 item lots of Snacker Crackers
x3 = number of 100 item lots of Cookie Delight
Develop The Objective Function
Max Z = 5.75 x1 + 7.39 x2 + 5.70 x3
Determine System Constraints
subject to
17 x1 + 15.1 x2 + 16 x3 <= 640 pounds of flour
17x1 + 10 x2 + 16 x3 <= 800 pounds of sugar
7x1 + 4 x3 <= 150 pounds of chocolate
5x1 + 3x2 + 2x3 <= 400 gallons of milk
2x1 + x2 + x3 <= 80 dozens of egg
15 x2 <= 255 pounds of cream cheese
0.4 x1 + 0.4 x2 + 0.4 x3 <= 20 ounces of salt
x1 + 2x2 + 2x3 <= 80 hours of preparation
x1 + x2 + x3 <= 80 hours of packaging
0.025 x1 + 0.01 x2 + 0.015 x3 <= 4 truck
23.50 x1 + 21.00 x2 + 25.30 x3 <= 2,700 dollars for budget
x2/x1 >= 2 ratio of Snacker Crackers to Cup Cake Supreme

128
converted to x2 - 2 x1 >= 0
x3 <= 12 maximum demand for Cookie Delight

129
Appendix E
Criteria to Evaluate Performance on Test Instrument
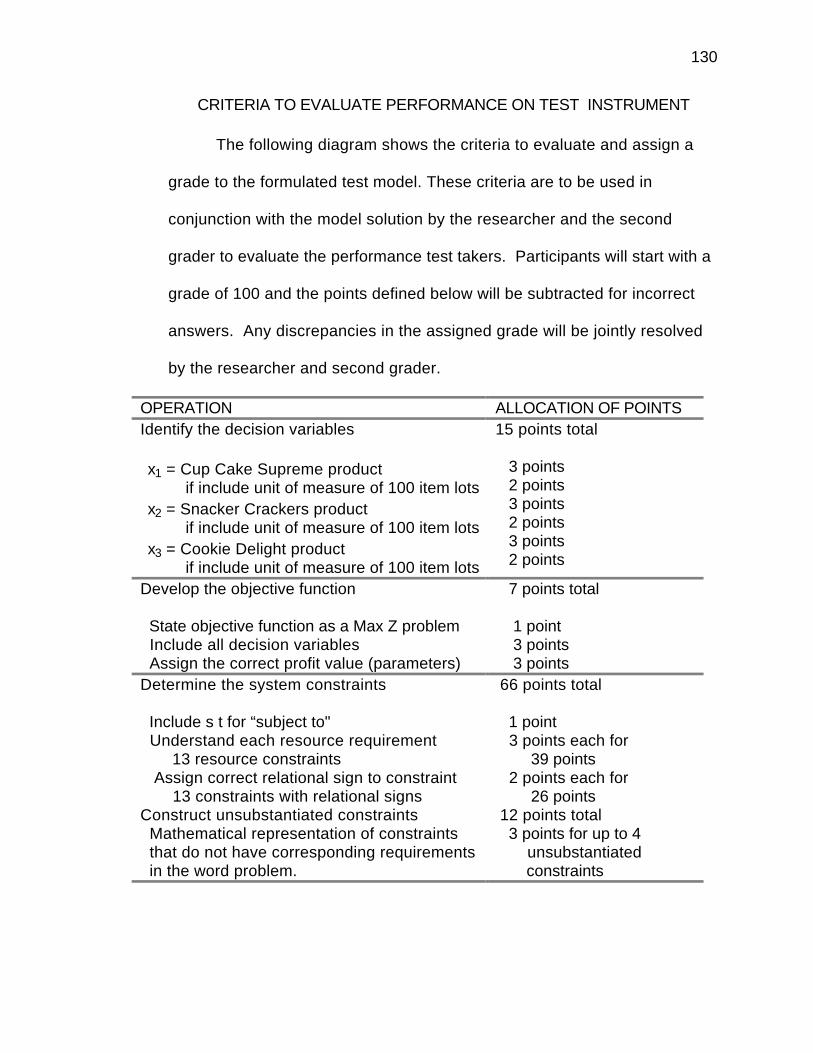
130
CRITERIA TO EVALUATE PERFORMANCE ON TEST INSTRUMENT
The following diagram shows the criteria to evaluate and assign a
grade to the formulated test model. These criteria are to be used in
conjunction with the model solution by the researcher and the second
grader to evaluate the performance test takers. Participants will start with a
grade of 100 and the points defined below will be subtracted for incorrect
answers. Any discrepancies in the assigned grade will be jointly resolved
by the researcher and second grader.
OPERATION ALLOCATION OF POINTSIdentify the decision variables
x1 = Cup Cake Supreme product if include unit of measure of 100 item lots x2 = Snacker Crackers product if include unit of measure of 100 item lots x3 = Cookie Delight product if include unit of measure of 100 item lots
15 points total
3 points 2 points 3 points 2 points 3 points 2 points
Develop the objective function
State objective function as a Max Z problem Include all decision variables Assign the correct profit value (parameters)
7 points total
1 point 3 points 3 points
Determine the system constraints
Include s t for “subject to" Understand each resource requirement 13 resource constraints Assign correct relational sign to constraint 13 constraints with relational signs
66 points total
1 point 3 points each for 39 points 2 points each for 26 points
Construct unsubstantiated constraints Mathematical representation of constraints that do not have corresponding requirements in the word problem.
12 points total 3 points for up to 4 unsubstantiated constraints

131
Appendix F
Grades Assigned by Researcher and Second Grader

132
GRADES ASSIGNED BY RESEARCHER AND SECOND GRADER
This appendix contains the evaluation of the test and posttest instruments
as scored by the first grader (researcher) and the second grader. If the scores
differed by two points or less, the first grader’s score was assigned. A difference
of three or more points in the test or posttest score was jointly rescored by the first
and second grader and a reconciled score was recorded.
TEST SCORES POSTTEST SCORES
IDNumber
PrimaryGrader
SecondGrader
Assigned/ReconciledScore
PrimaryGrader
SecondGrader
Assigned/ReconciledScore
1 100 100 100 89 89 893 37 36 37 12 13 124 99 99 99 100 100 1006 64 64 64 12 12 127 90 88 90 80 80 808 61 61 61 21 21 219 97 97 97 55 56 5510 74 74 74 12 12 1211 62 63 62 21 21 2112 78 72 73 56 57 5613 77 78 77 21 21 2114 96 94 96 60 58 6015 88 86 88 65 65 6516 92 93 92 72 72 7218 39 46 42 27 18 2219 97 97 97 82 82 8222 90 88 90 16 15 1623 95 95 95 73 73 7324 100 100 100 82 81 8225 83 81 83 91 89 9126 64 64 64 21 21 2128 91 92 91 74 73 7429 96 94 96 58 56 5830 76 76 76 76 76 7631 83 82 83 48 60 54
(diagram continues)
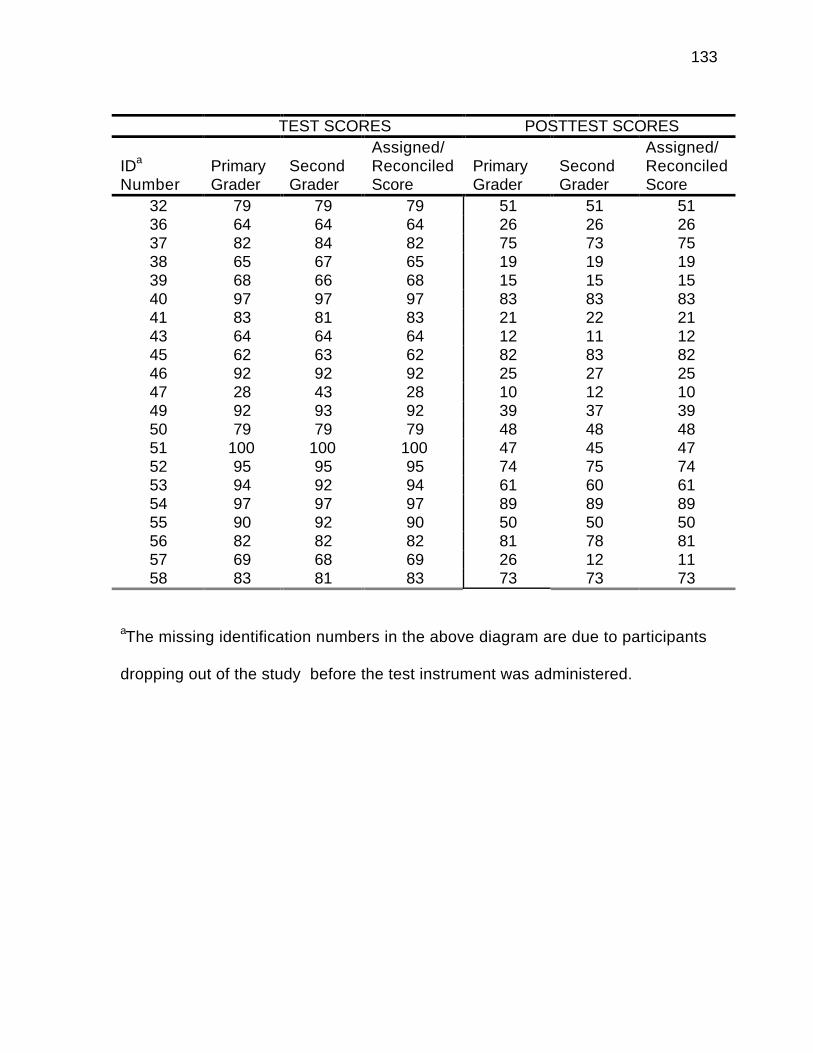
133
TEST SCORES POSTTEST SCORES
IDa
NumberPrimaryGrader
SecondGrader
Assigned/ReconciledScore
PrimaryGrader
SecondGrader
Assigned/ReconciledScore
32 79 79 79 51 51 5136 64 64 64 26 26 2637 82 84 82 75 73 7538 65 67 65 19 19 1939 68 66 68 15 15 1540 97 97 97 83 83 8341 83 81 83 21 22 2143 64 64 64 12 11 1245 62 63 62 82 83 8246 92 92 92 25 27 2547 28 43 28 10 12 1049 92 93 92 39 37 3950 79 79 79 48 48 4851 100 100 100 47 45 4752 95 95 95 74 75 7453 94 92 94 61 60 6154 97 97 97 89 89 8955 90 92 90 50 50 5056 82 82 82 81 78 8157 69 68 69 26 12 1158 83 81 83 73 73 73
aThe missing identification numbers in the above diagram are due to participants
dropping out of the study before the test instrument was administered.
134
Appendix G
Recorded Times for Completing Test
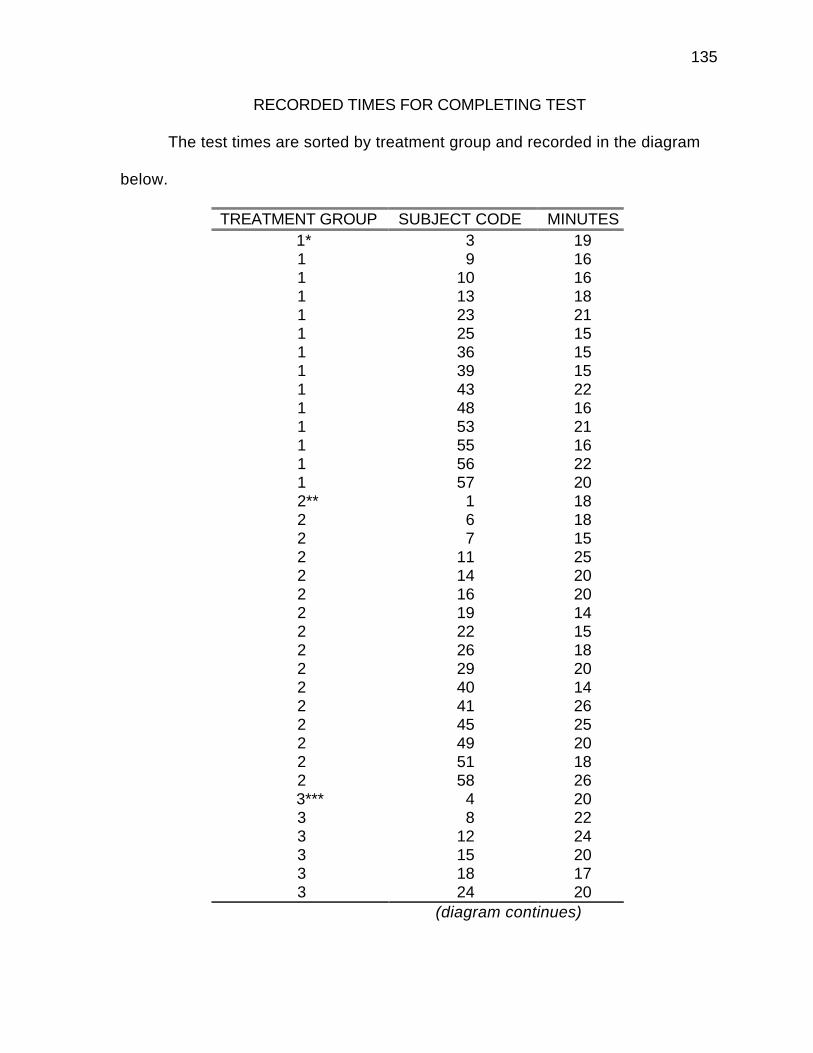
135
RECORDED TIMES FOR COMPLETING TEST
The test times are sorted by treatment group and recorded in the diagram
below.
TREATMENT GROUP SUBJECT CODE MINUTES 1* 3 191 9 161 10 161 13 181 23 211 25 151 36 151 39 151 43 221 48 161 53 211 55 161 56 221 57 20
2** 1 182 6 182 7 152 11 252 14 202 16 202 19 142 22 152 26 182 29 202 40 142 41 262 45 252 49 202 51 182 58 26
3*** 4 203 8 223 12 243 15 203 18 173 24 20
(diagram continues)

136
TREATMENT GROUP SUBJECT CODE MINUTES3 28 153 30 213 31 193 32 173 37 173 38 193 46 233 50 183 52 203 54 20
*Treatment group 1 had individual study with individual test taking.
**Treatment group 2 had collaborative study with collaborative test taking.
***Treatment group 3 had collaborative study with individual test taking.

137
Appendix H
Instrument for Posttest

138
INSTRUMENT FOR POSTTEST
Description of Problem
Sports Accessories R U, Inc. produces three pieces of sports shaped
furniture. They include a baseball toy chest, a football chest-of-drawers, and a
soccer end table. Although these sports are not the same, many customers, buy
all three as a set to be placed in their sons’ and daughters’ rooms and use the
soccer end table as a bedside stand. They are also popular as separate items.
For example, the soccer end tables are becoming popular additions to dens.
However, the demand for soccer end tables has been only about 40 per week. The
company refuses to take back orders but as many football chests as can be
produced can be sold. Management wants at least a 3 to 1 ratio of football chests
to soccer end tables.
The available resources include 1450 pounds of wood, 910 gallons of paint,
60 ounces of glue, 1050 screws, 12 cans of finishing solution, and 306 hours of
labor. The available machine hours are 42 hours of sanding, 80 hours of cutting,
and 28 hours of lathing. The company owns a warehouse that provides 1500
square feet of storage space.
The baseball toy chest requires 2.3 pounds of wood, the football chest
requires 7.9 pounds, and the soccer table requires 4.9 pounds. The paint
requirement for the baseball chest is 1.5 gallon, for the football chest is 0.8 gallon,
and for the soccer end table is 0.8 gallon. All products take 0.7 ounces of glue.
The baseball toy chest takes 8 screws, the football chest 16 screws, and the
soccer table 12 screws. The fumes from the finishing solution are irritating to the

139
workers and only the minimum amount is applied which is 0.08 can for the
baseball toy chest, 0.12 can for the football chest, and 0.1 can for the soccer end
table. The labor requirements for the baseball toy chest and the football chest are
the same at 1.5 hours each, while the soccer end table requires 2 hours of labor.
The machine hours for each product include the following. The baseball toy
chest requires 0.2 hours of sanding, the football chest requires 0.10 hours, and
the soccer end table requires 0.35 hours. The cutting hour requirement for the
baseball toy chest is 0.8 hours, for the football chest 0.5 hours, and for the soccer
end table 1.2 hours. Only two products require the lathe machine; the baseball toy
chest takes 0.4 hours and the football chest takes 0.3 hours. Each baseball toy
chest requires 6 square feet of storage space, each football chest-of-drawers
requires 8 square feet, and each soccer end table requires 3.5 square feet. The
revenues received for the sale of each baseball toy chest is $105, for each football
chest-of-drawers is $189, and for each soccer end table is $156. Sports
Accessory R U, Inc. has a maximum weekly budget of $7,500 for production of
these three products. The cost to produce each baseball toy chest is $65, for each
football chest-of-drawers is $134, and for each soccer end table is $118.
Management wants to know how many units of each product to produce to
maximize profits for a weekly time period. Formulate the word problem based
upon linear programming principles.

140
Model Solution
Identify The Decision Variables
x1 = the number of baseball toy chest to produce
x2 = the number of football chest-of-drawers to produce
x3 = the number of soccer end tables to produce
Develop The Objective Function
Max Z = 40 x1 + 55 x2 + 38 x3
Determine The System Constraints
subject to
2.3 x1 + 7.9 x2 + 4.9 x3 <= 1450 pounds of wood
1.5 x1 + 0.8 x2 + 0.8 x3 <= 910 gallons of paint
0.7 x1 + 0.7 x2 + 0.7 x3 <= 60 ounces of glue
8 x1 + 16 x2 + 12 x3 <= 1050 number of screws
0.08 x1 + 0.12 x2 + 0.1 x3 <= 12 cans finishing solution
1.5 x1 + 1.5 x2 + 2 x3 <= 306 hours of labor
0.2 x1 + 0.1 x2 + 0.35 x3 <= 42 machine hours for sanding
0.8 x1 + 0.5 x2 + 1.2 x3 <= 80 machine hours for cutting
0.4 x1 + 0.3 x2 <= 28 machine hours for lathe work
x3 <= 40 maximum demand for soccer end tables
6 x1 + 8x2 + 3.5 x3 <= 1500 square feet of storage space
x2/x3 <= 3 ratio of football chests-of-drawers to soccer end tables

141
converted to x2 - 3x3 <= 0
65 x1 + 134 x2 + 118 x3 <= 7500 dollars available to produce product mix

142
Appendix I
Pledge

143
PLEDGE
I, ____________________________, pledge that I have received PARTICIPANT’S NAME—PRINT YOUR NAME
no additional instruction and have not engaged in additionalstudy
of linear programming theory.
__________________________________ SIGNATURE OF TEST TAKER

144
Appendix J
Recorded Times for Completion of Posttest
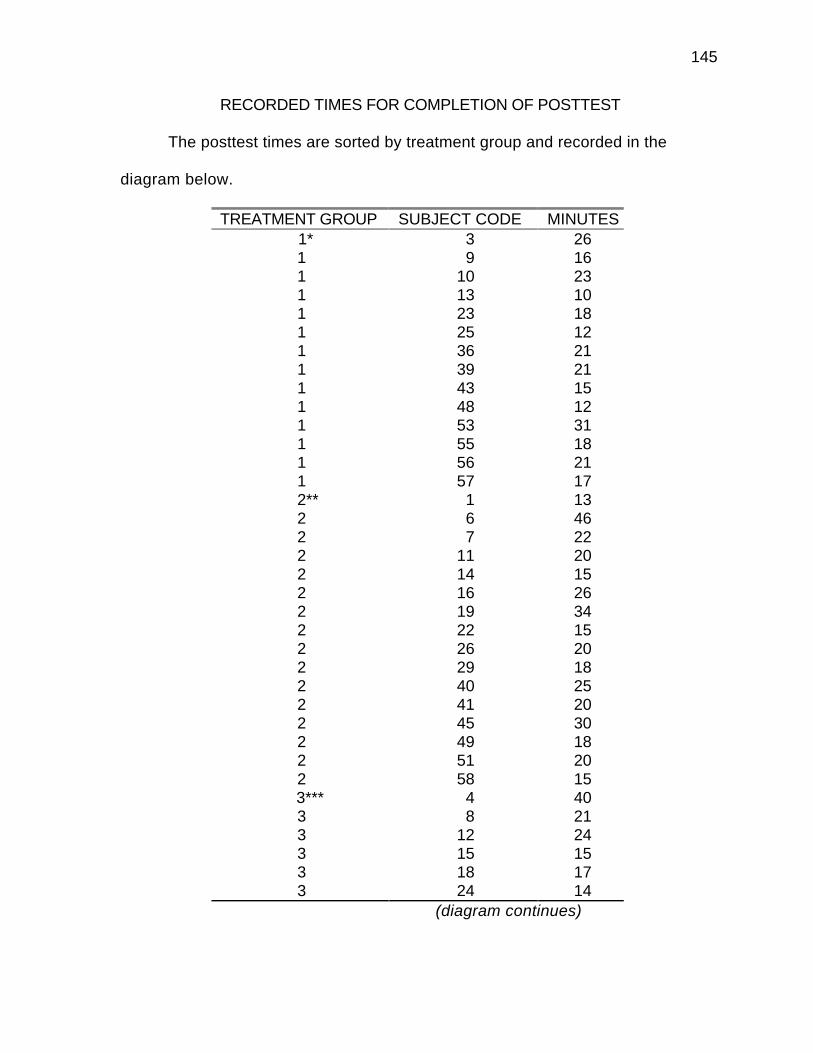
145
RECORDED TIMES FOR COMPLETION OF POSTTEST
The posttest times are sorted by treatment group and recorded in the
diagram below.
TREATMENT GROUP SUBJECT CODE MINUTES 1* 3 261 9 161 10 231 13 101 23 181 25 121 36 211 39 211 43 151 48 121 53 311 55 181 56 211 57 17
2** 1 132 6 462 7 222 11 202 14 152 16 262 19 342 22 152 26 202 29 182 40 252 41 202 45 302 49 182 51 202 58 15
3*** 4 403 8 213 12 243 15 153 18 173 24 14
(diagram continues)

146
TREATMENT GROUP SUBJECT CODE MINUTES3 28 273 30 153 31 173 32 163 37 163 38 103 46 253 50 153 52 153 54 15
*Treatment group 1 had individual study with individual test taking.
**Treatment group 2 had collaborative study with collaborative test taking.
***Treatment group 3 had collaborative study with individual test taking.

147
Appendix K
Criteria to Evaluate Performance on Posttest Instrument

148
CRITERIA TO EVALUATE PERFORMANCE ON POSTTEST INSTRUMENT
The following diagram shows the criteria to evaluate and assign a
grade to the formulated model based on the posttest instrument. These
criteria are to be used in conjunction with the model solution by the
researcher and the secondary grader to evaluate the performance of the test
takers. Participants will start with a grade of 100 and the points defined
below will be subtracted for incorrect answers in the following categories.
Any discrepancies in the assigned grade will be jointly resolved by the
researcher and secondary grader.
OPERATION ALLOCATION OF POINTSIdentify the decision variables
x1 = Baseball toy chest product if include the unit of measure of number x2 = Football chest-of-drawers product if include the unit of measure of number x3 = Soccer end table product if include the unit of measure of number
15 points total
3 points 2 points 3 points 2 points 3 points 2 points
Develop the objective function
State objective function as a Max problem Include all decision variables Assign the correct profit value (parameters)
7 points total
1 point 3 points 3 points
Determine the system constraints
Include s t for “subject to” Understand each resource requirement 12 resource constraints Assign correct relational sign to constraint 12 constraints with relational signs
66 points total
1 point 3 points each for 39 points 2 points each for 26 points
Construct unsubstantiated constraints Mathematical representation of constraints that do not have corresponding requirements in the word problem.
12 points total 3 points for up to 4 unsubstantiated constraints

149
VITA
N. Faye Angel was born in Huntingburg, Indiana on June 11, 1947. In 1968
she received a diploma degree in nursing from Deaconess School of Nursing and
University of Evansville. She returned to higher education in 1985 and completed
Master of Business Administration degree from Virginia Polytechnic and State
University in 1988. Upon completion of the master’s degree, she began teaching
at Ferrum College where she remains as Assistant Professor of Business. In
1993 she returned to Virginia Polytechnic and State University where she entered
the doctoral program in Vocational Education. One of her primary educational
interests is to integrate theory and practice, and she stresses that education
should have rigorous applications as its focus. In addition, she believes that
community service should be an integral part of the collegiate experience.
Faye is a member of Beta Gamma Sigma, Delta Pi Epsilon, Phi Delta
Kappa, the American Vocational Association, and Alpha Chi. In the spring of 1998,
she received the Outstanding Faculty Member Award from the Student Government
Association at Ferrum College. She is published in the areas of elementary
career awareness, the concept of work in children’s literature, technology and
teaching, computer literacy, evaluating employees by computer, and the impact of
information on problem solving.