Embed Size (px)
Citation preview

ABSTRACT Title of Thesis: COMMUNITY POLICING AND CHANGING
CRIME RATES: DOES WHAT POLICE DO MATTER?
Karen Anne Beckman, Master of Arts, 2006 Thesis directed by: Professor David Weisburd Department of Criminology and Criminal Justice
Community policing is one of the most significant transformations in
American policing (Maguire and King, 2004). While many assert that community
policing played a significant role in the decline of national index crime over the
last decade, research has yet to fully explore the contribution of community
policing activities to aggregate crime trends (Eck and Maguire, 2001; GAO, 2005;
Levitt, 2004; Zhao and Thurman, 2004). To fill this gap, this study assessed
police involvement in eight community policing activities between 1997 and
2000. Focusing on subgroups of jurisdictions determined to be the most different
on the basis of index crime rate change between the four year period of study, the
research tested whether police involvement in community policing distinguished
jurisdictions measuring improvement from those measuring worsened total,

property, and violent index crime rates. Overall, the study found no discernible
relationships between police involvement in the community policing activities of
interest and improvements in index crime rates within the subgroups of
jurisdictions and time period examined. These findings suggest community
policing alone will unlikely affect crime change and emphasizes the need for
improving measures of community policing practices in support of studies of
effectiveness.

COMMUNITY POLICING AND CHANGING CRIME RATES: DOES WHAT
POLICE DO MATTER?
by
Karen Anne Beckman
Thesis submitted to the Faculty of the Graduate School of the University of Maryland, College Park in partial fulfillment
of the requirements for the degree of Master of Arts
2006 Advisory Committee: Professor David Weisburd, Chair Assistant Professor Jean McGloin Professor Charles Wellford

©Copyright by
Karen Anne Beckman
2006

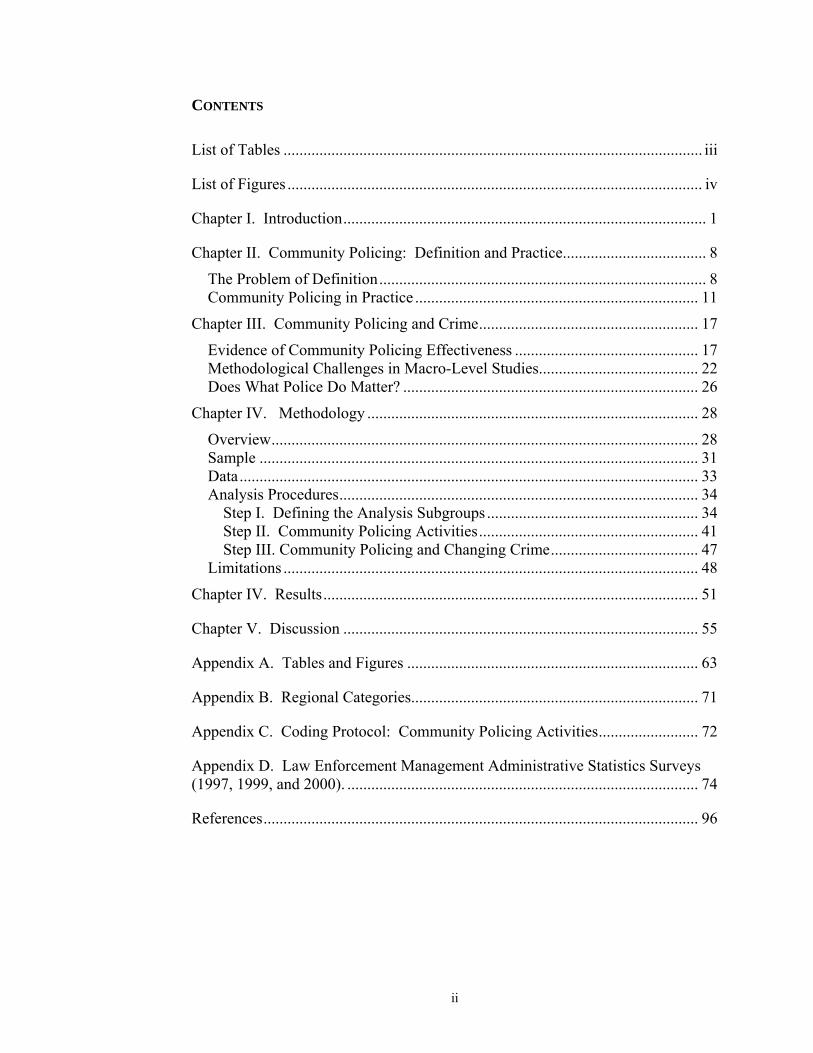
CONTENTS
List of Tables ......................................................................................................... iii
List of Figures ........................................................................................................ iv
Chapter I. Introduction........................................................................................... 1
Chapter II. Community Policing: Definition and Practice.................................... 8
The Problem of Definition.................................................................................. 8 Community Policing in Practice ....................................................................... 11
Chapter III. Community Policing and Crime....................................................... 17
Evidence of Community Policing Effectiveness .............................................. 17 Methodological Challenges in Macro-Level Studies........................................ 22 Does What Police Do Matter? .......................................................................... 26
Chapter IV. Methodology ................................................................................... 28
Overview........................................................................................................... 28 Sample .............................................................................................................. 31 Data................................................................................................................... 33 Analysis Procedures.......................................................................................... 34
Step I. Defining the Analysis Subgroups ..................................................... 34 Step II. Community Policing Activities....................................................... 41 Step III. Community Policing and Changing Crime..................................... 47
Limitations ........................................................................................................ 48
Chapter IV. Results.............................................................................................. 51
Chapter V. Discussion ......................................................................................... 55
Appendix A. Tables and Figures ......................................................................... 63
Appendix B. Regional Categories........................................................................ 71
Appendix C. Coding Protocol: Community Policing Activities......................... 72
Appendix D. Law Enforcement Management Administrative Statistics Surveys (1997, 1999, and 2000). ........................................................................................ 74
References............................................................................................................. 96
ii

LIST OF TABLES
Table 1. Analysis Variables by Data Source ....................................................... 63
Table 2. Descriptive Statistics of Analysis Variables. Full Sample (N=375)...... 64
Table 3. Effects of Explanatory Variables on Total, Property, and Violent Index
Crime Rate Differences between 1997 and 2000. Full Sample (N=375) .... 65
Table 4. Police Involvement in Community Policing Activities of Interest, 1997,
1999, and 2000. Full Sample (N=375) ......................................................... 66
Table 5. Relationship between Crime Change Subgroup and Police Involvement
in Community Policing Activities of Interest, 1997-2000............................ 67
Table 6. Relationship between Crime Change Subgroup and Police Involvement
in Number of Community Policing Activities of Interest, 1997-2000. ........ 68
iii
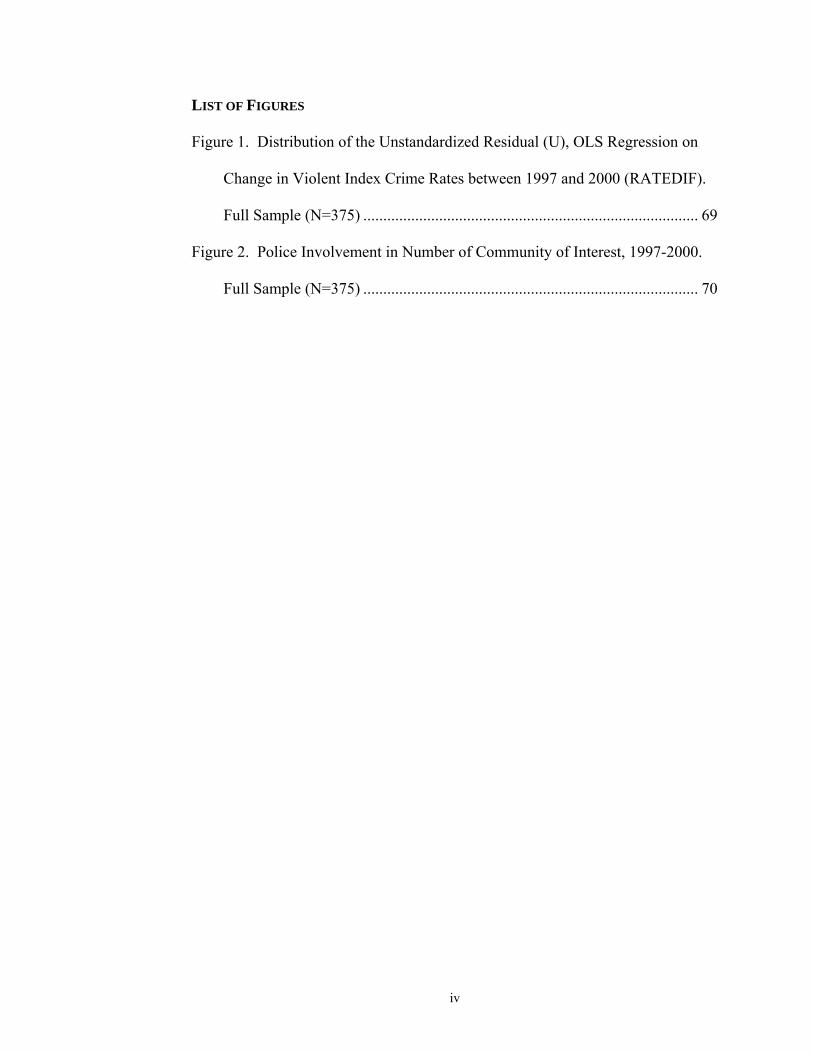
LIST OF FIGURES
Figure 1. Distribution of the Unstandardized Residual (U), OLS Regression on
Change in Violent Index Crime Rates between 1997 and 2000 (RATEDIF).
Full Sample (N=375) .................................................................................... 69
Figure 2. Police Involvement in Number of Community of Interest, 1997-2000.
Full Sample (N=375) .................................................................................... 70
iv

CHAPTER I. INTRODUCTION
Police strategies are in the midst of progressive transformation. Beginning
as early as the 1980’s, innovations such as problem-oriented policing (Eck and
Spelman, 1987; Goldstein, 1987), hot spots policing (Sherman and Weisburd,
1995), Compstat (Bratton, 1998), community policing (Kelling and Moore, 1988;
Wilson, 1968), third party policing (Buerger and Mazerolle, 1998), evidence-
based policing (Sherman, 1998), broken windows policing (Wilson and Kelling,
1982), and policing in “pulling levers” approaches in criminal justice (Kennedy et
al., 1996) emerged as promising methods of crime control and prevention. While
most agencies continue to practice traditional tactics as their primary method of
policing (e.g. random patrol and responding to calls for service), police
nationwide report increasing involvement in these innovative strategies; many
highlighted by police practitioners and scholars alike for their capacity to improve
police effectiveness (Committee to Review Research, 2004; Hickman and Reeves,
2001; Maguire and King, 2004; Sherman, 1997; Weisburd and Eck, 2004; Zhao
and Thurman, 2004).1 Despite these advancements in police practices, the
effectiveness of these strategies on overall crime remains an understudied area in
police research (Beckman et al., 2005; Committee to Review Research, 2004; Eck
and Maguire, 2001; Sherman, 1997; Weisburd and Eck, 2004).
1 Zhao and Thurman first released study findings in 2001. Since 2001, revisions of the report were published in an academic journal (2002) and by the COPS Office (2004). I cite the most recent publication throughout the manuscript
1

Community policing is by far the most widespread of these innovative
strategies (Maguire and King, 2004; Hickman and Reaves, 2001). Between 1997
and 2000, police agencies - regardless of size of population served - reported an
increase in full-time community policing officers. This growth translated into an
overall increase of full-time community policing officers by 66% between 1997
and 2000; raising the national average of community policing officers per agency
from 3 to 12 (Hickman and Reaves, 2003; Reaves and Goldberg, 2000). The
institution of specialized personnel alone does not constitute the advancement of
community policing, this model is also reflected in the policies, programs, and
activities put into practice. From time-honored activities such as foot patrol to
more progressive tactics such as problem-solving and neighborhood-based
deployment, the diversified approaches offered by community policing have
undoubtedly established it as a sound byte synonymous to police innovation
(Weisburd and Eck, 2004).2
The advancement in community policing is due in part to the support of
local, federal, and state funding programs (GAO, 2005; Worrall and Zhao, 2003).
Since 1994, the federal government alone allocated 11.3 billion dollars in training
support, hiring, and innovative program funding to over 118,768 police agencies
across the country (Office of Community Oriented Policing Services, 2005c;
2 While there is a distinct difference between community policing and problem-oriented policing on the basis of expected outcome, problem solving is often cited as a tool of the community policing model (Eck and Maguire, 2000; Goldstein, 1990; Office of Community Oriented Policing Services, 2005b). As such, I include problem solving as a community policing activity in the study.
2

GAO, 2003).3 Recent research indicates that these investments are associated to
improvements in aggregate crime trends (Zhao and Thurman, 2004; GAO, 2005).
However, knowledge of the impact of specific community policing activities is
surprisingly limited; leaving many questions unanswered.
One reason for this gap in knowledge is the ambiguity of community
policing. The community policing model is arguably an elastic concept with a
wide range of practical applications; a quality which inhibits assessment of
effectiveness at the macro level (Bayley, 1994; Eck and Maguire, 2000; Greene
and Mastrofski, 1988; Maguire, 2002; Weisburd and Braga, forthcoming). Prior
research attempts to address this problem of definition, operationalizing
community policing as federal funding programs (police hiring, innovative
projects, and enhancements in police technology and equipment) (Zhao and
Thurman, 2004; GAO, 2005), the presence of a community policing plan, and a
summated index of police involvement in problem solving and community
activities (MacDonald, 2002).4 Although these measures are a step in the right
direction they are not without limitations.
The first two measures (federal funding and presence of community
policing plan) do not represent tangible community policing activities. Rather
3 These estimates reflect funding allocated through the Public Safety Partnership and Community Act of 1994, Title 1 of the Violent Crime Control and Law Enforcement Act, Office of Community Oriented Policing Services. Other law enforcement funding sources in support of similar programmatic elements include the Police Hiring Supplemental and the Byrne Grant program (GAO, 2005). 4 This focus of this study is on the macro-level benefits of community policing. The term macro infers a nationally representative study sample. Conversely, a micro-level assessment would focus on a single city, police jurisdiction or police organization. While there are many lessons to be
3
they are facilitators that encourage police involvement in community policing;
support in the form of organizational policy, additional police, or technological
advances to streamline police work and free officer time for involvement in
community policing. While these facilitators are positively related to police
involvement in community policing, knowledge of specific activities
implemented by police as a result of these facilitators are unknown (GAO, 2005;
Roth et al., 2000; Langworthy, 2002).
The community policing measure used by Mac Donald (2002) is the first
to include actual police practices in a macro-level assessment of community
policing. However, this measure is also limited in that the index lumps two
separate types of community policing activities (problem solving and community
meetings) into one single indicator of innovation. Therefore, the measure does
not allow an assessment of distinct community policing activities. Further, unlike
the measures used in prior research, Mac Donald’s measure of community
policing is limited to a one year period of study (GAO, 2005; Mac Donald, 2002;
Zhao and Thurman, 2004). As the community policing model is highly dynamic
both in interpretation and implementation, and is almost never implemented on a
large scale, extended periods of study would provide a more accurate picture of
the continuity of police involvement in specific activities as they relate to
aggregate crime trends (Langworthy, 2002; Rosenbaum and Lurigio, 1994).
learned from micro-level studies, the primary focus of the manuscript is on macro-level assessments of community policing.
4
Better measures of community policing practices exist. Survey research
examining the implementation of community policing provides a wealth of
information on its practical application at the aggregate level (Bureau of Justice
Statistics, 1997; Maguire and Katz, 2002; Maguire and Mastrofski, 2000;
Rosenthal et al., 2002; Roth et al., 2000).5 We now know that the operational
application of the community policing model can vary by the type, size, and
geographic location of the police organization (Mastrofski and Maguire, 2000;
Wycoff, 1994). These data have been vastly underutilized for the purpose of
discerning police involvement in specific community policing practices over time
and in studies seeking to assess the impact of these activities on aggregate crime
outcomes (Langworthy, 2002; Maguire and Uchida, 2000).
Other reason for the limited knowledge on the macro level benefits of
community policing relates to the analytic challenges inherent to this level of
analysis (Eck and Maguire, 2001). The natural quasi-experimental conditions
offered by the crime decline over the last decade offers a unique research
opportunity to investigate the relationship between community policing and
aggregate crime trends (Blumstein and Wallman, 2000; Levitt, 2004). While the
quasi-experimental design is not without limitations, Weisburd et al. (2001) note
that carefully designed quasi-experiments can yield statistically powerful studies
5 See Maguire and Uchida (2000) for a review of survey research in community policing.
5

and offer the best alternative in situations where experimental designs are not
feasible.6
Employing a quasi-experimental design, the current study examines the
association between community policing and aggregate crime trends. It differs
from prior research in three distinct ways. First, the analytic strategy is narrowly
defined. The study focused on police jurisdictions vastly different from each
other on the basis of crime rate change. This specification provided study
conditions optimal for detecting whether a relationship between police
involvement in the community policing activities and crime change exist. In
essence, I hypothesized that if police involvement in community policing effected
index crime rates, evidence of such would be highest if I compared community
policing practices within jurisdictions measuring the greatest improvements in
index crime rates to those with the most worsened. The study also differs from
prior research by way of its measure of community policing. It defines
community policing as police involvement in eight distinct activities; representing
different dimensions of the community policing model. Additionally, the measure
of police involvement in the activities of interest extends over a four year time
period. Finally, the study analyzed each of the eight community policing
activities individually, as well as a summated index, across total, property and
violent index crime rate change.
6 Quasi-experimental design defined as, “a comparison between multiple units with and without the program, controlling for factors, or a non-equivalent comparison group has only minor differences evident,” merits a four on the Maryland five-point scientific methods scale (Sherman, et al., 1997:2.19).
6

The impact of community policing on crime continues to be of political
and academic interest (Committee to Review Research, 2004; Eck and Maguire,
2000; GAO, 2003; GAO, 2005; Levitt, 2004; Mulhausen, 2001; Weisburd and
Eck, 2004; Zhao and Thurman, 2004). The analytic strategy of the study offered
an opportunity to shed light on this understudied phenomenon (Maguire and
Uchida, 2000; Nagin, 1998; Sherman et al., 1997; Weisburd et al., 2001). The
chapters that follow provide the conceptual framework, methodology, and
findings of the research. The report concludes with a discussion on the
implications of the findings on policy and future research.
7

CHAPTER II. COMMUNITY POLICING: DEFINITION AND PRACTICE
Community policing is arguably an ambiguous concept (Bayley, 1994;
Correia, 2000; Crank and Langworthy, 1996; Greene and Mastrofski, 1988). As
such, a large portion of the community policing literature is dedicated to the
debate surrounding the meaning of community policing and the state of
knowledge regarding the practical application of the philosophy by police
organizations. The following sections review the issues surrounding the problem
of definition of community policing; highlighting the value of focusing on police
involvement in specific activities in studies of effectiveness.
The Problem of Definition
In the simplest of terms, community policing is the idea that strong police-
citizen relationships yield positive public safety benefits (Kelling and Coles,
1996; Wilson, 1968). The translation of this idea, however, into a lucid and
generally applicable definition has not been as straightforward. The most
comprehensive definition of community policing is that put forth by the
Department of Justice, Office of Community Oriented Policing Services (COPS,
2005b):
Community policing focuses on crime and social disorder through the delivery of police services that includes aspects of traditional law enforcement, as well as prevention, problem solving, community engagements and partnerships. The community-policing model balances reactive responses to calls for service with proactive problem solving centered on the causes of crime and disorder. Community policing requires police and citizens to join together as partners in the course of both identifying and effectively addressing these issues.
8

This definition highlights four components or “ingredients” of the community
policing model: (1) crime prevention, (2) problem solving, (3) community
engagement, and (4) partnerships. While each of these four components is not
always labeled in exactly the same matter across definitions of community
policing put forth by police practitioners and scholars alike, there is a general
consensus that these components represent the core elements of a community
policing model (Mastrofski and Ritti, 2000; Sherman and Eck, 2002).
Beyond the conceptualization of community policing, however, there is
considerable debate surrounding the operational definition of community
policing. What does community policing look like in practice? The debate over
the problem of definition can be viewed from two perspectives – one positive and
one negative. Looking at the positive, the operational definition of community
policing is everything the model proposes it should be – elastic (Maguire and
Katz, 2002; Weisburd and Braga, Forthcoming). In essence, the model allows
police to build upon their collective experiences to create the right “recipe” of
“ingredients” reflecting what community policing means in their community.
Consequently, community policing can look very different across police
organizations and even within police organizations over time. Thus efforts to
construct a universal measure of community policing is further muddled by the
variety of “ingredients” of individual police agency’s community policing
“recipe”, with some agencies involved in more diverse types and numbers of
9
specific activities than others (Maguire and Mastrofski, 2000; Maguire and Katz,
2002).
Many agree that the elasticity of community policing is one of its greatest
strengths (Green and Mastrofski, 1988; Maguire and Katz, 2002). Others, holding
the negative side of the coin facing up, view the ambiguity and incongruence of
community policing’s definition is a major threat to its principles, claiming they
are nothing more than conjecture (Bayley, 1988; Crank and Langworthy, 1996;
King and Lab, 2000; Rosenbaum and Lurigio, 1994; Skolnik and Bayley, 1988).
Bayley (1988) writes, “Despite the benefits claimed for community policing,
programmatic implementation of it has been very uneven. Although widely,
almost universally, said to be important, it means different things to different
people. . .community policing on the ground often seems less a program than a set
of aspirations wrapped in a slogan” (p. 225).
In response to these criticisms, supporters of community policing note that
communities vary by way of public safety needs and crime-related challenges. As
such, the community policing model cannot offer a universal prescriptive strategy.
While there has been little national-level empirical evidence quashing this debate,
research studying the implementation of community policing provides us with a
clearer picture of what the model looks like in practice and emphasizes the need
to focus on police involvement in specific community policing activities in
inquires of effectiveness (Maguire and Katz, 2002).
10

Community Policing in Practice
Early studies of community policing focus on the practical application of
the model. Methods of collecting these data include intensive cases studies
(Skogan, 1994; Mastrofski et al., 2003; Wycoff and Skogan, 1993), surveys
(Bureau of Justice Statistics, 1997, 1999, 2000; Maguire et al., 1997; Roth et al.,
2000), and systematic observations (Mastrofski et al., 2003; Skogan et al., 2002).
The findings of these studies illustrate the breadth of community policing
activities across all levels of the police organization and offer insight into patterns
of participation. Using the classification scheme put forth by Sherman and Eck
(2002) as a framework, the following sections discuss the specific activities
associated with community policing.7 The categorization is based upon areas of
the police organization under which police implement community policing: (1)
internal policies and procedures, (2) external patrol tactics, (3) proactive
prevention strategies, and (4) community involvement.
Internal Policies and Procedures
Police agencies adopt new policies and procedures to shift organization
focus towards community policing. Examples include redefining mission
statements, developing community policing plans, requiring community policing
training for new-recruits and in-service personnel (both sworn and non-sworn).
Police also modify performance evaluation criterion to include community-
7 See Maguire and Mastrofski (2000) for a review of the themes in community policing.
11

policing activity measures thereby encouraging police to engage in proactive
crime prevention activities.
Police may survey citizens on their perceptions of fear, satisfaction with
police services, and other crime related concerns. The community policing
philosophy takes this one step further and encourages police agencies to utilize
survey information to inform organizational decisions such as alignment of
resources, prioritization of crime problems, providing information to field
officers, etc. Any use of citizen survey information by police fosters proactive
and informed decisions in policy, procedures, and strategies.
To improve police-citizen contacts, agencies dedicate full-time sworn
personnel to serve as community policing officers. Community policing officers
often act as a liaison between the police organization and the community.
Examples of roles for community policing officers include identifying and
prioritizing community crime problems and initiating and managing problem-
oriented solutions to these problems (Farrell, 1988). Although the role of a
community policing officer may vary greatly by police jurisdiction (Weisburd,
1988), designation of full-time sworn personnel as community policing officer
sends a message that the community is important to the agency. In theory, the
officer’s time is also designated to the implementation and coordination of
activities consistent with the community policing philosophy (e.g. proactive crime
prevention, community engagement, etc.).
Agencies also decentralize organizational management structures to foster
organizational capacity to engage in proactive crime prevention strategies. For
12

example, many give middle managers and patrol officers more authority to make
decisions at the community level. Decentralization, including the creation of
neighborhood substations (mobile or fixed), improves the accessibility of police
to the community, thereby improving the quality and quantity of police-citizen
contact. Increasing police manager’s control over field operations has been
shown to improve morale (Wycoff and Skogan, 1993) and improve department
standing with other agencies (Bayley and Shearing, 2001).
External Patrol Tactics
Police use alternative patrol tactics to increases opportunities for
interactions with the community. Supplementing traditional vehicle patrol with
foot patrol removes officers from patrol cars. This exposure can reduce
opportunities for crime and increase opportunities for communications with
citizens (Sherman and Eck, 2002). Interactions with the community can elevate
perceptions of safety and increase opportunities for information sharing and
coordination of additional police resources (e.g. civilian volunteers, partnerships)
(Kelling and Coles, 1996). Communities may differ in the feasibility of
implementing alternative patrols strategies. In some cities, or areas of cities, foot
patrol is not a pragmatic approach (e.g. suburban areas). Bicycles have allowed
these jurisdictions to benefit from this type of patrol tactic. Many urban areas use
both bike and foot patrol. These activities not only increase opportunities for
police-citizen interaction, but provide a vehicle for information sharing and
partnership building.
13

While police historically utilize geographic boundaries for deployment
purposes, community policing encourages police to re-define deployment
boundaries to increase contact with the community. Structuring patrol beats into
smaller units based on neighborhoods rather than standardized boundaries such as
census tracts increases police services to citizens. Additionally, regular
assignment to a specific area or beat allows police to build familiarity with
community residents and build knowledge on persistent crime problems in their
area. These assignments also provide an opportunity for the development of
partnerships and relationships with the community that can foster proactive
responses and identification of alternative resources (e.g. intelligence, in-kind
services) (Wycoff and Skogan, 1993). The better police understand the
community they serve, the less they base decisions (e.g. arrests, use of force) on
objective characteristics (race, social class) and empirical generalizations between
those characteristics and causes of crime and disorder (Bayley, 1988; Tyler,
2004).
Proactive Crime Strategies
Police agencies utilize the tools of problem solving to develop proactive
crime strategies in partnership with the community (Eck and Spelman, 1987).
Problem-solving partnerships provide an opportunity for police to engage
community stakeholders and develop collaborative responses to crime problems.
The Office of Community-Oriented Policing Services sponsored the development
and dissemination of problem-solving guidebooks. The guidebooks follow the
SARA model (Scan, Analyze, Response, Assess) developed by Goldstein (1990).
14

The four-step framework provide police and citizens assistance in developing
solvable solutions to specific crime problems including vehicle theft, robbery,
assaults in and around bars, among others.8
Police organizations may enter into problem solving ‘contracts’ with
community partners. These informal agreements demonstrate a commitment to
formulating and executing proactive responses to crime.9 Successes in problem
solving strengthen police ambition to seek out other ‘solvable’ community crime
problems. Additionally, problem-solving activities promote the development of
partnerships with community stakeholders, including other criminal justice
agencies (federal, state and local), social service organizations, community
advocacy groups and schools.
Proactive police strategies benefit from the technological advances in
recent years (Bratton, 1998). Crime mapping and analysis have provided police
with the capability to collect and analyze data faster and more reliably than ever
before. Although some studies examining community policing effectiveness
include crime analysis as a community policing activity (GAO, 2005), it is viewed
here more as a facilitator to community policing - informing place-based,
community driven responses to crime problems - and not a distinctive community
policing activity.
8 Information on the problem solving guidebooks is available at http://www.popcenter.org. 9 Problem solving contracts are informal agreements among partners. The purpose of the ‘contract’ is to define the goals and objectives of the project as well as expectations of the collaboration.
15

Community Involvement
Police engage in many activities that foster interaction with the
community including neighborhood watch and meetings with community groups.
The intensity of community group involvement may vary over time. However,
the commitment of the police to meet with citizens and community groups creates
a mechanism to build relationships. Examples of the types of community groups
police meet with include advocacy groups, school groups, business groups, and
faith-based organizations. These meetings offer an opportunity for police to
survey citizens to gauge satisfaction, perceptions of safety, and crime experiences.
The resources expended by the police to attend these meetings are minimal, yet
the potential for information sharing, and the discussions and relationships that
stem from them, can produce proactive solutions that yield crime reduction
benefits and promote positive police-citizen interactions.
Civilian volunteers trained in community policing provide valuable
assistance to police in identifying crime concerns and developing proactive
solutions to crime problems. Civilians also serve as a liaison or spokesperson
between the community and the police.
16

CHAPTER III. COMMUNITY POLICING AND CRIME
Community policing is the most widely cited explanation for the decline
in index crime rates over the last decade (Levitt, 2004). The following section
reviews the research evidence on the effect of community policing on aggregate
crime; highlighting the gaps in knowledge and the methodological challenges that
contribute to the paucity of evidence in studies of this kind.
Evidence of Community Policing Effectiveness
Accolades of community policing effectiveness are based in small part to
a handful of correlational studies and more largely to assessments conducted by
long-term research partnerships and anecdotal accounts of police practitioners.
While there is strong empirical evidence supporting community policing
improves citizen satisfaction with police and decreases citizen fear of crime and
perceptions of disorder, research supporting the model’s impact on aggregate
crime trends remains inconclusive (Committee to Review Research, 2004;
Sherman 1997; Eck and Maguire, 2001; Weisburd and Eck, 2004).10
Recent reviews of the evidence suggest community policing is most
effective when efforts are targeted and include community involvement in priority
setting or focus on improving police legitimacy (Sherman, 1997; Weisburd and
Eck, 2004). Door-to-door visits, for example, are found to be effective in
10 The motivation to unravel the causes of the crime drop in America elevated interests surrounding the possible contributions of police to this decline (Blumstein and Wallman, 2000; Eck and Maguire, 2000; Levitt, 2004). As a result, the field has taken pause to reflect on the research evidence to date, assessing the status of what is known of the effects of police on crime (Committee to Review Research, 2004; Eck and Maguire, 2002; Sherman, 1997; Weisburd and Eck, 2004). The following section draws heavily on the findings of these reviews.
17
reducing crime and disorder. Research on foot patrol is mixed with some studies
finding both positive (Trajanowicz, 1986) and negative effects on crime (Bowers
and Hirsch, 1987; Police Foundation, 1981) while others only detecting benefits
in reducing citizen fear of crime (Kelling, 1981). The research evidence is
strongest for problem solving (Committee to Review Research, 2004; Sherman,
1997; Weisburd and Eck, 2004). The strategy provides a framework for police to
develop focused responses to specific crime problems and has repeatedly
demonstrated effectiveness in reducing violent and property crimes (Eck and
Spelman, 1987; Kelling and Sousa, 2001), domestic violence (Sherman and
Strang, 1996), gun violence (Braga et al., 2001), and general disorder (Eck and
Spelman, 1987).
Most studies of community policing effectiveness assess outcomes within
relatively short time periods of implementation. For example, in the most
rigorous examination of foot patrol, the evaluation period was 12 months
(February 1978-January 1979) (Kelling, 1981). Comparatively, long-term studies
of community policing, such as the six-year evaluation of the Chicago Alternative
Policing Program (CAPS) program, provide valuable insight on the relationship
between community policing and crime over time. While not based on rigorous
research, the observations of these studies on the overall impact of community
policing should not be discounted. In their evaluation of the CAPS program,
Skogan et al. (2002) note, “[a]s evidenced by the impact of CAPS in the original
prototype districts and a set of matched comparison areas, the evaluation indicated
that the program did reduce crime in those districts, including burglary and auto
18

theft in one district, street crime in another, and gang and drug problems in two
other districts” (p. 23). In another long-term study (3 years) of community
policing in Madison, Wisconsin, Wycoff and Skogan (1993) conclude that
organizational changes in support of community policing (i.e. coordinated
policing and decentralized decision making) is associated with reductions in crime
and citizen’s concern for crime. Mazerolle et al. (1998) also conclude that
community policing is likely to reduce crime over time. These research studies
illustrate that community policing is a plausible explanation to improvements in
aggregate crime rates at the micro-level.
To date, three studies focus on the macro-level crime benefits of
community policing. Zhao and Thurman (2004) analyzed the effect of federal
community policing funding programs on macro-level crime.11 Using six years of
panel data, the analyses found that federal hiring grants and innovative grant
programs were significantly and positively related to improvements in violent and
property crime. Specifically, the study found that for every dollar of police hiring
funding received per resident, there was a decline of 5.26 incidents of violent
crime and 21.63 incidents of property crime per 100,000 residents. Innovative
grant programs had higher crime reduction benefits. For every dollar of
innovative funding received, there was a decline of 12.93 violent incidents of
11 COPS funding programs include police hiring, innovative projects, and technology. The $7.32 billion of funding allocation analyzed by GAO included $4.69 in hiring grants (GAO, 2005:8). The remainder was technology and innovative grant programs. Notably, innovative grant programs accounted for only 5% of all funding (Zhao and Thurman, 2004).
19
violent crime and 41.93 incidents of property crime per 100,000 residents.
Technology programs were not found to be significantly related to crime.
The study conducted by Zhao and Thurman (2004) was the first of its kind
to examine the macro-level benefits of community policing. This undoubtedly
draws a spotlight upon its methodological approach and subsequent findings. The
Government Accountability Office was commissioned to review the study for its
technical merit. Their assessment of the methodology employed by Zhao and
Thurman concluded that, due to inconsistent findings by city size and
inappropriate model specification, the research should be interpreted with caution
(GAO, 2003).
In 2005, the GAO reported preliminary findings of their analyses of the
Zhao and Thurman data. In their study, the GAO improved upon cited
methodological weaknesses by adding controls for other police expenditures and
participation in community policing regardless of programmatic funding received
(GAO, 2003, GAO, 2005). While their analyses did not find an effect of
community policing as large as Zhao and Thurman (2004), the GAO study
supports the proposition that community policing funding programs contributed to
improvements in index crime rates. Specifically, examining crime rate change
between 1993 and 2000, COPS grants allocated up to 1998 ($785M) could
account for approximately 8% of the total decline in crime and 13% of the decline
in violent crime (GAO, 2005). While these findings suggest community policing
played a role in the declining crime rates, they do not provide us with sufficient
20
knowledge of the benefits of specific community policing strategies on study
outcomes.
Mac Donald (2002) improves the measure of community policing in
macro-level research; defining community policing as police involvement in
specific strategies – presence of a community policing plan and an index of
community policing activities. The summated index of community policing
activities reflected police involvement in two types of community activities -
problem-solving and community activities. In his analysis he compared the
effectives of the community policing measures to aggressive enforcement tactics
in reducing occurrences of robbery and homicide. Overall, MacDonald’s findings
contradict those of the previous studies that used broadly defined measure of
community policing (funding programs) (Zhao and Thurman, 2004; GAO, 2005).
While the findings support the effectiveness of aggressive enforcement in rates of
robbery, the defined community policing activities were not significantly related
to reduction in robbery or homicide. These findings support the view that focused
police practices can produce positive outcomes when targeted to specific crimes.
More importantly, however, the research demonstrates the importance of studies
of community policing in utilizing clearly defined measures of community
policing to uncover its true relationship to crime change.
In sum, the research on the effectiveness of community policing on
aggregate crime trends remains inconclusive. Prior studies suggest that
effectiveness of community policing can vary by type of crime, (higher for total
crime), element of community policing activity (higher for innovative grant
21
programs), and size of policing jurisdiction (higher for agencies serving
populations greater than 10,000) (GAO, 2005; Zhao and Thurman, 2004). To
date, research has yet to confirm the extent to which police involvement in
community policing activities relate to aggregate crime trends. Most importantly,
prior research indicates that the effectiveness of community policing disappears
when studies utilize more narrowly defined measures of community policing
across different lengths of study; emphasizing the challenges inherent to studies
of this kind.
Methodological Challenges in Macro-Level Studies
Reliable, Valid Measures of Police Practices
Measurement criteria of a highly dynamic concept such as community
policing is challenging (Maguire and Uchida, 2000; Uchida et al., 1986). Many
organizations tailor community policing practices to local jurisdictions.
Subsequently, similarly labeled activities are often implemented quite differently
between agencies (Maguire and Mastrofski, 2000; Wycoff, 1994). As such, the
validity and reliability of the measurement of community policing in macro-level
studies should be carefully considered. Further, the importance of clear and
neutral measures is paramount (Langworthy, 2002; Maguire, 2002; Uchida et al.,
1986).
22

Survey research offers a practical source for measures of police practices
at the aggregate level.12 In fact, numerous national surveys of community
policing by various interest organizations, including non-profit research
organizations, universities and the federal government, are in existence (Maguire
and Uchida, 2000). Although these data offer the best means by which to study
variation in community policing practices in the larger context, they are not
without limitations. The unit of analysis is an organization as opposed to an
individual. In these cases, survey questions must be framed with clear, concrete
responses to reduce the likelihood of perceived value judgments and control for
informant bias to improve the quality and reliability of the data (Maguire, 2002).
Multi-wave surveys can control for many potential biases by using
consistent questions in the survey instrument (Uchida et al., 1986). An example
of this type of survey is the Bureau of Justice Statistics (BJS) Law Enforcement
Management Administrative Statistics Survey (LEMAS). BJS administered the
first wave of the LEMAS in 1987. Subsequent administrations occurred in 1990,
1993, 1997, 1999, 2000, and 2003.13 With a consistently high response rate, the
resulting databases house information on police personnel, operations,
expenditures, equipment, the use of technology, and activities of over 3,412
12 See Maguire and Uchida (2000) for an overview of national level surveys of community policing conducted in the United States. 13 The findings of the 2003 administration of the LEMAS survey are scheduled for released in 2006. (Personal communication with author.)
23
publicly-funded state and local law enforcement agencies nation-wide (Reeves
and Goldberg, 2000).14
In collaboration with the Office of Community Oriented Policing Services
(COPS), BJS added a community policing section to the 1997 LEMAS survey.
This section questions respondents on specific community policing practices. For
example, respondents report the number of police officers serving as full-time
community policing officers. Questions indicating participation in specific
community policing practices such as bike patrol and foot patrol are also
included. The community policing section has appeared in every administration
of the survey since its introduction in 1997.
Another benefit of multi-wave survey data is that it provides a mechanism
to assess police participation in specific activities over time. These measures
allow researchers to assess whether a police agency instituted the activity as a
permanent policy or tactic or was simply a passing phase (Eck and Maguire,
2000; King, 2000; Roth et al., 2000; Uchida et al., 1986). To date, these data
have been vastly underutilized in assessing the effectiveness of police practices.
As interest in police administrative data moves beyond its traditional use in
descriptive analysis towards use in explanatory research, longitudinal data
collected by these surveys will be pivotal in assessing the sustainability of
14 See Langworthy (2002) and Uchida et al. (1986) for overviews of Law Enforcement Management Statistics. See Reaves and Hickman (1999) for the detailed discussion of the methodology of the BJS LEMAS survey.
24

discernible, distinct, evident marked patterns of police practices (Langworthy,
2002; Uchida et al., 1986).
Overall, multi-wave surveys of police practices offer the best aggregate
level measure of police involvement in community policing activities. Despite
these advancements, these data do not provide the researcher with enough
information to discern both the scope of reported activities (which crimes they
focus on and where) or the dosage of each activity (how much they practice it)
(Maguire and Katz, 2002; Maguire and Uchida, 2000). Although there have been
many appeals in the literature for more effective data collection in support of
police research, aggregate studies on the implementation of community policing
remains an understudied area in policing (Alpert et al., 2001; Maguire and
Uchida, 2000; Sherman and Eck, 2002; Wycoff, 1994).
Analytic Strategy
In social science research, unraveling the relationship between the defined
explanatory variables and confounding factors can be challenging (Eck and
Maguire, 2000; Nagin, 1998). In fact, model misspecification is one of the most
cited weaknesses in analyses of the macro-level outcomes of police effectiveness
(Eck and Maguire, 2000; GAO, 2003; GAO, 2005; Weisburd and Eck, 2004).
The study conducted by Zhao and Thurman (2004) was the first of its kind to
examine the macro-level benefits of community policing. This undoubtedly
draws a spotlight upon its methodological approach and subsequent findings.
Advanced modeling techniques such as fixed-effect or random effect
modeling can adjust for some of the specification error inherent to aggregate
25

studies of this kind (GAO, 2005; Mac Donald, 2002; Zhao and Thurman, 2004).
Additionally, including variables in the explanatory model to control for
systematic non-random variation not accounted for by the defined explanatory
variables can further reduce specification errors (Marvell and Moody, 1996;
Nagin, 1998). Examples of additional or instrumental variables used by prior
macro-level assessments of police outcomes include electoral cycles (Levitt,
1997) and place-level dummy variables (GAO, 2005; Zhao and Thurman, 2004).
While these techniques do result in better defined models, alternative analytic
strategies have yet to be fully explored (Langworthy, 2002; Levitt, 2004).
The current research takes a different approach from those traditionally
taken in studies of police effectiveness. As in prior research, the analyses sought
to identify factors related to shifts in aggregate crime rates. However, the current
study is different than prior research in that the quasi-experimental designed
allowed the analytic strategy to focus on jurisdictions determined to be vastly
different on the basis of crime. In essence, the research questioned whether police
in jurisdictions measuring decreases in crime were more likely to implement
community policing than jurisdictions measuring increases in crime? If so, which
activities? Does the number of community policing activities make a difference?
Do these relationships (if any) vary by type of crime?
Does What Police Do Matter?
Research assumes an important role in identifying effective methods of
policing (Sherman, 2004; Weisburd and Eck, 2004). While it is unrealistic to
assume that the practice of community policing is in isolation of other plausibly
26

effective policing methods (e.g. other innovative police strategies, specialized
enforcement, increases in police strength) or place-based social and economic
phenomenon unrelated to police work (e.g. shifts in demographics and
economics), we now know that police can affect crime depending on what they do
(Sherman, 1995; Sherman, 1997; Weisburd and Eck, 2004). However, while
community policing is one of the most cited explanations to the decline in
national crime rates, there is limited evidence supporting whether a relationship
truly exists (Blumstein and Wallman, 2000; Committee to Review Research,
2004; Levitt, 2004; Maguire and Eck, 2000; Weisburd and Eck, 2004).
Considering the methodological challenges inherent to macro-level assessments
of police practices, the analytic strategy of the current research provides a
necessary step towards uncovering a clearer picture of the relationship between
community policing and declining crime rates. The study builds upon existing
knowledge by focusing attention on the relationship between police involvement
in specific community policing activities and improvements in index crime rates
over time.
27

CHAPTER IV. METHODOLOGY
Overview
Research on the explanation of police effectiveness at the macro-level
commonly suffers from model misspecification issues as well as measurement
inaccuracies (Eck and Maguire, 2000; GAO, 2003; Marvell and Moody, 1996;
Nagin, 1998). The model misspecification problem lies in the nature of research
on aggregate crime. Many factors may influence changes in crime rates, such as
economics, demographic changes, culture shifts, legitimacy of social institutes
and police practices (LaFree, 1998; Messner and Rosenfeld, 1994; Eck and
Maguire, 2000; Blumstein and Wallman, 2001). Consequently, it is extremely
difficult to include all relevant variables in the explanatory model. While this
limitation is common in studies of this kind, specification difficulties contribute to
the likelihood of aggregation biases in explanatory models of crime change (Eck
and Maguire, 2002; Nagin, 1998). As in other studies, the current research sought
to identify potential unmeasured confounding factors and their impact on study
outcomes.
The inaccuracy of the measurement, however, is related to the quality of
data itself. Indeed, the reliability and validity of data on police practices and the
actual content of what has been measured influence the quality of measurement
(Uchida et al., 1986; Maguire and Uchida, 2000; Maguire, 2002). Recent
research demonstrates that multi-wave establishment surveys of police practices
reduce these inaccuracies (Maguire, 2002; Maguire and Katz, 2002). However,
much of these data have yet to be examined for their utility in discerning police
28
involvement in specific activities over time or police effectiveness (Langworthy,
2000). In consideration of the challenges in aggregate studies of community
policing effectiveness, the research offers a creative approach from those
traditionally taken.
The study differs from earlier work in several important ways. First, while
the study utilizes a quasi-experimental design, the focus is very narrow. I
theorized that if a relationship between community policing and crime existed,
evidence of such would be highest if I compared community policing practices
between police jurisdictions determined to be vastly different on the basis of
crime rate change. Rather than using straight differences in crime rate change as
my dependent variable, regression techniques allowed me to create the best
possible conditions to detect whether a relationship between community policing
and improvements in aggregate crime rates exist.
I defined an OLS regression model of crime rate change based on
predictors commonly associated with crime (e.g. employment, population
demographics); the residual (U) of this model representing all additional
explanations relating to variation in the dependent variable (e.g. confounds,
specification error) (Hanushek and Jackson, 1977). For the purpose of this study,
I refer to the residual (U) as “unexplained” crime change. The research relied on
the assumption that the residual would also capture any effect of police on crime
change. I created the analysis subgroups based on this indicator of “unexplained”
crime change. In essence, all else being equal (population demographics,
29

economics), these subgroups represent jurisdictions within the sample measuring
the highest amount of unexplained crime change within the period of study.
The second point of departure of the current study from prior research is
its definition of community policing. It is the first to utilize measures of police
involvement in distinct community policing activities over an extended period of
time. Specifically, the study assessed police involvement in eight community
policing activities. Utilizing multi-wave panel data of police practices, I created
measures of community policing I believed to be the best measure of what police
do in support of community policing. These activities include external patrol
tactics, proactive crime strategies, and community involvement. Linking survey
responses indicating the sample’s participation in each activity in 1997, 1999, and
2000, I created an indicator that allowed me to discern the extent of involvement
in each of the activities across the four year period of study. I then tested whether
there was an association between membership in the six defined subgroups of
crime rate change (improved/worsened total, property and violent index crime
rates) and police involvement in the community policing activities of interest.
While recognizing the issues surrounding aggregate studies of police
practices, the research fills the gap in knowledge on whether community policing
activities are related to aggregate crime trends. The following sections provide
the details of the research methodology. First, it describes the sample upon which
the subgroups were drawn and the data sources for the measures of police
activities, aggregate crime rates, and structural level indicators. The next section
provides the analysis procedures of the research. It begins with how I defined the
30

analysis subgroups and the meaning of the indicator of “unexplained” crime rate
change. Next, I define the community policing activities of interest and the
analyses performed to test the association between the two indicators of
community policing involvement and membership in the defined crime rate
change subgroups.
Sample
The study sample represents the population (N=454) of jurisdictions
policed by large, self-reporting, municipal-level, local police agencies as reported
by the 1996 Bureau of Justice Statistics Census of Local Law Enforcement
Agencies (Directory Survey of Law Enforcement Agencies) (Reeves and
Goldberg, 1998; Reeves and Goldberg, 1999). Large, self-reporting police
agencies are defined as: (1) employment of 100 or more full-time sworn officers
as of June 1996; (2) employment of 100 or more full-time sworn officers as of
June 1997; (3) employment of 50 or more full-time uniformed sworn officers with
regular assigned duties that include responding to calls for service (Reeves and
Goldberg 1999: summary tables p. x). Within local law enforcement agencies
employing 100 or more officers, municipal agencies are the most prevalent type
of local law enforcement agency (69.7%), followed by Sheriff (25.6%) and
County police (4.75%) (Reeves and Goldberg, 1999).
While the focus of the research on jurisdictions policed by large,
municipal level police agencies limits the generalizability of study findings, it was
necessary to do so for important reasons. First, research demonstrates that police
involvement in community policing activities varies by the type and size of
31

policing agency (Bureau of Justice Statistics, 2000; Maguire, et al., 1997; Wycoff,
1994). Municipal police agencies report a higher rate of participation over state
or other types of local police departments (Bureau of Justice Statistics, 2000;
Reeves and Hickman, 2001; Wycoff, 1994). Secondly, larger agencies generally
report rates of involvement in community policing significantly higher than
smaller agencies (Hickman and Reeves, 2001). Therefore, to make appropriate
comparisons between police agencies it was necessary to limit the analysis to a
single category of law enforcement agency.
Data availability also drove the decision to focus on large, municipal
agencies. Panel data detailing specific community policing activities of police
over several points of time is limited. The LEMAS data represents the only study
of this kind administered across multiple waves. Further, while LEMAS is
administered to a sample of smaller police agencies, BJS surveys the entire
population of large, municipal law enforcement agencies (Reaves and Goldberg,
1999). Thus, the narrow focus simplifies the analyses by avoiding procedures to
account for sampling of smaller police agencies. Second, place-level structural
data are not readily available for smaller jurisdictions. Although, prior research
examining the impact of community policing utilize county-level measures as
proxy indicators of these variables, it was not an appropriate strategy for this
project in that multiple law enforcement agencies are likely to be active within the
same county (GAO, 2005; Mulhausen, 2001; Zhao and Thurman, 2004).
Therefore, it would be inappropriate to attribute the police activities of one police
agency to fluctuations in county-level crime.
32

Data
The dataset created for this project combines four unique sources. (See
Table 1.) The 1997, 1999, and 2000 Bureau of Justice Statistics, Law
Enforcement Management Statistics Surveys (LEMAS) provided indicators of the
sample’s community policing practices across the four-year period of study
(Bureau of Justice Statistics, 1997, 1999, 2000). (See Appendix D.) The Federal
Bureau of Investigation, Uniform Crime Reports provided the 1997 and 2000
total, violent and property index crime rates per 100,000 residents (Federal
Bureau of Investigation, 1997, 2000). The 2000 Census and 2000 Bureau of
Labor Statistics provided structural-level indicators. Linking multiple data
sources undoubtedly raises concern for unmatchable and/or unavailable data.
There were circumstances of such in the present study.15 Of the 474 cases in the
full sample, 24 (5%) did not respond to all three waves of the LEMAS survey.
An additional 75 (15.8%) had incomplete structural or crime data.16 The analysis
subgroups created for the study were drawn from the remaining sample of 375
large, municipal-level agencies.17
15 I verified successful matching across the seven data sets on a randomly selected group of cases. Additionally, I compared the final dataset to a similar dataset created by Zhao and Thurman (2004) and found that they were comparable. I received the dataset from Thurman Zhao in April, 2003. (Memorandum on file with author.) 16 Maltz (1999) notes that imputation errors such as incomplete reporting, non-reporting, and zero population are inherent to UCR data and can be problematic in studies utilizing these data (1999:26). As such, I coded cases for which UCR data was not based on the full 12 month reporting cycle or had zero-population values as missing. 17 Similar studies report comparable rates of missing data (Zhao and Thurman, 2004; Kelling and Sousa, 2001; MacDonald, 2002).
33

Analysis Procedures
I divided the analysis procedures into three steps. First, I defined the
analysis subgroups. The six subgroups created represent police jurisdictions
selected from the full sample based upon their ranking on a measure of
“unexplained” change in total, property, and violent index rates between 1997 and
2000. (Step I below provides a detailed explanation of the measure of
“unexplained” crime change.) Next, linking survey responses from the 1997,
1999, and 2000 LEMAS, I created indicators of police involvement in eight
community policing activities across the four year period of study. Finally, I
tested the relationship between membership in the subgroups of crime rate change
and continued involvement in the community policing activities of interest.
Step I. Defining the Analysis Subgroups
The analysis subgroups represent cases (police jurisdictions) within the
study sample measuring deviant shifts in total, property and violent index crime
rates between 1997 and 2000. For the purpose of this study, “unexplained” crime
change refers to fluctuations in index crime rates above those explained by
traditional factors commonly associated with crime trends (e.g. economic
indicators, population demographics). Defining the subgroups required a two-
stage procedure. In Step I(a), regression models of index crime rate change
allowed me to isolate variation in crime rates explained by the defined model
from that left “unexplained” into a single variable - the stochastic or residual (U).
In Step I(b), I selected cases from the study sample based on this measure of
unexplained crime change. Selecting the outlier cases on the ordered distribution
34

of the residual (U), the resulting subgroups represent police jurisdictions within
the study sample measuring the highest levels of “unexplained” improved and
worsened index crime rates between 1997 and 2000.
Step I(a): Isolating Unexplained Change in Crime
OLS Regression Model of Crime Rate Change: Defined
Dependent Variables
The dependent variables equal the difference between total (t), property
(p), and violent (v) index crimes rates between 1997 and 2000 (RATEDIF t, p, v).
The Federal Bureau of Investigation, Uniform Crime Reports provided the 1997
and 2000 total, violent, and property index crime rates per 100,000 population.
(See Table 1.) The property crime rate includes larceny-theft, motor-vehicle theft,
and burglary.18 The violent crime rate includes murder, rape, assault, and
robbery. Total crime rate equals the combined violent and property crime rates.
The equation is as follows:
RATEDIFt, p, v = (1997 RATE t, p, v) – (2000 RATE
t, p, v)
Predictor Variables
The predictors included in the OLS model of explained crime change
include those traditionally used in social science research and studies of aggregate
crime including population demographics, economic measures, geographic
region, and population density (Allison, 1976; GAO, 2005; Mac Donald, 2002;
18 Arson is excluded in both the property and total crime rates.
35

Kelling and Sousa, 2001; Sampson and Groves, 1989; Zhao and Thurman, 2004).
Seven indicators represent data reported by the 2000 Census and 2000 Bureau of
Labor Statistics including, percent minority (MINORITY), percent female head of
household with children under 18 years of age (FHHC), percent of population
between the ages of 15 and 24 (YOUNG), percent living in same house for five
years or more (SAMEHS), percent housing owner occupied (OWNER),
population density (POPDEN), and percent unemployed (UEMPLOY). In
addition, I included the 1997 crime rate (97RATE) to control for regression to the
mean (Hanushek and Jackson, 1977). In studies examining change (difference) in
a dependent variable, the addition of base rate variable (in this case the 1997
index crime rate) controls for any unexplained deviations above the average rate
change for that group.19
Research has consistently demonstrated that even within large municipal
police agencies, participation in community policing activities varies both by the
size of police agency and geographic region (Maguire et al., 2000; Maguire, et al.,
2003; Wycoff, 1994; Zhao and Thurman, 2004). Specifically, larger municipal
police departments are more likely to engage in community policing, as are those
located in western parts of the United States (Wycoff, 1994; Hickman and
Reeves, 2001). Accordingly, I included the natural log of full-time equivalent
19 As the OLS model is used for only as a mechanism for identification and not explanation, I did not strive for a perfectly fit model with a high proportion of explained variance. Therefore, I included only those explanatory variables most commonly associated with crime (Allison, 1976; Sampson and Groves, 1989).
36

personnel (FTELOG) and the regional location of the police jurisdiction
(REGION) to account for this variation.
The resulting equation for the regression model explaining changes in total
(t), property (p), and violent (v) crime rates between 1997 and 2000 (RATEDIF)
is:
RATEDIF(t,p,v) = α + B1 (97RATE t,p,v) + B2 (MINORITY) + B3 (YOUNG) + B4
(FHHC) + B5 (OWNER) + B6 (SAMEHS) + B7 (EMPLOY) + B8 (POPDEN)
+ B9 (REGION) + B10 (FTELOG) + U
The OLS Regression Model of Crime Rate Change: Results
Table 2 reports the crime rates and crime rate changes for the study
sample. Notably, a negative rate difference indicates an increase in index crime
rates (worsened) between 1997 and 2000. A positive rate difference indicates a
decrease (improvement).20 Overall, the sample averaged a decrease in crime
between 1997 and 2000. Total crime rates declined by 16%, violent crime by
19%, and property crime by almost 16%. These changes are consistent with
national measures of aggregate crime rate change during the same time period.
Between 1997 and 2000 national total index crime rates declined 15.7%, violent
index crime rates declined 17%, and property index crime rates declined 16.1%.21
20 To ensure that extreme crime rate changes were not due to errors in source data or computation, I plotted the distribution of each crime rate change to identify any usual, outlying cases. I validated all crime rate computations for cases falling within two standard deviations from the mean. 21 Bureau of Justice Statistics, Data On-Line (accessed on March 28, 2005 via the World Wide Web at http://bjsdata.ojp.usdoj.gov/dataonline/). Notably, across all three types of crime change, there were cases measuring increases in index crime rates between 1997 and 2000. Twelve percent of the sample measured increases in total index crime rates between 1997 and 2000; 13%
37
Table 2 also reports the descriptive statistics of the predictor variables
included in the OLS regression model. The population in the sample jurisdictions
averaged a 6.9 rate of unemployment. Almost half identified themselves as
minority (42.8%); 13% were between the ages of 15 and 24. Just over half (55%)
resided in owner-occupied housing; half (50%) reported living in the same home
for five years or longer. The jurisdictions averaged a population density of 4522
persons per square mile. The sample averaged 572 sworn FTE personnel. Most
were located in the South (37.3%), followed by Northeast (23.5%), West (22.9%),
and Midwest (16.3%). (Data not shown.) (See Appendix B for region categories.)
Table 3 reports the results of the OLS regressions of change in total,
property, and violent index crime rates. All predictors are in the expected
direction across the three OLS models and explain between 28 to 37% of the
variance in index crime rate change between 1997 and 2000.22 Overall, the model
fit the data relatively well; providing a better prediction of crime rate change than
the mean value of crime rate change for the sample examined. I saved the
unstandardized residual from each of the three OLS models (Ut,p,v).
measured increases in property index crime rates and 20% measured increases in violent index crime rates. (Data not shown.) These trends are consistent with other studies examining explanations of changing crime (Zhao and Thurman, 2004) and confirm that not all places in the United States experienced crime declines over the last decade. 22 To support the creation of the analysis subgroups, it was desirable to define an OLS model that allowed a sufficient amount of variance in the residual (U). If the variance was too small, the tails of distribution would be very narrow (resulting in fewer “outlier” cases) thereby risking a loss in the specificity intended by the analysis approach. Step I(b) further explicates the importance of the distribution of the residual in the current study.
38
Step I(b): Outliers of Unexplained Crime Change
OLS Residual: An Indicator of Unexplained Crime Rate Change
In OLS regression, the residual (U) represents not only random and
measurement error, but also any variation of the dependent variable not fully
explained by the predictors included in the defined model (Hanushek and Jackson,
1977). In the case of the current analysis, the predictors included in the OLS
models explained approximately 28 to 37% of the variation in crime rate change
within the study sample. The stochastic (U) of each of these models represents all
factors not explicitly defined in the systematic portion of the model. The research
relied on this quality of the stochastic for the analyses. While recognizing that the
stochastic reflects all unaccounted confounds, unspecified predictors, and random
error within the defined OLS model, we would expect that this variable would
also capture any effect of the police on crime rate change. Separating the effect of
predictors known to influence crime rate change from that of unknown
explanatory variables allowed me to create study conditions well-suited to detect
whether a relationship between community policing practices and improvements
in crime rates exist.
This approach is not to be confused with residual analysis. In contrast, the
error term of the regression model is not subject to analysis. Rather it is strictly
used as an indicator to select cases into the analysis subgroups. (See Darlington
and Smulders (2001) for a commentary on the use and limitations of residual
analysis.)
39

Outliers of Unexplained Crime Change
Figure 1 illustrates the distribution of the unstandardized residual of the
OLS regression model on crime rate change in violent index crime between 1997
and 2000. The deviant cases on either side of the distribution represent cases
(police jurisdictions) measuring the greatest “unexplained” change in violent
index crime rates between 1997 and 2000. For the purpose of this study,
“unexplained” change is defined as any variation in crime rate change left
unaccounted for by the predictors included in the OLS regression of crime rate
change. The cases on the left-side of the distribution (-U) represent police
jurisdictions within the study sample measuring the greatest “unexplained”
increases (worsened) in violent crime rates. The cases to the right represent of the
distribution (U+) represent police jurisdictions within the study sample measuring
the greatest “unexplained’ decreases (improvement) in violent crime rates.
Descriptive analysis of the distribution of the residual helps to clarify what it
means to be deviant on the basis of “unexplained” crime change.
Across all three crime change groups, most residual values fell between
one to two standard deviations from the mean. Fewer than 10 % of the residual
values were greater than two standard deviations from the mean. Essentially, this
can be interpreted to mean that the unexplained crime change for each of the
subgroups was higher than that of 68% of the sample (Weisburd, 1998). These
deviant cases represent jurisdictions with the highest “unexplained crime change”
during the period of the study. In essence, all else being equal (i.e. population
demographics, employment), these deviant cases represent jurisdictions with
40

extraordinarily high changes in crime rates compared to other jurisdictions in the
sample.
To create the analysis subgroups, I selected the fifty outlying cases on
either end of the ordered distribution of the saved OLS residuals. Those to the far
right of each distribution (+U) represent cases with the greatest decreases
(improvements) in “unexplained” crime change, while those to the far left (-U)
represented cases with the greatest increases (worsened). The resulting six
subgroups include the outlier cases (n=50) per direction of crime change
(improved and worsened) and crime type (total crime, property, and violent).
Limiting the analysis to a set number of outlier cases may be cause for concern
for the design sensitivity of the research. Weisburd (2000) notes that statistical
power is often overlooked in criminal justice research and suggest using Cohen
(1988) as a guide in assuring that the sample size yields a statistically powerful
study. Accordingly, I conducted power analyses to ensure that the pre-defined
breakpoints for inclusion into the subgroups provided the greatest possible
statistical power for testing the associations in the final stage of the analysis. (See
Step III.)
Step II. Community Policing Activities
Choice of Variables
The spirit of this research is centered on the idea that police involvement
in community policing will return positive crime outcomes (Maguire and Eck,
2000; Kelling, 1987; Goldstein, 1986). The study makes a distinction between
police involvement in community policing (what they do) and facilitators of
41
community policing (e.g. training and technology); focusing the analysis on
whether specific community policing activities relate to improvements in
aggregate crime.
LEMAS captures a wide variety of police practices that could be classified
as community policing activities. However, comparing police practices at the
macro level required special considerations. Therefore, I followed
recommendations of research on the reliability and validity of multi-wave police
administrative survey data to create the best measures of community policing
(Mastrofski, 2000; Uchida et al., 1986). Limited ambiguity in survey questions
increases the validity of the measure and increases the reliability between survey
administrations (Uchida et al., 1986; Mastrofski, 2000). Typical in surveys where
the unit of analysis is an organization rather than an individual, these clear
descriptions also increase confidence in the reliability of cases where the
respondent for the organization changes from year-to-year (Mastrofski, 2000).
While BJS strives for internal validity by keeping LEMAS survey questions clear,
concise, and consistent between waves, there were some instances where survey
questions were slightly re-worded between administrations. Therefore, I included
only those questions worded exactly the same across all three waves (Reeves and
Goldberg, 1999). Next, I presented the survey questions to a review panel. The
panel assessed the likelihood that activity descriptions would be interpreted to
mean the same to all respondents. Of the twenty-two LEMAS questions
reviewed, the panel concurred that the eight community policing activities
42

included in the study were the least ambiguous and would be interpreted with the
highest degree of confidence between reporting agencies.
While these criterions resulted in a loss of more than half of the
community policing activities captured by LEMAS, I believe it increased
confidence that respondents interpreted the activity description consistently and
accurately between waves and increases internal validity of the measures
(Maguire and Uchida, 2000). As such, I believe the specificity yields the best
measures for comparing community policing practices between police
organizations across several points in time. The eight community policing
activities defined for the research represent a variety of strategies carried out in
various dimensions of the police organization including internal policies and
procedures, external patrol tactics, community involvement, and proactive crime
strategies.23 The eight activities of interest are:
(1) Community policing officer(s). Police involvement is defined as at
least one full-time sworn officer serving as a community policing officer.
(2) Use of citizen survey information. Police involvement is defined as an
affirmative response to using citizen survey information in support of at least one
of the following functions: (a) allocating resources to targeted neighborhoods, (b)
prioritizing crime/disorder problems, (c) formulating agency policy and
procedures, (d) redistricting beat/reporting areas, or (e) providing information to
23 See Appendix C for the coding protocol of the community policing activities of interest. See Appendix D for the complete 1997, 1999, and 2000 LEMAS surveys.
43

patrol officers. Citizen survey information could include satisfaction with police
services, perceptions of crime and disorder, and/or personal crime experiences.
(3) Geographic-based assignments. Police involvement is defined as the
giving patrol officers’ responsibility for specific areas or beats.
(4) Routine foot patrol. Police involvement is defined as foot patrol units
used in routine patrol.
(5) Routine bike patrol. Police involvement is defined as bike patrol units
used in routine patrol.
(6) Community group meetings. Police involvement is defined as meeting
with at least one type of community group to address crime-related problems.
Types of groups include neighborhood associations, advocacy groups, business
groups, religious groups, youth service organizations, school groups, and tenant’s
associations.
(7) Train citizens in community policing. Police involvement is defined as
training citizens in community policing such as community mobilization and
problem solving.
(8) Problem solving. Police involvement is defined as problem-solving
partnerships with community groups or municipal agencies, or others through
specialized contracts or written agreements.
Involvement in Community Policing
Sustainability
The main tenet of my thesis is that the sustainability of community
policing is inherently linked to the realization of its effectiveness. Prior research
44

examining the effect of community policing activities on aggregate crime limited
the measure of community policing practices to one point in time. Yet,
community policing is known to be difficult to implement successfully for
extended periods of time (Maguire and Katz, 2002). Linking responses to
participation in specific activities across multi-wave panel studies provided an
indicator of whether the police organization continually practiced the strategy,
tactic, or policy across the four year period of study (1997-2000). I classified
involvement in community policing activities as either continual or none.
Continual or full involvement indicates that the agency returned affirmative
responses (yes) across all three waves of the LEMAS survey. No involvement
indicates that the agency did not report participation in any wave of the LEMAS
survey.24
Table 4 reports police involvement in the community policing activities of
interest as reported by the full sample in the 1997, 1999, and 2000 LEMAS
surveys. Overall, aggregate rates of participation either increased or remained
stable across the three waves for the majority of community activities examined.
Notably, police use of survey information and problem solving declined by 16.8%
and 22.6% respectively. Continual (full) involvement in each of these activities
between 1997 and 2000 is lower than the aggregate annual rates. Activities
measuring the highest level of continual involvement include regular meetings
24 I created an indicator for intermittent participation in specific activities. While this indicator was not used in study analyses, I found the patterns of participation across waves interesting and discuss them throughout the report.
45

with community groups (96.8%), geographic-based assignments for patrol
officers (84%), full-time sworn community policing officer(s) (74.4%), and
routine bike patrol (71.5%). On average, less than 50% of the sample reported
continual involvement in use of citizen survey information (23.2%), routine foot
patrol (46.7%), and problem solving (28.3%). Activities measuring the highest
rate of no involvement were surprising. Although many agencies reported
intermittent use of survey information, almost one-fifth of the sample did not
report using citizen survey information to inform policies or procedures.
Additionally, 13% did not implement foot patrol.
Table 5 also reports the distribution of the study samples involvement in
the number of the eight community policing activities of interest. Levels of
participation across the three waves are relatively consistent; the majority
reporting involvement in more than six of the eight activities. Fourteen percent of
the sample reported involvement in all eight of the community policing activities
in the 1997 administration. The level increased a bit in 1999 to 21.1% and then
declined to 15.7% in 2000. Levels of participation diminish when examining the
extent to which police agencies report consistent involvement in a specified
number of community policing activities across the four year period of study.
(See Figure 2.) Over three-quarters (79%) of the sample reported continued
involvement in at least four of the eight activities of interest; 26% reported
continued involvement in six or more activities. Notably, less than 10% of the
sample reported continued involvement more than seven activities; 1.3% reported
46
involvement in all eight community activities of interest across the four year
period of study.
Step III. Community Policing and Changing Crime
I tested the relationship between police involvement in the community
policing activities of interest (full or none) and membership in the analysis
subgroups (unexplained increase or decrease in index crime rates) using chi-
square. (See Step I for description of the analysis subgroups.) I repeated the
analysis for the each of the eight community policing activities of interest by
crime change subgroups (total, property, and violent). I also examined whether
police involvement in the number of specified community policing activities was
associated to improvements in crime rates within the subgroups examined.
I assessed whether the design sensitivity of the chi-square test yielded an
optimal level of statistical power. Statistical power is an important indicator of
the study’s capacity to identify a relationship. Weisburd (1998) notes “as the
statistical power of a study gets higher, the risk of making Type II error, or failing
to identify a relationship, gets smaller (Weisburd, 1998:275). For the chi-square
test (df=1, alpha=.05), in order to detect a medium effect size (W=.30), a sample
of 100 will reach .85 power (Cohen, 1988). A power score of .85 indicates that
there is an 85% chance of detecting an effect and is well within the recommended
level of statistical power (Weisburd, 1998). To detect a medium effect size
(W=.30) for the chi-square test on the number of community policing activities by
crime change group (df=7, alpha=0.5), a sample size of 100 would only yield a
power score of .55 (Cohen, 1988). Therefore, in order reach the recommended
47

level of statistical power of .80 (Weisburd, 1998), I expanded the size of the
subgroups for this particular analysis. While increasing the subgroup size may
dilute the difference I intended to create between the subgroups, the adjustment
improved the design sensitivity. For the chi-square test (df=7, alpha=.05), in
order to detect a medium effect size (W=.30), a sample of 180 will reach .80
power. A power score of .80 indicates that there is an 80% chance of detecting an
effect.
Limitations
While the research offers an alternative approach from those traditionally
taken it is not without its limitations. First, the study sample is limited to large,
municipal police agencies. While this limits the generalizability of study
findings, the sample represents the population of this type and size of police
agency at the time of the 1997 LEMAS survey. The study is further narrowed by
the focus on cases within the sample determined to be deviant on the basis of
“unexplained” crime change. This specification may not provide the optimal
level of explanatory power. However, for the purpose of this study, the narrow
focus provides the best conditions to detect whether a relationship between police
involvement in community policing and improvements in aggregate crime change
exist. While this approach does not allow assessment of how much the effects of
community policing may vary by other explanatory measures (e.g. population
demographics), this is not viewed as a weakness. The primary objective is to
focus in on the relationship between police involvement in specific activities and
aggregate crime trends irrespective of how they have combined with socio-
48
demographic indicators crime change. Therefore, the use of more sophisticated
analytic strategies (e.g. truncated regression models) over the approach taken
would not provide any added value.
The study defines community policing as police involvement in eight
specific community policing activities. As LEMAS includes many measures of
police practices that potentially fall under the rubric of community policing, this
limitation may appear to be an opportunity lost. However, many of these
measures do not represent tangible community policing activities but rather
facilitate community policing practices. For example, community policing
training provides police with the knowledge of the goals of objectives of the
community policing philosophy. The training may even provide concrete
examples of how to implement community policing successfully. However, we do
not have measures of what police do as a result of this training. A better measure
of community policing would be the activities that police implement in their
communities. I believe the activities selected for the analysis represent measures
of what police actually do in support of community policing. Further, I believe
they are the best measures for macro-level evaluations of effectiveness given
available data.
Commentaries on the study of community policing note that the temporal
ordering of the advancement of community policing in relation to the crime
decline suggests that it is not possible for it be a primary influence (Levitt, 2004;
Mulhausen, 2001). While existing data of police practices do not allow us to
discern with great confidence the chronological development of community
49

policing at the macro-level, multi-wave panel studies of police practices
conducted within the last decade do allow us to examine these relationships
within specific periods of time. Further, it allows us to detect whether differences
in specific community practices exist and how they relate to aggregate
phenomenon such as crime change.
Another potential drawback of the project is its narrow focus on outcomes
of community policing. Although crime rates are a common performance
measure of police practices, the benefits of community policing are most evident
in outcomes such as citizen satisfaction, fear of crime, and perceptions of disorder
(Committee to Review Research, 2004; Sherman, 1997; Weisburd and Eck,
2004). However, recent efforts examining the macro-level benefits of community
policing have focused on similar outcome measures (GAO, 2005; MacDonald,
2002; Zhao and Thurman, 2004). As in those studies, this research explored the
contribution of community policing to improvements in aggregate crime trends.
The research adds to the current state of knowledge by utilizing the multi-
wave LEMAS data. These data have been vastly underutilized for the purpose of
discerning police involvement in specific activities over time and macro-level
assessments of police effectiveness (Langworthy, 2002; Maguire and Uchida,
2000). As research on community policing indicates that programs are almost
never implemented on a large scale, assessments of the continuity of their
involvement in specific activities as they related to crime benefits are warranted
(Langworthy, 2002; Rosenbaum and Lurigio, 1994).
50
CHAPTER IV. RESULTS
Table 5 reports police involvement in the community policing activities of
interest across the six subgroups of crime rate change. The subgroups represent
cases within the study sample measuring the highest (most different)
“unexplained” changes in total, property, and violent index crime rates between
1997 and 2000. For the purpose of this study, unexplained crime change is
defined as fluctuations in index crime rates above those explained by traditional
factors commonly associated with crime trends. (See Step I of research
methodology.) Overall, patterns of participation illustrate there is little difference
in police involvement in the community policing activities by direction of crime
change (improved vs. worsened) within the subgroups examined. Essentially,
police in subgroup jurisdictions with increasing crime report relatively the same
rate of participation in community policing as subgroup jurisdictions with
decreasing crime. This pattern was consistent across all categories of crime –
total, property, and violent index crime. While there is some fluctuation in
participation by type and direction of crime pattern, none were found to be
statistically significant. Nonetheless, rates of involvement across the various
crime change subgroups revealed a few interesting patterns.
The study examined two community policing activities implemented as
internal policies or procedures in police organizations - assignment of full-time
sworn community policing officer(s) and use of citizen survey information to
develop policies and procedures and/or inform allocation of resources. Overall,
subgroup jurisdictions measuring increases in crime report higher use of
51

designated full-time community policing officer(s). For example, the
participation rate for agencies with increases in violent crime was 14% higher
than those with decreases in violent crime (82% compared to 72%). This trend
was consistent across all three crime categories (total, violent, and property).
Police use of survey information is generally higher in jurisdictions experiencing
decreases in crime with one exception. Notably, the participation rate for
agencies with increases in property crime was 22% higher than those with
decreases in property crime. This difference may be due to citizen’s likelihood to
report instances of property crime over violent crime via surveys or that citizen
survey information yields more arrests in property related offenses over other
types of crime.
The study examined three community policing activities implemented as
external patrol tactics – geographic-based deployment, routine foot patrol, and
routine bike patrol. Police use of geographic-based deployment was highest in
jurisdictions with increasing crime. Notably, agencies with increases in property
crime reported participation rates 9% higher than those with decreases. Police
participation in bike and foot patrol was fairly consistent across all categories of
crime and direction of crime change. Participation rates in bike patrol were
approximately 8% higher in jurisdictions with decreases in violent crime than
those with increases.
The study examined one community policing activity implemented as
proactive crime prevention – problem solving. Interestingly, participation rates in
problem solving were 33% higher in subgroup jurisdictions with increases in
52

violent crime rates compare to those with decreases (32% and 24% respectively).
This trend may indicate that police within the subgroups are responding to
increasing crime with problem solving strategies. The study examined two
community policing activities implemented as community involvement –
community groups meetings and citizen community policing training. For police
involvement in community group meetings, the participation rate within the
subgroup with increases in violent crime was 5% higher than that of the subgroup
with decreases in violent crime (98% and 94% respectively). Across all three
crime categories, participation rates in citizen training were generally higher
within subgroup jurisdictions measuring decreasing crime rates. Participation
rates were 7% higher in jurisdictions with decreases in violent crime rates
compared to those with increases (30% and 28% respectively). Participation rates
were 17.6% higher in subgroup jurisdictions with decreases in total index crime
rates compared to those with increases (40% and 34% respectively).
Table 6 reports the distribution of police involvement in community
policing activities of interest by number of activities. Overall, patterns of
participation across the six subgroups mirror those of the full sample. Regardless
of the direction of crime rate change (improved/worsened), almost two-thirds of
police within the analysis subgroups reported involvement in at least five of the
eight community policing activities of interest. An exception to this trend was
within the property crime subgroups. Police reporting continual involvement in
seven of the eight community policing activities of interest was 75% higher in
subgroups with decreases in property crime rates compared to those with
53

increases (17% and 10% respectively). However, this association was not found
to be statistically significant. Interestingly, none of the police jurisdictions within
the analysis subgroups reported involvement in all eight of the activities of
interest.
54

CHAPTER V. DISCUSSION
Community policing marks a major shift in police practices. Although the
definition of community policing is subject to as many criticisms as support,
evidence of its advancement both in the number of police agencies reporting
involvement in community policing and the breadth of activities implemented
illustrates its impact on police practices. As a result, community policing is the
most widely cited explanation for the decline in national crime rates over the last
decade (Levitt, 2004). However, the existing research on the effectiveness of
community policing on macro-level outcomes is limited and subsequently
inconclusive (Weisburd and Eck, 2004).
This study sought to extend the current state of knowledge by focusing on
how police involvement in specific community policing activities relates to
improvements in index crime rates over time. Overall, the study did not find
police involvement in the community policing of interest to be significantly
related to improvements in total, property or violent index crime rates within the
subgroups examined. Most interestingly, police involvement in community
policing was found to be comparable regardless of improved or worsening crime
rates. These findings lead us to question why this is so.
The specifications of the research methodology intended to provide
conditions most optimal for detecting whether a relationship between police
involvement in community policing and improvements in crime rates exist.
While the focus on large, municipal police agencies limits the generalizability of
study findings, I do not believe the narrowly defined analysis subgroups affected
55

study outcomes. However, the measures of community policing activities and
period of study may have impeded the study’s capacity to detect the true
relationship between community policing and aggregate crime trends. Further, I
am left to question whether macro-level assessments of aggregate crime trends are
the most appropriate for assessing community policing effectiveness.
It is difficult to execute an experimental research design evaluating the
macro-level benefits of police practices (Eck and Maguire; 2000; Kelling and
Sousa, 2001). Quasi-experimental designs offer a pragmatic alternative
(Weisburd et al., 2001). Similar to previous studies assessing the effect of
community policing on aggregate crime trends, the research utilized regression
techniques to differentiate the effect of community policing from explanatory and
confounding factors relating to study outcomes (GAO, 2005; MacDonald, 2002;
Zhao and Thurman, 2004). The point of departure of the study from prior
research is the narrowly defined analysis approach. I defined my dependent
variable based on the residual (U) of OLS regressions on change in index crime
rates. The research strategy relied on the assumption that the effect of police (if
any) on crime would be isolated into this single variable. The decision to define
the analysis subgroups on the residual (U) provided a degree of specificity that I
believe offset sacrifices in explanatory power. While the study did not seek to
model the relationship between community policing practices and crime rate
change, the analytic strategy of the research provided a method to identify
whether community policing practices varied by direction of crime trends within
56
the jurisdictions examined and provides a better understanding of the cumulative
benefits of community policing to aggregate outcomes.
The study demonstrates that while police are involved in many community
policing activities, involvement in particular community policing activities is
relatively inconsistent over time. Fewer than half the study sample reported
continued involvement in use of citizen survey information, routine foot patrol,
citizen training, or problem solving. It is plausible that evidence of effectiveness
may be thwarted by the shallow nature of implementation of community policing
activities. This is especially the case for problem solving which has the strongest
evidence supporting its effectiveness (Weisburd and Eck, 2004). As such, we
may be looking for crime benefits absent knowledge on the extent police
implement strategies with focus and consistency. Existing macro-level data on
community policing practices does not allow us to discern (with great certainty)
the status of police involvement in the activities of interest prior to the study
period (pre-1997). As LEMAS continues, future research should examine how
longer periods of implementation of community policing strategies effect crime.
Additionally, future research should examine what factors (i.e. implementation
fidelity, funding support, community involvement) influence the sustainability
and quality of community policing strategies.
Police implement a variety of community policing strategies. Given the
variety of activities commonly associated with community policing, the focus of
the study on a select number of activities may not represent a comprehensive
measure of its practice at the agency level. However, I believe the measures of
57
community policing defined in the study maximized available data and improved
upon prior measures in aggregate studies of effectiveness. This study
demonstrates the value of police administrative data in providing measures of
police involvement in specific community policing activities at the macro-level.
However, specific findings of the research lead me to question validity of several
of the LEMAS survey questions. For example, the study found that the subgroups
of jurisdictions measuring increases in crime reported the highest use of
geographic-based deployment. However, the data does not allow us to discern
whether the motivation for geographic-based deployment was to improve police-
citizen contacts (a community policing activity) or directed patrol strategy such as
Compstat or Hotspots policing. The study found that police in subgroup
jurisdictions measuring increases in violent crime rates reported a higher rate of
participation in problem solving compared to jurisdictions within the subgroup
measuring decrease in violent crime rates. While problem solving is a well
documented concept throughout police literature, the LEMAS survey does not
allow us to discern whether respondents define the activity as Goldstein’s
prescriptive SARA model or utilize a more moderate definition such as those
falling within other innovative police strategies including third-party policing and
“pulling lever” approaches in criminal justice (Buerger and Mazerolle, 1998;
Goldstein, 1987; Kennedy et al., 1996). Future research should concentrate on
validating these measures and improving systematic documentation of the
interpretation, implementation, and intended outcome of specific community
58

policing activities. With better measures, we can make more accurate attributions
to the extent particular strategies influence police effectiveness.
The study did not find any significant associations between police
involvement in community policing and improvements in index crime rates within
the subgroups examined. This brings me to question whether perhaps aggregate
crime rates are an appropriate measure of effectiveness. The primary objective of
community policing is to build strong police-citizen relationships. These
relationships, in turn, should yield positive public safety benefits (Kelling and
Coles, 1996; Wilson, 1968). As such, outcome measures such as citizen
satisfaction fear of crime and perceptions of police legitimacy may be more
reasonable indicators of effectiveness. In fact, research evidence to date is
strongest in these outcomes (Weisburd and Eck, 2004; Zhao and Thurman, 2004).
While not the driving force in improving police effectiveness, perhaps these
strategies are indirectly related to reductions in crime (Sherman, 1997). Many
speculate that stronger police-citizen relationships enhance community capacity to
respond to crime via informal social control mechanisms (e.g. collaborative
partnerships, education and awareness) (Kearly and Benson, 2000; Pino, 2000;
Sampson et al., 1997). There is little research examining the effect of community
policing in strengthening a community’s capacity to respond to crime. Future
studies on community policing effectiveness should focus on the disentangling the
relationship between community policing activities of police and collective
efficacy as they relate to crime outcomes.
59
Micro-level research, focused on a particular city or town, yields different
findings than macro-level studies of community policing effectiveness. For
example, in their study of the contributions of policing to the decline in crime in
New York City, Kelling and Sousa (2001) found problem solving to be positively
associated to improvements in crime. Skogan et al. (2002) also supports the role
community policing played in decline in index crime rates in the City of Chicago.
Wycoff and Skogan (1993) report similar findings in Madison, Wisconsin.
Perhaps a macro-level analysis is not an appropriate method for studies of
community policing effectiveness. Alternatively, perhaps an explanation for the
divergence in study findings is not due to the level of analysis but rather the data
used to measure police practices and other relevant analysis variables. Smaller or
micro-level studies provide opportunities to collect much better data. Better
measures of place-based phenomena (e.g. crime, fear of crime, community health,
and social resources) and specific police practices (e.g. observations) provide the
researcher with a clearer understanding of the causal mechanism under study.
Coordinated, multi-site evaluations would provide a wealth of comparative
(standardized) measures and information from which to better study the
relationship between the multi-faceted community policing model and crime.
People want community policing to work. As public investments in
community policing peak, the importance of research assessing the overall
benefits of the strategy is warranted. While the findings of the research do not
support that the community policing practices are related to improvements in
crime within the subgroups examined, patterns of participation suggest that police
60

are responding to increasing crime with community policing strategies. Notably,
many community policing activities are difficult to execute consistently over
time. Short-comings in implementation likely play an important role in
effectiveness. Perhaps lengthier study periods, as in those predominate in case
studies of community policing, would yield different results than those of the
current study. As federal support of community policing decreases it will be
interesting to track whether trends in reported participation are affected and how
these shifts relate to crime outcomes. However, without advancements in the
systematic documentation of police practices, unveiling a more detailed picture of
community policing, disentangling the relationship between community policing
and aggregate crime trends will continue to be challenging.
61

62

APPENDIX A. TABLES AND FIGURES
Table 1. Analysis Variables by Data Source
Data Source Variable % Minority (MINORITY) % Female Head of Household w/ Children under 18 Years of Age
(FHHC)
% Persons between ages 15 and 24 (YOUNG) % Living in Same Home 5+ Yrs (SAMEHS) % Owner Occupied (OWNER)
U.S. Census (2000)
Population Density2 (POPDEN)
% Unemployed (UEMPLOY) Labor Statistics (2000)
Total Crime Rate per 100,000 residents (TOTAL) Violent Crime Rate per 100,000 residents (VIO) Property Crime Rate per 100,000 residents (PROP)
FBI Uniform Crime Report (1997 and 2000)
Geographic Region (REGION)
Natural Log FTE Sworn Personnel (FTELOG) LEMAS (1997, 1999, 2000) Community Policing Measures - - - - - Notes: All variables are continuous level except regional categories (four categories) and community policing activities. Reference dates for data are: 2000 Census = June 1st; UCR = December 31st; Labor Statistics = December 31st; LEMAS = June 30th. Full time equivalent (FTE) sworn personnel = rounded [(# sworn full time employees) + 0.5 * (# worn part-time employees)] (Reeves and Hickman, 1999). See Appendix B for regional categories. See Appendix C for community policing measures.
63
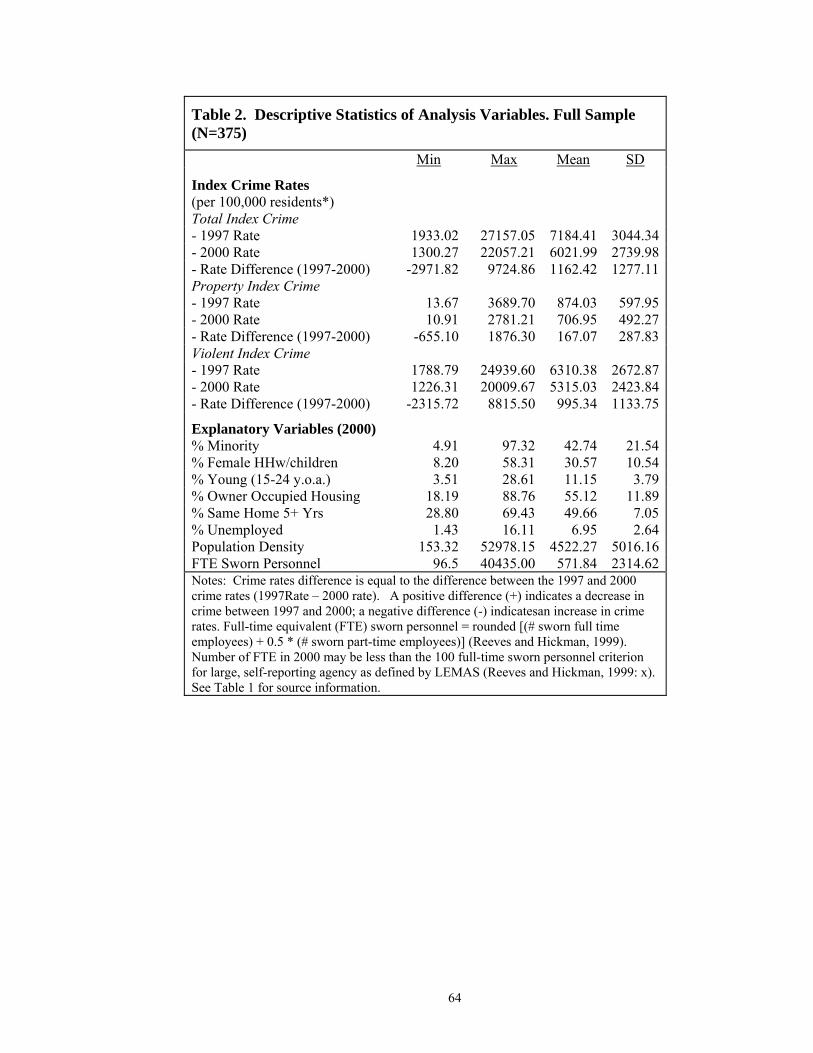
64
Table 2. Descriptive Statistics of Analysis Variables. Full Sample (N=375) Min Max Mean SD
Index Crime Rates (per 100,000 residents*)
Total Index Crime - 1997 Rate 1933.02 27157.05 7184.41 3044.34- 2000 Rate 1300.27 22057.21 6021.99 2739.98- Rate Difference (1997-2000) -2971.82 9724.86 1162.42 1277.11Property Index Crime - 1997 Rate 13.67 3689.70 874.03 597.95- 2000 Rate 10.91 2781.21 706.95 492.27- Rate Difference (1997-2000) -655.10 1876.30 167.07 287.83Violent Index Crime - 1997 Rate 1788.79 24939.60 6310.38 2672.87- 2000 Rate 1226.31 20009.67 5315.03 2423.84- Rate Difference (1997-2000) -2315.72 8815.50 995.34 1133.75
Explanatory Variables (2000) % Minority 4.91 97.32 42.74 21.54% Female HHw/children 8.20 58.31 30.57 10.54% Young (15-24 y.o.a.) 3.51 28.61 11.15 3.79% Owner Occupied Housing 18.19 88.76 55.12 11.89% Same Home 5+ Yrs 28.80 69.43 49.66 7.05% Unemployed 1.43 16.11 6.95 2.64Population Density 153.32 52978.15 4522.27 5016.16FTE Sworn Personnel 96.5 40435.00 571.84 2314.62Notes: Crime rates difference is equal to the difference between the 1997 and 2000 crime rates (1997Rate – 2000 rate). A positive difference (+) indicates a decrease in crime between 1997 and 2000; a negative difference (-) indicatesan increase in crime rates. Full-time equivalent (FTE) sworn personnel = rounded [(# sworn full time employees) + 0.5 * (# sworn part-time employees)] (Reeves and Hickman, 1999). Number of FTE in 2000 may be less than the 100 full-time sworn personnel criterion for large, self-reporting agency as defined by LEMAS (Reeves and Hickman, 1999: x). See Table 1 for source information.
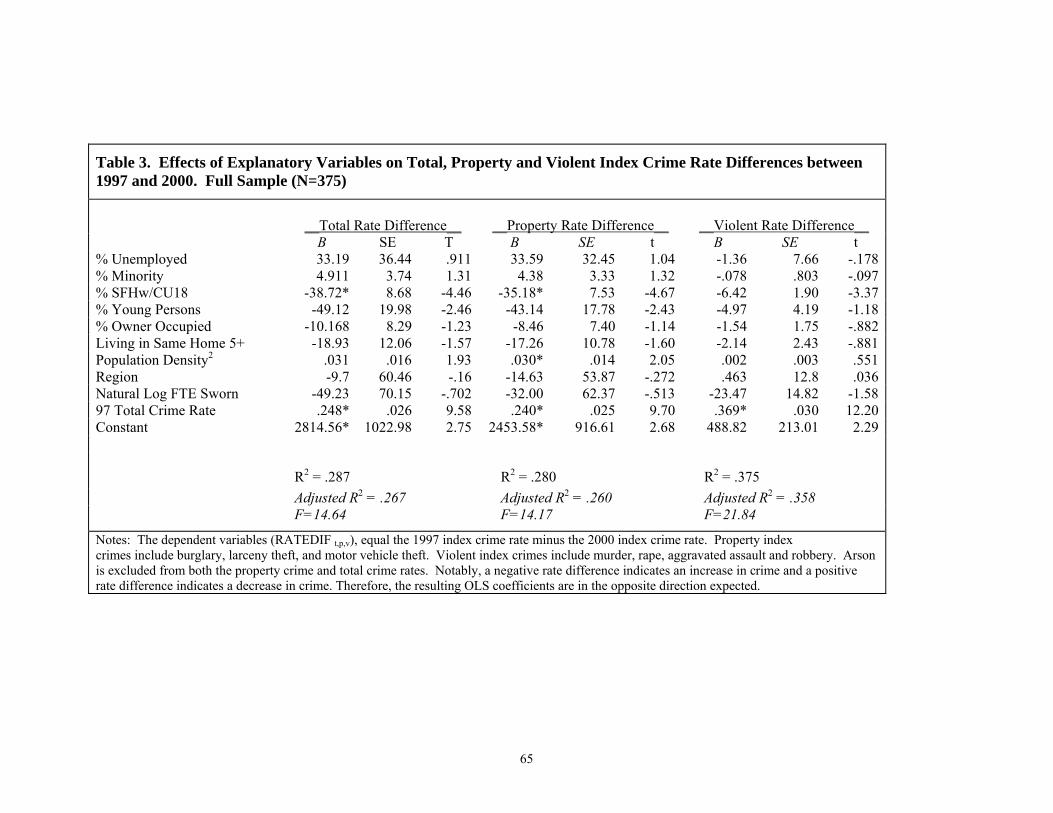
65
Table 3. Effects of Explanatory Variables on Total, Property and Violent Index Crime Rate Differences between 1997 and 2000. Full Sample (N=375)
__Total Rate Difference__ __Property Rate Difference__ __Violent Rate Difference__
B SE T B SE t B SE t % Unemployed 33.19 36.44 .911 33.59 32.45 1.04 -1.36 7.66 -.178% Minority 4.911 3.74 1.31 4.38 3.33 1.32 -.078 .803 -.097% SFHw/CU18 -38.72* 8.68 -4.46 -35.18* 7.53 -4.67 -6.42 1.90 -3.37% Young Persons -49.12 19.98 -2.46 -43.14 17.78 -2.43 -4.97 4.19 -1.18% Owner Occupied -10.168 8.29 -1.23 -8.46 7.40 -1.14 -1.54 1.75 -.882Living in Same Home 5+ -18.93 12.06 -1.57 -17.26 10.78 -1.60 -2.14 2.43 -.881Population Density2 .031 .016 1.93 .030* .014 2.05 .002 .003 .551Region -9.7 60.46 -.16 -14.63 53.87 -.272 .463 12.8 .036Natural Log FTE Sworn -49.23 70.15 -.702 -32.00 62.37 -.513 -23.47 14.82 -1.5897 Total Crime Rate .248* .026 9.58 .240* .025 9.70 .369* .030 12.20Constant 2814.56* 1022.98 2.75 2453.58* 916.61 2.68 488.82 213.01 2.29
R2 = .287 R2 = .280 R2 = .375 Adjusted R2 = .267 Adjusted R2 = .260 Adjusted R2 = .358 F=14.64 F=14.17 F=21.84
Notes: The dependent variables (RATEDIF t,p,v), equal the 1997 index crime rate minus the 2000 index crime rate. Property index crimes include burglary, larceny theft, and motor vehicle theft. Violent index crimes include murder, rape, aggravated assault and robbery. Arson is excluded from both the property crime and total crime rates. Notably, a negative rate difference indicates an increase in crime and a positive rate difference indicates a decrease in crime. Therefore, the resulting OLS coefficients are in the opposite direction expected.
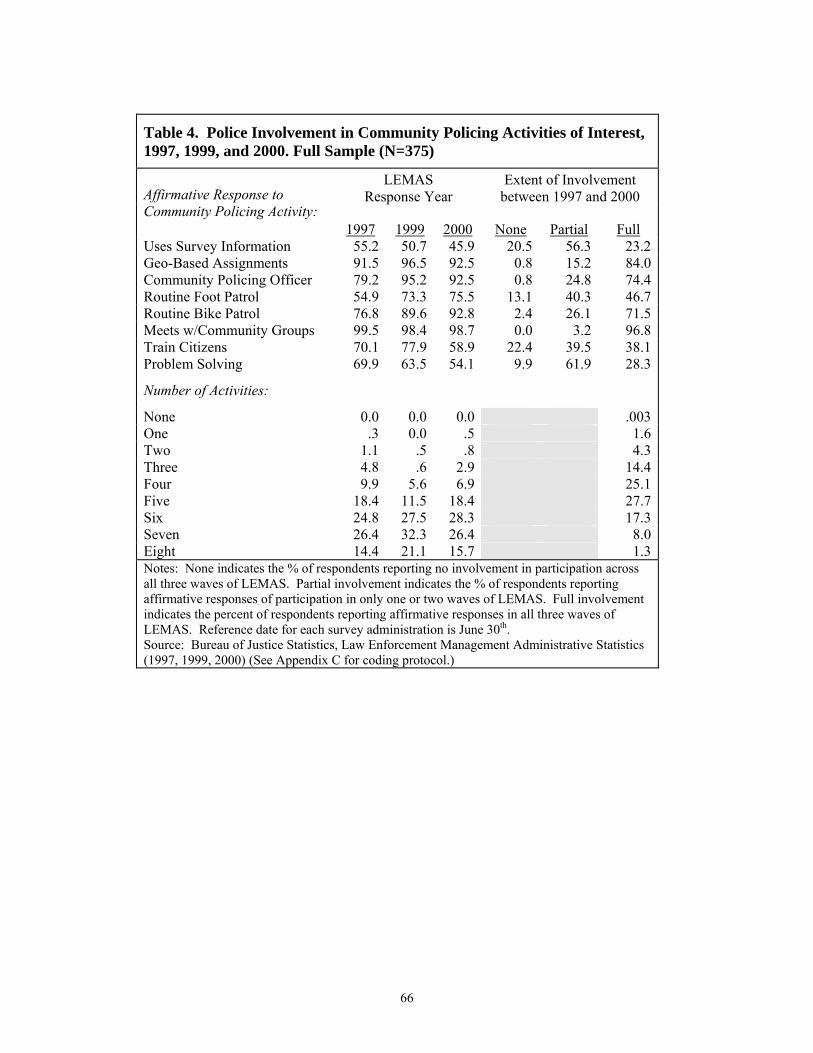
66
Table 4. Police Involvement in Community Policing Activities of Interest, 1997, 1999, and 2000. Full Sample (N=375)
LEMAS Response Year
Extent of Involvement between 1997 and 2000 Affirmative Response to
Community Policing Activity: 1997 1999 2000 None Partial Full
Uses Survey Information 55.2 50.7 45.9 20.5 56.3 23.2 Geo-Based Assignments 91.5 96.5 92.5 0.8 15.2 84.0 Community Policing Officer 79.2 95.2 92.5 0.8 24.8 74.4 Routine Foot Patrol 54.9 73.3 75.5 13.1 40.3 46.7 Routine Bike Patrol 76.8 89.6 92.8 2.4 26.1 71.5 Meets w/Community Groups 99.5 98.4 98.7 0.0 3.2 96.8 Train Citizens 70.1 77.9 58.9 22.4 39.5 38.1 Problem Solving 69.9 63.5 54.1 9.9 61.9 28.3
Number of Activities:
None 0.0 0.0 0.0 .003 One .3 0.0 .5 1.6 Two 1.1 .5 .8 4.3 Three 4.8 .6 2.9 14.4 Four 9.9 5.6 6.9 25.1 Five 18.4 11.5 18.4 27.7 Six 24.8 27.5 28.3 17.3 Seven 26.4 32.3 26.4 8.0 Eight 14.4 21.1 15.7 1.3 Notes: None indicates the % of respondents reporting no involvement in participation across all three waves of LEMAS. Partial involvement indicates the % of respondents reporting affirmative responses of participation in only one or two waves of LEMAS. Full involvement indicates the percent of respondents reporting affirmative responses in all three waves of LEMAS. Reference date for each survey administration is June 30th. Source: Bureau of Justice Statistics, Law Enforcement Management Administrative Statistics (1997, 1999, 2000) (See Appendix C for coding protocol.)
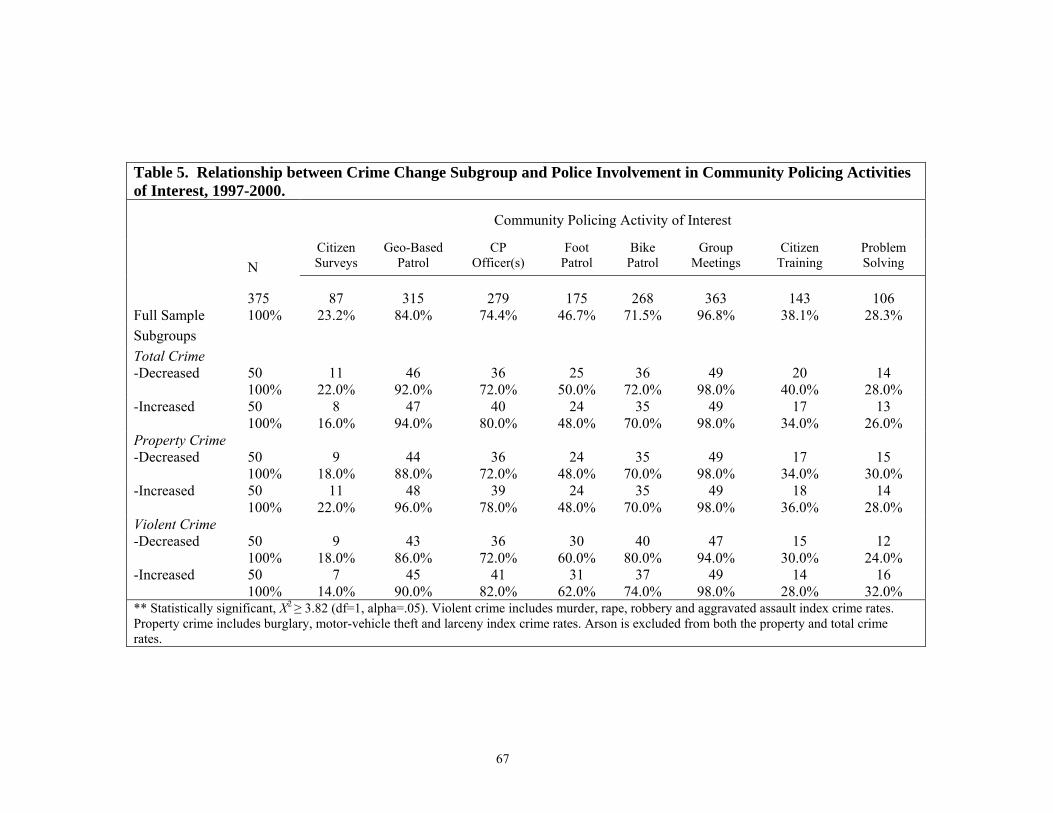
Table 5. Relationship between Crime Change Subgroup and Police Involvement in Community Policing Activities of Interest, 1997-2000.
Community Policing Activity of Interest
N
Citizen Surveys
Geo-Based Patrol
CP Officer(s)
Foot Patrol
Bike Patrol
Group Meetings
Citizen Training
Problem Solving
Full Sample 375 100%
87 23.2%
315 84.0%
279 74.4%
175 46.7%
268 71.5%
363 96.8%
143 38.1%
106 28.3%
Subgroups Total Crime -Decreased 50
100% 11
22.0% 46
92.0% 36
72.0% 25
50.0% 36
72.0% 49
98.0% 20
40.0% 14
28.0% -Increased 50
100% 8
16.0% 47
94.0% 40
80.0% 24
48.0% 35
70.0% 49
98.0% 17
34.0% 13
26.0% Property Crime -Decreased 50
100% 9
18.0% 44
88.0% 36
72.0% 24
48.0% 35
70.0% 49
98.0% 17
34.0% 15
30.0% -Increased 50
100% 11
22.0% 48
96.0% 39
78.0% 24
48.0% 35
70.0% 49
98.0% 18
36.0% 14
28.0% Violent Crime -Decreased 50
100% 9
18.0% 43
86.0% 36
72.0% 30
60.0% 40
80.0% 47
94.0% 15
30.0% 12
24.0% -Increased 50
100% 7
14.0% 45
90.0% 41
82.0% 31
62.0% 37
74.0% 49
98.0% 14
28.0% 16
32.0% ** Statistically significant, Χ2 ≥ 3.82 (df=1, alpha=.05). Violent crime includes murder, rape, robbery and aggravated assault index crime rates. Property crime includes burglary, motor-vehicle theft and larceny index crime rates. Arson is excluded from both the property and total crime rates.
67
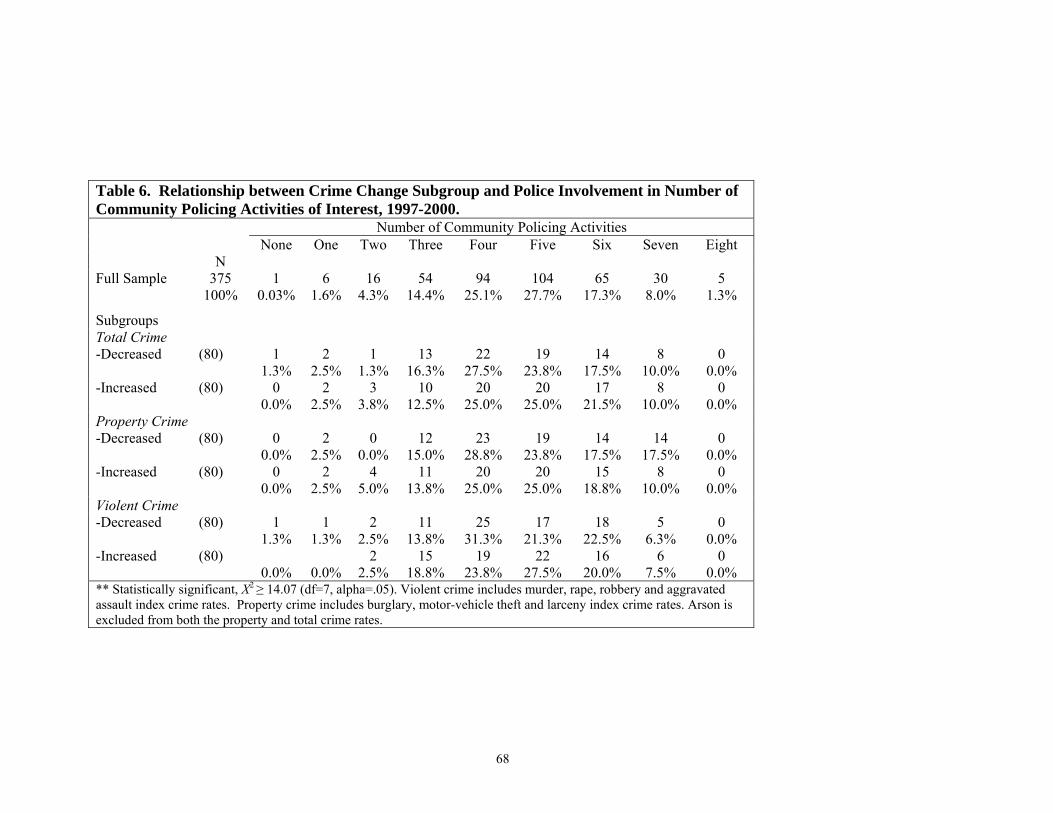
68
Table 6. Relationship between Crime Change Subgroup and Police Involvement in Number of Community Policing Activities of Interest, 1997-2000. Number of Community Policing Activities None One Two Three Four Five Six Seven Eight N Full Sample 375
100% 1
0.03% 6
1.6% 16
4.3% 54
14.4% 94
25.1% 104
27.7% 65
17.3% 30
8.0% 5
1.3%
Subgroups
Total Crime -Decreased (80) 1
1.3% 2
2.5% 1
1.3% 13
16.3% 22
27.5% 19
23.8% 14
17.5% 8
10.0% 0
0.0% -Increased (80) 0
0.0% 2
2.5% 3
3.8% 10
12.5% 20
25.0% 20
25.0% 17
21.5% 8
10.0% 0
0.0% Property Crime -Decreased (80) 0
0.0% 2
2.5% 0
0.0% 12
15.0% 23
28.8% 19
23.8% 14
17.5% 14
17.5% 0
0.0% -Increased (80) 0
0.0% 2
2.5% 4
5.0% 11
13.8% 20
25.0% 20
25.0% 15
18.8% 8
10.0% 0
0.0% Violent Crime -Decreased (80) 1
1.3% 1
1.3% 2
2.5% 11
13.8% 25
31.3% 17
21.3% 18
22.5% 5
6.3% 0
0.0% -Increased (80)
0.0%
0.0% 2
2.5% 15
18.8% 19
23.8% 22
27.5% 16
20.0% 6
7.5% 0
0.0% ** Statistically significant, Χ2 ≥ 14.07 (df=7, alpha=.05). Violent crime includes murder, rape, robbery and aggravated assault index crime rates. Property crime includes burglary, motor-vehicle theft and larceny index crime rates. Arson is excluded from both the property and total crime rates.
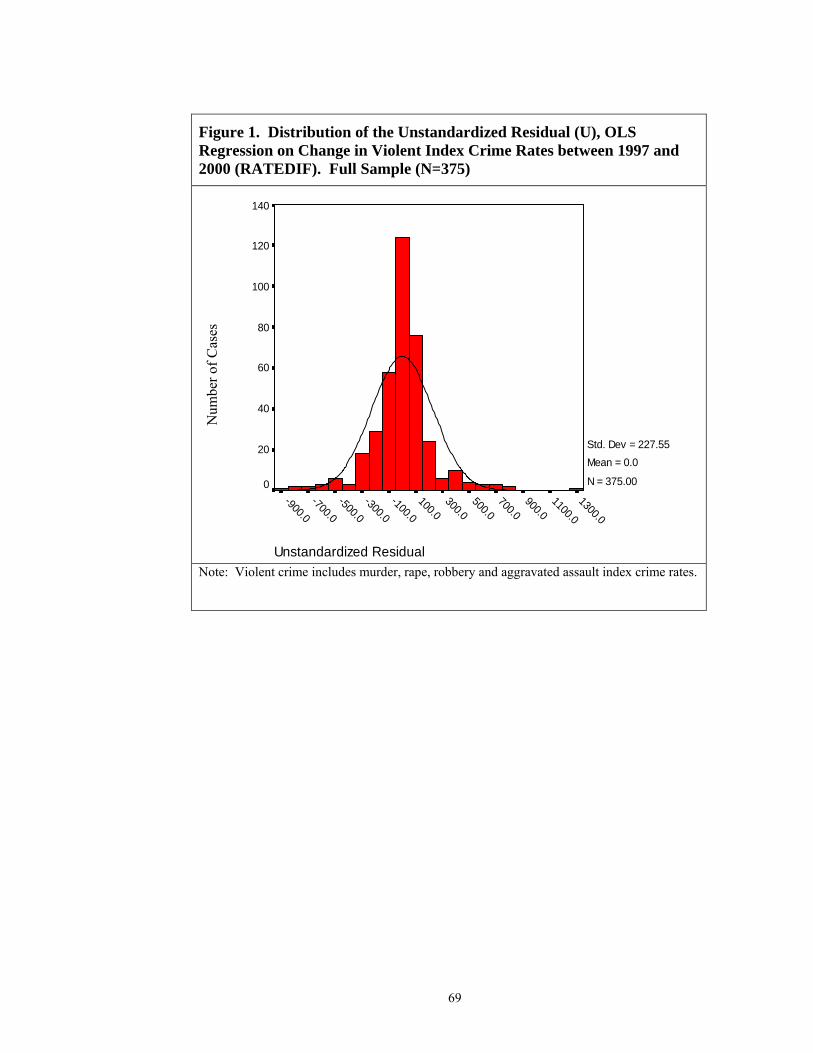
Figure 1. Distribution of the Unstandardized Residual (U), OLS Regression on Change in Violent Index Crime Rates between 1997 and 2000 (RATEDIF). Full Sample (N=375)
Num
ber o
f Cas
es
Unstandardized Residual
1300.0
1100.0
900.0700.0
500.0300.0
100.0-100.0
-300.0-500.0
-700.0-900.0
140
120
100
80
60
40
20
0
Std. Dev = 227.55 Mean = 0.0
N = 375.00
Note: Violent crime includes murder, rape, robbery and aggravated assault index crime rates.
69

Figure 2. Police Involvement in Number of Community of Interest, 1997-2000. Full Sample (N=375)
Number of Community Policing Activities
8.007.006.005.004.003.002.001.00.00
Num
ber o
f Cas
es120
100
80
60
40
20
0
Note: See Step II of the research methodology for a detailed description of the eight community policing activities.
70

APPENDIX B. REGIONAL CATEGORIES
Northeast Connecticut, Maine, Massachusetts, New Hampshire, New
Jersey, New York, Pennsylvania, Rhode Island, Vermont South Alabama, Arkansas, Delaware, District of Columbia, Florida,
Georgia, Kentucky, Louisiana, Maryland, Mississippi, North Carolina, Oklahoma, South Carolina, Tennessee, Texas, Virginia, West Virginia
Midwest Illinois, Indiana, Iowa, Kansas, Michigan, Minnesota, Missouri, Nebraska, North Dakota, Ohio, South Dakota, Wisconsin
West Alaska, Arizona, California, Colorado, Hawaii, Idaho, Montana, New Mexico, Nevada, Oregon, Utah, Washington, Wyoming
Note: Categories defined by the Federal Bureau of Investigation in support of the Uniform Crime Report program (Federal Bureau of Investigation, 1999).
71
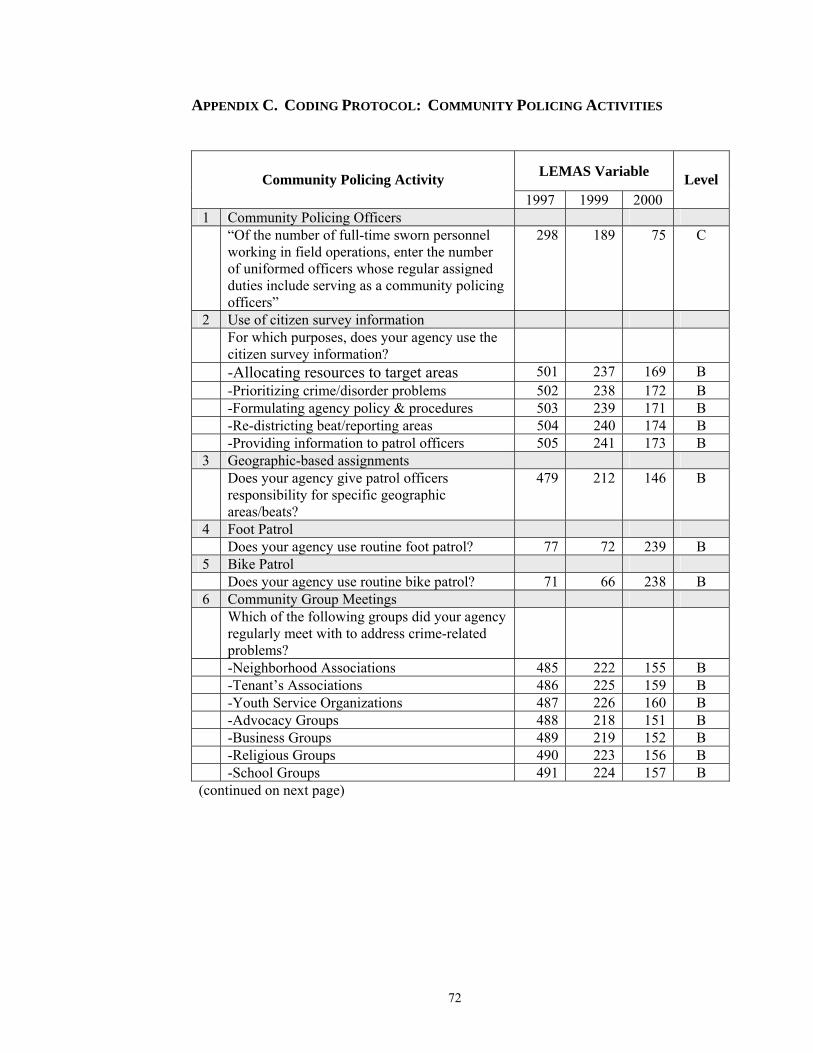
APPENDIX C. CODING PROTOCOL: COMMUNITY POLICING ACTIVITIES
LEMAS Variable Community Policing Activity 1997 1999 2000
Level
1 Community Policing Officers
“Of the number of full-time sworn personnel working in field operations, enter the number of uniformed officers whose regular assigned duties include serving as a community policing officers”
298 189 75 C
2 Use of citizen survey information
For which purposes, does your agency use the citizen survey information?
-Allocating resources to target areas 501 237 169 B -Prioritizing crime/disorder problems 502 238 172 B -Formulating agency policy & procedures 503 239 171 B -Re-districting beat/reporting areas 504 240 174 B -Providing information to patrol officers 505 241 173 B
3 Geographic-based assignments
Does your agency give patrol officers responsibility for specific geographic areas/beats?
479 212 146 B
4 Foot Patrol Does your agency use routine foot patrol? 77 72 239 B
5 Bike Patrol Does your agency use routine bike patrol? 71 66 238 B
6 Community Group Meetings
Which of the following groups did your agency regularly meet with to address crime-related problems?
-Neighborhood Associations 485 222 155 B -Tenant’s Associations 486 225 159 B -Youth Service Organizations 487 226 160 B -Advocacy Groups 488 218 151 B -Business Groups 489 219 152 B -Religious Groups 490 223 156 B -School Groups 491 224 157 B
(continued on next page)
72

Coding Protocol: Community Policing Activities (continued)
LEMAS Variable Community Policing Activity 1997 1999 2000
Level
7 Train Citizens in Community Policing
Did your agency train citizens in community policing (e.g. community mobilization, problem solving)?
468 211 1478 B
8 Problem Solving
Did your agency form problem-solving partnerships with community groups, municipal agencies, or others through specialized contracts or written agreements?
483 216 145 B
Notes: C=Continuous; B=Binary (yes/no). For the purpose of the current study, participation in community policing are recoded as a binary yes/no variable. While most LEMAS variables were already coded in this format, in some instances, survey question response options were continuous level or allowed respondents to check numerous responses under one general activity. In these instances, responses were collapsed or recoded to reflect one dichotomous measure of participation. For example, on the measure of Community Group Meetings, respondents were given the option to indicate the types of community groups they met with (e.g. school, business, tenant association, etc.). If the agency met with at least one community group, regardless of type, it was coded as ‘yes.’ Continuous level variables, such an agency’s reported number of community oriented policing, were recoded as well. If an agency responded to having at least one community policing officer, participation was coded as ‘yes’.
73

APPENDIX D. LAW ENFORCEMENT MANAGEMENT ADMINISTRATIVE
STATISTICS SURVEYS (1997, 1999, AND 2000).
74

75

76
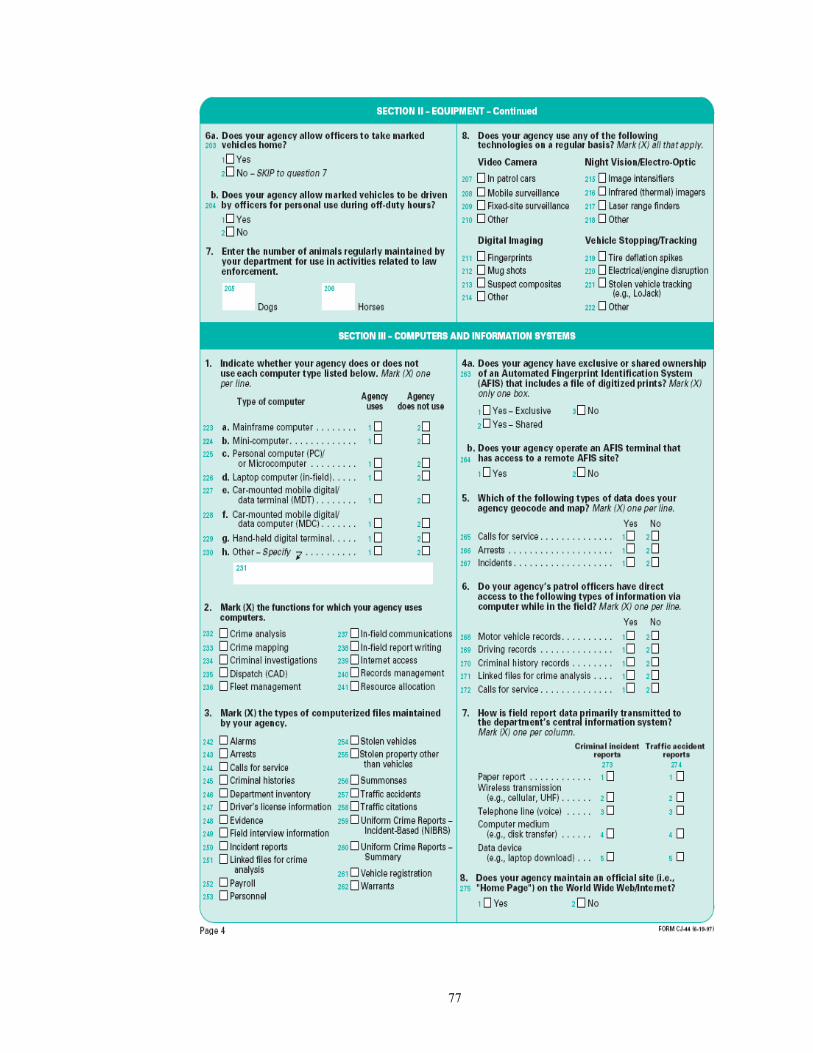
77

78

79

80

81

82

83

84

85

86

87
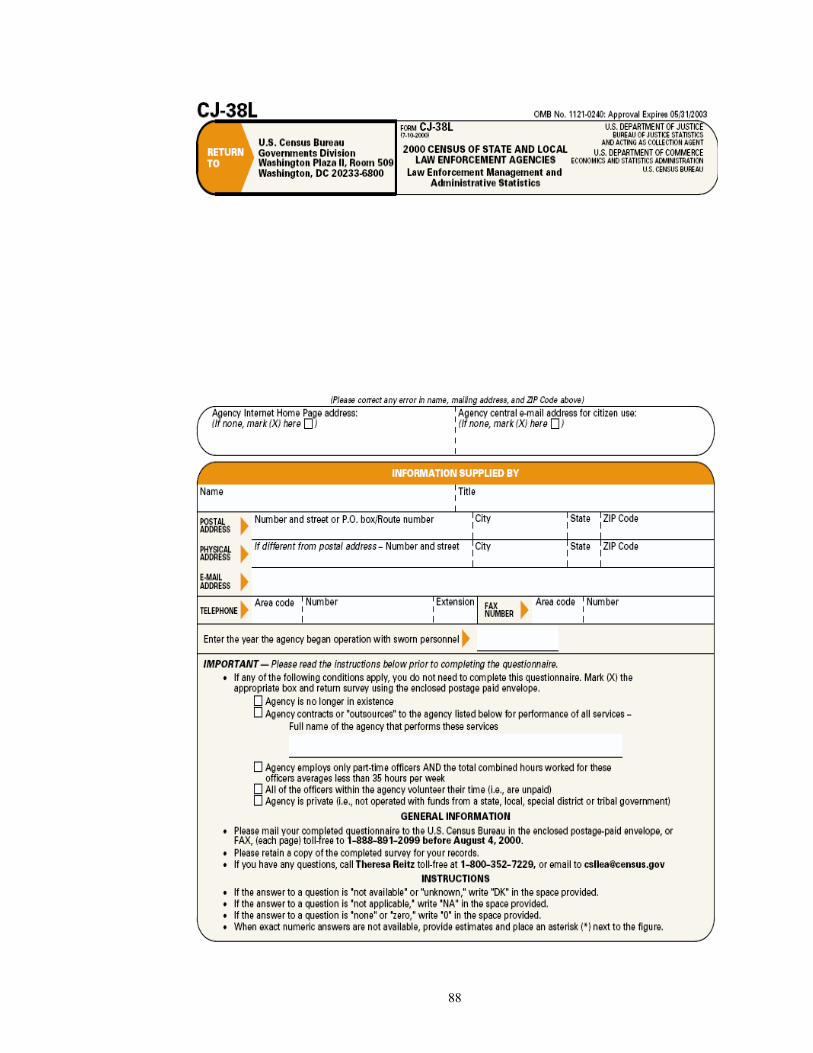
88

89

90

91

92

93

94

95

REFERENCES
Allison, John P. 1976 Economic factors and the rate of crime. Land Economics, 193-196. Alpert, Geoffrey P., Daniel Flynn, and Alex Piquero 2001 Effective Community Policing Performance Measures. Justice Research
and Policy 3(2): 79-94. Bayley, David H. 1988 Community policing: A report from the devil’s advocate. In Jack R.
Greene and Stephen Mastrofski (Eds.), Community policing: Rhetoric or reality, pp .225-237. New York: Praeger.
Beckman, Karen A., Jennifer Gibbs, Penny Beatty, and Megan Canigiani 2005 Trends in Police Research: A cross-sectional analysis of the 2002
literature. Police Practice and Research: An International Journal, 6(3), 295-320.
Blumstein, Alfred, and Joel Wallman (eds) 2000 The crime drop in America. Cambridge, UK: Cambridge University
Press. Bowers, William, and Jon H. Hirsch 1987 The impact of foot patrol staffing on crime and disorder in Boston: An
unmet promise. American Journal of Policing, 6(1), 17-44. Braga, Anthony A., David M. Kennedy, Elin J. Waring, and Ann M. Piehl. 2001 Problem-oriented policing, deterrence, and youth violence: An
evaluation of Boston’s Operation Ceasefire. Journal of Research in Crime and Delinquency, 38(3), 195-225.
Bratton, William J. 1998 Crime is down in New York City: Blame the police. In William J. Bratton
and Norman Dennis (Eds.) Zero tolerance: Policing a free society. London: Institute of Economic Affairs Health and Welfare Unit.
Bueger, Michael E. and Lorraine G. Mazerolle 1998 Third party policing: A theoretical analysis of an emerging trend. Justice
Quarterly, 15(2), 301-328. Bureau of Justice Statistics, U.S. Department of Justice 1999 Law Enforcement Management and Administrative Statistics (LEMAS):
1997 Sample Survey of Law Enforcement Agencies [Computer file]. ICPSR version. U.S. Dept. of Commerce, Bureau of the Census
96
[producer], 1998. Ann Arbor, MI: Inter-university Consortium for Political and Social Research [distributor].
2001 Law Enforcement Management and Administrative Statistics (LEMAS):
1999 Sample Survey of Law Enforcement Agencies [Computer file]. 2nd ICPSR version. U.S. Dept. of Commerce, Bureau of the Census [producer], 2000. Ann Arbor, MI: Inter-university Consortium for Political and Social Research [distributor].
2003 Law Enforcement Management and Administrative Statistics (LEMAS):
2000 Sample Survey of Law Enforcement Agencies [Computer file]. ICPSR version. Washington, DC: U.S. Dept. of Commerce, Bureau of the Census [producer], 2001. Ann Arbor, MI: Inter-university Consortium for Political and Social Research [distributor].
Cohen, Jacob 1988 Statistical power analysis for the behavioral sciences. Second edition.
Hisdale, NJ: Lawrence Erlbaum Associates. Committee to Review Research on Policy and Practices 2004 Fairness and effectiveness in policing: The evidence. Washington, DC:
National Academy Press. Correia, Mark E. 2000 The conceptual ambiguity of community in community policing. Filtering
the muddy waters. Policing: An International Journal of police strategies and Management, 23(2), 218-232.
Crank, John and Robert Langworthy 1996 Fragmented centralization and the organization of the police. Policing and
Society, 6, 213-229. Darlington, Richard B., and Tom V. Smulders 2001 Commentaries. Problems with residual analysis. Animal Behaviour 62,
599-602. Eck, John and William Spelman 1987 Who ya gonna call? The police as problem solvers. Crime and
Delinquency, 33(1), 31-52. Eck, John E., and Edward R. Maguire 2001 Have changes in policing reduced violent crime? An assessment of the
evidence. In Alfred Blumstein and Joel Wallman (Eds.), The crime drop in America, pp. 207-265. Cambridge, UK: Cambridge University Press.
97
Farrell, Graham 1988 Development of the community patrol officer program: Community
oriented policing in the New York City police department. In J. Green and S. Mastrofski (Eds.). Community policing: Rhetoric or reality, pp. 73-88. New York, NY: Praeger.
Federal Bureau of Investigation, U.S. Department of Justice, Office of Justice Programs 1999 Uniform Crime Reporting Program Data: [United States]: 1975-1997
[Offenses Known and Clearances by Arrest, 1997] [Computer file]. Compiled by the U.S. Dept. of Justice, Federal Bureau of Investigation. ICPSR ed. Ann Arbor, MI: Inter-university Consortium for Political and Social Research [producer and distributor].
2002 Uniform Crime Reporting Program Data: [United States]: Offenses known
and clearances by arrest, 2000 [Computer file]. Compiled by the U.S. Dept. of Justice, Federal Bureau of Investigation. ICPSR ed. Ann Arbor, MI: Inter-university Consortium for Political and Social Research [producer and distributor].
Goldstein, Herman 1979 Improving Policing: A problem-oriented approach. Crime and
Delinquency, 33(1), 6-30. 1987 Toward community-oriented policing: Potential, basic requirements, and
threshold questions. Crime and Delinquency 33(1), 6-30. Gottfredson, Michael and Travis Hirschi 1990 A general theory of crime. Palo Alto, CA: Stanford University Press. Government Accountability Office 2003 Memo to the Honorable F. James Sensenbrenner, Jr., Chairman,
Committee on the Judiciary, House of Representatives. From: Laurie E. Ekstrand, Director, Homeland Security and Justice Issues and Nancy Kingsbury, Managing Director, Applied Research and Methods Issues. Subject: “Technical Assessment of Zhao and Thurman’s 2001 Evaluation of the Effects of COPS Grants on Crime.” Dated June 13, 2003. Washington, DC: United States Government Accountability Office.
2005 Memo to the Honorable F. James Sensenbrenner, Jr., Chairman,
Committee on the Judiciary, House of Representatives. From: Laurie E. Ekstrand, Director, Homeland Security and Justice Issues and Nancy Kingsbury, Managing Director, Applied Research and Methods Issues Subject: “Interim Report on the Effects of COPS Funds on the Decline in Crime During the 1990s.” June 3, 2005. Washington, DC: United States Government Accountability Office.
98
Greene, Jack R. and Stephen D. Mastrofski (eds.) 1988 Community policing: Rhetoric or reality. Westport, CT: Praeger
Publishers. Hanushek, Erik A., and John E. Jackson 1977 Statistical methods for social scientists. San Diego, CA: Academic Press,
Inc. Hickman, Matthew J., and Brian A. Reaves. 2003 Local police departments, 2000. Washington, DC: U.S. Department of
Justice, Office of Justice Programs, Bureau of Justice Statistics. 2001 Community Policing in Local Police Departments, 1997 and 2000.
Special report. Washington, DC: Bureau of Justice Statistics, U.S. Department of Justice, Office of Justice Programs.
Kearley, Kent R., and Michael L. Benson 2000 Does community-oriented policing help build stronger communities?
Police Quarterly, 3(1), 46-69. Kelling, George L., Tony Pate, Duane Dieckman, and Charles E. Brown 1974 The Kansas City preventive patrol experiment. A summary report.
Washington, DC: The Police Foundation. Kelling, George L., and Catherine M. Coles 1996 Fixing broken windows. Restoring crime and disorder in our
communities. New York, NY: Free Press. Kelling, George, and Michael H. Moore 1988 Evolving strategy of policing. Perspectives on Policing, No. 4.
Washington, DC: National Institute of Justice, U.S. Department of Justice, Office of Justice Programs.
Kelling, George L. and William H. Sousa, Jr. 2001 Do police matter? An analysis of the impact of New York City’s police
reforms. New York, NY: Center for Civic Innovation at the Manhattan Institute.
Kennedy, David M., Anthony A. Braga, Anne Morrison Piehl, and Elin J. Waring 2001 Reducing gun violence: The Boston Gun Project’s Operation Ceasefire.
Washington, DC: National Institute of Justice.
99

King, William R. 2000 Measuring police innovation: Issues and measurement. Policing: An
International Journal of Police Strategies and Management, 43(3), 303-317.
King, William R., and Steven P. Lab 2000 Crime prevention, community policing, and training: Old wine in new
bottles. Police Practice and Research: An International Journal, 1(2), 241-252.
Langworthy, Robert H. 2002 LEMAS: A comparative organizational research platform. Justice
Research and Policy, 4(Fall), 21-38. La Free, Gary 1998 Losing legitimacy: Street crime and the decline of social institutions in
America. Boulder, CO: Westview Press. Levine, James P. 1975 The ineffectiveness of adding police to prevent crime. Public Policy
23(4), 523-544. Levitt, Stephen 1997 Using electoral cycles in police hiring to estimate the effect of police on
crime. American Economic Review, 87:270-90. 2004 Understanding why crime fell in the 1990’s: Four factors that explain
decline and six that do not. Journal of Economic Perspectives, 18(1): 163-190.
Lindgren, Sue A., and Marianne W. Zawitz 2001 Linking Uniform Crime Reporting Data to other datasets. Technical
report. Washington, DC: Bureau of Justice Statistics, U.S. Department of Justice, Office of Justice Programs.
Lurigio, Arthur J., and Wesley G. Skogan 1994 Winning the hearts and minds of police 0fficers: An assessment of staff
perceptions of community policing in Chicago. Crime and Delinquency, 40(3): 315-30.
MacDonald, John M. 2002 The effectiveness of community policing in reducing urban violence.
Crime and Delinquency, 48(4): 592-618.
100

Maguire, Edward R. 2002 Multi-wave establishment surveys on police organizations. Justice
Research and Policy, 4: 39-59. Maguire, Edward R., and Charles M. Katz 2002 Community policing, loose coupling and sensemaking in American police
agencies. Justice Quarterly, 19(3): 503-536. Maguire, Edward R., and Stephen Mastrofski 2000 Patterns of community policing in the United States. Police Quarterly,
3(1): 4-45. Maguire, Edward R., and Craig D. Uchida 2000 Measurement and explanation in comparative study of American police
organizations. Criminal Justice, 4: 491-557. Maguire, Edward R., Joseph B. Kuhns, Craig D. Uchida, and Stephen M. Cox 1997 Patterns of community policing in non-urban America. Crime and
Delinquency, 34(3):368-394. Maltz, Michael D. 1999 Bridging gaps in police crime data. A discussion paper from the BJS
Fellows Program. Washington, DC: Bureau of Justice Statistics, U.S. Department of Justice, Office of Justice Programs.
Marvell, Thomas B., and Carlise E. Moody 1996 Specification problems, police levels, and crime rates. Criminology,
34(4): 609-646. Mastrofski, Stephen D., Robert E. Worden, and Jeffrey B. Snipes 1995 Law enforcement in a time of community policing. Criminology, 33(4):
539-563. Mastrofski, Stephen D., and R. Richard Ritti 2000 Making sense of community policing: A theory-based analysis. Police
Practice and Research: An International Journal, 1(2), 183-210. Mazerolle, Lorraine G., Colleen Kadleck, and Jan Roehl 1988 Controlling drug and disorder problems: The role of place managers.
Criminology, 36(2), 371-403. Muhlhausen, David B. 2001 Do Community Oriented Policing Services Grants affect violent crime
rates? A report of the Heritage Center for Data Analysis. Washington, DC: The Heritage Foundation.
101

Nagin, Daniel S. 1998 Criminal deterrence research at the outset of the twenty-first century. In
Michael Tonry (ed.) Crime and Justice: A Review of Research, Vol. 23 (pp. 1-42). Chicago, IL: University of Chicago Press.
Office of Community Oriented Policing Services, U.S. Department of Justice 2005a Shared understanding of community policing. Published on the World
Wide Web (http://www.cops.usdoj.gov). Accessed August 24, 2005 2005b What is community policing? Published on the World Wide Web
(http://www.cops.usdoj.gov). Accessed August 24, 2005. 2005c The COPS mission: Who we are and What we do. Published on the
World Wide Web (http://www.cops.usdoj.gov/Default.asp?Item=35). Accessed August 24, 2005.
Pino, Nathan W. 2001 Community policing and social capital. Policing: An International
Journal of Police Strategies and Management 24(2), 200-215. Police Executive Research Forum 1981 Survey of police operational and administrative practices. Washington,
DC: Police Executive Research Forum. Reaves, Brian A., and Andrew L. Goldberg 1998 Census of state and local law enforcement agencies, 1996. Washington,
DC: Bureau of Justice Statistics, U.S. Department of Justice, Office of Justice Programs.
1999 Law Enforcement Management and Administrative Statistics, 1997. Data
for individual state and local agencies with 100 or more officers. Washington, DC: Bureau of Justice Statistics, U.S. Department of Justice.
2000 Local police departments, 1997. Washington, DC: Bureau of Justice
Statistics, U.S. Department of Justice, Office of Justice Programs. Reaves, Brian A., and Matthew J. Hickman 2002 Police departments in large cities, 1990-2000. Washington, DC: Bureau
of Justice Statistics, U.S. Department of Justice, Office of Justice Programs.
2004 Law enforcement and administrative statistics, 2000: Data for individual
state and local agencies with100 or more officers. Summary table IV. Washington, DC: Bureau of Justice Statistics, U.S. Department of Justice, Office of Justice Programs.
102

Roth, Jeffrey A., Joseph F. Ryan, Stephen J. Gaffigan, Christopher S. Koper, Mark H. Moore, Janice A. Roehl, Calvin C. Johnson, Gretchen E. Moore, Ruth M. White, Michael E. Buerger, Elizabeth A. Langston, and David Thacher 2000 National evaluation of the COPS Program – Title I of the 1994 Crime Act.
Washington, DC: U.S. Department of Justice, Office of Justice Programs, National Institute of Justice.
Sampson, Robert J., and W. Byron Groves 1989 Community structure and crime: Testing social-disorganization theory.
American Journal of Sociology, 94(4): 774-802. Sampson, Robert J., Steven W. Raudenbush, and Felton Earls 1997 Neighborhoods and violent crime: A multi-level study of collective
efficacy. Science, 277: 918-924, Sherman, Lawrence 1997 Police and crime. In Sherman, Lawrence W., Denise Gottfredson, Doris
MacKenzie, John Eck, Peter Reuter, and Shawn Bushway. Preventing crime: What works, what doesn’t, what’s promising. Washington, DC: National Institute of Justice, U.S. Department of Justice, Office of Justice Programs.
1998 Evidence-based policing. Ideas in American Policing (July). Washington,
DC: Police Foundation. Sherman, Lawrence W., Denise Gottfredson, Doris MacKenzie, John Eck, Peter Reuter, and Shawn Bushway 1997 Preventing crime: What works, what doesn’t, what’s promising.
Washington, DC: National Institute of Justice, U.S. Department of Justice, Office of Justice Programs.
Sherman, Lawrence W., and John E. Eck 2002 Policing for crime prevention. In Lawrence W. Sherman, David P.
Farrington, Brandon C. Welsh, and Doris Layton MacKenzie (eds). Evidence-Based Crime Prevention (pp. 295-329). London: Routledge
Sherman, Lawrence W., and Heather Strang 1996 Policing domestic violence: The problem-solving paradigm. College
Park, MD: Department of Criminology and Criminal Justice, University of Maryland.
Sherman, Lawrence W., and David Weisburd 1995 General deterrent effects of police patrol in crime ‘hot spots’: A
randomized, controlled trial. Justice Quarterly, 12(4): 625-648.
103
Skogan, Wesley, G., Susan M. Hartnett, Jill DuBois, Jennifer T. Comey, Marianne Kaiser, and Justine H. Lovig 2000 Problem solving in practice. Implementing community policing in
Chicago. Washington, DC: National Institute of Justice, U.S. Department of Justice, Office of Justice Programs.
Skogan, Wesley G., Lynn Steiner, Jill DuBois, J. Erik Gudell, and Aimee Fagan 2002 Taking Stock: Community policing in Chicago. Washington, DC:
National Institute of Justice, U.S. Department of Justice, Office of Justice Programs.
Skolnick, Jerome H., and David H. Bayley 1988 Theme and Variation in Community Policing. In Michael Tonry and
Morris (eds). Crime and Justice: A Review of Research, Vol. 10 (pp.1-37).
Tyler, Tom R. 2004 Enhancing Police Legitimacy. The Annals of the American Academy of
Political and Social Science, 593:84-99. Uchida, Craig D., C. Bridgeforth, and Charles F. Wellford 1986 Law Enforcement Statistics: The state of the art. American Journal of
Police, 23-43. U.S. Department of Labor 2000 Bureau of Labor Statistics. Labor force statistics from the Current
Population Survey. Weisburd, David and Anthony Braga (eds.) Forthcoming Police innovation: Contrasting perspectives. Cambridge, UK:
Cambridge University Press.
Weisburd, David L., and Loraine G. Mazzerolle 2000 Crime and disorder in drug hotspots: Implications for theory and practice
in policing. Police Quarterly, 3(3), 331-349. Weisburd, David L., and Jerome E. McElroy 1988 Enacting the CPO role: Findings from the New York City pilot program
in community policing. In J.R. Greene and S. D. Mastrofski (Eds.), Community Policing: Rhetoric or reality (pp. 89-101). New York: Praeger.
Weisburd, David, Cynthia Lum, and Anthony Petrosino 2001 Does research design affect study outcomes in criminal justice? Annals of
American Political and Social Science, 578, 50-70.
104

Wilson, James Q., and Barbara Boland 1978 The effect of police on crime. Law and Society Review, 12, 367-90. Wilson, James Q., and George L. Kelling 1982 Broken windows: The police and neighborhood safety. Atlantic Monthly,
249, 29-38. Wycoff, Mary Ann 1994 Community policing strategies. Washington, DC: Police Foundation. Wycoff, Mary Ann, and Wesley G. Skogan 1993 Community policing in Madison: Quality from the inside out. An
evaluation of impact. Research report. Washington, DC: U.S. National Institute of Justice, U.S. Department of Justice, Office of Justice Programs.
Zhao, Jihong, and Quint Thurman 2004 Funding community policing to reduce crime: Have COPS grants made a
difference? Washington, DC: Office of Community Oriented Policing Services, U.S. Department of Justice.
Zhao, Jihong S., Matthew C. Scheider, and Quint Thurman 2002 The effect of police presence on public fear reduction and satisfaction: A
review of the literature. The Justice Professional, 15(3), 273-299. Zhao, Jihong, and Nicholas P. Lovrich 2003 Community policing: Did it change the basic functions of policing in the
1990s? A national follow-up study. Justice Quarterly, 20(4), 697-724. Zhao, Jihong, Nicholas P. Lovrich, and Quint Thurman 1999 The status of community policing in American cities. Facilitators and
impediments revisited. Policing: An International Journal of Police Strategies and Management, 22(1), 74-92.
105