Embed Size (px)
Citation preview


Abstract –– Through this paper is shown the development and test of a system of classification for automated visual inspection (AVI) for solder joints in printed circuit boards using coupled filters and hypothesis tests. An array of LEDs is used to light solder junctions, and then images are taken in order extract those regions of interest (ROI). These regions are compared against coupled filters made of different reference images of solder joints wich are considered acceptable according to inspection criteria, and is obtained the mean and standard deviation of the maximum peak-to-correlation energy (PCE) of them. Other statistic data are obtained previously and only from the reference images once for serve as a reference for the classifier system. The classification is done by contrasting the statistical data of the sample against the reference in hypothesis tests, and then setting the sample as "pass"or "fail". Experiments have shown good results.
Keywords ––classifier system for AVI, solder joints,
hypothesis test
I. INTRODUCTION
The production processes are unable to produce industrial parts with perfect shapes. Visual inspection verifies the accuracy of a manufactured part according to specifications or criteria set.
In the case of solder joints on Printed Circuit Board
Assembly (PCBA), different parameters in them cause different forms of solder joints that are not identical, but may be rejected or not. The quality of a single solder joint often defines the grade of the whole product. Therefore, an inspection of the solder junction is required in order to guarantee an accurate quality. The development of the Surface Mount Technology (SMT) in order to accelerate the production of PCBA within the electronics manufacturing industry has been generating new needs for visual inspection. The task of finding defects in a PCBA visually becomes more difficult and less reliable by human inspectors due to interrelated factors causing the application of acceptance criteria based on quality control standards are not equal in each of them. These factors are the miniaturization of components and the density of them inside the card has increased, so the repeatability over time causes fatigue in the human inspector [1].
To overcome these difficulties, the Automatic Optical Inspection (AOI) equipment was created with lights and cameras to acquire images of the PCBA and use algorithms to find defects in repetitive inspection tasks with accuracy and reliability.
These AOI systems generally include the following blocks as shown in figure 1:
i) A bank of patterns for recognizing objects is generated.
ii) The acquisition of the image under test is performed.
iii) The characteristics that help identify, classify and locate the region of interest are extracted. The characteristics analyzed by the system depend on the characteristics of the object, the imaging system and algorithms that are used.
iv) The objects are classified according to quality standards. We analyze whether each of the objects identified meets the quality criteria established by the enterprise for a given end product.
Although AOI is used before and after the PCBA components are soldered, it is recommended use it after the soldering process since Krippner and Beer [2] show that 90% of faults are detected at that point. Common solder joint defects which are of concern include: no solder, opens, shorts, and bridges.
The acceptance criteria used for visual inspection in the
manufacturing of electronic assemblies are defined by the standard IPC-A-610 issued by Association Connecting Electronics Industries, formerly the Institute of Printed Circuits (IPC). The document is a compilation of images of components, connectors and solders joints of PCBA with the desired minimum acceptable conditions for each type of assembly manufacturing regardless of the method used. A brief description follows each image. This standard is intended to help quality inspectors to determine whether a component assembly is accepted or not.[3]
Classifier system of solder joints in printed circuit boards using coupled filters and hypothesis tests for automated visual inspection.
Eduardo Velázquez Mora1, Jorge Hernández Constante2
1,2 Departamento de Electrónica, Universidad de Guadalajara Campus CUCEI, Guadalajara, Jalisco, México. Phone (33) 13785900 Fax (33) 13785900 E-mail: [email protected]
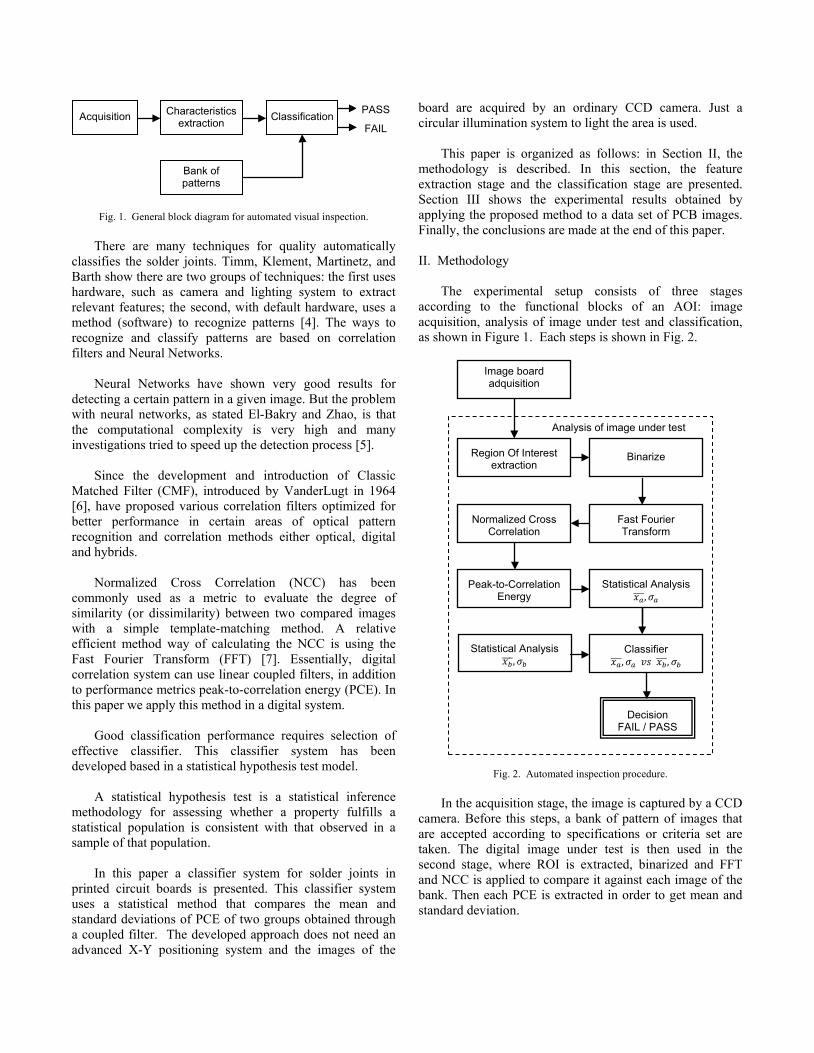
Fig. 1. General block diagram for automated visual inspection.
There are many techniques for quality automatically classifies the solder joints. Timm, Klement, Martinetz, and Barth show there are two groups of techniques: the first uses hardware, such as camera and lighting system to extract relevant features; the second, with default hardware, uses a method (software) to recognize patterns [4]. The ways to recognize and classify patterns are based on correlation filters and Neural Networks.
Neural Networks have shown very good results for detecting a certain pattern in a given image. But the problem with neural networks, as stated El-Bakry and Zhao, is that the computational complexity is very high and many investigations tried to speed up the detection process [5].
Since the development and introduction of Classic
Matched Filter (CMF), introduced by VanderLugt in 1964 [6], have proposed various correlation filters optimized for better performance in certain areas of optical pattern recognition and correlation methods either optical, digital and hybrids.
Normalized Cross Correlation (NCC) has been
commonly used as a metric to evaluate the degree of similarity (or dissimilarity) between two compared images with a simple template-matching method. A relative efficient method way of calculating the NCC is using the Fast Fourier Transform (FFT) [7]. Essentially, digital correlation system can use linear coupled filters, in addition to performance metrics peak-to-correlation energy (PCE). In this paper we apply this method in a digital system.
Good classification performance requires selection of effective classifier. This classifier system has been developed based in a statistical hypothesis test model. A statistical hypothesis test is a statistical inference methodology for assessing whether a property fulfills a statistical population is consistent with that observed in a sample of that population.
In this paper a classifier system for solder joints in printed circuit boards is presented. This classifier system uses a statistical method that compares the mean and standard deviations of PCE of two groups obtained through a coupled filter. The developed approach does not need an advanced X-Y positioning system and the images of the
board are acquired by an ordinary CCD camera. Just a circular illumination system to light the area is used. This paper is organized as follows: in Section II, the methodology is described. In this section, the feature extraction stage and the classification stage are presented. Section III shows the experimental results obtained by applying the proposed method to a data set of PCB images. Finally, the conclusions are made at the end of this paper. II. Methodology The experimental setup consists of three stages according to the functional blocks of an AOI: image acquisition, analysis of image under test and classification, as shown in Figure 1. Each steps is shown in Fig. 2.
Fig. 2. Automated inspection procedure. In the acquisition stage, the image is captured by a CCD camera. Before this steps, a bank of pattern of images that are accepted according to specifications or criteria set are taken. The digital image under test is then used in the second stage, where ROI is extracted, binarized and FFT and NCC is applied to compare it against each image of the bank. Then each PCE is extracted in order to get mean and standard deviation.
Image board adquisition
Region Of Interest extraction
Fast Fourier Transform
Normalized Cross Correlation
Peak-to-Correlation Energy
Statistical Analysis ߪ,തതതݔ
�
Classifier ߪ,തതതݔ ݏݒ ߪ,തതതݔ
Statistical Analysis ߪ,തതതݔ
�
Decision FAIL / PASS
Analysis of image under test
Binarize
Acquisition Characteristics extraction Classification
Bank of patterns
PASS
FAIL

The classification is carried out in the third stage. A comparison of statistical data for image under test and bank of patterns using hypothesis tests is performed in order to take a decision and classify it. Images used in bank of patterns are a collection of images of the solder joint that meet the requirements of acceptance criteria. The number of images may be as many as the types of images which can meet the minimum requirements to the type of images considered as excellent. However, it is recommended the most significant cases of this variety in order to have a solid bank. A. Image Acquisition The experiments used a CCD camera with 320 pixels u 240 pixels sensor and lens focal length of 38 mm. that acquires the image of the PCB under test in grayscale and by a personal computer that does the image processing and the final classification. Since the specularity of the solder joint surface causes difficulties in the automated extraction of relevant information, an appropriate feature extraction is required in order to achieve an accurate performance. Fig.3 shows a circular illumination system lighting a specular surface by which prevents ideal smooth shading that matches its shape for the effective classification of solder joints. B. Image under Test Analysis In this stage, a grayscale image was taken already. Then the ROI is obtained thru a cropping process using the coordinates that cover the subimage area of the solder joint under test. Following the method, a binary image, is obtained from ROI image in grayscale by non linear transformation. The binarized image has two pixels values: 0 or 255 following next expression [8]
(ݕ,ݔ) = ቄ1 (ݕ,ݔ) ݏ ݎݐ 0
� (1) where T is a threshold value and S(x,y) represent binarized image. Pixels with values below the threshold T are equal to 0 representing color black; otherwise, pixels over the threshold value are equal to 255 which corresponds to color white. The system used in this work is based on a nonlinear process, which makes correlations between the image under test and different reference images.
Fig. 3. Circular illumination system and CCD camera A nonlinear correlation filter denoted by NLF is expressed like [9]
NLF=|F(u,v) �|ke-jɔ(u,v) 0 < < 1 (2)
Where, |ݑ)ܨ, is the absolute value of the Fourier |(ݒtransform of the object to be recognized, = ξെ1, k is the nonlinearity strength factor with values from 0 to 1 and ij(u,v) is the phase of the Fourier transform. Changing k value to 1, a Classic Matched Filter (CMF) is obtained; to 0, a Phase Only Filter (POF); to -1, an Inverse Filter (IF) is obtained [10]. When nonlinearity strength k factor modifies the Fourier Transform of image under test and reference test, a non linear process is considered.
The NCC is a simple template-matching method that determines the location of a desired pattern represented by a template function, inside a two dimensional image function. The following formula for NCC, is [11]:
,ݑ) (ݒ = σ (௫,௬)ҧೠ,ೡ൧[௧(௫௨,௬௩)௧ҧ],
ටቄσ (௫,௬)ҧೠ,ೡ൧మ[௧(௫௨,௬௩)௧ҧ]మ, ቅ
(3)
were ݐҧ is the mean of the template and ҧ௨,௩ is the mean
of (ݕ,ݔ) in the region under the template.
The main advantage of the normalized cross correlation over the simple cross correlation is that it is less sensitive to linear changes in the amplitude of illumination in the two compared images [12]. The peak-to-correlation energy PCE performance metric is defined as [13]
White lamp
Inspection Area
Solder Joint
Surface Mount Device
CCD Camera
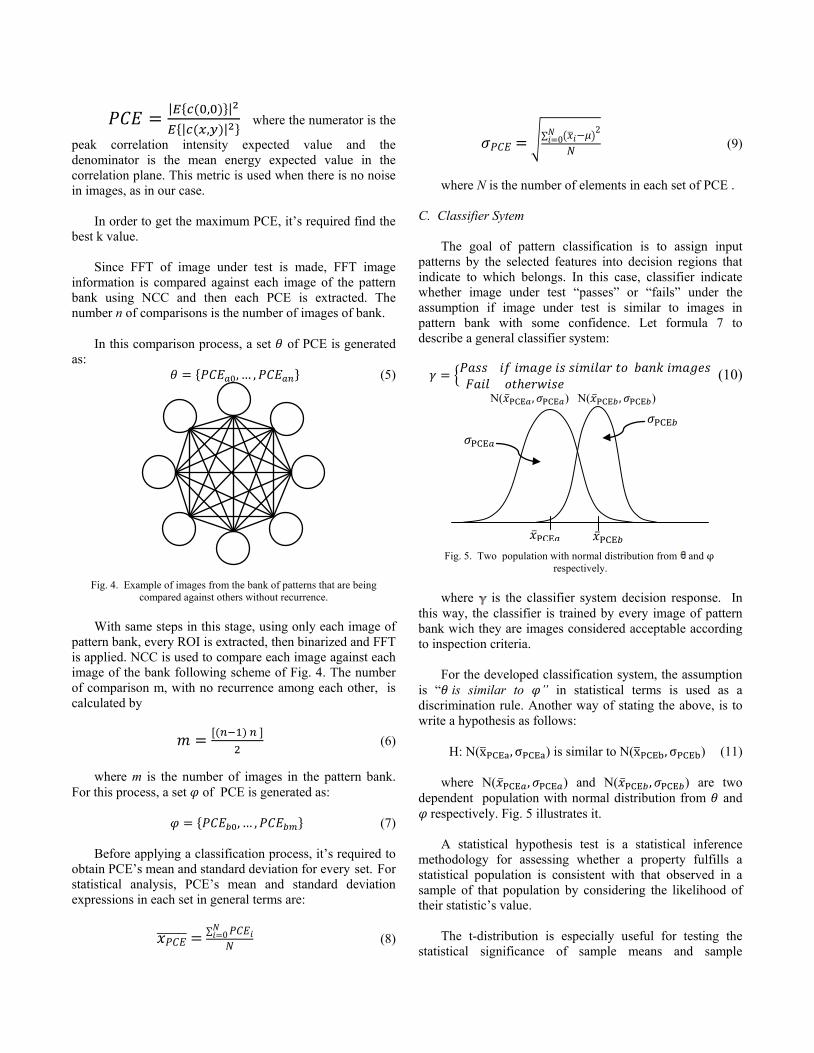
ܧܥ = |ா{(,)}|మா{|(௫,௬)|మ} where the numerator is the
peak correlation intensity expected value and the denominator is the mean energy expected value in the correlation plane. This metric is used when there is no noise in images, as in our case.
In order to get the maximum PCE, it’s required find the
best k value.
Since FFT of image under test is made, FFT image information is compared against each image of the pattern bank using NCC and then each PCE is extracted. The number n of comparisons is the number of images of bank. In this comparison process, a set ߠ of PCE is generated as:
ߠ = ,ܧܥ} … } (5)ܧܥ,
Fig. 4. Example of images from the bank of patterns that are being compared against others without recurrence.
With same steps in this stage, using only each image of pattern bank, every ROI is extracted, then binarized and FFT is applied. NCC is used to compare each image against each image of the bank following scheme of Fig. 4. The number of comparison m, with no recurrence among each other, is calculated by
= [(ଵ) ]ଶ (6)
where m is the number of images in the pattern bank. For this process, a set of PCE is generated as:
= ,ܧܥ} … } (7)ܧܥ, Before applying a classification process, it’s required to obtain PCE’s mean and standard deviation for every set. For statistical analysis, PCE’s mean and standard deviation expressions in each set in general terms are:
തതതതതതതܧܥݔ = σ 0=ܧܥ (8)
ܧܥߪ = ඨσ ൫ݔഥെߤ൯2=0 (9)
where N is the number of elements in each set of PCE . C. Classifier Sytem The goal of pattern classification is to assign input patterns by the selected features into decision regions that indicate to which belongs. In this case, classifier indicate whether image under test “passes” or “fails” under the assumption if image under test is similar to images in pattern bank with some confidence. Let formula 7 to describe a general classifier system: ߛ = ቄݏ ݐ ݎݏ ݏ ݏݏ
ݏݓݎݐ ܨ� (10)
Fig. 5. Two population with normal distribution from and ɔ respectively.
where is the classifier system decision response. In this way, the classifier is trained by every image of pattern bank wich they are images considered acceptable according to inspection criteria. For the developed classification system, the assumption is “ߠ is similar to ” in statistical terms is used as a discrimination rule. Another way of stating the above, is to write a hypothesis as follows:
H: N(xതେୟ,ɐେୟ) is similar to N(xതେୠ,ɐେୠ) (11) where N(ݔҧେ,ߪେ) and N(ݔҧେ,ߪେ) are two dependent population with normal distribution from ߠ and respectively. Fig. 5 illustrates it. A statistical hypothesis test is a statistical inference methodology for assessing whether a property fulfills a statistical population is consistent with that observed in a sample of that population by considering the likelihood of their statistic’s value. The t-distribution is especially useful for testing the statistical significance of sample means and sample
N(ݔҧେ ҧେݔ)େ) Nߪ, (େߪ,
ҧେݔ ҧେݔ
େߪ େߪ
variances. Perhaps the most widely-used application of the t-distribution is to test whether or not two samples come from a distribution with the same mean. [14]. According to Gutierrez and De la Vara, the test statistic for the hypothesis of equality of means for two populations is given by [15]:
ݐ = തത
ඨೞమା
ೞమ
(12)
where ത , ݏ௫ଶ and ௫ are mean, variance and number of elements of a population; while ത, ݏ௬ଶ and ௬ are same statistical from the other population. But, in the classifier system, in terms of (11) is
0ݐ = ഥPCEݔഥPCEെݔ
ඨ2ܧܥߪ 2ܧܥߪ+
(13)
In this way with the assumption “ߠ is similar to ” as a null hypothesis H0 and alternative hypotesis HA are
H0: ݔഥPCE = ഥPCE (14)ݔ HA: ݔഥPCE ഥPCE (15)ݔ
leads the following classifier system decision expression:
ߛ = ቄݔ ݏݏഥPCE = ഥPCEݔ ݏݓݎݐ ܨ
� (16) In terms of t0, using a confidence level ߙ and n+m-2 degrees of freedom (16) can be rewritten as:
ߛ = ቊݐ| ݏݏ| ᇲݐ మ
ݏݓݎݐ ܨ� (16)
since H0 can be rejected if |ݐ| > ᇲݐ
మ [14].
III. RESULTS AND DISCUSSION
An experiment was designed to evaluate the performance of the coupled filter and the classifier system in order to be used in automatic visual inspection of solder joints in PCBA and determine whether they accepted or defective. The case is analyzed to determine defective solder joints PTH (Pin Hole Trough). The original images are a bidimensional function in the form f(x,y), different to zero and finite with a size of 320 pixels u 240 pixels. they correspond to solder joints of a multiple terminal connector in line.
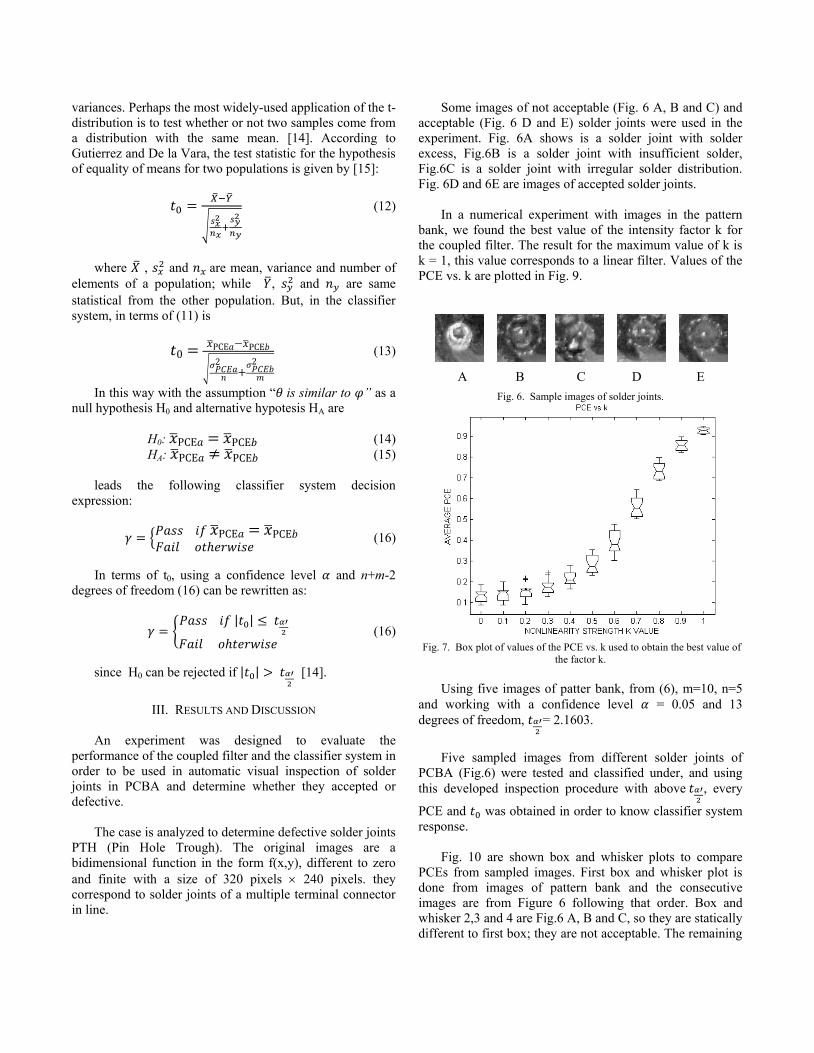
Some images of not acceptable (Fig. 6 A, B and C) and acceptable (Fig. 6 D and E) solder joints were used in the experiment. Fig. 6A shows is a solder joint with solder excess, Fig.6B is a solder joint with insufficient solder, Fig.6C is a solder joint with irregular solder distribution. Fig. 6D and 6E are images of accepted solder joints. In a numerical experiment with images in the pattern bank, we found the best value of the intensity factor k for the coupled filter. The result for the maximum value of k is k = 1, this value corresponds to a linear filter. Values of the PCE vs. k are plotted in Fig. 9.
A B C D E
Fig. 6. Sample images of solder joints.
Fig. 7. Box plot of values of the PCE vs. k used to obtain the best value of the factor k.
Using five images of patter bank, from (6), m=10, n=5 and working with a confidence level 0.05 = ߙ and 13 degrees of freedom, ݐᇲ
మ= 2.1603.
Five sampled images from different solder joints of PCBA (Fig.6) were tested and classified under, and using this developed inspection procedure with above ݐᇲ
మ, every
PCE and ݐ was obtained in order to know classifier system response. Fig. 10 are shown box and whisker plots to compare PCEs from sampled images. First box and whisker plot is done from images of pattern bank and the consecutive images are from Figure 6 following that order. Box and whisker 2,3 and 4 are Fig.6 A, B and C, so they are statically different to first box; they are not acceptable. The remaining
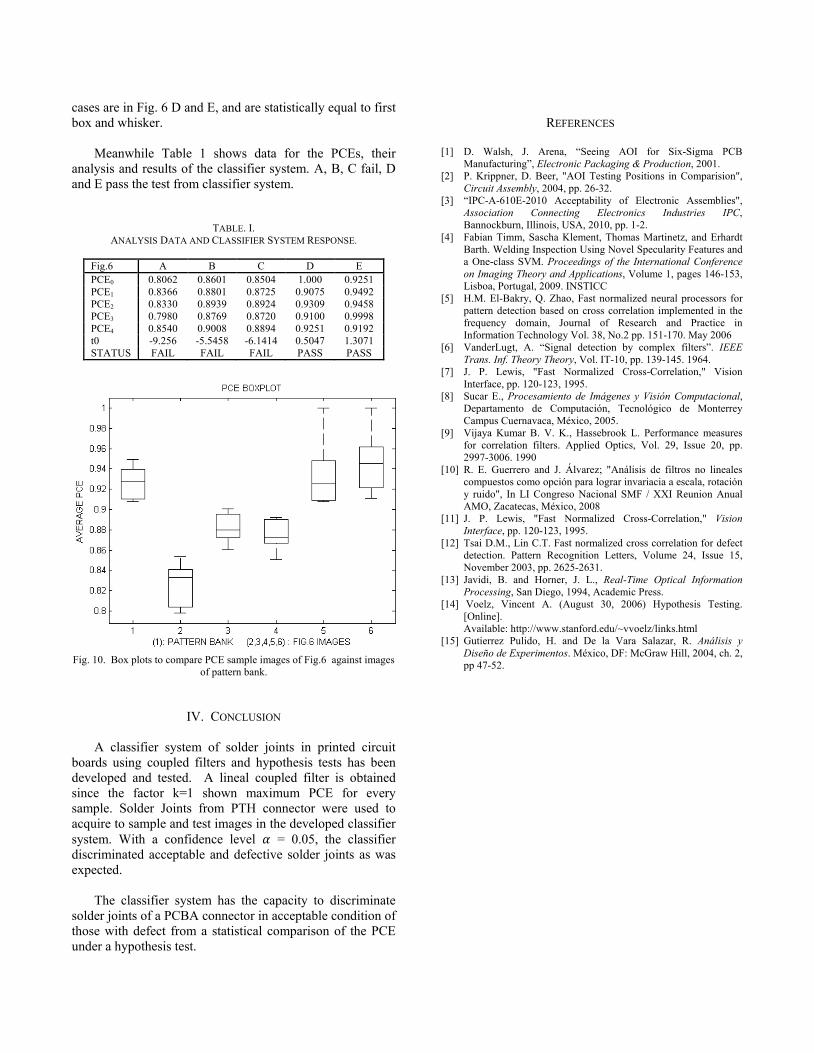
cases are in Fig. 6 D and E, and are statistically equal to first box and whisker. Meanwhile Table 1 shows data for the PCEs, their analysis and results of the classifier system. A, B, C fail, D and E pass the test from classifier system.
TABLE. I. ANALYSIS DATA AND CLASSIFIER SYSTEM RESPONSE.
Fig.6 A B C D E PCE0 0.8062 0.8601 0.8504 1.000 0.9251 PCE1 0.8366 0.8801 0.8725 0.9075 0.9492 PCE2 0.8330 0.8939 0.8924 0.9309 0.9458 PCE3 0.7980 0.8769 0.8720 0.9100 0.9998 PCE4 0.8540 0.9008 0.8894 0.9251 0.9192 t0 -9.256 -5.5458 -6.1414 0.5047 1.3071 STATUS FAIL FAIL FAIL PASS PASS
Fig. 10. Box plots to compare PCE sample images of Fig.6 against images of pattern bank.
IV. CONCLUSION A classifier system of solder joints in printed circuit boards using coupled filters and hypothesis tests has been developed and tested. A lineal coupled filter is obtained since the factor k=1 shown maximum PCE for every sample. Solder Joints from PTH connector were used to acquire to sample and test images in the developed classifier system. With a confidence level 0.05 = ߙ, the classifier discriminated acceptable and defective solder joints as was expected. The classifier system has the capacity to discriminate solder joints of a PCBA connector in acceptable condition of those with defect from a statistical comparison of the PCE under a hypothesis test.
REFERENCES
[1] D. Walsh, J. Arena, “Seeing AOI for Six-Sigma PCB
Manufacturing”, Electronic Packaging & Production, 2001. [2] P. Krippner, D. Beer, "AOI Testing Positions in Comparision",
Circuit Assembly, 2004, pp. 26-32. [3] “IPC-A-610E-2010 Acceptability of Electronic Assemblies",
Association Connecting Electronics Industries IPC, Bannockburn, Illinois, USA, 2010, pp. 1-2.
[4] Fabian Timm, Sascha Klement, Thomas Martinetz, and Erhardt Barth. Welding Inspection Using Novel Specularity Features and a One-class SVM. Proceedings of the International Conference on Imaging Theory and Applications, Volume 1, pages 146-153, Lisboa, Portugal, 2009. INSTICC
[5] H.M. El-Bakry, Q. Zhao, Fast normalized neural processors for pattern detection based on cross correlation implemented in the frequency domain, Journal of Research and Practice in Information Technology Vol. 38, No.2 pp. 151-170. May 2006
[6] VanderLugt, A. “Signal detection by complex filters”. IEEE Trans. Inf. Theory Theory, Vol. IT-10, pp. 139-145. 1964.
[7] J. P. Lewis, "Fast Normalized Cross-Correlation," Vision Interface, pp. 120-123, 1995.
[8] Sucar E., Procesamiento de Imágenes y Visión Computacional, Departamento de Computación, Tecnológico de Monterrey Campus Cuernavaca, México, 2005.
[9] Vijaya Kumar B. V. K., Hassebrook L. Performance measures for correlation filters. Applied Optics, Vol. 29, Issue 20, pp. 2997-3006. 1990
[10] R. E. Guerrero and J. Álvarez; "Análisis de filtros no lineales compuestos como opción para lograr invariacia a escala, rotación y ruido", In LI Congreso Nacional SMF / XXI Reunion Anual AMO, Zacatecas, México, 2008
[11] J. P. Lewis, "Fast Normalized Cross-Correlation," Vision Interface, pp. 120-123, 1995.
[12] Tsai D.M., Lin C.T. Fast normalized cross correlation for defect detection. Pattern Recognition Letters, Volume 24, Issue 15, November 2003, pp. 2625-2631.
[13] Javidi, B. and Horner, J. L., Real-Time Optical Information Processing, San Diego, 1994, Academic Press.
[14] Voelz, Vincent A. (August 30, 2006) Hypothesis Testing. [Online].
Available: http://www.stanford.edu/~vvoelz/links.html [15] Gutierrez Pulido, H. and De la Vara Salazar, R. Análisis y
Diseño de Experimentos. México, DF: McGraw Hill, 2004, ch. 2, pp 47-52.

Abstract This paper describes the development of a computer system focused on call center, which allows selection and assignment of information through the identification of user profiles. All this based on data mining techniques, artificial intelligence algorithms, database and software engineering. Additionally, the system is complemented by VoIP technology, making an impact on improving productivity and business costs. Resumen El presente artículo describe el desarrollo de un sistema de cómputo enfocado al call center, que permite la selección y asignación de información a través de la identificación de perfiles de usuario, basado en técnicas de minería de datos, algoritmos de inteligencia artificial, base de datos e ingeniería de software. Adicionalmente, el sistema se complementa con el uso de la tecnología VoIP, logrando un impacto en la mejora de la productividad y costos de la empresa. Keywords: Data mining, artificial intelligence, VoIP. Palabras claves: Minería de datos, inteligencia artificial, VoIP. 1 Introduction Systems developed for a call center are a good target to data mining, which consists in non-trivial extraction of information that resides implicitly in the data. This information is unknown previously and may be useful for some process. In other words, data mining prepares, drilling and explores the data to draw the information hidden in them. It is strongly linked to monitoring industrial processes because it is very useful for exploiting the data stored in databases. Data mining is based on artificial intelligence and statistical analysis. Through models extracted using data mining techniques, they deal with solution to problems of prediction, classification and segmentation. Some of data mining techniques are predictor models for classification or prediction values, data base segmentation, and clustering hierarchical or non-hierarchical. The characteristics of a call center impose implementing communication using voice over an internet protocol ad hoc, which should be a resource group that enable voice signal to travel over Internet using IP (Internet Protocol).
This represents that the voice signal is sent in digital form via packets rather than sending it (in digital or analog form) through circuits, which are usable only for telephony as a telephone company conventional PSTN (Public Switched Telephone Network). Actually, there is a complex environment that call centers face to recover and analyze information. In this context is designed and implemented the Call Center Data Mining System (Xtend). This paper presents in section 2 the methodology used in the system, section 3 presents some results obtained from the implementation and proofs of the system, section 4 presents conclusions, finally section 5 presents the references. 2 Methodology Data mining The data mining process is to apply to a particular data base the required operations of data selection, exploration, sampling, processing and modeling methods to extract patterns and then evaluated all them to identify a set of this patterns that will represent knowledge. The data mining process used in Xtend to identify user profiles consists of the following phases:
1. Selection of objectives: In this phase the problem must be study and decide what objectives of the project are. It is also desirable to formulate success or failure expectations of the project since these concepts are relative.
2. Data Preparation: This stage requires more effort. This stage consists of 3 steps: • Data Selection: Select the subset of data needed, which can be tables in a database or text files; to do this the user system (agent) can choose between the tables: General information, employment information, credit status, and product data. You can also use variants of weekly or monthly searches. • Pre-process of data: This stage identifies the sense of attributes and integration errors are detected. • Transformation of data: Since each algorithm requires a different format in the input data at this stage we must transform data so that fit to input format of ID3 algorithm selected. To do this, Xtend generates a text file with information resulting from the selection of agent. [2] [3] ID3 algorithm The ID3 algorithm is used in artificial intelligence
Call Center Data Mining System (Xtend) Jorge Cortes Galicia, Euler Hernández Contreras, Misael Noé Paz García
Escuela Superior de Cómputo I.P.N. Av. Juan de Dios Bátiz s/n, tel: 57296000 ext. 52039, México D.F.
e-mail: [email protected], [email protected] Contact: Jorge Cortés Galicia ([email protected])
field. Its use is oriented to search of hypotheses or rules within it given a set of examples. This is the algorithm that the system uses to make correct classification of customers, which uses theory of information. The set of examples should consist of series of values tuples, each one called attributes. One of these attributes (the attribute to classify) is the objective, which is binary (positive or negative, valid or invalid, etc.). In this way, the algorithm tries to obtain hypotheses to classify new instances, if the example will be positive or negative. ID3 performs this task by building a decision tree. The elements of this decision tree are:
x Node: contain attributes. x Arc: contain possible values of parent
node. x Leaf: Nodes that classify the example such
as positive or negative. Steps taken by the algorithm are following: Select root node: It uses a statistical property called gain of information, which is responsible for measure how well a given attribute separates training examples according to its target classification. ID3 uses this gain of information to select from attributes candidates who is the separate attribute. It is made at each step as the tree is generated. In general, we define the gain of information in equation 1:
Gain(S, A) = Entropy(S) - �vevalues(A)------ Entropy(Sv)
(1)
In equation 1 is necessary defining another concept to calculate the gain of information, which is entropy. Entropy: It is responsible for measure of homogeneity of the samples, or in other words, it measures the impurity of an arbitrary collection of examples. Given an S collection, which contains both negative as positive examples of some objective concept, the entropy S in relation to this boolean classification is defined in equation 2:
Entropy(S) = -p+log2p+ - p-log2p- (2)
Where p+ is the proportion of positive examples in S and p- is the proportion of negative examples in S. In all cases are defined 0log0 = 0. Placing descendants of root node (Possible values of the previous node) The training examples are sorted by descending node appropriate (i.e., down to the branch for the value of example for this attribute). Repeat the process using the training examples associated with each node in order descendant with the objective of
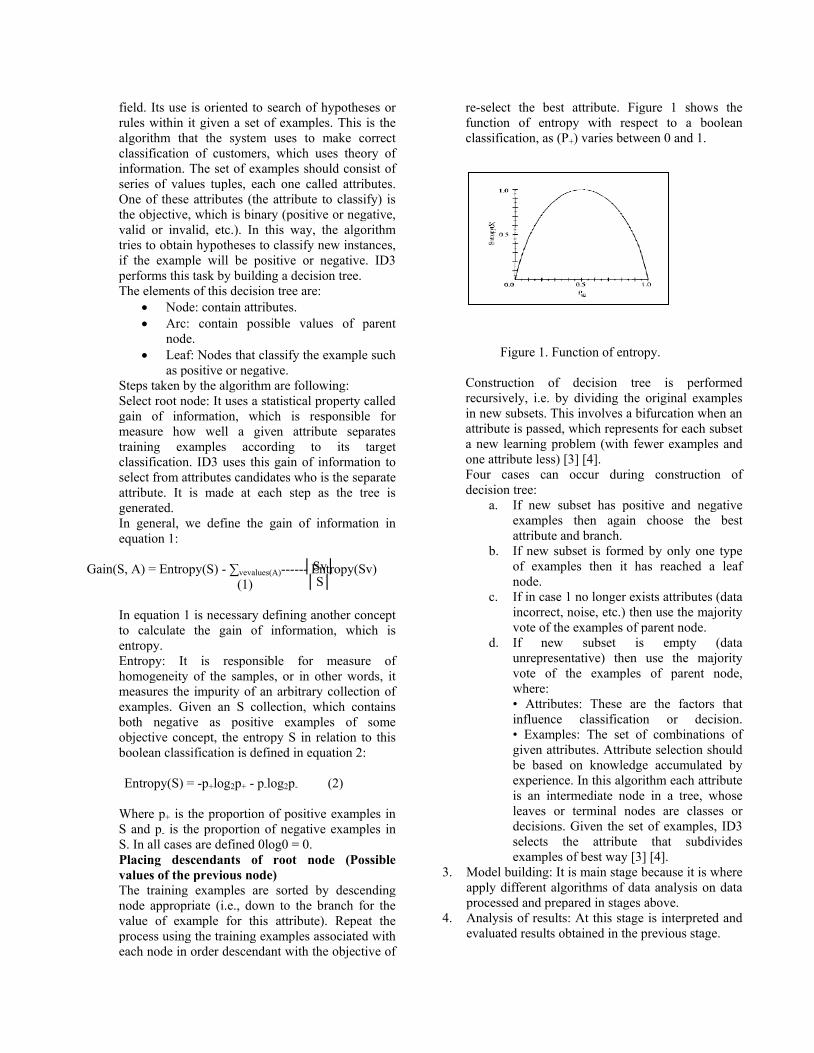
re-select the best attribute. Figure 1 shows the function of entropy with respect to a boolean classification, as (P+) varies between 0 and 1.
Figure 1. Function of entropy.
Construction of decision tree is performed recursively, i.e. by dividing the original examples in new subsets. This involves a bifurcation when an attribute is passed, which represents for each subset a new learning problem (with fewer examples and one attribute less) [3] [4]. Four cases can occur during construction of decision tree:
a. If new subset has positive and negative examples then again choose the best attribute and branch.
b. If new subset is formed by only one type of examples then it has reached a leaf node.
c. If in case 1 no longer exists attributes (data incorrect, noise, etc.) then use the majority vote of the examples of parent node.
d. If new subset is empty (data unrepresentative) then use the majority vote of the examples of parent node, where: • Attributes: These are the factors that influence classification or decision. • Examples: The set of combinations of given attributes. Attribute selection should be based on knowledge accumulated by experience. In this algorithm each attribute is an intermediate node in a tree, whose leaves or terminal nodes are classes or decisions. Given the set of examples, ID3 selects the attribute that subdivides examples of best way [3] [4].
3. Model building: It is main stage because it is where apply different algorithms of data analysis on data processed and prepared in stages above.
4. Analysis of results: At this stage is interpreted and evaluated results obtained in the previous stage.
Ň6YŇ Ň6Ň
Voice communication Implementation of voice communication in Xtend is using VoIP technology; it is carried out by implementing Asterisk. It is software that uses concept of free software license (GPL). Asterisk provides a service telephone exchange (Private Branch Exchange: PBX), interoperating with IP terminals or softphones. It acts as a register and gateway between both communication sides. This allows real-time connectivity between PSTN (Public Switched Telephone Network) and VoIP networks. Asterisk is integrated by modules following:
x Asterisk: base files of project. x DAHDI: Support to hardware. Card drivers.
(Formerly Zaptel). x Add-ons: Add-ons and additions to Asterisk
package. Optional. x Libpri: Support to connections digital. Optional. x Sounds: Provides sounds and phrases in different
languages. (Included in Asterisk package). Asterisk has ability to recognize many VoIP protocols such as SIP, H.323, IAX and MGCP. Also performs coding with different codecs [1] [5]. 3 Result Results of Xtend implementation were the creation of different decision trees for each of users of the system, thus achieving proper filtering of information in 90% of the requests made at Xtend. Also, It was possible to make phone calls through VoIP server, without having execution problems for 100% of tests made. 4 Conclusion Today there are many algorithms and data mining techniques, which can help solve many problems in different areas such as medicine, marketing, Finance, Security, among others. VoIP technology is left behind the switched telephony, which represents great cost-benefit due features that are offered. Xtend uses benefits of both data mining as VoIP, managing information from the database in a better organized way, determining through profiles users who receive such information. Also, Xtend is achieving greater control of users and cost-benefit within a call center. 5 References [1] Jim Van Meggelen, Jared Smith, Asterisk: the Future of Telephony, 2004. [2] Ian H. Written, Data Mining, Pratical Machine Learning
Tools And Techniques, Elsevier, USA, 2006. [3] Daniel T.Larose, Data Mining Methods and Models, Wiley, 2006. [4] Meggelen, and Jared Smith, Data Mining, Soluciones
con Enterprise Miner, Alfaomega, 2006. [5] Flavio E. Gonalves , Manual Asterisk, Tercera Edición, 2006.
Abstract In this paper we will be describe the design of a recursive stochastic filter by a proposed stochastic estimation algorithm in function of the output signal using the mathematical operators mean, variance and covariance. We compare the original and the estimated output signals in order to determinate the accuracy and the error of the filter. The design of the recursive stochastic filter is given by three principal processes, the simplify model of the black box, the innovative stochastic estimator and the recursive stochastic estimator, these processes are given in three principal theorems. Keywords: Stochastic processes, identification, recursive stochastic filter A Stochastic Estimator for a Black Box System Abstract In this paper we will be describe the design of a recursive stochastic filter by a proposed stochastic estimation algorithm in function of the output signal using the mathematical operators mean, variance and covariance. We compare the original and the estimated output signals in order to determinate the accuracy and the error of the filter. The design of the recursive stochastic filter is given by three principal processes, the simplify model of the black box, the innovative stochastic estimator and the recursive stochastic estimator, these processes are given in three principal theorems. Keywords: Stochastic processes, identification, recursive stochastic filter 1 Introduction Recursive state estimation problems for a black box systems with unknown inputs, can be formulated as a single problem usually referred to as descriptor Kalman filtering. Solutions to this problem have been proposed in the literature; however, these solutions either neglect possible contributions of future dynamics to the current estimate or make unnecessary assumptions on the structure of the system [1].
While there are many application-specific approaches to “computing” (estimating) an unknown state from a set of process measurements, many of these methods do not inherently take into consideration the typically noisy nature of the measurements. The model is represented by equation (1). Where is the filter’s function, is the measurement error.
The equation describing the model contains adjustable parameters that are unknown a priori and not possible to get them by fundamental principles, because it has stochastic properties. The parameter estimation algorithm is involved in the formulation and validation of a mathematical model that describes the process of interest [1, 2, 3]. The problem is to determine a stochastic estimator for a black box system with bounded inputs and outputs in the form given in equation (1). 1.1 The black box model simplified In this section we formalize the black box model in the Theorem 1. Theorem 1. Let be the model of black box system with
stochastic input and output and , respectively
with domains in . There is a stochastic
process of the simplified black box model given by (2).
Where is the stochastic parameter and is the process
noise.
A Stochastic Estimator for a Black Box System José de Jesús Medel-Juárez1, Romeo Urbieta-Parrazales1, Rosaura Palma-Orozco2
Instituto Politécnico Nacional ESCOM Mexico City 1 Centro de Investigación en Computación, 2 Escuela Superior de Cómputo
Av. Juan de Dios Bátiz s/n casi esq. Miguel Othón de Mendizábal. Unidad Profesional Adolfo López Mateos Col. Nueva Industrial Vallejo Delegación Gustavo A. Madero C. P. 07738, México
D. F. Tel.: 5729 6000 Ext. 56570 Fax 52003 email: [email protected]
Proof. The system is represented by the equations (3) and
(4).
Where (3) is the equation of the state transition, xk is the
state vector, is the noisy
signal, yk is the output observed,
is the noisy signal added to the output, a, c are the
parameters of the system and b, d are the parameters of the
noisy signal and the measurement [7, 8, 9]. Considering that
(3) is delayed in the time.
Replacing (5) in (4).
Using (4) we get (7).
Replacing (7) in (6).
QED
1.2 Innovative stochastic estimator In the Theorem 2 we give the recursive algorithm in order to get the innovative stochastic estimator.
Theorem 2. There is a stochastic recursive estimator for a black box system in the form of (2) given by (10).
Proof. The normalization of signals, both input and output of the black box is required for the attainment of the proper use of space filtering. The second moment of probability of (9) respect to , is given by (11).
Replacing of (8) in (11):
Considering, , because there is no correlation between the noisy signal and the past state in the system as in (8). The system (11), has the form (13) and we get the unknown parameter (14).
Delaying (14) in the time:
Considering the ergodicity of (14), with respect to Pk:
Considering the ergodicity of (14) with respect to Qk:
From (19) and (20):
Finally, the stochastic parameter is given by (22), replacing (18) and (21) in (14).
QED
1.3 Covariant stochastic recursive filter In this section we define the covariant stochastic recursive filter by the Theorem 3 and 4. Theorem 3. Let be the model of black box system with
stochastic input xk+1 and stochastic output that have the invariance properties in their second moments. Then, there is a covariant stochastic recursive filter defined by (23).
Proof. From (14):
Replacing (25) in (18):
Repalcing (26) in (24):
Finally,
Replacing (28) in (9) we get the identifier filter (23).
QED
And the convergence assessment by the error filter is given by (29). Theorem 4. Sea el error de identificación $e_k = \widetilde{y}_k - \widehat{\widetilde{y}}_k$. Entonces, el funcional del error $J_k$ está dado de manera recursiva por (29).
Proof.
QED
2 Results
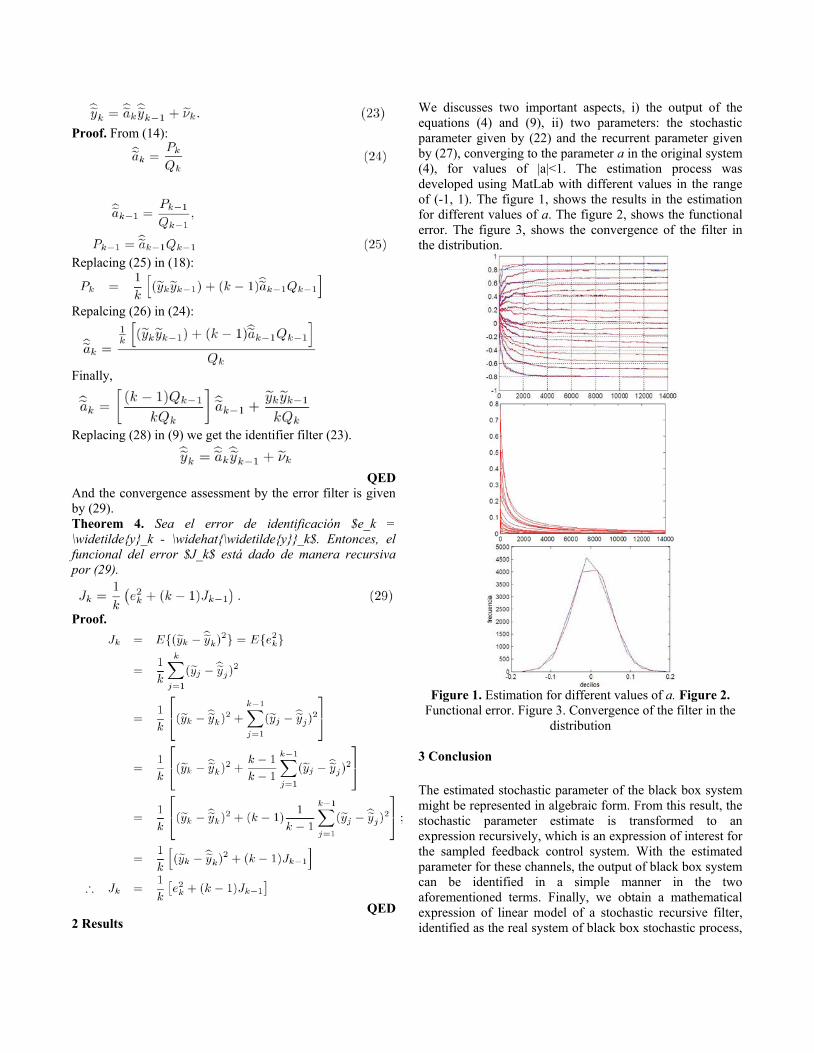
We discusses two important aspects, i) the output of the equations (4) and (9), ii) two parameters: the stochastic parameter given by (22) and the recurrent parameter given by (27), converging to the parameter a in the original system (4), for values of |a|<1. The estimation process was developed using MatLab with different values in the range of (-1, 1). The figure 1, shows the results in the estimation for different values of a. The figure 2, shows the functional error. The figure 3, shows the convergence of the filter in the distribution.
Figure 1. Estimation for different values of a. Figure 2.
Functional error. Figure 3. Convergence of the filter in the distribution
3 Conclusion
The estimated stochastic parameter of the black box system might be represented in algebraic form. From this result, the stochastic parameter estimate is transformed to an expression recursively, which is an expression of interest for the sampled feedback control system. With the estimated parameter for these channels, the output of black box system can be identified in a simple manner in the two aforementioned terms. Finally, we obtain a mathematical expression of linear model of a stochastic recursive filter, identified as the real system of black box stochastic process,

with very little accuracy and the convergence of stochastic parameter is estimated.
References 1. J. Abonyi, Fuzzy model identification for control, Birkhauser, Boston 2003. 2. J.J. Medel Juárez and M.T. Zagaceta Alvarez, Rev. Mex. Fís. 56 (2009) 1. 3. P. Englezos and N. Kalogerakis, Applied Paramter Estimation for Chemical Engineers, Mercel Dekker 2001. 4. A. Aguado Behar and M. Martínez Iranzo, Identificación y Control Adaptivo, Pearson 2003. 5. A. Sinha, Linear Systems: Optimal and Robust Control, CRC Press 2007. 6. W. S. Levine, The Control Handbook, CRC Press 1996. 7. R. E. Curry, Estimation and Control with Quantized Measurements, MIT Press 1970. 8. R. E. Curry ,Hidden Markov Models Estimation and Control, Springer USA 1995. 9. M. Godin, Identification and Estimation for Models Described by Differential Algebraic Equations, Linkoping 2006. 10. T. Sodertrom and P. Stoica, System Identification, Prentice Hall 1989.
Abstract This paper describes the design and implementation of a system to automatically generate C language programs that use sockets and/or RPC from flow charts that the user can create in the system. This will enable developers to implement basic applications based on client-server model in a more easy way. Among the achievements for this system is the multiplatform capability in its execution and the creation of a graphical interface for the user to draw diagrams of the system behavior. Resumen El presente artículo describe el diseño e implementación de un sistema que permita la generación automática de programas en lenguaje C que usen sockets y/o RPC, lo anterior a partir de diagramas de flujo que el usuario podrá crear en el sistema. Esto facilitará a los programadores la realización de aplicaciones básicas basadas en el modelo cliente-servidor. Entre los alcances de este sistema se encuentra la capacidad multiplataforma en la ejecución del mismo, así como la creación de una interfaz gráfica para que el usuario elabore los diagramas del comportamiento del sistema. Key words: Automatic code generation, client-server model, sockets/RPC. Palabras clave: Generación automática de código, modelo cliente-servidor, sockets/RPC. 1 Introduction Application development using client-server model is increasingly required in industrial applications, mainly due to growth of Internet and distributed information processing. Also is known that demands on time of development are increasing. In this context, it becomes evident that is necessary provide to programmers a fast way to development programs. This work proposes the paradigm of automatic code generation because it provides a possible alternative for creating software in a more fast and easy way. Automatic code generation should be understood as a program capable of writing code for other programs from a model or template that contains the developer's specifications [1].
In the development of client-server applications, they require a solid support of network communication and this is where they have two main possible mechanisms: sockets and RPCs. A socket refers to a communication media between two machines or processes which is associated with a port number, a communication protocol and a network address. Using sockets is possible to exchange any data flow, in a reliably and orderly way. For our system is used AF_INET sockets family which is defined for BSD UNIX systems and it works with both TCP and UDP transport protocols, thus offering the possibility of connection-oriented (permanent connection) and connectionless (temporal connection) environments [2]. The RPC (acronym for Remote Procedure Call) are a set of functions which is hosted on a server that will respond to requests for such functions made by clients. RPC works in a non-connection-oriented. The RPC implementation best known is ONC RPC for UNIX, which encrypts the data traveling through the network using XDR standard [3]. Our system is oriented primarily for novice programmers and/or students who wish to support their learning in the distributed systems area, specifically in areas of network communication mechanisms, threads and processes. In this context is designed and implemented the System of automatic generation of applications based on sockets and RPC (GenDis). This paper presents in section 2 the methodology used in the system, section 3 presents some results obtained from the implementation and proofs of the system, section 4 presents conclusions, finally section 5 presents the references. 2 Methodology The methodology used in GenDIS is Rational Unified Process (RUP commonly abbreviated), created by Rational Software a division of IBM since 2003. RUP is a process itself but combined with UML (Unified Modeling Language) is currently the most widely used standard methodology for the analysis, design, implementation and documentation of object-oriented systems. The main features of RUP are [4]: x Process based on uses case: Uses case determines the
system requirements and is used as guide for design, implementation and testing of system.
x Architecture-focused process: It must establish a good system architecture that is not heavily impacted with
System of automatic generation of applications based on sockets and RPC (GenDis)
Jorge Cortes Galicia, César A. Rodríguez Martínez, Fabián Ariza Espinoza Escuela Superior de Cómputo-I.P.N.
Av. Juan de Dios Bátiz s/n, tel: 57296000 ext. 52039, México D.F. e-mail: [email protected], [email protected], [email protected]
subsequent changes during construction and maintenance.
x Iterative and incremental process: This method is an implementation of spiral development model, which is iterative and incremental. Also ensures the production of functional prototypes at each iteration end.
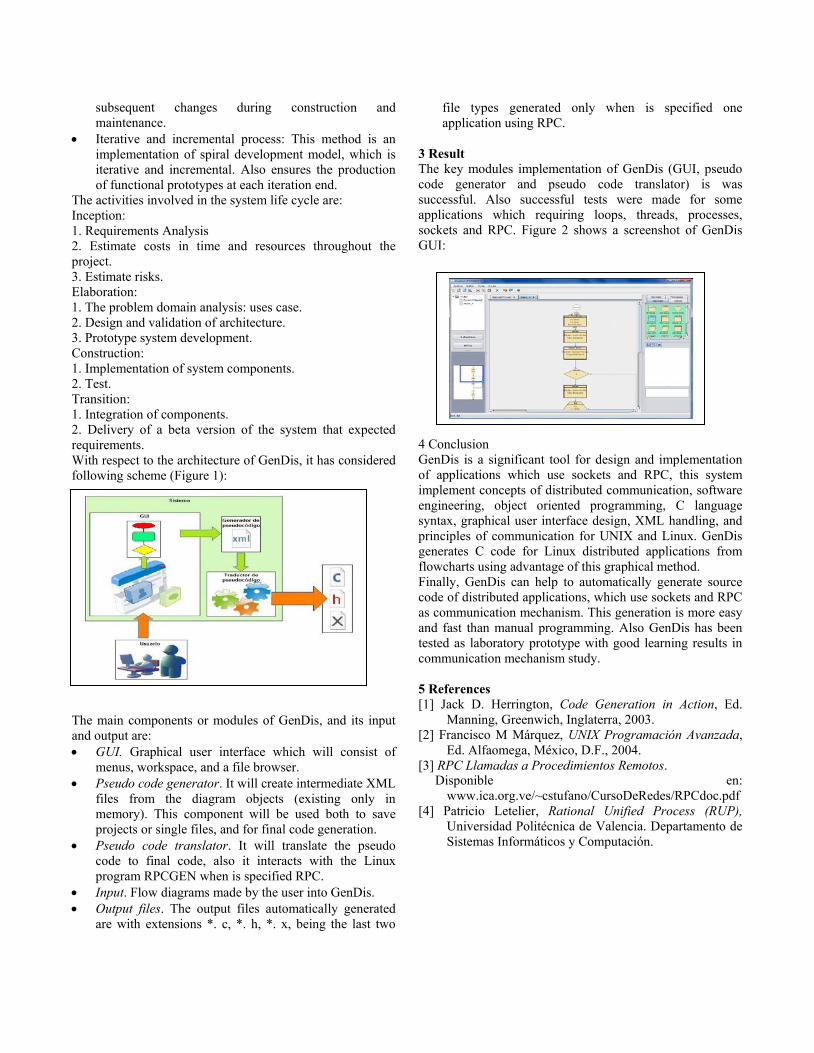
The activities involved in the system life cycle are: Inception: 1. Requirements Analysis 2. Estimate costs in time and resources throughout the project. 3. Estimate risks. Elaboration: 1. The problem domain analysis: uses case. 2. Design and validation of architecture. 3. Prototype system development. Construction: 1. Implementation of system components. 2. Test. Transition: 1. Integration of components. 2. Delivery of a beta version of the system that expected requirements. With respect to the architecture of GenDis, it has considered following scheme (Figure 1):
Figure 1. Architecture of GenDis. The main components or modules of GenDis, and its input and output are: x GUI. Graphical user interface which will consist of
menus, workspace, and a file browser. x Pseudo code generator. It will create intermediate XML
files from the diagram objects (existing only in memory). This component will be used both to save projects or single files, and for final code generation.
x Pseudo code translator. It will translate the pseudo code to final code, also it interacts with the Linux program RPCGEN when is specified RPC.
x Input. Flow diagrams made by the user into GenDis. x Output files. The output files automatically generated
are with extensions *. c, *. h, *. x, being the last two
file types generated only when is specified one application using RPC.
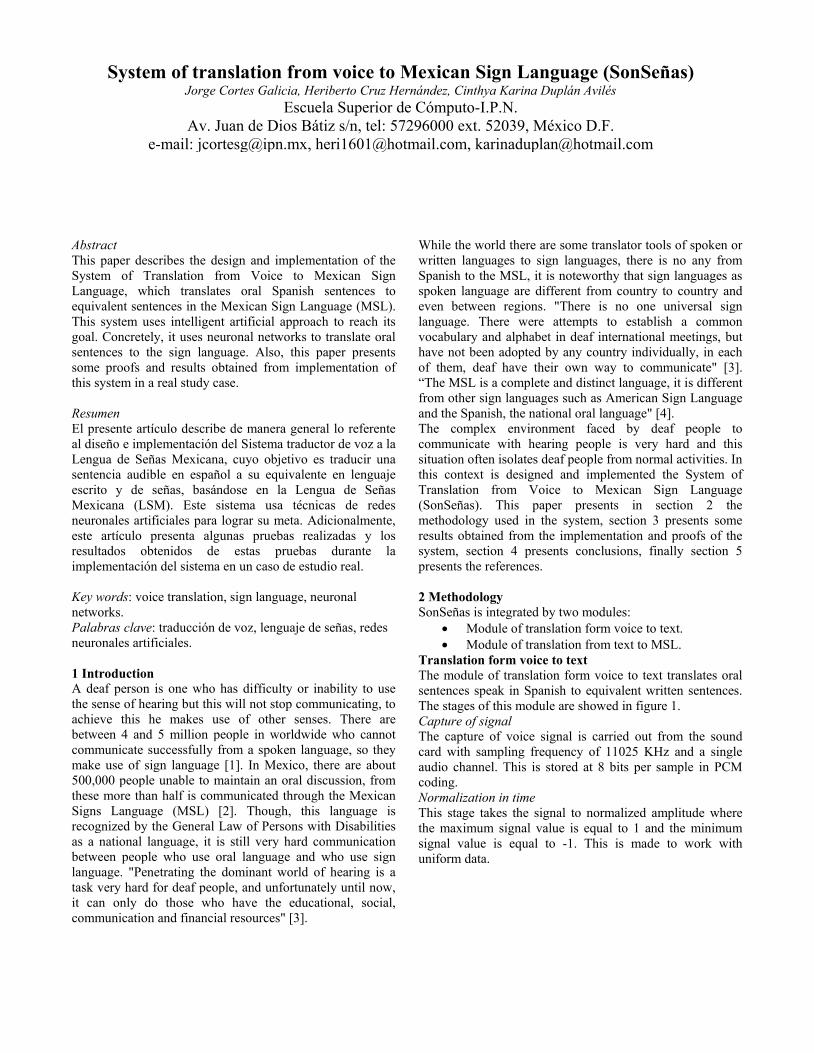
3 Result The key modules implementation of GenDis (GUI, pseudo code generator and pseudo code translator) is was successful. Also successful tests were made for some applications which requiring loops, threads, processes, sockets and RPC. Figure 2 shows a screenshot of GenDis GUI:
Figure 2. Screenshot of GenDis GUI. 4 Conclusion GenDis is a significant tool for design and implementation of applications which use sockets and RPC, this system implement concepts of distributed communication, software engineering, object oriented programming, C language syntax, graphical user interface design, XML handling, and principles of communication for UNIX and Linux. GenDis generates C code for Linux distributed applications from flowcharts using advantage of this graphical method. Finally, GenDis can help to automatically generate source code of distributed applications, which use sockets and RPC as communication mechanism. This generation is more easy and fast than manual programming. Also GenDis has been tested as laboratory prototype with good learning results in communication mechanism study. 5 References [1] Jack D. Herrington, Code Generation in Action, Ed.
Manning, Greenwich, Inglaterra, 2003. [2] Francisco M Márquez, UNIX Programación Avanzada,
Ed. Alfaomega, México, D.F., 2004. [3] RPC Llamadas a Procedimientos Remotos. Disponible en:
www.ica.org.ve/~cstufano/CursoDeRedes/RPCdoc.pdf [4] Patricio Letelier, Rational Unified Process (RUP),
Universidad Politécnica de Valencia. Departamento de Sistemas Informáticos y Computación.
Abstract This paper describes the design and implementation of the System of Translation from Voice to Mexican Sign Language, which translates oral Spanish sentences to equivalent sentences in the Mexican Sign Language (MSL). This system uses intelligent artificial approach to reach its goal. Concretely, it uses neuronal networks to translate oral sentences to the sign language. Also, this paper presents some proofs and results obtained from implementation of this system in a real study case. Resumen El presente artículo describe de manera general lo referente al diseño e implementación del Sistema traductor de voz a la Lengua de Señas Mexicana, cuyo objetivo es traducir una sentencia audible en español a su equivalente en lenguaje escrito y de señas, basándose en la Lengua de Señas Mexicana (LSM). Este sistema usa técnicas de redes neuronales artificiales para lograr su meta. Adicionalmente, este artículo presenta algunas pruebas realizadas y los resultados obtenidos de estas pruebas durante la implementación del sistema en un caso de estudio real. Key words: voice translation, sign language, neuronal networks. Palabras clave: traducción de voz, lenguaje de señas, redes neuronales artificiales. 1 Introduction A deaf person is one who has difficulty or inability to use the sense of hearing but this will not stop communicating, to achieve this he makes use of other senses. There are between 4 and 5 million people in worldwide who cannot communicate successfully from a spoken language, so they make use of sign language [1]. In Mexico, there are about 500,000 people unable to maintain an oral discussion, from these more than half is communicated through the Mexican Signs Language (MSL) [2]. Though, this language is recognized by the General Law of Persons with Disabilities as a national language, it is still very hard communication between people who use oral language and who use sign language. "Penetrating the dominant world of hearing is a task very hard for deaf people, and unfortunately until now, it can only do those who have the educational, social, communication and financial resources" [3].
While the world there are some translator tools of spoken or written languages to sign languages, there is no any from Spanish to the MSL, it is noteworthy that sign languages as spoken language are different from country to country and even between regions. "There is no one universal sign language. There were attempts to establish a common vocabulary and alphabet in deaf international meetings, but have not been adopted by any country individually, in each of them, deaf have their own way to communicate" [3]. “The MSL is a complete and distinct language, it is different from other sign languages such as American Sign Language and the Spanish, the national oral language" [4]. The complex environment faced by deaf people to communicate with hearing people is very hard and this situation often isolates deaf people from normal activities. In this context is designed and implemented the System of Translation from Voice to Mexican Sign Language (SonSeñas). This paper presents in section 2 the methodology used in the system, section 3 presents some results obtained from the implementation and proofs of the system, section 4 presents conclusions, finally section 5 presents the references. 2 Methodology SonSeñas is integrated by two modules:
x Module of translation form voice to text. x Module of translation from text to MSL.
Translation form voice to text The module of translation form voice to text translates oral sentences speak in Spanish to equivalent written sentences. The stages of this module are showed in figure 1. Capture of signal The capture of voice signal is carried out from the sound card with sampling frequency of 11025 KHz and a single audio channel. This is stored at 8 bits per sample in PCM coding. Normalization in time This stage takes the signal to normalized amplitude where the maximum signal value is equal to 1 and the minimum signal value is equal to -1. This is made to work with uniform data.
System of translation from voice to Mexican Sign Language (SonSeñas) Jorge Cortes Galicia, Heriberto Cruz Hernández, Cinthya Karina Duplán Avilés
Escuela Superior de Cómputo-I.P.N. Av. Juan de Dios Bátiz s/n, tel: 57296000 ext. 52039, México D.F.
e-mail: [email protected], [email protected], [email protected]
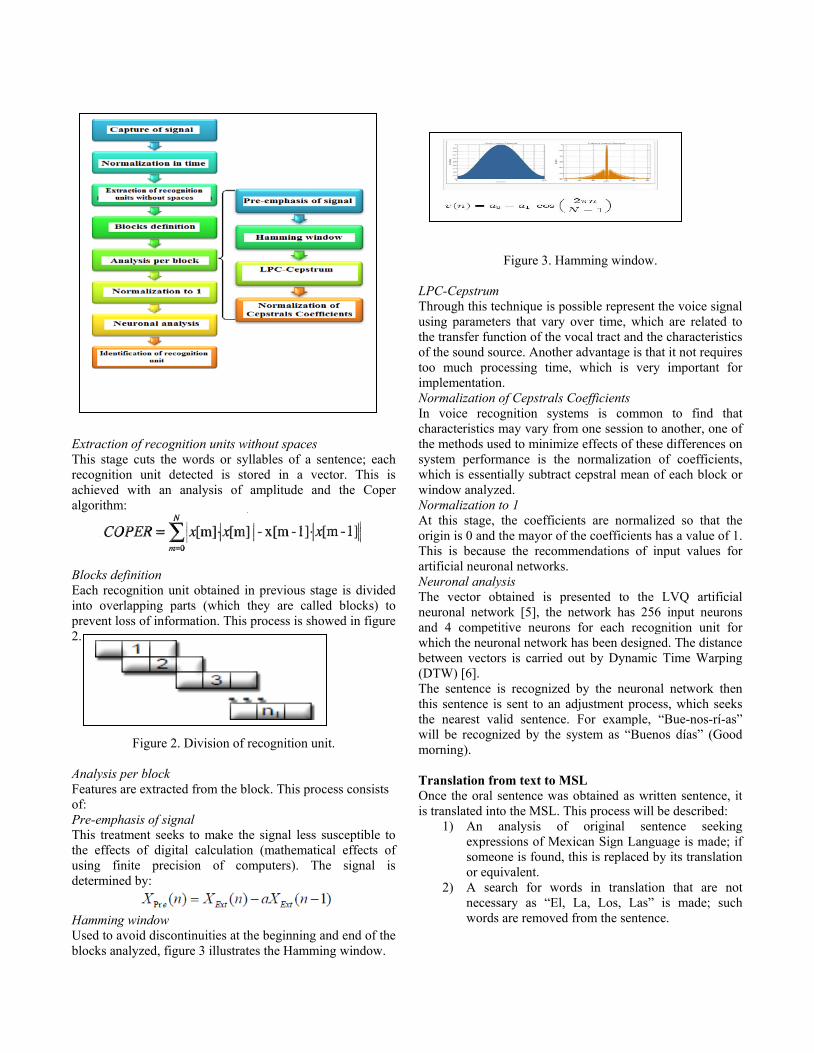
Figure 1. Voice-text translation diagram. Extraction of recognition units without spaces This stage cuts the words or syllables of a sentence; each recognition unit detected is stored in a vector. This is achieved with an analysis of amplitude and the Coper algorithm:
Blocks definition Each recognition unit obtained in previous stage is divided into overlapping parts (which they are called blocks) to prevent loss of information. This process is showed in figure 2.
Figure 2. Division of recognition unit. Analysis per block Features are extracted from the block. This process consists of: Pre-emphasis of signal This treatment seeks to make the signal less susceptible to the effects of digital calculation (mathematical effects of using finite precision of computers). The signal is determined by:
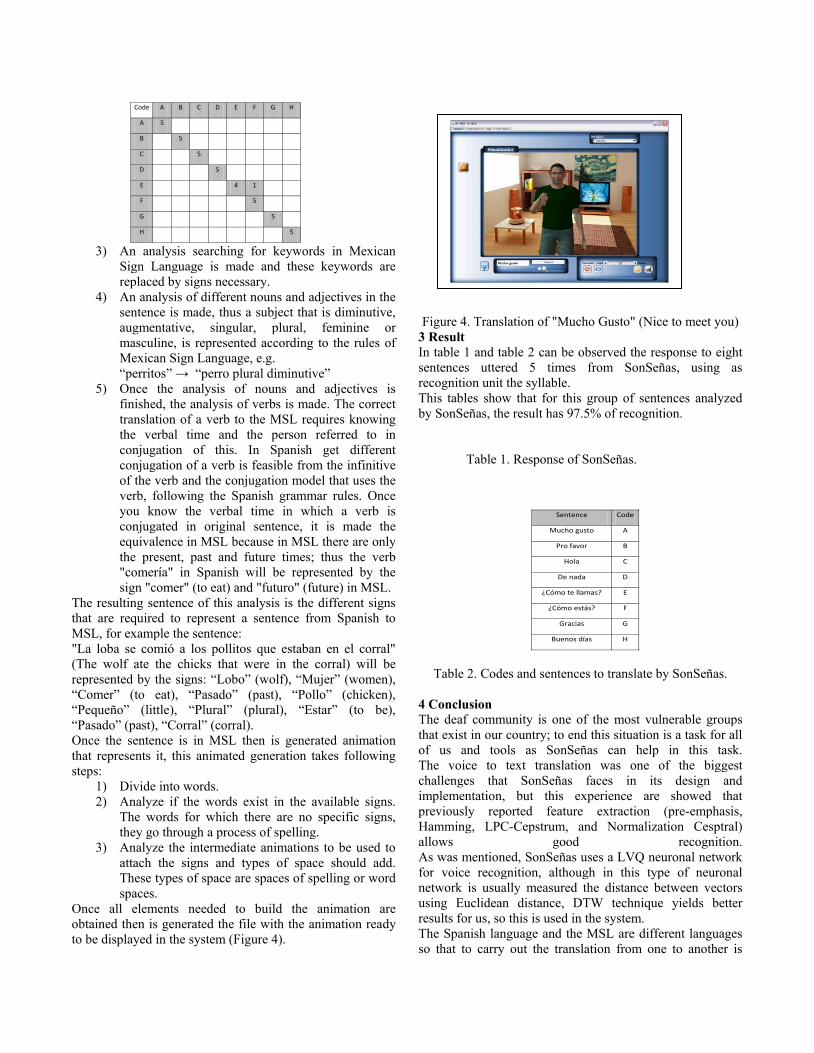
Hamming window Used to avoid discontinuities at the beginning and end of the blocks analyzed, figure 3 illustrates the Hamming window.
Figure 3. Hamming window. LPC-Cepstrum Through this technique is possible represent the voice signal using parameters that vary over time, which are related to the transfer function of the vocal tract and the characteristics of the sound source. Another advantage is that it not requires too much processing time, which is very important for implementation. Normalization of Cepstrals Coefficients In voice recognition systems is common to find that characteristics may vary from one session to another, one of the methods used to minimize effects of these differences on system performance is the normalization of coefficients, which is essentially subtract cepstral mean of each block or window analyzed. Normalization to 1 At this stage, the coefficients are normalized so that the origin is 0 and the mayor of the coefficients has a value of 1. This is because the recommendations of input values for artificial neuronal networks. Neuronal analysis The vector obtained is presented to the LVQ artificial neuronal network [5], the network has 256 input neurons and 4 competitive neurons for each recognition unit for which the neuronal network has been designed. The distance between vectors is carried out by Dynamic Time Warping (DTW) [6]. The sentence is recognized by the neuronal network then this sentence is sent to an adjustment process, which seeks the nearest valid sentence. For example, “Bue-nos-rí-as” will be recognized by the system as “Buenos días” (Good morning). Translation from text to MSL Once the oral sentence was obtained as written sentence, it is translated into the MSL. This process will be described:
1) An analysis of original sentence seeking expressions of Mexican Sign Language is made; if someone is found, this is replaced by its translation or equivalent.
2) A search for words in translation that are not necessary as “El, La, Los, Las” is made; such words are removed from the sentence.
3) An analysis searching for keywords in Mexican Sign Language is made and these keywords are replaced by signs necessary.
4) An analysis of different nouns and adjectives in the sentence is made, thus a subject that is diminutive, augmentative, singular, plural, feminine or masculine, is represented according to the rules of Mexican Sign Language, e.g. ³SHUULWRV´�ĺ��³SHUUR�SOXUDO�GLPLQXWLYH´
5) Once the analysis of nouns and adjectives is finished, the analysis of verbs is made. The correct translation of a verb to the MSL requires knowing the verbal time and the person referred to in conjugation of this. In Spanish get different conjugation of a verb is feasible from the infinitive of the verb and the conjugation model that uses the verb, following the Spanish grammar rules. Once you know the verbal time in which a verb is conjugated in original sentence, it is made the equivalence in MSL because in MSL there are only the present, past and future times; thus the verb "comería" in Spanish will be represented by the sign "comer" (to eat) and "futuro" (future) in MSL.
The resulting sentence of this analysis is the different signs that are required to represent a sentence from Spanish to MSL, for example the sentence: "La loba se comió a los pollitos que estaban en el corral" (The wolf ate the chicks that were in the corral) will be represented by the signs: “Lobo” (wolf), “Mujer” (women), “Comer” (to eat), “Pasado” (past), “Pollo” (chicken), “Pequeño” (little), “Plural” (plural), “Estar” (to be), “Pasado” (past), “Corral” (corral). Once the sentence is in MSL then is generated animation that represents it, this animated generation takes following steps:
1) Divide into words. 2) Analyze if the words exist in the available signs.
The words for which there are no specific signs, they go through a process of spelling.
3) Analyze the intermediate animations to be used to attach the signs and types of space should add. These types of space are spaces of spelling or word spaces.
Once all elements needed to build the animation are obtained then is generated the file with the animation ready to be displayed in the system (Figure 4).
Figure 4. Translation of "Mucho Gusto" (Nice to meet you) 3 Result In table 1 and table 2 can be observed the response to eight sentences uttered 5 times from SonSeñas, using as recognition unit the syllable. This tables show that for this group of sentences analyzed by SonSeñas, the result has 97.5% of recognition.
Table 1. Response of SonSeñas.
Table 2. Codes and sentences to translate by SonSeñas. 4 Conclusion The deaf community is one of the most vulnerable groups that exist in our country; to end this situation is a task for all of us and tools as SonSeñas can help in this task. The voice to text translation was one of the biggest challenges that SonSeñas faces in its design and implementation, but this experience are showed that previously reported feature extraction (pre-emphasis, Hamming, LPC-Cepstrum, and Normalization Cesptral) allows good recognition. As was mentioned, SonSeñas uses a LVQ neuronal network for voice recognition, although in this type of neuronal network is usually measured the distance between vectors using Euclidean distance, DTW technique yields better results for us, so this is used in the system. The Spanish language and the MSL are different languages so that to carry out the translation from one to another is
Sentence Code
Mucho gusto A
Pro favor B
Hola C
De nada D
¿Cómo te llamas? E
¿Cómo estás? F
Gracias G
Buenos días H
Code A B C D E F G H
A 5
B 5
C 5
D 5
E 4 1
F 5
G 5
H 5
necessary to study both languages. Study the Spanish language was enough to query some books (reported in the section of references), but for study of the MSL was needed, in addition to bibliographic research, take a closer to an institution where they teach this language, this institution was the Centre of Integration for People with Different Abilities of Ecatepec. Finally, SonSeñas can help to communication between people who use Spanish language and people who use the MSL. Additionally, it makes more easy learning of this language (MSL) and allows creation of teaching material for this purpose. 5 References [1] Federación Mundial de Sordos WFD, Convención
Internacional sobre la Protección de los Derechos de las Personas Discapacitadas (CIPDPD), 2006.
[2] Unión Nacional de Sordos de México UNSM, Convención Internacional sobre la Protección de los Derechos de las Personas Discapacitadas (CIPDPD), 2006.
[3] Luis Armando López García, Rosa Rodríguez, María Zamora, and Susana San Esteban, Mis Manos que Hablan. Lengua de Señas para Sordos, Ed. Trillas, México D.F, 2006.
[4] Karla Faurot, Dianne Dellinger, Andy Eatough, and Steve Parkhurst, Lenguaje de Signos Mexicano. La Identidad como Lenguaje del Sistema de Signos Mexicano, 1999.
[5] Simon Haykin, Neural Networks A Comprenhensive Foundation, Prentice Hall, Canadá, 1998.
[6] CA de Luna, JC Martínez, and M Mora, Reconocimiento de Voz con Redes Neuronales, DTW y Modelos Ocultos de Harkov. Redalyc.
Abstract –– In this paper a very simple mathematical
technique is used for evaluating Internet Networks parameters. The Minimal distance to Ideal Method had been used to evaluate different entities like banks, telecommunications companies and tourism companies. The method is applied to evaluate WLAN´s using the Benchmarking Methodology for Network Interconnect Devices proposed by Internet Engineering Task Force. However more parameters can be easily added like WLAN cost or maximum distance to computer users.
Keywords –– Dimensionless, DUT, Evaluation Method,
RFC 2544, Ideal point.
I. INTRODUCTION
There are several methods and approaches for evaluate a computer network, financial, security, performance, risks, quality of service and others. Many companies have dedicated resources for these tasks. For example metrology companies, have developed measurement equipment as analyzer signal, network testers or sniffers for networks. There are government agencies with similar interests around the world. Professional societies as IEEE have interest groups working continuously making documents about computer network evaluation
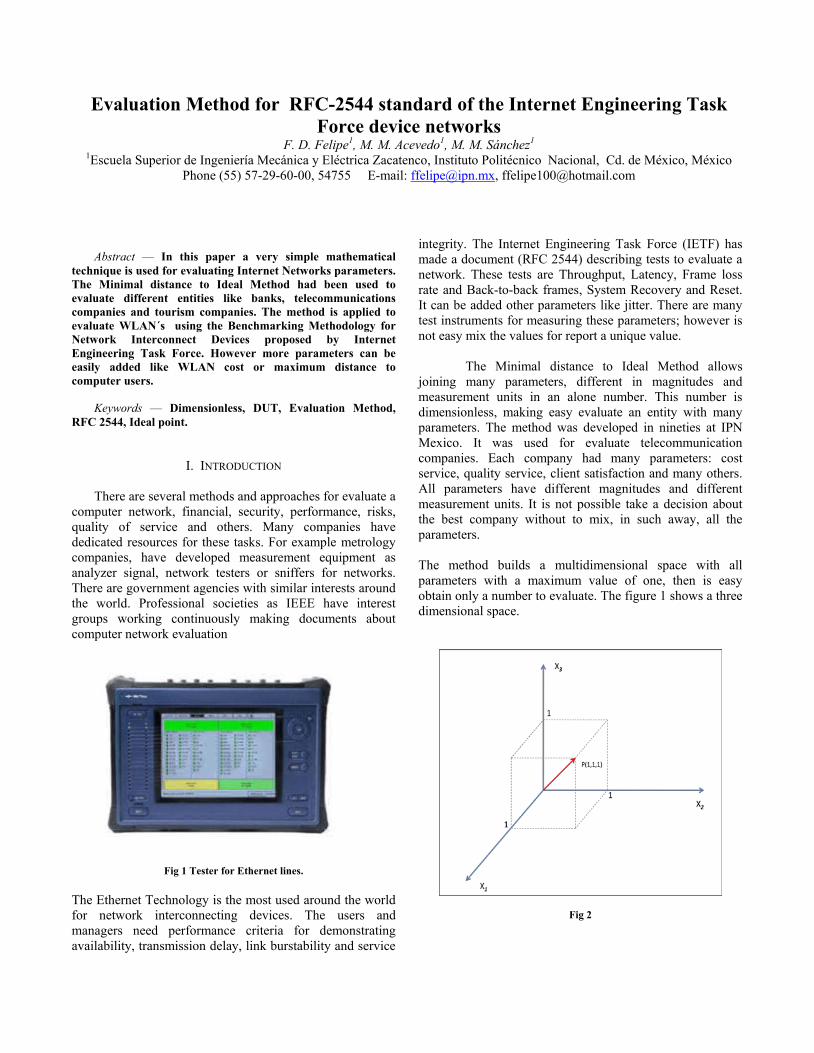
Fig 1 Tester for Ethernet lines. The Ethernet Technology is the most used around the world for network interconnecting devices. The users and managers need performance criteria for demonstrating availability, transmission delay, link burstability and service
integrity. The Internet Engineering Task Force (IETF) has made a document (RFC 2544) describing tests to evaluate a network. These tests are Throughput, Latency, Frame loss rate and Back-to-back frames, System Recovery and Reset. It can be added other parameters like jitter. There are many test instruments for measuring these parameters; however is not easy mix the values for report a unique value.
The Minimal distance to Ideal Method allows joining many parameters, different in magnitudes and measurement units in an alone number. This number is dimensionless, making easy evaluate an entity with many parameters. The method was developed in nineties at IPN Mexico. It was used for evaluate telecommunication companies. Each company had many parameters: cost service, quality service, client satisfaction and many others. All parameters have different magnitudes and different measurement units. It is not possible take a decision about the best company without to mix, in such away, all the parameters. The method builds a multidimensional space with all parameters with a maximum value of one, then is easy obtain only a number to evaluate. The figure 1 shows a three dimensional space.
Fig 2
Evaluation Method for RFC-2544 standard of the Internet Engineering Task Force device networks
F. D. Felipe1, M. M. Acevedo1, M. M. Sánchez1
1Escuela Superior de Ingeniería Mecánica y Eléctrica Zacatenco, Instituto Politécnico Nacional, Cd. de México, México Phone (55) 57-29-60-00, 54755 E-mail: [email protected], [email protected]
The method have other feature, the user can define the most important parameters, then he can evaluate the entity with his preferences or features important for the problem that he has in this moment. II. Basic Concepts Ethernet Networks: The Internet Engineering Task Force (IETF) is a international organization dedicated to improve the Internet operation Internet. His technical work is made with many groups organized by topics as routing, transports, security and others. The actual technical work of the IETF is done in its working groups, which are organized by topic into several areas (e.g., routing, transport, security, etc.). A working group has made a Benchmark Methodology for network interconnect devices defining “a number of tests that may be used to describe the performance characteristics of a network interconnecting device”. The benchmarking tests, and their descriptions are the next:
1. Throughput. It measures the messages delivery over a communication channel. ITFC defines as “the fastest rate at which the count of test frames transmitted by the DUT is equal to the number of test frames sent to it by the test equipment”.
2. Latency. It measures the time delay in a network. The ITFC stipulates a timestamp A, a timestamp B for bit forwarding devices, then obtain the difference.
3. Frame loss rate. It determines the packets lost in a DUT. Must send a specific number of frames and count the frames transmitted by the device.
4. Back-to-back frames. It is “the number of frames in the longest burst that the DUT will handle without the loss of any frame”.
5. System recovery. The evaluator must obtain the speed at which the DUT can recover form an overload condition.
6. Reset. It is the speed at which a DUT recovers from a reset. The reset can be from software or hardware.
III. DEVELOPMENT
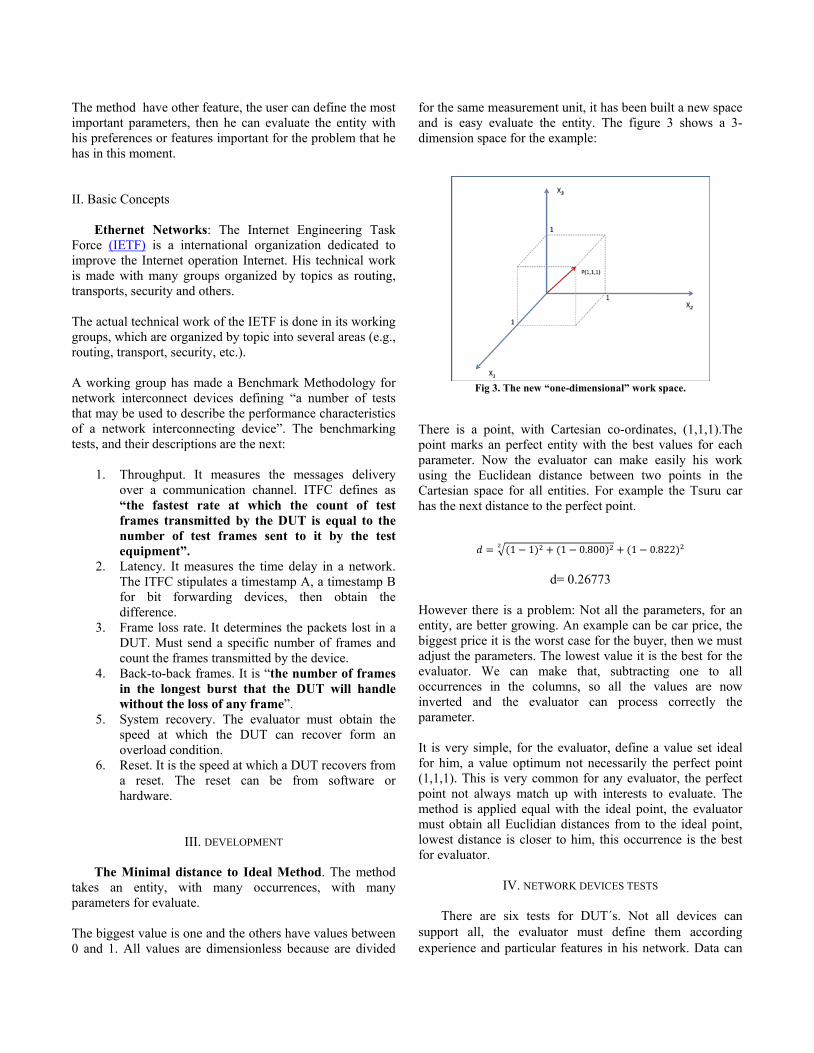
The Minimal distance to Ideal Method. The method
takes an entity, with many occurrences, with many parameters for evaluate.
The biggest value is one and the others have values between 0 and 1. All values are dimensionless because are divided
for the same measurement unit, it has been built a new space and is easy evaluate the entity. The figure 3 shows a 3-dimension space for the example:
Fig 3. The new “one-dimensional” work space.
There is a point, with Cartesian co-ordinates, (1,1,1).The point marks an perfect entity with the best values for each parameter. Now the evaluator can make easily his work using the Euclidean distance between two points in the Cartesian space for all entities. For example the Tsuru car has the next distance to the perfect point.
= ඥ(1 െ 1)ଶ + (1 െ 0.800)ଶమ + (1 െ 0.822)ଶ
d= 0.26773 However there is a problem: Not all the parameters, for an entity, are better growing. An example can be car price, the biggest price it is the worst case for the buyer, then we must adjust the parameters. The lowest value it is the best for the evaluator. We can make that, subtracting one to all occurrences in the columns, so all the values are now inverted and the evaluator can process correctly the parameter. It is very simple, for the evaluator, define a value set ideal for him, a value optimum not necessarily the perfect point (1,1,1). This is very common for any evaluator, the perfect point not always match up with interests to evaluate. The method is applied equal with the ideal point, the evaluator must obtain all Euclidian distances from to the ideal point, lowest distance is closer to him, this occurrence is the best for evaluator.
IV. NETWORK DEVICES TESTS There are six tests for DUT´s. Not all devices can support all, the evaluator must define them according experience and particular features in his network. Data can
be measure and generate a great deal of data over long period time, but can be necessary to do. The evaluator must consider the media type like Ethernet, Token Ring or FDDI to define the frames for the test. The common architectures for make the tests is use a device tester with both transmitting and receiving ports connected to the DUT ports. The figure 1 described it:
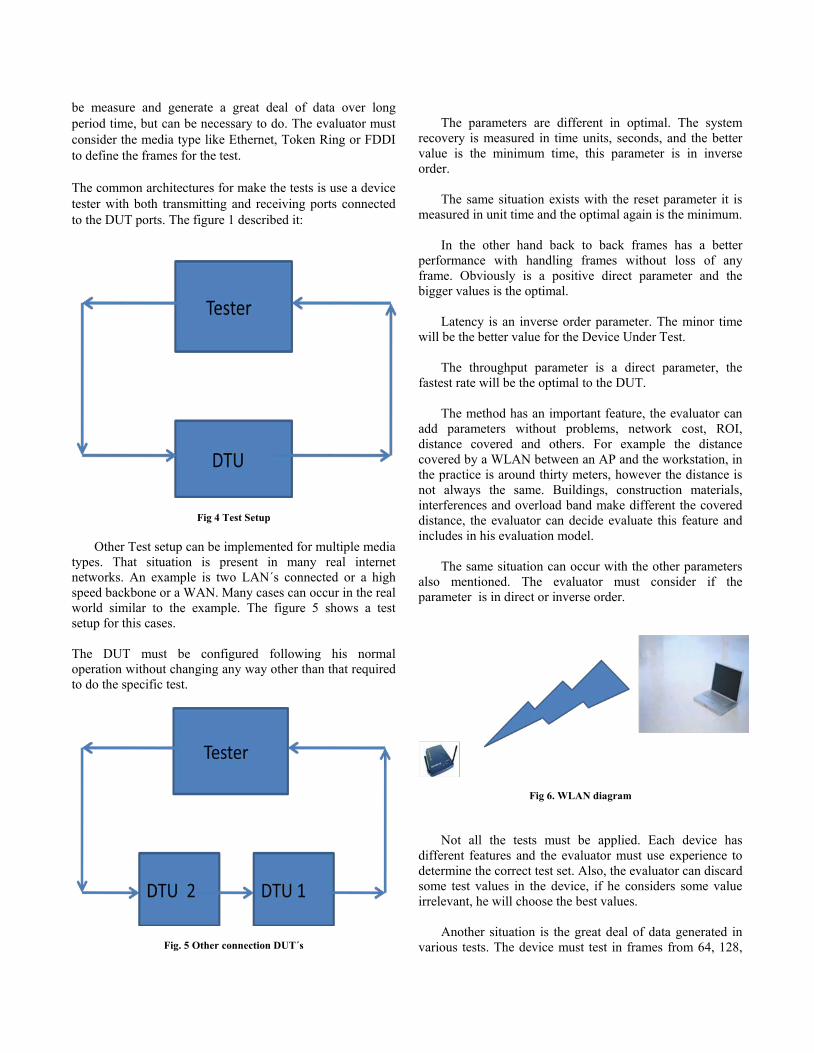
Fig 4 Test Setup Other Test setup can be implemented for multiple media types. That situation is present in many real internet networks. An example is two LAN´s connected or a high speed backbone or a WAN. Many cases can occur in the real world similar to the example. The figure 5 shows a test setup for this cases. The DUT must be configured following his normal operation without changing any way other than that required to do the specific test.
Fig. 5 Other connection DUT´s
The parameters are different in optimal. The system recovery is measured in time units, seconds, and the better value is the minimum time, this parameter is in inverse order. The same situation exists with the reset parameter it is measured in unit time and the optimal again is the minimum. In the other hand back to back frames has a better performance with handling frames without loss of any frame. Obviously is a positive direct parameter and the bigger values is the optimal. Latency is an inverse order parameter. The minor time will be the better value for the Device Under Test. The throughput parameter is a direct parameter, the fastest rate will be the optimal to the DUT. The method has an important feature, the evaluator can add parameters without problems, network cost, ROI, distance covered and others. For example the distance covered by a WLAN between an AP and the workstation, in the practice is around thirty meters, however the distance is not always the same. Buildings, construction materials, interferences and overload band make different the covered distance, the evaluator can decide evaluate this feature and includes in his evaluation model. The same situation can occur with the other parameters also mentioned. The evaluator must consider if the parameter is in direct or inverse order.
Fig 6. WLAN diagram Not all the tests must be applied. Each device has different features and the evaluator must use experience to determine the correct test set. Also, the evaluator can discard some test values in the device, if he considers some value irrelevant, he will choose the best values. Another situation is the great deal of data generated in various tests. The device must test in frames from 64, 128,

256, 512, 1024, 1280, to 1518 bytes. The period time can be long and the data is increased a lot. In some cases is necessary to make computer programs to deal with the data. In some tests realized the data file has 83000 lines of data and the total files was 1200. It is impossible to handle with applications like EXCEL because we must to combine many internal data. Another important situation is the available equipment to do the set test. Not all the networks managers have access to specialized equipment, it is very expensive and the manager cannot acquire any tester. He can use many monitoring open source software available. There a great number of monitoring software, many are evaluation software and the manager can utilize to make a little tests. Others are very completes and no have cost. However we did not find software to implement benchmarking for internet network interconnect devices. Although have a problem, they are not a standardized tool like many hardware devices. If the evaluator do not need make standardized tests is irrelevant this situation.
V. CONCLUSION We have presented a general evaluation method applied to Internet devices, DUT´s. The method makes possible evaluate many different parameters mixing in alone quantity, a unique number. So we can compare many DUT´s. Implementing the method in a high level language is very simple, the program only needs a matrix to calculate the result. The evaluator can change ideal evaluation parameters to obtain a point more suitable to his particular case. We present a brief RFC 2544description and each evaluator can define the most adequate parameters to evaluate. The method has other important feature, any evaluator can define other parameters, like cost or bandwidth, and using the same method obtains an evaluation. An Internet evaluator may extend the tests according new requests and it is not difficult apply. A future task is to develop a software tool to implement these tests.
ACKNOWLEDGMENT F. Felipe, I. Martínez and Acevedo thank to “Programa de Estímulos al Desempeño Académico EDD, Programa de Estímulos a los Investigadores EDI, and Sistema de becas por Exclusividad, SIBE programs of the Instituto Politécnico Nacional to support professors.
This work is a result of the SIP project “PLANES DE PREVENCION DE DESASTRES EN REDES INALÁMBRICAS WIFI”, Clave 20100394
REFERENCES [1] E. Mercado, “Teoría de la Decisión,” LIMUSA México 1996. [2] R. Olexa “Implementing 802.11, 802.16 and 802.20 Wireless
networks” Elsevier 2005, United States of America. [3] S. Bradner, J. McQuaid, , “Benchmarking Methodology for
Network Interconnect Devices”. Internet Engineering Task Force, March 1999.
[4] F. Felipe D. “Planes de Prevención y Recuperación de Desastres en Redes WLAN”, SENIE 2009.
[5] F. Felipe D. M. A. Acevedo, M.E. Acevedo “Herramientas de Software para el monitoreo de Redes de Área Locasl Inalámbricas” 6th International Conference on Electrical and Electronics Engineering Research, 2008..
[6] www.anritsu.com [7] www.flukeetworks.com [7] www.ieee.org/standars
Marco Antonio Acevedo Mosqueda Nació en México D.F. el 19 de julio de 1968. Obtuvo el título de ingeniero en Comunicaciones y Electrónica en 1992 y en 1996 obtiene el grado de Maestro en Ciencias en Ingeniería Electrónica en la Escuela Superior de Ingeniería Mecánica y Eléctrica del Instituto Politécnico Nacional. Actualmente es profesor investigador de la Maestría en Ciencias en Ingeniería de Telecomunicaciones de la SEPI-ESIME-IPN.
Federico Felipe Durán. He is a professor of computer science at Escuela Superior de Ingeniería Mecánica y Eléctrica (ESIME) of Instituto Politécnico Nacional (IPN) Mexico. His research interests include Artificial Intelligence, Data bases, Natural Language Processing and Computer networks. Felipe is an electrical engeenering for the IPN (1984) and made graduate studies at Centro de Investigación y Estudios Avanzados (1987).
Miguel Sánchez Meraz Graduado como Ingeniero en Comunicaciones y Electrónica en 1996 y como Maestro en Ciencias en Ingeniería de Sistemas en 1998, ambos por el Instituto Politécnico Nacional. Desde 1994 es profesor titular de la Escuela Superior de Ingeniería Mecánica y Eléctrica del IPN, asignado al Departamento de Telecomunicaciones. Ha desarrollado diversos proyectos de investigación y desarrollo tecnológico tanto para

el sector gobierno como para el sector privado en el área de simulación de sistemas de comunicación, redes de banda ancha, navegación satelital, técnicas de codificación y procesamiento de señales. Escuela Superior de Ingeniería Mecánica y Eléctrica Av. IPN s/n, Col. Lindavista, C.P. 07738, Ciudad de México, México. Teléfono: 01 55 57296000 Ext. 54756. Marco Antonio Acevedo Mosqueda [email protected] Federico Felipe Durán [email protected]
Abstract –– This work presents the experimental results about performance measurements in GSM and GPRS cellular data networks. Two user equipments (UE) were used, in order to take place the scenario. Keywords –– GSM, GPRS, Cellular Networks Introduction Cellular networks were created to transmit voice calls, but currently, it is able to carry multimedia services like data and video. In the following section, the cellular communication generations are described.
First Generation (1G). The 1st Generation in cellular networks appeared in the market in 1979 and its principal characteristics were the analogical system and that was just for voice transmission. The quality of link was very poor; it had low speed, around 2,400 bauds. If we are talking about the transfer among cells it became imprecise, because its capabilities were low (It was based in FDMA (Frequency Division Multiple Access)), in addition that system did not have a security scheme. The most important technology in that moment was AMPS (Advanced Mobile Phone System) [1].
Second Generation (2G). The 2G arrived in 1990, the most important characteristic in that technology is that it was digital [1]. The 2G system uses different coding protocols more sophisticated than the last generation and nowadays it is used by the current cell phone systems. The predominant technologies are: GSM (Global System for Mobile Communications); IS-136 (it is known like TIA/EIA136 ó ANSI-136), CDMA (Code Division Multiple Access) y PDC (Personal Digital Communications), this last one it is used in Japan. The protocols employed in the systems 2G can support high speeds of transmitted voice, but it has a limit on data transmission. It is possible to offer auxiliary services like: data fax, SMS (Short Message Service). Most of protocols into 2G offered a lot of different coding levels. At United States 2G are known like PCS [1].
Third Generation (3G).
The main features of the 3G are the voice convergence and wireless access on data, in other words, it can be utilized for multimedia applications and high bit data rates. The protocols have been used by the 3G systems can support high speed of transmission and it is focused to applications beyond the voice, just like audio (MP3), real time video, video conference and the quickly access to the Internet, this only to mentioning some of them.
The next Table shows the comparison about the cell
phone generations. [1]
Table 1: Cell Phone Generations 1G 2G 3G Analogical Digital Digital
Access Techniques
FDMA TDMA CDMA
Services Voice Voice and SMS
Applications video and audio in real time videoconference,
Quickly access to the Internet.
The 3G systems will have to provide support for applications like: • Voice on narrow band on multimedia services in real
time and wide band. • Support on data of high speed to navigate in World
Wide Web, it has to deliver information, as well as, news, traffic, and economy news by pushing techniques and remote wireless access to the Internet and Intranets.
• Unified services of messages like multimedia e-mail. • Applications for business by e- mail, that includes
operations and shopping on line. • Video /audio applications in real time like videophone,
interactive videoconference, a lot of music and special multimedia for medical applications or remote security supervision.
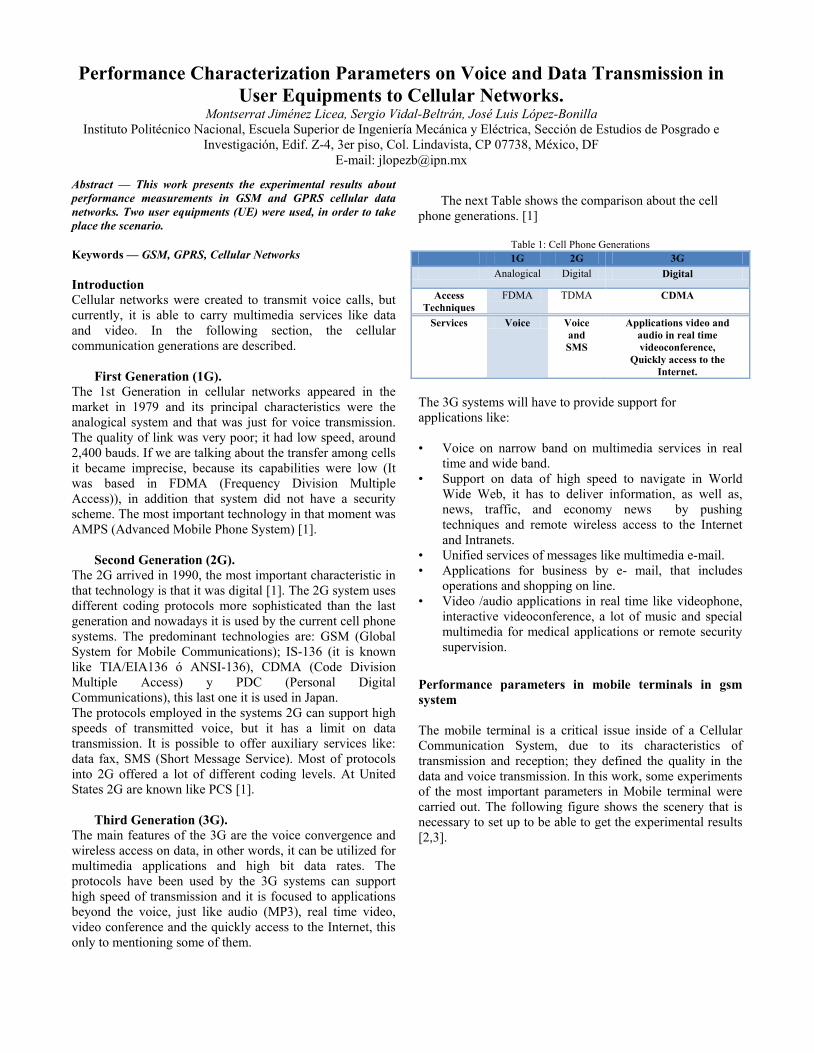
Performance parameters in mobile terminals in gsm system The mobile terminal is a critical issue inside of a Cellular Communication System, due to its characteristics of transmission and reception; they defined the quality in the data and voice transmission. In this work, some experiments of the most important parameters in Mobile terminal were carried out. The following figure shows the scenery that is necessary to set up to be able to get the experimental results [2,3].
Performance Characterization Parameters on Voice and Data Transmission in User Equipments to Cellular Networks.
Montserrat Jiménez Licea, Sergio Vidal-Beltrán, José Luis López-Bonilla Instituto Politécnico Nacional, Escuela Superior de Ingeniería Mecánica y Eléctrica, Sección de Estudios de Posgrado e
Investigación, Edif. Z-4, 3er piso, Col. Lindavista, CP 07738, México, DF E-mail: [email protected]
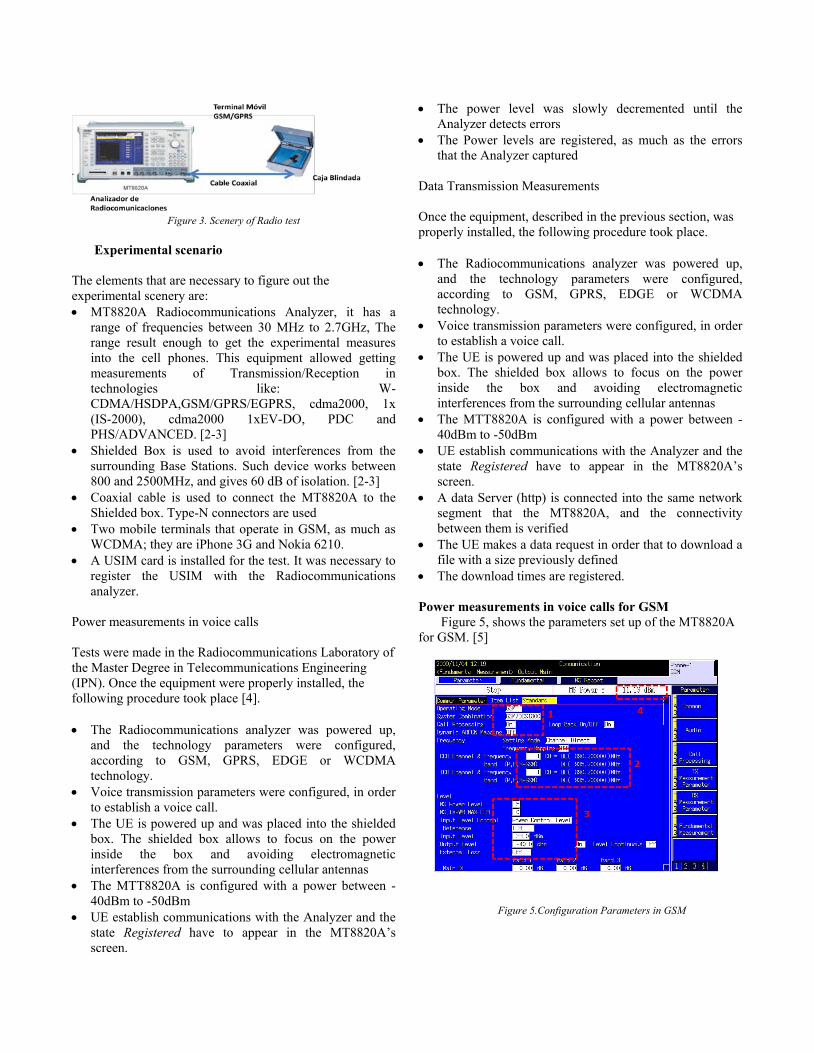
Figure 3. Scenery of Radio test
Experimental scenario
The elements that are necessary to figure out the experimental scenery are: x MT8820A Radiocommunications Analyzer, it has a
range of frequencies between 30 MHz to 2.7GHz, The range result enough to get the experimental measures into the cell phones. This equipment allowed getting measurements of Transmission/Reception in technologies like: W-CDMA/HSDPA,GSM/GPRS/EGPRS, cdma2000, 1x (IS-2000), cdma2000 1xEV-DO, PDC and PHS/ADVANCED. [2-3]
x Shielded Box is used to avoid interferences from the surrounding Base Stations. Such device works between 800 and 2500MHz, and gives 60 dB of isolation. [2-3]
x Coaxial cable is used to connect the MT8820A to the Shielded box. Type-N connectors are used
x Two mobile terminals that operate in GSM, as much as WCDMA; they are iPhone 3G and Nokia 6210.
x A USIM card is installed for the test. It was necessary to register the USIM with the Radiocommunications analyzer.
Power measurements in voice calls Tests were made in the Radiocommunications Laboratory of the Master Degree in Telecommunications Engineering (IPN). Once the equipment were properly installed, the following procedure took place [4]. x The Radiocommunications analyzer was powered up,
and the technology parameters were configured, according to GSM, GPRS, EDGE or WCDMA technology.
x Voice transmission parameters were configured, in order to establish a voice call.
x The UE is powered up and was placed into the shielded box. The shielded box allows to focus on the power inside the box and avoiding electromagnetic interferences from the surrounding cellular antennas
x The MTT8820A is configured with a power between -40dBm to -50dBm
x UE establish communications with the Analyzer and the state Registered have to appear in the MT8820A’s screen.
x The power level was slowly decremented until the Analyzer detects errors
x The Power levels are registered, as much as the errors that the Analyzer captured
Data Transmission Measurements
Once the equipment, described in the previous section, was properly installed, the following procedure took place. x The Radiocommunications analyzer was powered up,
and the technology parameters were configured, according to GSM, GPRS, EDGE or WCDMA technology.
x Voice transmission parameters were configured, in order to establish a voice call.
x The UE is powered up and was placed into the shielded box. The shielded box allows to focus on the power inside the box and avoiding electromagnetic interferences from the surrounding cellular antennas
x The MTT8820A is configured with a power between -40dBm to -50dBm
x UE establish communications with the Analyzer and the state Registered have to appear in the MT8820A’s screen.
x A data Server (http) is connected into the same network segment that the MT8820A, and the connectivity between them is verified
x The UE makes a data request in order that to download a file with a size previously defined
x The download times are registered.
Power measurements in voice calls for GSM Figure 5, shows the parameters set up of the MT8820A
for GSM. [5]
Figure 5.Configuration Parameters in GSM
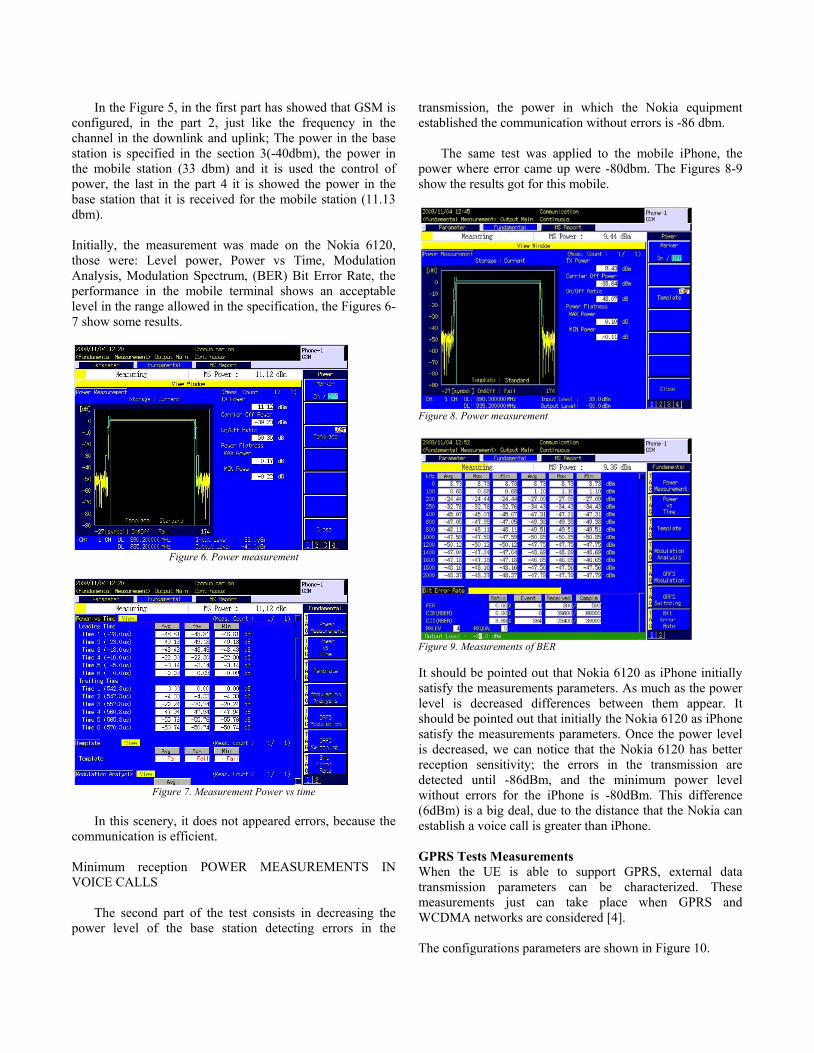
In the Figure 5, in the first part has showed that GSM is configured, in the part 2, just like the frequency in the channel in the downlink and uplink; The power in the base station is specified in the section 3(-40dbm), the power in the mobile station (33 dbm) and it is used the control of power, the last in the part 4 it is showed the power in the base station that it is received for the mobile station (11.13 dbm).
Initially, the measurement was made on the Nokia 6120, those were: Level power, Power vs Time, Modulation Analysis, Modulation Spectrum, (BER) Bit Error Rate, the performance in the mobile terminal shows an acceptable level in the range allowed in the specification, the Figures 6-7 show some results.
Figure 6. Power measurement
Figure 7. Measurement Power vs time
In this scenery, it does not appeared errors, because the
communication is efficient. Minimum reception POWER MEASUREMENTS IN VOICE CALLS
The second part of the test consists in decreasing the
power level of the base station detecting errors in the
transmission, the power in which the Nokia equipment established the communication without errors is -86 dbm.
The same test was applied to the mobile iPhone, the
power where error came up were -80dbm. The Figures 8-9 show the results got for this mobile.
Figure 8. Power measurement
Figure 9. Measurements of BER It should be pointed out that Nokia 6120 as iPhone initially satisfy the measurements parameters. As much as the power level is decreased differences between them appear. It should be pointed out that initially the Nokia 6120 as iPhone satisfy the measurements parameters. Once the power level is decreased, we can notice that the Nokia 6120 has better reception sensitivity; the errors in the transmission are detected until -86dBm, and the minimum power level without errors for the iPhone is -80dBm. This difference (6dBm) is a big deal, due to the distance that the Nokia can establish a voice call is greater than iPhone. GPRS Tests Measurements When the UE is able to support GPRS, external data transmission parameters can be characterized. These measurements just can take place when GPRS and WCDMA networks are considered [4]. The configurations parameters are shown in Figure 10.
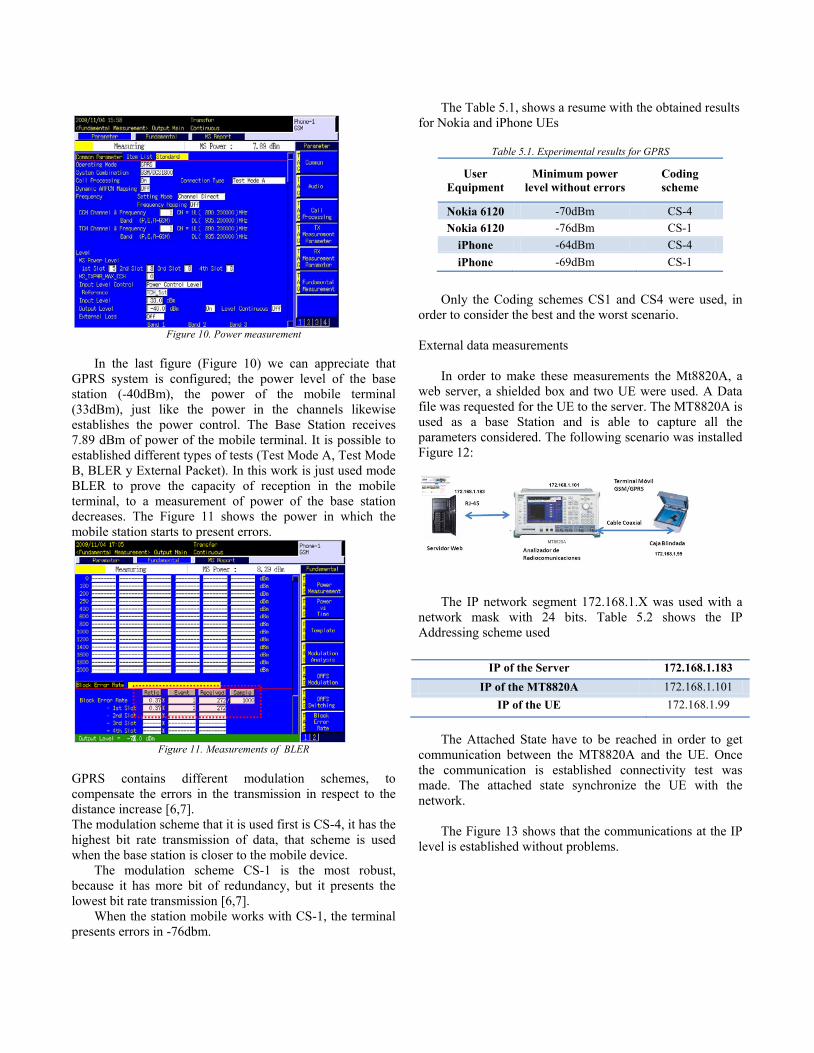
Figure 10. Power measurement
In the last figure (Figure 10) we can appreciate that
GPRS system is configured; the power level of the base station (-40dBm), the power of the mobile terminal (33dBm), just like the power in the channels likewise establishes the power control. The Base Station receives 7.89 dBm of power of the mobile terminal. It is possible to established different types of tests (Test Mode A, Test Mode B, BLER y External Packet). In this work is just used mode BLER to prove the capacity of reception in the mobile terminal, to a measurement of power of the base station decreases. The Figure 11 shows the power in which the mobile station starts to present errors.
Figure 11. Measurements of BLER
GPRS contains different modulation schemes, to compensate the errors in the transmission in respect to the distance increase [6,7]. The modulation scheme that it is used first is CS-4, it has the highest bit rate transmission of data, that scheme is used when the base station is closer to the mobile device.
The modulation scheme CS-1 is the most robust, because it has more bit of redundancy, but it presents the lowest bit rate transmission [6,7].
When the station mobile works with CS-1, the terminal presents errors in -76dbm.
The Table 5.1, shows a resume with the obtained results for Nokia and iPhone UEs
Table 5.1. Experimental results for GPRS
User Equipment
Minimum power level without errors
Coding scheme
Nokia 6120 -70dBm CS-4 Nokia 6120 -76dBm CS-1
iPhone -64dBm CS-4 iPhone -69dBm CS-1
Only the Coding schemes CS1 and CS4 were used, in order to consider the best and the worst scenario.
External data measurements
In order to make these measurements the Mt8820A, a
web server, a shielded box and two UE were used. A Data file was requested for the UE to the server. The MT8820A is used as a base Station and is able to capture all the parameters considered. The following scenario was installed Figure 12:
The IP network segment 172.168.1.X was used with a
network mask with 24 bits. Table 5.2 shows the IP Addressing scheme used
IP of the Server 172.168.1.183 IP of the MT8820A 172.168.1.101
IP of the UE 172.168.1.99
The Attached State have to be reached in order to get
communication between the MT8820A and the UE. Once the communication is established connectivity test was made. The attached state synchronize the UE with the network.
The Figure 13 shows that the communications at the IP
level is established without problems.
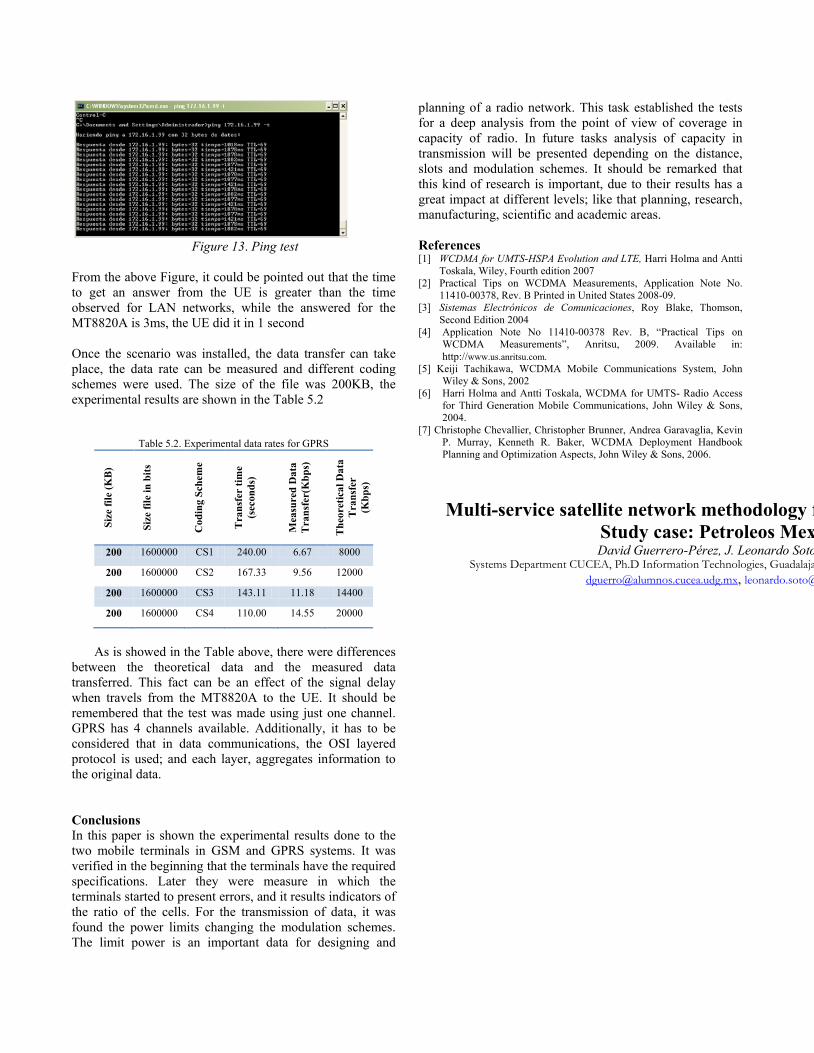
Figure 13. Ping test
From the above Figure, it could be pointed out that the time to get an answer from the UE is greater than the time observed for LAN networks, while the answered for the MT8820A is 3ms, the UE did it in 1 second Once the scenario was installed, the data transfer can take place, the data rate can be measured and different coding schemes were used. The size of the file was 200KB, the experimental results are shown in the Table 5.2
Table 5.2. Experimental data rates for GPRS
Size
file
(KB
)
Size
file
in b
its
Cod
ing
Sche
me
Tra
nsfe
r tim
e (s
econ
ds)
Mea
sure
d D
ata
Tra
nsfe
r(K
bps)
The
oret
ical
Dat
a T
rans
fer
(Kbp
s)
200 1600000 CS1 240.00 6.67 8000
200 1600000 CS2 167.33 9.56 12000
200 1600000 CS3 143.11 11.18 14400
200 1600000 CS4 110.00 14.55 20000
As is showed in the Table above, there were differences
between the theoretical data and the measured data transferred. This fact can be an effect of the signal delay when travels from the MT8820A to the UE. It should be remembered that the test was made using just one channel. GPRS has 4 channels available. Additionally, it has to be considered that in data communications, the OSI layered protocol is used; and each layer, aggregates information to the original data.
Conclusions In this paper is shown the experimental results done to the two mobile terminals in GSM and GPRS systems. It was verified in the beginning that the terminals have the required specifications. Later they were measure in which the terminals started to present errors, and it results indicators of the ratio of the cells. For the transmission of data, it was found the power limits changing the modulation schemes. The limit power is an important data for designing and
planning of a radio network. This task established the tests for a deep analysis from the point of view of coverage in capacity of radio. In future tasks analysis of capacity in transmission will be presented depending on the distance, slots and modulation schemes. It should be remarked that this kind of research is important, due to their results has a great impact at different levels; like that planning, research, manufacturing, scientific and academic areas. References [1] WCDMA for UMTS-HSPA Evolution and LTE, Harri Holma and Antti
Toskala, Wiley, Fourth edition 2007 [2] Practical Tips on WCDMA Measurements, Application Note No.
11410-00378, Rev. B Printed in United States 2008-09. [3] Sistemas Electrónicos de Comunicaciones, Roy Blake, Thomson,
Second Edition 2004 [4] Application Note No 11410-00378 Rev. B, “Practical Tips on
WCDMA Measurements”, Anritsu, 2009. Available in: http://www.us.anritsu.com.
[5] Keiji Tachikawa, WCDMA Mobile Communications System, John Wiley & Sons, 2002
[6] Harri Holma and Antti Toskala, WCDMA for UMTS- Radio Access for Third Generation Mobile Communications, John Wiley & Sons, 2004.
[7] Christophe Chevallier, Christopher Brunner, Andrea Garavaglia, Kevin P. Murray, Kenneth R. Baker, WCDMA Deployment Handbook Planning and Optimization Aspects, John Wiley & Sons, 2006.
Multi-service satellite network methodology f
Study case: Petroleos Mex David Guerrero-Pérez, J. Leonardo Soto
Systems Department CUCEA, Ph.D Information Technologies, Guadalaja [email protected], leonardo.soto@
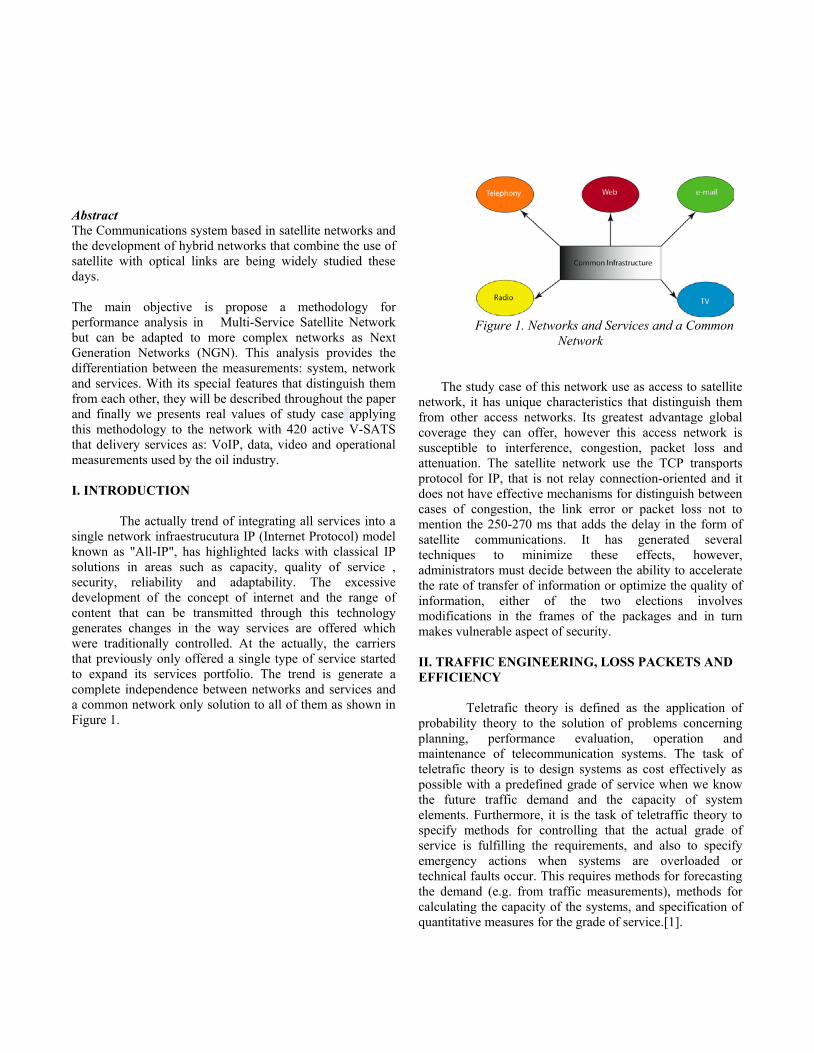
Abstract The Communications system based in satellite networks and the development of hybrid networks that combine the use of satellite with optical links are being widely studied these days. The main objective is propose a methodology for performance analysis in Multi-Service Satellite Network but can be adapted to more complex networks as Next Generation Networks (NGN). This analysis provides the differentiation between the measurements: system, network and services. With its special features that distinguish them from each other, they will be described throughout the paper and finally we presents real values of study case applying this methodology to the network with 420 active V-SATS that delivery services as: VoIP, data, video and operational measurements used by the oil industry. I. INTRODUCTION
The actually trend of integrating all services into a single network infraestrucutura IP (Internet Protocol) model known as "All-IP", has highlighted lacks with classical IP solutions in areas such as capacity, quality of service , security, reliability and adaptability. The excessive development of the concept of internet and the range of content that can be transmitted through this technology generates changes in the way services are offered which were traditionally controlled. At the actually, the carriers that previously only offered a single type of service started to expand its services portfolio. The trend is generate a complete independence between networks and services and a common network only solution to all of them as shown in Figure 1.
Figure 1. Networks and Services and a Common
Network
The study case of this network use as access to satellite network, it has unique characteristics that distinguish them from other access networks. Its greatest advantage global coverage they can offer, however this access network is susceptible to interference, congestion, packet loss and attenuation. The satellite network use the TCP transports protocol for IP, that is not relay connection-oriented and it does not have effective mechanisms for distinguish between cases of congestion, the link error or packet loss not to mention the 250-270 ms that adds the delay in the form of satellite communications. It has generated several techniques to minimize these effects, however, administrators must decide between the ability to accelerate the rate of transfer of information or optimize the quality of information, either of the two elections involves modifications in the frames of the packages and in turn makes vulnerable aspect of security. II. TRAFFIC ENGINEERING, LOSS PACKETS AND EFFICIENCY
Teletrafic theory is defined as the application of probability theory to the solution of problems concerning planning, performance evaluation, operation and maintenance of telecommunication systems. The task of teletrafic theory is to design systems as cost effectively as possible with a predefined grade of service when we know the future traffic demand and the capacity of system elements. Furthermore, it is the task of teletraffic theory to specify methods for controlling that the actual grade of service is fulfilling the requirements, and also to specify emergency actions when systems are overloaded or technical faults occur. This requires methods for forecasting the demand (e.g. from traffic measurements), methods for calculating the capacity of the systems, and specification of quantitative measures for the grade of service.[1].

The packages are fighting for the use of network resources when they are transported across the network. A resource network is considered congested if the packet input speed exceeds the output capacity of the resource in a time interval. Congestion can cause some incoming packets are delayed or even discarded.
In cases of congestion on some links, the problem
was resolved on the basis of adding more capacity. The other cause of congestion is the inefficient use of resources due to the mapping of traffic. The idea is to optimally balance the utilization of these resources so that there are some who are over used, creating bottlenecks, while others may be underutilized [1]. The theory strongly depends on the type of traffic in the network. So, we need first to classify telecommunications networks and then to establish appropriate theory for various traffic types.The homogeneous type is used to describe classical telecommunications service based on voice transmission and switching. The heterogeneous type includes integrated traffic streams from different sources (voice, audio, video, data) into a single network. Based on the type of access network, we categorize telecommunications networks into wired (fixed) access networks and wireless (mobile) access networks[2].
These fundamentals are valid for any telecommunications network however for wireless access such as the satellite is to characterize the availability of the station to transmit and receive information that is independent of any other either by location or weather conditions and even same link. Model Error Markov (Link State)
One way to model the bit error on the wireless link is by applying a uniform error model, where errors occur continuously in time with some probability. However, the loss characteristics of the wireless channels have been empirically observed to be bursty due to various fading effects [4]. One of the most used models for time-varying wireless link errors is the two-state Markov model.
The Markov error model has two states: error state and error-free state, each having its own distribution. When a channel is in error-state, any IP packets sent would be either lost or corrupted. In the error-free state all packets are successfully transmitted over the wireless link. One should know that this characteristic of the wireless link is associated with a single user, not with all active users. In other words, each user has its own Markov error model (i.e., some users may be experiencing an error state at a given
time interval, while others may have error-free transmission). This effect is a result of location dependence of errors as well as mobility the users. In the Markov model the length of stay in each state can be expressed in terms of transitional probabilities, as shown in figure 3[2].
Figura 3. Two-state Markov error model
We label the error state with E, and the error-free
state with F. Let us denote with LE y LF means lengths of error and error-free state, respectively. If the length of each of the states is geometrically distributed, then the transition probability from error to error-free state PEF and the transition probability in the reverse direction PFE can be expressed by [2]:
PEF 1LE
(1)
PFE 1LF
(2)
Loss Packets Flows
Each IP packet transmited on the network may be dropped by one of the network nodes due to limited buffer space or high delay. We define a packet loss Lj as ratio of total length (in bytes or bits) of all packet losses and total length of all generated packets within a flow j [2].
(3)
Buffering in the network nodes adds delay and also adds delay variation due to the different load at the nodes on the packets’ path. If we denote with nodesN the number of
nodes on the flow path, and with D(n) we denote the delay due to buffering at node n, then the mean packet delay of the flow j may be calculated by using the following: [2].
Dj 1
N j
Djk(i )
k 1
N j
¦i 1
Nnodes
¦ (4)
Where jN is the number of all packets from flow j Frame Performance Efficiency
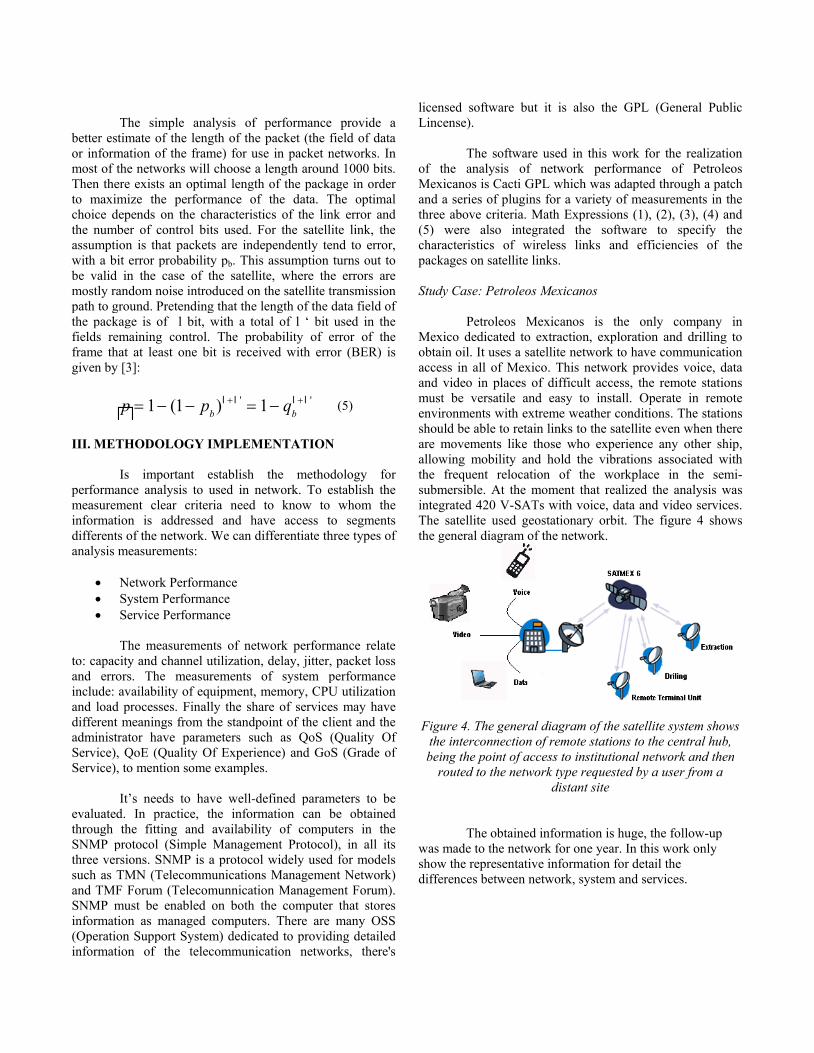
The simple analysis of performance provide a
better estimate of the length of the packet (the field of data or information of the frame) for use in packet networks. In most of the networks will choose a length around 1000 bits. Then there exists an optimal length of the package in order to maximize the performance of the data. The optimal choice depends on the characteristics of the link error and the number of control bits used. For the satellite link, the assumption is that packets are independently tend to error, with a bit error probability pb. This assumption turns out to be valid in the case of the satellite, where the errors are mostly random noise introduced on the satellite transmission path to ground. Pretending that the length of the data field of the package is of l bit, with a total of l ‘ bit used in the fields remaining control. The probability of error of the frame that at least one bit is received with error (BER) is given by [3]:
� p 1� (1� pb )l � l ' 1� qbl � l ' (5)
III. METHODOLOGY IMPLEMENTATION
Is important establish the methodology for performance analysis to used in network. To establish the measurement clear criteria need to know to whom the information is addressed and have access to segments differents of the network. We can differentiate three types of analysis measurements:
x Network Performance x System Performance x Service Performance
The measurements of network performance relate
to: capacity and channel utilization, delay, jitter, packet loss and errors. The measurements of system performance include: availability of equipment, memory, CPU utilization and load processes. Finally the share of services may have different meanings from the standpoint of the client and the administrator have parameters such as QoS (Quality Of Service), QoE (Quality Of Experience) and GoS (Grade of Service), to mention some examples.
It’s needs to have well-defined parameters to be evaluated. In practice, the information can be obtained through the fitting and availability of computers in the SNMP protocol (Simple Management Protocol), in all its three versions. SNMP is a protocol widely used for models such as TMN (Telecommunications Management Network) and TMF Forum (Telecomunnication Management Forum). SNMP must be enabled on both the computer that stores information as managed computers. There are many OSS (Operation Support System) dedicated to providing detailed information of the telecommunication networks, there's
licensed software but it is also the GPL (General Public Lincense).
The software used in this work for the realization of the analysis of network performance of Petroleos Mexicanos is Cacti GPL which was adapted through a patch and a series of plugins for a variety of measurements in the three above criteria. Math Expressions (1), (2), (3), (4) and (5) were also integrated the software to specify the characteristics of wireless links and efficiencies of the packages on satellite links. Study Case: Petroleos Mexicanos
Petroleos Mexicanos is the only company in Mexico dedicated to extraction, exploration and drilling to obtain oil. It uses a satellite network to have communication access in all of Mexico. This network provides voice, data and video in places of difficult access, the remote stations must be versatile and easy to install. Operate in remote environments with extreme weather conditions. The stations should be able to retain links to the satellite even when there are movements like those who experience any other ship, allowing mobility and hold the vibrations associated with the frequent relocation of the workplace in the semi-submersible. At the moment that realized the analysis was integrated 420 V-SATs with voice, data and video services. The satellite used geostationary orbit. The figure 4 shows the general diagram of the network.
Figure 4. The general diagram of the satellite system shows the interconnection of remote stations to the central hub, being the point of access to institutional network and then
routed to the network type requested by a user from a distant site
The obtained information is huge, the follow-up was made to the network for one year. In this work only show the representative information for detail the differences between network, system and services.
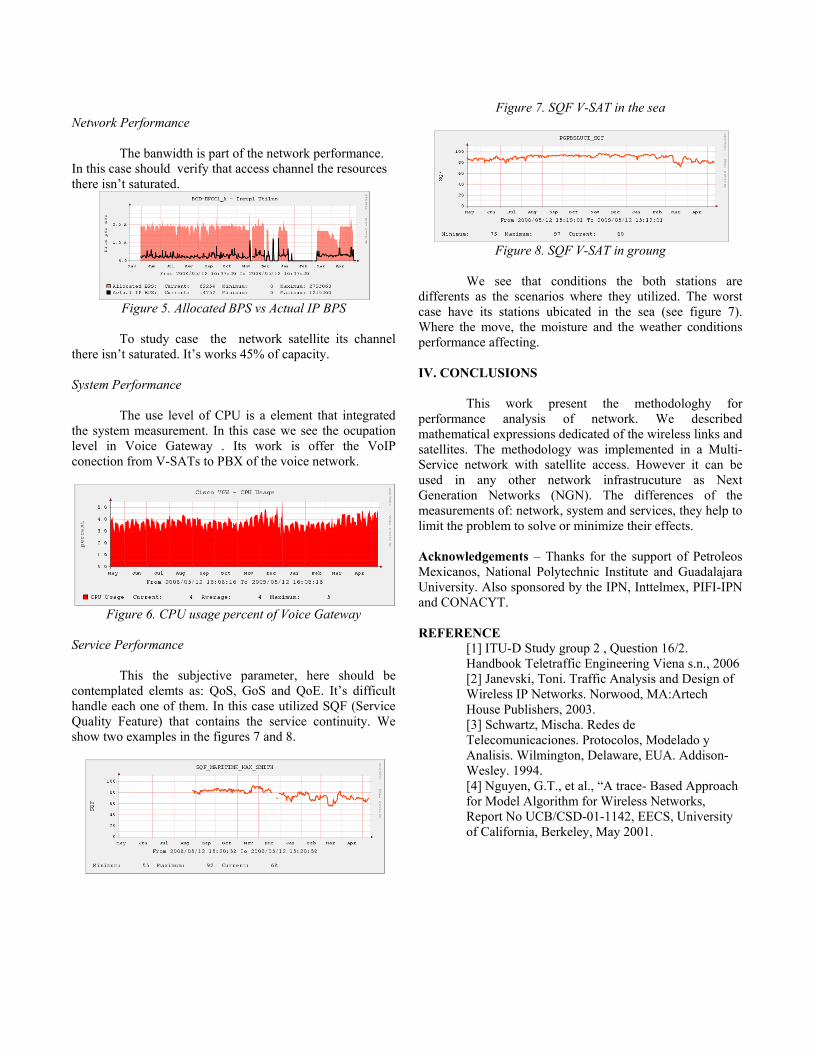
Network Performance
The banwidth is part of the network performance. In this case should verify that access channel the resources there isn’t saturated.
Figure 5. Allocated BPS vs Actual IP BPS
To study case the network satellite its channel
there isn’t saturated. It’s works 45% of capacity. System Performance
The use level of CPU is a element that integrated the system measurement. In this case we see the ocupation level in Voice Gateway . Its work is offer the VoIP conection from V-SATs to PBX of the voice network.
Figure 6. CPU usage percent of Voice Gateway
Service Performance
This the subjective parameter, here should be contemplated elemts as: QoS, GoS and QoE. It’s difficult handle each one of them. In this case utilized SQF (Service Quality Feature) that contains the service continuity. We show two examples in the figures 7 and 8.
Figure 7. SQF V-SAT in the sea
Figure 8. SQF V-SAT in groung
We see that conditions the both stations are
differents as the scenarios where they utilized. The worst case have its stations ubicated in the sea (see figure 7). Where the move, the moisture and the weather conditions performance affecting. IV. CONCLUSIONS
This work present the methodologhy for performance analysis of network. We described mathematical expressions dedicated of the wireless links and satellites. The methodology was implemented in a Multi-Service network with satellite access. However it can be used in any other network infrastrucuture as Next Generation Networks (NGN). The differences of the measurements of: network, system and services, they help to limit the problem to solve or minimize their effects.
Acknowledgements – Thanks for the support of Petroleos Mexicanos, National Polytechnic Institute and Guadalajara University. Also sponsored by the IPN, Inttelmex, PIFI-IPN and CONACYT. REFERENCE
[1] ITU-D Study group 2 , Question 16/2. Handbook Teletraffic Engineering Viena s.n., 2006 [2] Janevski, Toni. Traffic Analysis and Design of Wireless IP Networks. Norwood, MA:Artech House Publishers, 2003. [3] Schwartz, Mischa. Redes de Telecomunicaciones. Protocolos, Modelado y Analisis. Wilmington, Delaware, EUA. Addison-Wesley. 1994. [4] Nguyen, G.T., et al., “A trace- Based Approach for Model Algorithm for Wireless Networks, Report No UCB/CSD-01-1142, EECS, University of California, Berkeley, May 2001.
Instrucciones para los autores Los artículos que se someten a CISCE deben contener resultados inéditos y originales, no haber sido publicados con anterioridad ni haber sido sometidos simultáneamente a otra revista científica. Si el artículo ha sido presentado, sometido o publicado en alguna otra parte, deberá informarse al coordinador editorial. Los artículos deben ajustarse a las siguientes especificaciones: o Idioma Inglés (anexar un resumen y palabras clave en español) o Idioma Español (anexar un resumen y palabras clave en Inglés) o Procesador de texto admitido: MS-Word. o Tamaño de página: carta , utilizar un solo lado de la hoja. Máximo 10 páginas. o Márgenes: izquierdo 2.5 cm y derecho 2 cm., superior 2.5 cm e inferior 2.5 cm. o Autores: primer nombre seguido de los dos apellidos (sin abreviaturas), abajo: afiliación y e-mail. o Tipo de letra del texto regular: Times o Times New Roman de 10 pt (título original 22 pt; secciones 11.5 pt, subsecciones 11.5 pt, en negritas). o Texto: a una columna y con espaciado sencillo (renglón seguido). o Resumen/Abstract: entre 70 y 150 palabras, colocado al principio del texto, seguido del de Español o inglés según sea el caso. o Palabras clave/Keywords: colocadas después del resumen en negritas, y no más de 10. o Imágenes y fotografías: deben ser de alta calidad, con colores bien definidos y contrastantes, en mapa de bits (no sectorizadas) en formato JPG e incrustadas en el texto de forma que se puedan manipular independiente. o Fórmulas: Deberán de presentarse en formato de tabla sin bordes, centradas y la numeración de c/u justificada a la derecha con negritas en mapa de bits, no vectorizadas. o Pies de figura. Deben mencionarse dentro del texto y numerarse de manera consecutiva con un tipo de letra Times New Roman 9 puntos o Cabecera de tabla. Deberá presentase en la parte superior de la tabla un numeración consecutiva y descripción con tipo de letra Times New Roman 9 o Referencias: En cualquier caso el nombre del autor del artículo o publicación web deberá mostrarse al principio. Deberán ordenarse conforme aparezcan dentro del texto encerradas entre paréntesis FXDGUDGR�ʊ>�@ۅ��$�FRQWLQXDFLyQ�DOJXQRV�HMHPSORV� [1]. Baldonado, M., Chang, C.-C.K., Gravano, L., Paepcke, A.: The Stanford Digital Library Metadata Architecture. Int. J. Digit. Libr. 1 (1997) 108–121 [2+. Bruce, K.B., Cardelli, L., Pierce, B.C.: Comparing Object Encodings. In: Abadi, M., Ito, T. (eds.): Theoretical Aspects of Computer Software. Lecture Notes in Computer Science, Vol. 1281. Springer-Verlag, Berlin Heidelberg New York (1997) 415–438 [3]. van Leeuwen, J. (ed.): Computer Science Today. Recent Trends and Developments. Lecture Notes in Computer Science, Vol. 1000. Springer-Verlag, Berlin Heidelberg New York (1995) [4]. Michalewicz, Z.: Genetic Algorithms + Data Structures = Evolution Programs. 3rd edn. Springer-Verlag, Berlin Heidelberg New York (1996) Instrucciones: Enviar el archivo en extenso a la siguiente dirección electrónica: [email protected] Los revisores técnicos le harán llegar sus observaciones y modificaciones, las cuales deberá realizar y reenviar el archivo corregido al correo arriba mencionado. El comité editorial se comunicara mediante correo electrónico indicándole la aceptación o rechazo del artículo.
Reserva de Derechos 04-2008-101012293000-102