Embed Size (px)
Citation preview

Trans. Nat. Acad. Science & Tech. (Phi/s.) 1 988: 1 0: 85·1 03
REVERSE OSMOSIS AND ULTRAFILTRATION IN COCONUT PROCESSING AND BY-PRODUCT UTILIZATION
Ernesto J. del Rosario Institute of Chemistry
University of the Philippines at Los Banos CoUege, Laguna
Philippines
ABSTRACT Reverse osmosis (RO) and ultrafiltration (UF) are pressure-driven mem
brane processes which allow preferential passage of molecules across permselec
tive barriers. RO (hyperftltration) was used to concentrate coconut water in a plate-and-frame equipment using either cellulose acetate or composite membranes.
Maximal concentrations of 16.2, 9.0 and 0.7% for sugar, sugar alcohol and protein, respectively, were obtained using 90 composite membranes. The highest value of the ratio of final to initial carbohydrate concentration in the retentate was found to be 5 .6. A drastic reduction in permeate flux during RO was accompanied by decreasing values with time of the permeation coefficient due to membtane fouling.
RO was also applied to sugar alcohol recovery from coconut water after ethanol fermentation by yeast. Sorbitol and mannitol were recovered in the reten
tate, while ethanol went into the permeaw. Preliminary results showed that UF
appears promising for fractioning coconut oil and protein through the aqueous
process.
Introduction
Principles of Pressure-Driven Membrane Filtration
Pressure-driven membrane filtration processes, for liquids in the absence of either phase change or <!Il applied electric field include microfiltration (MF), ultrafiltration (UF) and reverse osmosis (RO). These are differentiated by the pore size of the permselective membrane and trans-membrane pressure. Microfiltration membranes have pore diameters greater than 1 00 A (lA = 10- lOm) and are able to retain bacterial cells. Microftltration is a low-pressure process which requires typically 1 0 psi ('V70 kPa). On the other hand, ultrafiltration operates up to a pressure of 1 50 psi ('VI MPa) and uses membranes with pore diameters in the range 10-200 A which could fractionate peptides, proteins and viruses. Reverse osmosis is a high pressure (> I MPa) membrane process which uses tight membranes (pore diameter
85

86 Transactions National Academy of Science
< 1 0 A) and can concentrate small solute molecules (such as glucose) and salts in addition to macromolecules. Reverse osmosis is also called hyperllltration.
The basic principles involved in these processes, as well as description of membrane characteristics, are discussed in several books and proceedings of conferences/workshops/short courses (Mem Tech 80 ; ASEAN Mem Tech 82, 86; IMTECH 83; Fane, 1985 ; Sourirajan and Matsuura, 1985 ; ASEAN Mem Tech 87). Membrane separations depend on the physico-chemical properties of both membrane and diffusing species. The permeate (solvent) flux and solute rejection coefficient are two important operational variables which determine practicality and cost. Numerous types of membranes and equipment modules are commercially available with varying suitability to specific applications.
Normal osmosis is defmed as molecular diffusion or permeation across a membrane along a (decreasing) concentration gradient. As shown schematically in Figure 1 , the solvent molecules diffuse across the semi-permeable membrane, which is permeable only to solvent, towards the more concentrated solution. The driving pressure for this process is known as osmotic pressure, which is approximately proportional to the concentration of the solution. Normal osmosis proceeds until equilibrium is attained, i.e. when the hydrostatic pressure of the column of solution equals the osmotic pressure difference (lm) of the two solutions.
concentrated dilute aolution solution
NORMAL OSMOSIS
. . . . . . . . . . . . . . : : : : : : : I NO : : : : : : : I • . . · · . · FLOW : : : : : : : 1 : : : : : : : . . . . . . . . • • . � • . . I . . . . . . .
EQUILIBRIUM
F@we 1 . Schematic diapam of nounal and reverie o1111osis.
applied pres sure
.lJ.
: : : : : : : . 1 . . . . . . . . : � : : : : : : 1
REVERSE OSMOSIS

del Rosario, Reverse Osmosis and Ultraiutration Processing 87
On the other hand, reverse osmosis (RO) is diffusion of solvent molecules across a membrane from the concentrated to the dilute solution, i.e. along an increasing concentration gradient of solvent. In order to accomplish this, pressure (> l MPa) is applied on the concentrated solution, as shown in Figure 1 , which is greater than the osmotic pressure difference of the solutions.
Among the hypothetical models that have been suggested for RO and UF, the two most important and plausible ones are the solution-diffusion and surface forcepore flow models (Rhumiratana, 1 98 7 ; Sourirajan and Matsuura, 1 985). In the fust-named model, both solute and solvent are presumed to dissolve in and then diffuse through the membrane phase. Solutes are rejected by the membrane depending on their corresponding memb rane solubilities while solute flux depends on the solute concentration difference across the membrane. On the other hand, solvent flux through the membrane is proportional to the pressure gradient.
Based on the general assumptions given above, the following equations may be formulated:
Where J l J2 tJ> 6:rr A Ks �2
= =
=
=
=
= =
J 1 = A (& - �n') J2 = K2 � C2
solvent (water) flux solute flux hydraulic pressure difference across the membrane osmotic pressure difference across the membrane hydraulic permeability coefficient of membrane solute permeability coefficient of membrane solute concentration difference across the membrane
(I)
(2)
According to the surface force-pore flow (or porous flow) model, the membrane consists of pores which connect the membrane surfaces rather than being a water-swollen polymer network. Furthermore, a solute-deficient water layer is assumed to form in contact with the membrane polyer walls. This modified water layer flows through the membrane pores in response to the applied pressure gradient. The differential permeation of solutes across the membrane may be explained in terms of differences in solute absorption on the polymer surface and hence on solute enrichment of the modified water layer. This model has been developed in detail by Sourirajan and Matsuura ( 1 985) and applied to explain both reverse osmosis/ultrafiltration data and results of liquid chromatography. Unfortunately, the mathematics of this model is very complex in contrast to the solutiondiffusion model.
An important aspect of pressure-driven membrane flltration, in terms of both theoretical and practical considerations, is membrane fouling or flux reduction. Several models have been suggested to account for fouling phenomena in reverse osmosis and ultrafiltration (cf. review of Suki, 1 987). For example, in terms of Eq ( 1 ) a reduction in permeate flux J 1 can be due to an increase in osmotic

88 Transactions National Academy of Science
pressure difference (.6.7r) due to solute buildup on the membrane surface (retentate side). This is popularly known as concentration polarization. Alternatively, a reduced J 1 value could be explained by an increase in the hydraulic resistance of the membrane, i.e. smaller value of the permeation coefficient A, as a result of solute deposition on the membrane. In all cases, flux decline reduces the separation efficiency and increases the duration and cost of filtration.
Membrane Filtration in Coconut Processing
Previous research on the applications of ultrafiltration in coconut processing has been done by Hagenmaier (1 980) who concentrated coconut skim milk prepared through the aqueous process. UF equipment from three manufacturers were tested in terms of operating characteristics; the UF skim milk concentrate was then spray dried and evaluated for food applications.
The concentration of coconut water by reverse osmosis is a promising approach to the large-scale utilization of this voluminous and dilute effluent especially in desiccated coconut factories which discard this waste in large volumes. Fresh coconut water from mature dry nuts contain approximately 3% sucrose and invert sugar, 1 % sorbitol and less than 0.3% of other simple sugars and mannitol ; the protein content is generally less than 0.2% (del Rosario et aL , 1 984). The dense RO membrane would allow only water and some salts to pass through the membrane as permeat while retaining the carbohydrates and proteins in the retentate. The prepared RO concentrate may be used as fermentation or health drink, as well as for medical and physiological uses, tissue culture and other applications. Early studies on the reverse osmosis of coconut water, which were preliminary in nature, had been reported by researchers in the Philippines (Bergonia et al. , 1 982) and Thailand (Putranon et al. , 1 983). More extensive research work by the first-named group employed either cellulose acetate (del Rosario et al. , 1986) or composite membranes (del Rosario et al., 1 988).
The present paper is a review of research done so far in the author's laboratory on the applications of reverse osmosis in the preparation of coconut water concentrates, in sugar alcohol recovery from coconut water and in the ultrafiltration of coconut emulsion "gata".
Materials and Methods
Reverse osmosis of coconut water
Fresh and undiluted coconut water was obtained from Blue Bar Coconut Phils. and New Sun-Ripe Coconut Products, Inc., desiccated coconut factories located in Tiaong, Quezon and Magdalena, Laguna, respectively. At the frrst-named factory, the pared meats were opened with a knife and the coconut water collected in plastic containers and then pre-ftltered through a 2-mm (mesh) wire screen and 75 micron metal screen of a liquatex Separator (Model L 44. 1 0) before entering

del Rosario, Reverse Osmosis and Ultrafiltration Processing 89
the reverse osmosis tank. Samples of deionized coconut water were prepared by passing the samples through a mixed bed ion exchangers. At the Sun-Ripe factory, the pared meats were passed through a conveyor-type slicing machine where the coconut water was collected, placed in plastic containers and then fJ.ltered through a wire screen (80- 1 00 mesh) before entering an Alfa-Laval 3-way centrifuge. The centrifuge coconut water was pasteurized at 93-95°C in an .APV pasteurizer (a modified APV Paraflow Plate Heat Exchanger Unit, Type Junior W875 ; 350 L/h liquid capacity), stored in a 200-liter stainless steel container and then pumped into the reverse osmosis tank where it was maintained at constant volume.
A DDS plate-and-frame Lab-Unit HF 30-4.5 reverse osmosis module (Baegsverd, Denmark) was used; the process flow sheet and equipment configuration is shown in Figure 2. Two membrane types were used, namely cellulose acetate cast directly on filter paper (DDS type 995 PPI) and composite membrane (DDS type HR 98), both with a molecular weight cut-off of less than 500 daltons. Eightly six cellulose acetate membranes were used during reverse osmosis of the coconut water samples from the Blue Bar factory while 72 or 90 composite membranes were utilized for coconut water from the Sun-Ripe factory.
Hype.rfiltration at 2, 3 and 4 MPa inlet pressures was conducted for three or five hours at 34-42"'C. Samples of retentate (concentrate) and permeate were collected and the permeate flux was determined every 30 minutes. The volume of con-
Concentrated Coconut Water { CONCENTRAT E )
¢= P E RMEATE
Feed retentote
Spa,;er plate
Figure 2. Flow sheet and module confJguration (with magni.flcation) of reserve osmosis.

90 Transactions National Academy of Science
centrate was maintained at 40-45 L by continuously replacing the lost permeate with fresh preftltered coconut water. Samples for later analysis were frozen in order to prevent deterioration. Electrical conductivities were measured using a portable conductivity meter (YST Model 33 S-C-T). The samples were analyzed for sugar alcohol using Caday's modification (1 979) of the periodate-chromotropic acid method of Corcoran and Page (1974) and protein using the method of Lowry et al, (195 1). Total sugars were determined using the method of Dubois et al , (1 956).
Ethanol fermentation and sorbitol recovery
The sugars in the RO coconut water concentrate were fermented into ethanol using a tubular fermenter containing carrageenan-immobilized yeast (del Rosario et al., 1985; Tiong, 1987). The fermented product was then hyperftltered in the RO equipment containing 86 composite membranes using procedures which were earlier described in this paper. Quantification of specific sugars and sugar alcohols was done by high performance liquid chromatography (del Rosario et al., I984; Tiong, I987).
Ultrafiltration of coconut milk emulsion
A 400-mL stirred UF cell (Amicon, Corp. Danvers, Mass. , USA) fitted with an Amicon membrane was used for the experiments. Sixty milliliters of coconut milk, whose dilution and pH were earlier adjusted, were transferred into the UF cell and then magnetically stirred and placed under the required nitrogen gas pressure.
After 40 mL of the ultraftltrate had been collected the cylinder valve was closed and the pressure-relief valve of the cell was opened. Another 20 mL of distilled water were added to the retentate and ultrafiltration was continued until a total of 60 mL of ultraftltrate had been collected. The retentate was quantitatively transferred to a beaker with careful washing with 40 mL distilled water. If there were changes in the pH of the retentate, the pH was restored to the original value by dropwise addition of I N NaOH or I N HCl. The retentate was then blended, pasteurized and the oil, protein, total phosphorus, lipid phosphorus and total sugars were determined using standard procedures (Monera, I980).
Results and Discussion
The time profiles of the fluxes of distilled water and coconut water permeate through the 8 6 cellulose acetate (CA) membranes, whose total are is 4.3m2 , are presented in Figure 3. An initial sharp decline in the fluxes was observed during reverse osmosis. Nevertheless, after about three hours the fluxes reached relatively constant values. Similar results were obtained using composite membranes. The final electrical conductivities for permeate and retentate were 7-9 and I 6-20 mho/em, respectively for CA membranes; the corresponding values for composite membranes were 1 .0-2.6 and I 5-25 mho/em.

del Rosario, Reverse Osmosis and Ultrafiltration Processing
50 � ��'-
4 0 ·'-�'n- ....
water f lux per meate flux A- · - · -·-·-A 2 MPa D • 3 MPa 0- - - - - - -· 4 MPa
91
.c \ 'i::i�B ... -�-· -A A A ' -b.:;S·- tJ:-· -�·-·-�· -·�·-·-A·-· -A· -·-� \ - - - ::::s:::::g=--=8--g-g-g \ -- - -- ---\ \ --: .
)( .,,
....... ...J
:;) 2 0 � lL '· ''• '·.& ',
'· •, '·• '· ""' - .... 1 0
.._. . -- -t:::-::J�I::.:::.t--· - ----· - · - ·-·- �a. ·=•· -· -• I I I I I .J.. J: �
0 . 0 1 . 0 2 .0 3 . 0 4 . 0 Time ( h )
5.0
Figure 3 . Reverse osmosis water flux and permeate flux of coconut water at different inlet pressures using cellulose acetate membranes.
The time profiles of total sugar and sugar alcohol concentrations in the retentates are presented in Figure 4 for CA membranes and Figure 5 for composite membranes. Generally, hyperbolic curves were obtained corresponding to increasing solute concentrations as reverse osmosis was prolonged. This is explained by the fact that the retentate was continually recirculated through the system with permeate flow compensated by substrate feed. The molecules of sugar (sucrose, glucose and fructose) and sugar alcohol (sorbitol and mannitol) were retained by the CA and composite membranes, while water and only a little salt passed through the membranes. A similar hyperbolic time profile for protein concentration was also observed for coconut water, showing protein rejection by the membranes as expected.
The solute rejection coefficient or was calculated from the equation:
CP a = ( 1 - C ) x 100 r r where CP and Cr are solute concentrations of permeate and retentate, respectively.
The ar for salt was computed using the electrical conductivity data while a1 values

92 Transactions National Academy of Science
for total carbohydrates and protein were calculated from the results of chemical analysis. For CA membrances, ar values were found to be in the ranges of 91 -97%, 89-97% and 95-98% for total sugar, sugar alcohol and protein, respectively; salt
rejection was estimated to be '\.65%. On the other hand, for composite membranes
ar values were were greater than 98% for the carbohydrate solutes, 99% or greater
for protein and '\.86% for salt.
The final concentrations of sugar, sugar alcohol and total carbohydrate, in the retentate after reverse osmosis (usually five hours; three hours in a few runs) are
summarized in Table 1 and 2 for CA and composite membranes, respectively. Also tabulated are values of the concentration factor (CF), which is the ratio of final and
initial solute concentrations in the retentate. Higher concentrations of total sugar,
sugar alcohol and protein resulted from the three-hour hyperffitration of coconut
water using 86 cellulose acetate membranes at four values of pressure compared to
that using 30 membanes. Maximal concentrations of sugar, sugar alcohol and pro
tein for retentate were 65%, 1 .9% and 0.2%, respectively . As shown in Table 1 , which includes data obtained by Bergonia et aL (1 982) for 30 membranes, the concentration factors using 86 membranes were about 2.3 times compared to those using 30
membranes. Furthermore, the deionization of coconut water prior to reverse
osmosis with 30 membranes gave similar results as reverse osmosis of raw (un
deionized) sample with 86 membranes.
1 2 . 0 6 . 0
T S SA 1 0 . 0 �-·-·-A 2 MPa 5 . 0
0 • 3 MPa > 0----· 4 MPa ...... � 8 . 0 4 . 0 i!-u g 6 . 0
a�Q-o---o-o-4 .�---·�-· .;'/� --�-·-·1'.:1-·- 3 . 0 u
0 +-�
4 . 0 ,.
� ·-�-!:::'' g . 2 . 0 .,. � • -· t ,......... ��8'7'" --·- -
- � �·-· �·�B - ·==--·-�-::::· '· •--· 7,, � ,,:::::.-
·-·-· -· 'A-·----2 0 l:i.
� ---·--· . I ·-· -0� •
0 . 0 1 . 0 2 . 0
1 . 0
3 . 0 4 . 0 5 . 0 Time { h )
..... >
...... � I u c 0 u 0 .c. 0 u 0 ... 0 00 ::3 (/)
Figure 4 . Concentrations of total sugar (fS) and sugar alcohol (SA) for coconut water concentrates using cellulose acetate membranes.

-> ' �
1 5
0
�10 u c 0 u � 0 01 � 5 0 ... 0 1-
del Rosario, Reverse Osmosis and Ultra.flltration Processing
TS SA �-·-·-A 2 MPa 0 • 3 MPa 0- - -· 4 MPa
( a ) Total sugar .. o-- '
o--,...., 0 .....
93
,o'"" 0
,/'/ _ _ ..o ---0 /.H
.... -,o ---o-o--,R.....·" ,o _........o-o �---·A-·-
�,. o--o ty-·-,o H� A- .-�-·-�-·-
/ � - - - �
/ 0........-/ .
�£("·
( b ) Sugar al cohol _, .- --·- - ·
_ __ ... -//
8 -) u c 0 u
•
__
•. /
·;::::-1=-· -•==•::::--l
•---•- I� 0 .,� ·-- �-� -5 4 ..... I_.,..- .... - . -u , ·� -- -� o I ..... . .....
} 2r�� ·� 0 � I I 0.0 1 . 0 I 2 . 0 I 3 . 0
Time ( h )
I 4.0
I 5.0
Figure 5 . Concentration o f (a) total sugar and (b) sugar alcohol for coconut water concentrates using composite membranes.

Table 1 . Concentration of sugar, sugar alcohol and total carbohydrate for fresh and deionized coconut water at different inlet pressures before and after reverse osmosis
FRESH COCONUT WA TER DEIONIZED COCONUT WA TER
Initial Final C(Jne. Initial Final Cone. Cone. Cone. Factor Cone. Cone. Factor
30* 86* 30 86 30 86 30 30 30
2 MPa
Total Sugar (% w/v) 1 .70 1 .98 2.70 5.80 1.60 2.90 1 .90 7.60 4.00
Sugar Alcohol (% w/v) 0.90 0.41 2.80 1 .70 3.10 4. 15 1 .60 4.70 3.00
Total Carbohydrate (% w/v) 2.60 2.39 5 .50 1.50 2 . 10 3 . 1 0 3.50 1 2.30 3.50
3 MPa
Total Sugar (% w/v) 1 .28 1.25 3.75 6.50 2.90 5 .2 0 1 .40 6.80 4.85 Sugar Alchol (T w /v) 0.95 0.44 2.38 1.85 2.50 4.20 1 .00 4.60 4.60 Total Carbohydrates
(% w/v) 2.23 1.69 6.1 3 8.35 2.75 4.90 2.40 1 1 .40 4.75
4 MPa
Total Sugar (% w/v) 1 .70 1 . 15** 3.60 6.40** 2.10 5 .60 1 .5 0 8.60 5.70 Sugar Alcohol (% w/v) 0.96 0.45 ** 2.30 1 .90* * 2.40 4.20 0.80 4.30 5 .00 Total Carbohydrate
(% w/v) 2.67 1 .60** 5 .90 8.30** 2.20 5 .20 2.30 12.90 5 .40
1.0 �
1-i .. � � o. 0 = "' z II> o. 0 = � > n II> Q. <II 9 '< 0 ...., Cll n ;· = n <II

Table 1 (Continued)
FRESH COCONUT WA TER
30*
5 MPa
Total Sugar (% w/v) 1 .60 Sugar Alcohol (% wfv) 0.70 Total Carbohydrate
(% w/v) 2.30
*Number of membranes used. **Reverse osmosis' for 3 hours only.
Initial Cone.
86* 30
Final Cone.
5.60 2.30
7.90
86 30
Cone. Factor
3.50 3.30
3.40
86
DEIONIZED COCONUT WA TER
Initial Cone.
30
1 .30 1 .40
2.70
Final Cone.
30
14.20 7.30
2 1 .50
Cone. Factor
30
10.90 5 .20
8.00
c:lo S!. � 0 � .. c
r � � � 0 � 0 "' .... "'
� c:lo s r:t s � a. 0 = a � "' "' :r
()Q
10 VI

96 Transactions National Academy of Science
In the case of composite membranes generally higher concentrations of total sugar, sugar alcohol and protein resulted from the five-hour hyperftltration of coconut water using 90 membranes at three values of pressure compared to 72 membranes (Table 2). Maximal concentrations of sugar, sugar alcohol and protein for retentate were 16 .2, 9.0 and 0.7%, respectively, using 90 membranes. The highest concentration of total carbohydrate was 25.2% which corresponds to a concentration factor CF of 5.6. The greater fmal carbhohydrate concentration obtained using composite membranes compared to cellulose acetate membranes may be explained mainly by the greater carbohydrate concentration of the fresh coconut water used with composite membranes. On the basis of experimental errors, the differences in CF values observed for the two membranes are not significant under similar conditions for the reverse osmosis runs.
Table 2. Solute concentrations (% w/v) of coconut water before and after reverse osmosis at different inlet pressures using 72 and 90 composite membranes
2 MPa
Total Sugar Sugar Alcohol Total Carbohydrate Protein
3 MPa
Total Sugar Sugar Alcohol Total Carbohydrate Protein
4 MPa
Total Sugar Sugar Alcohol Total Carbohydrate Protein
Initial Cone.
2.4 0.9 3.3 0.1
2.6 0.9 3.5 0. 1
2.7 0.9 3.6 0. 1
72 Membranes
Final Cone. Cone. Factor
8.4 3.3
1 1 .7 0.4
10. 1 3.4
1 3.5 0.4
1 2 .4 3.9
1 6. 3 0.4
3.5 3.7 3.6 4.0
3.9 3.8 3.9 4.0
4.6 4.3 4.5 4.0
Initial Cone.
2.8 1.7 4.5 0. 1
2.5 1.7 4.2 0.1
3.0 1.6 4.6 0. 1
90 Membranes
Final Cone.
9.7 5 .5
15 .2 0.4
10.0 5.7
15 .7 0.5
16.0 9.0
25.2 0.7
Cone. Factor
3.5 3.2 3.4 4.0
4.0 3.4 3.7 5.0
5 . 3 5 . 6 5.5 7.0
The relationship between solvent (permeate) flux J 1 and pressure gradiant (tJ> - !:lrr), which is given in Eq. (1 ), was used to calculate the permeation coeffi. cient A. From data presented earlier in this paper, values of J 1 and tJ> - !:lrr were calculated at different times of the reverse osmosis runs. Values of !:lrr were estimated

del Rosario, Reverse Osmosis and Ultra!Iltration Processing 97
from the solute concentrations in the retentate and permeate using, as an approximation, Van't Hoffs equation (Atkins, 1 982):
1T = � RT (4)
where 1T is the osmotic pressure of a solution containing solute at a molar concentration c2 at temperature T (R is the ideal gas constant). A typical plot is shown in Figure 6 for composite membranes. The membrane constant A was calculated as the slope of the linear plots of J 1 against 6P - b.1T as shown in Figure 6. The best values of A were determined by least squares analysis of the experimental data. The calculated A values are plotted in Figure 7 against the time course of hyperflltration. The substantial decrease in A with time can be explained by progressive membrane fouling and polarization during reverse osmosis (Suki, 1987 ; ICOM, 1 987). Similar results were observed using cellulose acetate membranes. However, the composite membranes gave greater solute rejection coefficients and permeate fluxes and were more durable and easier to clean than cellulose acetate membranes.
.e '
N E
40.0
30 0
::J 20.0
10.0
0 .0
I I •
• 1 ' "'1 • f I tT l b . t I � 6 1
� � i o l 6 ; �t I $ J
1.0 2 .0 3.0 �P - f).:rr < MPo >
4 MPo I
0
0
0
0 b I 0 g Q I
4.0 �.0
Figure 6. Dependence of penneate .flux J 1 on pressure gradient 6 P-611" for coconut water using
72 ( open symbols) and 90 (closed symbols) composite membranes.

98 Transactions National Academy of Science
g 0 - 30 CA membranes (raw feed)
• f::l. • 30 CA membranes (deionized feed
6 . 0 - 0-86 CA membranes (raw feed} e -72 comp. membranes (row feed}
l::l. • -90 comp. membranes (row feed)
-0 ll. :!: 4 .0 � I 0 c. I A N E
0 ...... _J A -<l 2.0 � I 0 H 0 0
• I •
0 t- � I I I I _l
1.0 2.0· 3.0 4.0 5.0 Time (h)
Figure 7. Time prof'l.le of permeation coefficient A during reverse osmosis of coconut water using cellulose acetate (CA) composite membranes.
Sorbitol recovery from coconut water
The time profile during reverse osmosis of the ethanolic product, which was obtained after passing the RO coconut water concentrate through the immobilized yeast reactor, is shown in Figure 8. It can be seen that the concentrations of sugar and sugar alcohol in the retentate were much greater than those in the permeate. This is expected because the rejection coefficient of the composite membrane for these molecules is greater than 98%. On the other hand, as seen in Figure 8, permeate and retentate ethanol concentrations were approximately the same; this indicates that ethanol permeated freely through the membrane.
The results, although not exhaustive, indicate that the sugar alcohols (sorbitol and mannitol ) may be separated from the simple sugars in coconut water by
first fermenting the sugars into ethanol followed by reverse osmosis of the ferment-

98 Transactions National Academy of Science
g 0 - 30 CA membranes (raw feed)
• .6. • 30 CA membranes (deionized feed
6. 0 ,_ 0 - 86 CA membranes (raw feed) e - 72 camp. membranes (raw feed)
� • -90 camp. membranes (raw feed)
-0 a.. :!! 4 .0 � I 0 .c I A C\J E
0 ' ...J A -
<X 2.0 � I 0 H 0 0
• I •
0 � � I I I 1 _l
1.0 2.0· 3.0 4.0 5.0 Time (h)
Figure 7. Time proftle of permeation coefficient A during reverse osmosis of coconut water using cellulose acetate (CA) composite membranes.
Sorbitol recovery from coconut water
The time profile during reverse osmosis of the ethanolic product, which was obtained after passing the RO coconut water concentrate through the immobilized yeast reactor, is shown in Figure 8. It can be seen that the concentrations of sugar and sugar alcohol in the retentate were much greater than those in the permeate. This is expected because the rejection coefficient of the composite membrane for these molecules is greater than 98%. On the other hand, as seen in Figure 8, permeate and retentate ethanol concentrations were approximately the same; this indicates that ethanol permeated freely through the membrane.
The results, although not exhaustive, indicate that the sugar alcohols (sorbitol and mannitol ) may be separated from the simple sugars in coconut water by first fermenting the sugars into ethanol followed by reverse osmosis of the ferment-
100 Transactions National Academy of Science
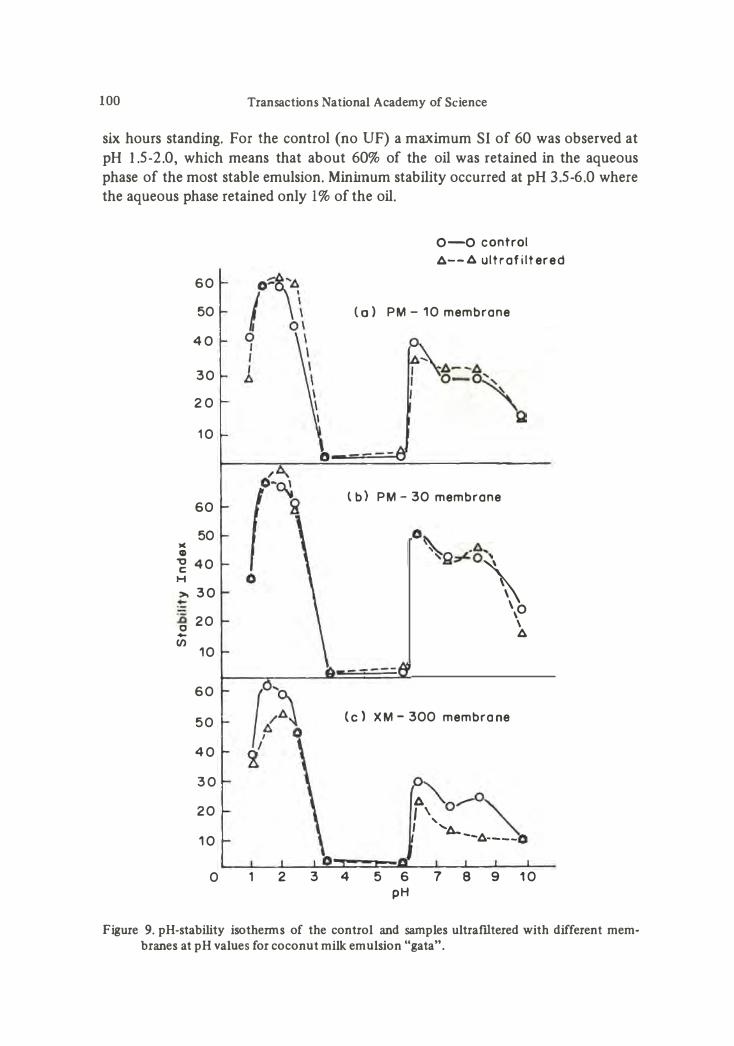
slx hours standing. For the control (no UF) a maximum SI of 60 was observed at pH 1.5-2.0, which means that about 60% of the oil was retained in the aqueous phase of the most stable emulsion. Minimum stability occurred at pH 3.5-6.0 where the aqueous phase retained only 1% of the oil.
l( G)
60 50
40
30 20
10
60 50
� 40 H >- 30 � :.0 20 0 -(J) 10
60
50
40
30 20
10
0
o-o control A--A ultrafiltered
(a) PM- 10 membrane
�- -� o-�
l b) PM- 30 membrane
0 __L. A ... ;r- 0 '
'\ 'o \ \ A
(c) XM- 300 membrane
I ', A 0,-(>� I 'A- --A----
1 2 3 4 5 6 7 8 9 10 pH
Figure 9. pH-stability isothenns of the control and samples ultraf11tered with different membranes at pH values for coconut milk emulsion "gata".

del Rosario, Reverse Osmosis and Ultrafiltration Processing 101
For all the membrane types there was no change in the flat well' portion of the curves corresponding to the minimum stability of the emulsion in the pH range 3.5-6.0. There were no significant differences in the pH-stability isotherms between the control and the samples ultrafiltered through PM-1 0 and PM-30 membranes. However, there were significant reductions in the stability of the samples ultrafii.tered with XM-300 which were approximately equal to 22% at pH 1.5 and 63% at pH 8.5 . The destabilization of the emulsion in the retentate may be explained by th permeation of emulsifying protein(s) through the XM-300 membrane whose molecular weight (MW) cut-off is 300,000 D. Since the two primary protein fractions in coconut skim milk have MW values of 24,000 and 150,000 (Hagenmaier, 1 980) the results imply that the bigger protein might be involved in stabilizing the emulsion "gata". Interestingly, protein permeation across the membrane was found to be much greater in the pH range 6.0-10.0 especially for XM.-300 membrane, through which about 25 to 33% of the proteins passed into the permeate. On the other hand, about 5.3-7.8% of the proteins permeated through the PM-30 membrane in the same pH range. Needless to say, further research is needed in order to confirm and elucidate these observations.
The results, which are only preliminary in nature, indicate that membrane ILltration of coconut milk emulsion using a suitable membrane could allow the separation of the proteins (in the permeate) from the oil (in the retentate) and at the same time facilitate oil coalescence and recovery. However, ultrafiltration or microfiltration membranes should first be prepared with suitable characteristics. Research in this area is presently being undertaken by the author and his co-workers ( cf. Bergonia et al, 1986).
Conculsions
Reverse osmosis (RO) of resh coconut water using DDS cellulose acetate (CA) or composite membranes in a plate-and-frame module showed a substantial decline in permeate flux during operation. This flux decline is due to membrane fouling as a result of solute polarization or accumulation on the membrane surface.
For CA membranes, values of the rejection coefficient, or were in the ranges of 91-97, 89-97 and 95-98% for total sugar, sugar alcohol and protein, respectively; salt rejection was '\.65%. On the other hand, for composite membranes or values were > 98% for the carbohydrate solutes, >99% for protein and '\.86% for salt.
Maximal concentrations of sugar, sugar alcohol and protein in the retentate were 1 6.2, 9.0 and 0.7%, respectively, using 90 composite membranes; the highest concentration of total carbohydrate was 25 .2% corresponding to a concentration factor (CF) of 5.6 (the CF value is the ratio of fmal and initial solute concentrations in the retentate ). Similar CF values were obtained using CA membranes under similar conditions for the RO runs.

102 Transactions National Academy of Science
The permeation coefficient A relating solvent (permeate) flux and pressure gradient liP - 6:rr was calculated from the experimental values of J 1, pressure differences liP and values of 6:rr, which were estimated using Van't Hoff's equation. The value of A drastically decreased with time in the reverse osmosis (RO) of coconut water for either CA or composite membranes; this can be explained by progressive membrane polarization and fouling during the RO run.
The sugars in the RO coconut waer concentrate were fermented into ethanol in an imobilized yeast reactor. The fermented product was hyperftltered through composite membranes which were permeable to ethanol but not to sugars and sugar alcohol. The resulting RO concentrate contained mainly sorbitol and mannitol, as shown by HPLC, whose total concentration was in the range 5.9-9 .0%.
illtrafl.ltration of coconut milk emulsion "gata" using an Amicon XM-300 membrane showed reduction in emulsion stability of about 22% at pH 1.5 and 63% at pH 8.5 . No significant destabilization of the emulsion was observed using PM-1 0 and PM-30 membranes. The emulsion destabilization in the retentate could be explained by the loss of emulsifying protein(s) which passed through the membrane, possibly the 150,000 D protein fraction. There are promising applications of membrane ftltration in separating coconut proteins and oil using membranes with suitable characteristics.
Ackno"·ledgments
Part of the research described in this paper was fmanced by the Department of Science and Technology (DOST) and the Australian Government under the ASEAN Project on the Management and Utilization of Food Waste Materials (ASEAN-AUSTRALIA Economic Cooperation Program). Some research results of the author's thesis advises were also included in the paper, especially those of 0. Monera (1980) and J. Tiong (1987). The author wishes to acknowledge the technical assistance provided by G.M. Papa, H.A. Bergonia, C.S. Reyes and R. de Vera, and the valuable assistance of Mrs. O.N. Gonzales (ITDI-DOST), Mr. V. Bibit, Mr. J. Villaruz, Engr. N. Garcia (Blu�Bar Phils.), Mr. J. Datu and Engr. M. Manalo (New Sun-Ripe Coconut Products).
literature Cited
ASEAN Mem Tech 82. Proceedings of the Second ASEAN Workshop on Membrane Technology, Bangkok, Thailand, October 1-10, 1982.
ASEAN Mem Tech 86. Proceedings of the Third ASEAN Workshop on Membrane Technology, Singapore, April14-16, 1986.
ASEAN Mem Tech 87. Proceedings of the Fourth ASEAN (Training) Workshop on Membrane Technology, Bangi, Malaysia, April15-25, 1987.
Atkins, P.W. 1982. Physical Chemistry, 2nd ed. San Francisco, W.H. Freeman and Co:, p. 236. Bergonia, H.A., Papa, G.M., Fabilitante, J.R. and del Rosario, E.J. 1982. Reverse osmosis of
coconut water through cellulose acetate membrane. Proceedings of the Second ASEAN

del Rosario, Reverse Osmosis and Ultra!Iltration Processing 103
Workshop on Membrane Technology; Bangkok, Thailand, Oct. 1-10, 1982. ASEAN Working Group on Food Waste Materials; ASEAN Committee on Science and Technology: pp. 234-248.
Bhumiratana, S. 1987. Reverse osmosis fundamentals and theories. Proceedings of the Fourth ASEAN (Training) Workshop on Membrane Technology, Bangi, Malaysia, April 15-25, 1987.
Caday, C.G. 1979. Biotechnological studies on yeast production from water. Unpublished M.S.
Thesis Univ. of the Philippines, Los Banos, Laguna Corcoran, A. C. and I.H. Page. 1947. A method for the determination of mannitol in plasma
urine. J. Bioi. Chern. 170: 165-171. del Rosario, E.J., H.A. Bergonia, M.E. Flavier, J.L. Samonte and E.M.T. Mendoza. 1984. Chro
matographic analysis of carbohydrates in coconut water. Trans. Nat. Acad. Science & Technol. (Phils.) 6: 127-151.
del Rosario, E.J., F.B. Elegado and F.V. Pamatong. 1985. Continuous-flow fermentation of sugar into ethanol using immobilized yeast. Trans. Nat. Acad. Sci. & Tech. (Phils.) 7: 169-187.
del Rosario, E.J., G.M. Papa, H.A. Bergonia and C.S. Reyes. 1986. Concentration of ct>conut water by plate-and-frame reverse osmosis using cellulose acetate membranes. ASEAN Food J. 2(1): 19-24.
del Rosario, E.J., G.M. Papa and C.S. Reyes. 1988. Concentration of coconut water by plateand frame reverse osmosis using composite membrane. Phil. J. Coconut Studies (December issue -in press).
Dubois, M., K.A. Gilles, J.K. Hamilton, P.A. Rebers and F. Smith. 1956. Colorimetric method for determination of sugars and related substances. Anal. Che. 28: 350-356.
Fane, A.G. 1985. Membrane for downstream processing. Downstream Processing in Biotechnology -Course Notes. August 29-30, 1985, Univ. of New South Wales, Sydney, Australia.
Hagenmaier, R. 1980. Coconut Aqueous Processing. Second revised edition San Carlos Publications, University of San Carlos, Cebu City, Philippines.
ICOM. 1987. Proceedings of the 1987 International Congress on Membrane and Membrane Proc�sses, Tokyo, Japan, June 8-12, 1987 (sponsored by the Membrane Japan, June 8-12, 1987 (sponsored by the Membrane Society of Japan and the European Society of Membrane Science and Technology).
IMTEC. 83. Proceedings of the International Membrane Technology Conference, Kensington, N.S.W., Australia, November 8-10, 1983.
Lowry, O.H., N.J. Rosebrough, A.L. Fan and R.J. Randall. 1951. Protein measurement with
the folin phenol reagent. J. Bioi. Chern. 193: 265-275. Mem Tech 80. Membrane Technology and its Industrial Applications Workshop/Seminar Notes,
Kensington, N.S.W. Australia, January 29-31, 1980. Monera, 0.0. 1980. Physico-chemical studies on the stability of coconut emulsion ("gata").
Unpublished M.S. thesis, Univ. of the Philippines, Los Banos, Laguna. Putranon, R., S. Bhumiratana, P. Tantiwechwuttikul and N. Patamayothin. Concentrated coco
nut water by membrane process. 1983 Annual Report, ASEAN Working Group on the Management and Utilization of Food Waste Materials. ASEAN Committee of Science and Technology, pp. 415-418.
Sourirajan, S. and T. Matsuura. 1985. Reverse osmosis/ultrafiltration process principles. National Research Council of Canada, Ottawa.
Suki, A. 1987. Mechanism of fouling. Proceedings of the Fourth ASEAN (Training) Workshop on Membrane Technology, Bangi, Malaysia, April 15-25, 1987.
Tiong, J.R. 1987. Ethanolic fermentation and reverse osmosis of coconut water for the recovery of sorbitol and mannitol Unpublished B.S. thesis, Univ. of the Philippines, Los Banos, Laguna.