Embed Size (px)
Citation preview
1
The Market Value of Online Degrees as a Credible Credential
Calvin D. Fogle, DBA
Western Governors University
Devonda Elliott, Doctoral Candidate
University of the Rockies
ABSTRACT
This exploratory research employed a random sample drawn from employers across multiple
industries to investigate four research questions: Do hiring managers hold favorable attitudes
toward graduates from primarily online universities in comparison with non-online universities?
To what degree are hiring managers well versed concerning online universities? To what extent
do these expectations vary across industry sectors including government, and nonprofit settings?
How do hiring managers perceive education at online universities? The purpose of the study was
to describe and understand hiring manager’s perceptions of degrees gained from online
universities. The specific research questions were aimed at gaining a clearer understanding of
employers’ perceptions relative to online universities and online degree attainment, and to use
the knowledge gained to inform prospective students, Universities and employers. The results of
this study revealed (a) employers perceived a traditional or hybrid modality more credible than
a purely online modality across multiple industries; (b) Respondents’ attitudes towards online
education are significantly more positive if the respondent has had experience with online
education, and (c) confirmed previous studies about the uncertainty of employing candidates
with online degrees.

2
Introduction
This study employed a random sample drawn from employers across multiple industries
to investigate four research questions: Do hiring managers hold favorable attitudes toward
graduates from primarily online universities in comparison with non-online universities? To
what degree are hiring managers well versed concerning online universities? To what extent do
these expectations vary across industry sectors including government, and nonprofit settings?
How do hiring managers perceive education at online universities? The research questions
sought to describe and understand hiring manager’s perceptions of graduates from online
universities. The specific research questions were aimed at gaining a clearer understanding of
employers’ perceptions relative to online university graduates, and to use the knowledge gained
to inform Universities and employers. The results of this study could inform institutional leaders
and employers to recognize perceptions that may exist regarding credibility of online
universities. The results of this study could provide the opportunity to assist prospective students,
as consumers of higher education, to make informed choices about educational modalities.
Background of the Literature
To answer these questions, the survey posed a number of questions that asked about
hiring practices and whether the source of the degree is a consideration in hiring decisions.
Additionally, a set of questions was also asked about perceptions of online students and online
education that should illuminate the rationale for an employer’s bias. The information from these
surveys can be used to provide guide job seekers who have an online degree over potential
hurdles as well as inform online universities on perceptions of their product and how to better
compete against other online universities.
The modalities of educational delivery have evolved from traditional face to face
instruction to distance education, and now to global online asynchronous and synchronous with
plausible growth rates (Allen & Seaman, 2005). The desire to shift toward serving non-
traditional learners, reducing physical infrastructure, lack of sustained funding for public
institutions, and increased educational accessibility have made online instruction an risky but
attractive proposition (Bonvillian & Singer, 2013). Prior studies have posited that educational
outcomes of online instruction are equivalent or more significant to face to face modalities
(Angiello, 2010; Angiello & Natvig, 2010; Nance, 2007; Palloff & Pratt, 2001; Robinson &
Hullinger, 2008; Russell, 2001). The effectiveness of online education has emerged with
divergent views. Garbett (2011) found that quality instruction is not compromised with online
instruction, yet significant cost savings can be achieved using online modalities. Using
technology as the means of delivery with limitless online exchange mechanisms yields
significant meaningful exposure for learners (Bonvillian & Singer, 2013).
Some trepidation toward acceptance of purely online education across all levels of
education exists with quality and learning benchmarks exhibited by online instruction
(Columbaro & Monaghan, 2005; Rauh, 2011). Recent studies have investigated overall employer
opinions (Astani & Ready, 2010; Tabatabaei & Gardiner, 2012; Vukelic, & Pogarcic, 2011).
Astani & Ready (2010) found that a positive response regarding online courses and flexibility of
the online modality; however uncertainty existed with hiring candidates with degrees from online
universities (Tabatabaei & Gardiner, 2012; Vukelic, & Pogarcic, 2011). Linardopoulos (2012)
analyzed existing studies and found that employers continue to view online degree candidates
3
less favorably. Columbaro & Monaghan (2009) posited that a negative stigma still exists in
online degree attainment and that further research is needed to provide insight into this area. A
common theme which emerged out of multiple studies indicates that a comprehensive study
focusing on identifying employer views by specific industries is warranted (Adams & DeFleur,
2006; Astani & Ready, 2010; Linardopoulos, 2012).
The nature of the study sought to explore employer attitudes toward graduates from
primarily online universities; moreover, the study will seek to explore the extent of these
expectations across industry sectors’ including government, and nonprofit settings was of
paramount concern. The notion of scholarship apprehension has not declined the disruptive
innovation as universities continue to increase online courses and complete degree programs
providing substantial access for higher education across the globe (Hyman, 2012). The
contemporary delivery of higher education has caused the emergence to underscore the
acceptance, employability, and credibility from the perspective of external stakeholders of online
education.
Research questions
To examine the problem under study, the following questions guided this research:
1. How do hiring managers perceive education at online universities?
2. Do hiring managers hold favorable attitudes toward graduates of online universities in
comparison with traditional universities?
3. To what degree are hiring managers well versed concerning online universities?
4. To what extent do these expectations vary across industry, government, and nonprofit
settings?
Hypothesis
This inquiry is focused by the following research hypothesis that “There will be no significant
difference between employer perceptions of graduates from online universities towards the
concept of employability, credibility and educational modalities”.
Assumptions, Limitations & Delimitations of the Study To mitigate the potential risk in assumptions, participants willingly participated in the study
and had no unambiguous schema to affect unduly the outcome of the study. The limitations of this
study were (a) the number of respondents willing and available to participate; (b) the
respondents’ varying experiential levels with online education, which could have affected
accurate data collection; and (c) the nature of the study and that the data collected reflected
accuracy solely for the sample. The number of respondents willing and available to participate
determined the limits of the study and the ability to extrapolate the results to a general
population. Other populations might not be generalized with the results of this study. Three
delimitations in this study were (a) the choice of the problem and the environment, (b) population,
and (c) sample size and location. The choice of the problem and the environment based on random
sampling was a key delimitation for this study. The study relied on the reliability and credibility of
respondents’ perceptions and their accurate rumination.

4
Methods
Data analysis methods are driven by the type of data generated by the survey and, in
particular, the level of measurement of survey variables. The level of measurement of a variable
refers to its numerical properties. Levels of measurement can be arranged in a hierarchy that
includes, from bottom to top, nominal variables, ordinal variables, and ratio variables. Variables
measured at the nominal level of measurement are not necessarily numbers, but rather, are labels
that reflect categories. Examples of variables measured at the nominal level of measurement
include Gender and the type of university a degree was obtained from. For nominal variables,
statistics are based on counts of the variables or proportions of respondents within a category.
Variables measured at the nominal level of measurement are also used to categorize other
variables to construct contrasts. For example, one can compare the difference in attitudes
between males and females or between respondents who graduated from a traditional, on-campus
university and respondents who graduated from an online university or a mixture of traditional
and online universities.
Next up the hierarchy of levels of measurement are ordinal variables. Variables measured
at the ordinal level are also not necessarily numbers, but in contrast to nominal variables, can be
ordered or ranked. Examples of ordinal variables include letter grades in a class, where A is a
better grade than B, which is better than C and so on, and family income, where family income
can be one of a set of non-overlapping intervals of income. Within the survey, the primary means
for eliciting attitudes is a series of Likert style questions, with responses ranging from Strongly
disagree through Neutral to Strongly agree, which are also ordinal measured variables.
At the top of the hierarchy of levels of measurement are variables measured on a ratio
scale. Variables measured on a ratio scale are numbers that have two additional properties: the
distance between any two successive numbers is a constant, and there is a natural zero, so that
expressing one value as a multiple of another value is sensible. Variables that are measures of
time, weight, and height are all examples of ratio measures. In contrast, a variable that measures
temperature is not a ratio variable because, as suggested by the several different temperature
scales, there is no natural zero.
Table 1 lists the variables in the survey that are used for analysis and their level of
measure.
Table 1.
Variables and their level of measurement
Variable
Level of
measure
Comment
Age Ordinal Reported as category
Gender Nominal
Level of Education Nominal
Location, Census area Nominal
Type of education (online or on-campus) Nominal
Industry Nominal
Title Nominal
Size of employer Ordinal
Household income Ordinal Reported as category
Q6A. Online and traditional universities’
degrees are equal in rigor.
Ordinal Likert scale: 1 = Strongly disagree, 2 =
Disagree, 3 = Neutral, 4 = Agree, 5 =
Strongly agree
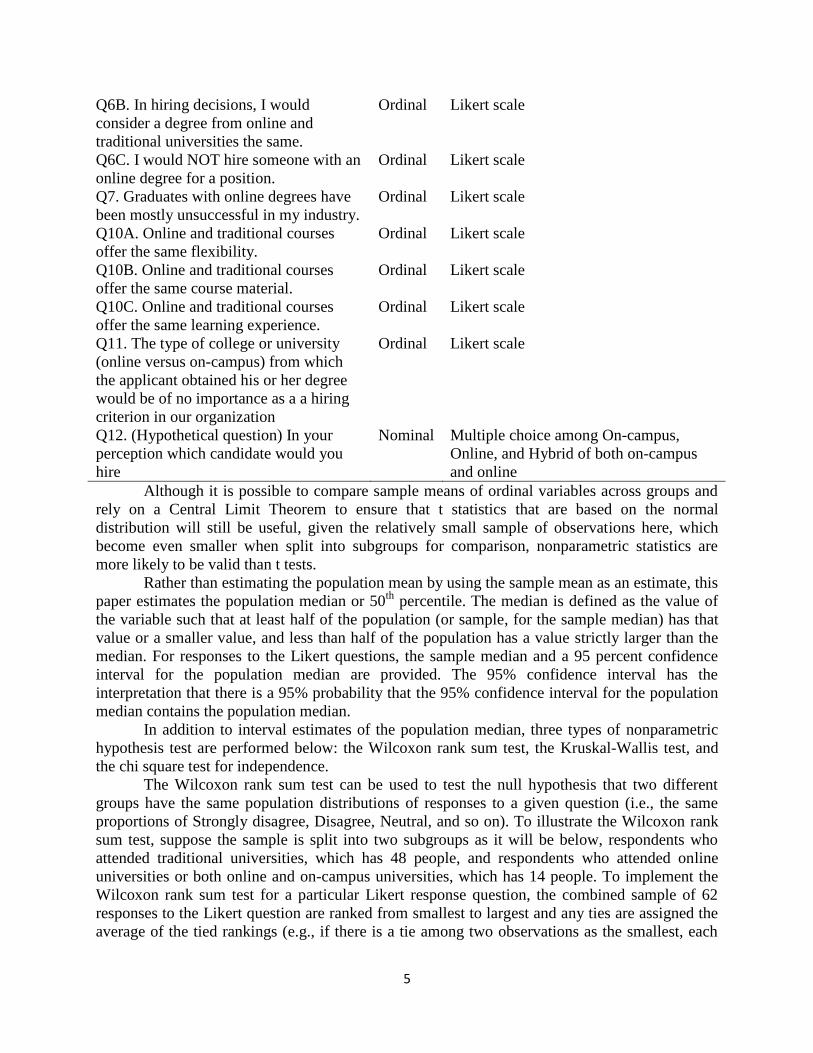
5
Q6B. In hiring decisions, I would
consider a degree from online and
traditional universities the same.
Ordinal Likert scale
Q6C. I would NOT hire someone with an
online degree for a position.
Ordinal Likert scale
Q7. Graduates with online degrees have
been mostly unsuccessful in my industry.
Ordinal Likert scale
Q10A. Online and traditional courses
offer the same flexibility.
Ordinal Likert scale
Q10B. Online and traditional courses
offer the same course material.
Ordinal Likert scale
Q10C. Online and traditional courses
offer the same learning experience.
Ordinal Likert scale
Q11. The type of college or university
(online versus on-campus) from which
the applicant obtained his or her degree
would be of no importance as a a hiring
criterion in our organization
Ordinal Likert scale
Q12. (Hypothetical question) In your
perception which candidate would you
hire
Nominal Multiple choice among On-campus,
Online, and Hybrid of both on-campus
and online
Although it is possible to compare sample means of ordinal variables across groups and
rely on a Central Limit Theorem to ensure that t statistics that are based on the normal
distribution will still be useful, given the relatively small sample of observations here, which
become even smaller when split into subgroups for comparison, nonparametric statistics are
more likely to be valid than t tests.
Rather than estimating the population mean by using the sample mean as an estimate, this
paper estimates the population median or 50th
percentile. The median is defined as the value of
the variable such that at least half of the population (or sample, for the sample median) has that
value or a smaller value, and less than half of the population has a value strictly larger than the
median. For responses to the Likert questions, the sample median and a 95 percent confidence
interval for the population median are provided. The 95% confidence interval has the
interpretation that there is a 95% probability that the 95% confidence interval for the population
median contains the population median.
In addition to interval estimates of the population median, three types of nonparametric
hypothesis test are performed below: the Wilcoxon rank sum test, the Kruskal-Wallis test, and
the chi square test for independence.
The Wilcoxon rank sum test can be used to test the null hypothesis that two different
groups have the same population distributions of responses to a given question (i.e., the same
proportions of Strongly disagree, Disagree, Neutral, and so on). To illustrate the Wilcoxon rank
sum test, suppose the sample is split into two subgroups as it will be below, respondents who
attended traditional universities, which has 48 people, and respondents who attended online
universities or both online and on-campus universities, which has 14 people. To implement the
Wilcoxon rank sum test for a particular Likert response question, the combined sample of 62
responses to the Likert question are ranked from smallest to largest and any ties are assigned the
average of the tied rankings (e.g., if there is a tie among two observations as the smallest, each

6
observation is assigned the rank 1.5, which is the average of a rank of 1 and a rank of 2, and the
next largest observation is assigned a rank of 3 as it would be if there were no tie for first). Then
the sum of the ranks is computed for each group separately. Since there are 14 observations in
the group of people who graduated from an online university or a combined online and on-
campus university, the smallest sum of the ranks this group can have is 105, which is the sum of
the numbers 1 through 14, and which will be the sum of the ranks for this group if this group has
the 14 smallest observations. The largest sum of the ranks this group can have is 777, which is
the sum of the ranks from 49 through 62, and which will be the sum of the ranks if this group has
the 14 largest observations. Intuitively, as the sum of the ranks for the responses of the 14
respondents who attended either online or both types of universities approaches either 105 or
777, the evidence that the two groups do not have the same probability distribution of responses
to the Likert question becomes stronger and stronger.
More formally, if the two groups, call them group 1 and group 2, have the same
probability distribution of responses for a particular question, then the expected sum of the ranks
for group 1 is given by the formula ( )
, where n1 is the sample size for group 1 and n2
is the sample size for group 2 and the expected sum of the ranks for group 2 is given by ( )
. Additionally, if the two groups have the same probability distributions of responses
in the population, then the difference between the sum of the ranks calculated from the sample
and the expected sum of the ranks divided by the standard deviation √ ⁄ [ ( )]
is (approximately) a standard normal random variable. The Wilcoxon rank sum test calculates
the sum of the ranks for each separate group and then calculates the value of the variable
Z = [(sum of the ranks for Group 1) - ( )
] / √ ⁄ [ ( )].
If the null hypothesis that each group has the same population distribution of responses is true,
then the variable Z follows a standard normal distribution. Therefore the standard normal
probability distribution can be used to compute the probability of obtaining a value as large as or
larger than the value of Z that was calculated from the sample, which is referred to as the p-value
or significance level of the hypothesis test. Clearly a numerically small p-value, say 0.05, 0.01,
or 0.001, implies that the probability of obtaining that large a value of the test statistic when the
null hypothesis is true is very small, which means that we may infer that the null hypothesis is
not true, or equivalently, that the two populations have different distributions of responses.
The Kruskal-Wallis Test is similar to the Wilcoxon rank sum test in computing the sum
of the ranks for a group, but the Kruskal-Wallis test extends the Wilcoxon rank sum test to more
than two groups. Thus the Wilcoxon rank sum test is the analog of a t test, except that the
Wilcoxon rank sum test tests for equality of two population probability distributions rather than
equality of two population means and the Wilcoxon rank sum test does not require that the
population probability distributions are normal distributions. Similarly, the Kruskal-Wallis test is
the analog of one factor ANOVA in the sense that just as one factor ANOVA extends the t test to
more than two groups, the Kruskal-Wallis test extends the Wilcoxon rank sum test to more than
two groups.
The chi square test of independence is a test of the null hypothesis that the values of two
nominal variables are independent. For example consider the two nominal variables Gender and
type of university graduated from, on-campus or not on-campus. If these two variables are
independent and say, half the respondents are women, then we expect approximately half of the
7
respondents who graduated from on-campus universities and approximately half of the
respondents who did not graduate from on-campus universities to also be women. The chi square
test first computes the expected number of each combination of the two different nominal
variables by multiplying the proportions of the sample that are each part of the combination. For
example, assume a sample size of 100 and that half of the sample is female and 80 percent of the
sample went to traditional, on-campus universities. Then if the two variables type of university
graduated from and gender are independent, we expect 40 male graduates of traditional
universities, 40 female graduates of traditional universities, 10 male graduates of non-traditional
universities, and 10 female graduates of non-traditional universities. For each of these four
groups, male graduates of traditional universities, female graduates of traditional universities,
male graduates of non-traditional universities, and female graduates of non-traditional
universities, compute the quantity actual count in the sample minus expected count in the sample
squared, divided by expected count in the sample and sum this value across the different groups
to obtain the value of the chi square test statistic. Under the null hypothesis that the two variables
gender and type of university attended are independent, the chi square test statistic follows a chi
square distribution with (r-1) x (c-1) degrees of freedom, where r is the number of possible
values of one of the nominal variables and c is the number of possible values of the other
nominal variable. Because Gender has two possible values, r-1=1 and because type of university
attended has two possible values, c-1=1, so that the degrees of freedom in this example is (r-
1)x(c-1) = (1) x(1) = 1. Therefore the chi square test statistic in this example follows a chi square
distribution with 1 degree of freedom. We can use the chi square distribution with one degree of
freedom to find the probability of obtaining a value of the test statistic a large or larger than the
value we obtained, which is known as the p value or significance of the test. As always, because
the p value is the probability of obtaining a value of the test statistic as large as or larger than the
value obtained from the sample if the null hypothesis is true, a small numerical value of the p
value, say 0.05, 0.01, or 0.001 is evidence that the null hypothesis is false.1
All of the statistics computed below were derived using the statistical software package
Stata 12.0, and all figures were produced in Microsoft Excel.
Descriptive Statistics
As indicated in Table 1, the survey obtained information on a number of different
demographic variables about the industries respondents are in as well as about the respondents
themselves. This section summarizes that information.
The survey has a total of 71 respondents, although the total varies by each question due to
differing amounts of non-response for different questions.
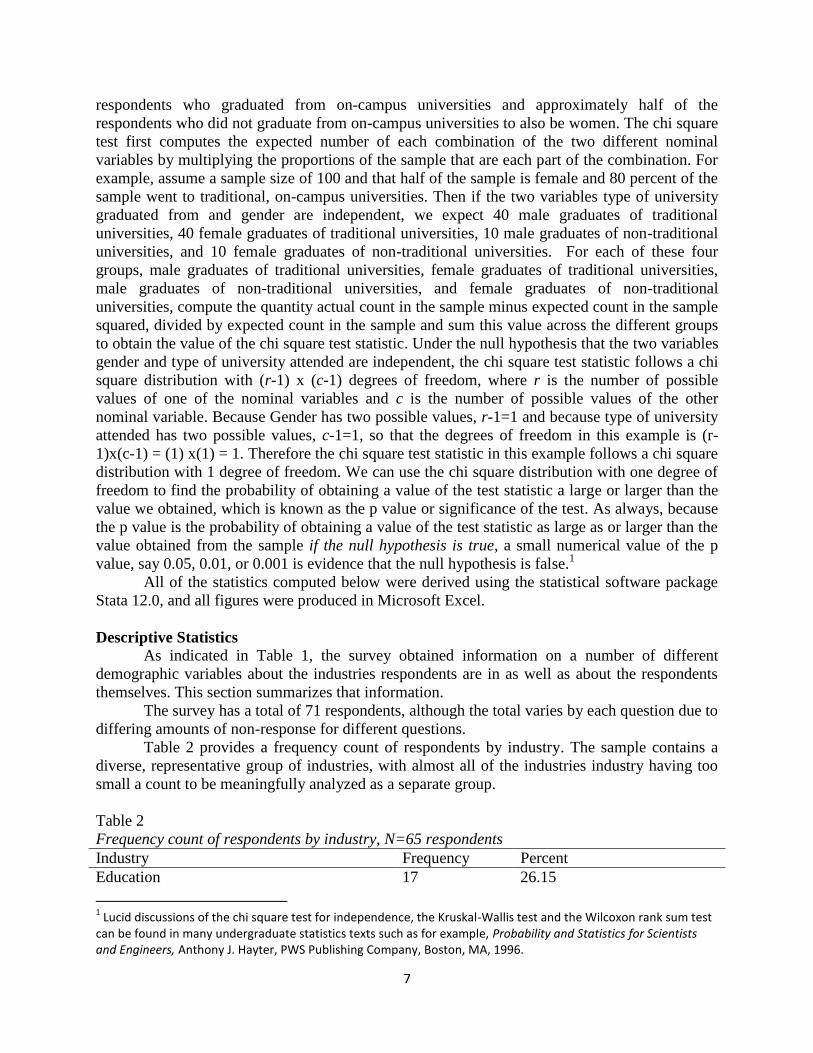
Table 2 provides a frequency count of respondents by industry. The sample contains a
diverse, representative group of industries, with almost all of the industries industry having too
small a count to be meaningfully analyzed as a separate group.
Table 2
Frequency count of respondents by industry, N=65 respondents
Industry Frequency Percent
Education 17 26.15
1 Lucid discussions of the chi square test for independence, the Kruskal-Wallis test and the Wilcoxon rank sum test
can be found in many undergraduate statistics texts such as for example, Probability and Statistics for Scientists and Engineers, Anthony J. Hayter, PWS Publishing Company, Boston, MA, 1996.

8
Healthcare and pharmaceuticals 11 16.92
Other 8 12.31
Telecommunications, Technology, Internet 5 7.69
Nonprofit 4 6.15
Finance and Financial services 3 4.62
Government 3 4.62
Advertising and marketing 2 3.08
Manufacturing 2 3.08
Retail and Consumer Durables 2 3.08
Automotive 1 1.54
Construction, Machinery and Homes 1 1.54
Entertainment and Leisure 1 1.54
Food and Beverage 1 1.54
Insurance 1 1.54
Real Estate 1 1.54
Research 1 1.54
Social Service 1 1.54
Figure 1 indicates that by location, the majority of the respondents were from either the
Pacific region (34%) or the East North Central region (19.1%) although all regions are
represented.
Figure 1
Census area of respondents, N=47 respondents
Figure 2 provides the size distribution of the firms that respondents work in. Roughly
equal numbers of firms in the sample are large and small, and these two types are about 85% of
the sample.
Figure 2
Firm size of respondents, small (1-100 employees), midsize (101-500 employees) and large (over
500 employees), N=71 respondents
4.3% 12.8%
14.9%
19.1%
2.1% 4.3%
8.5%
34.0%
New England
Middle Atlantic
South Atlantic
East North Central
East South Central
West South Central

9
Figure 3 displays the role of the respondent within their firm. Almost half of the respondents
(46.5%) are in non-management HR roles. The remaining half are nearly equally split between
Managers/Supervisors and Executives.
Figure 3
Job role of respondent, N=71
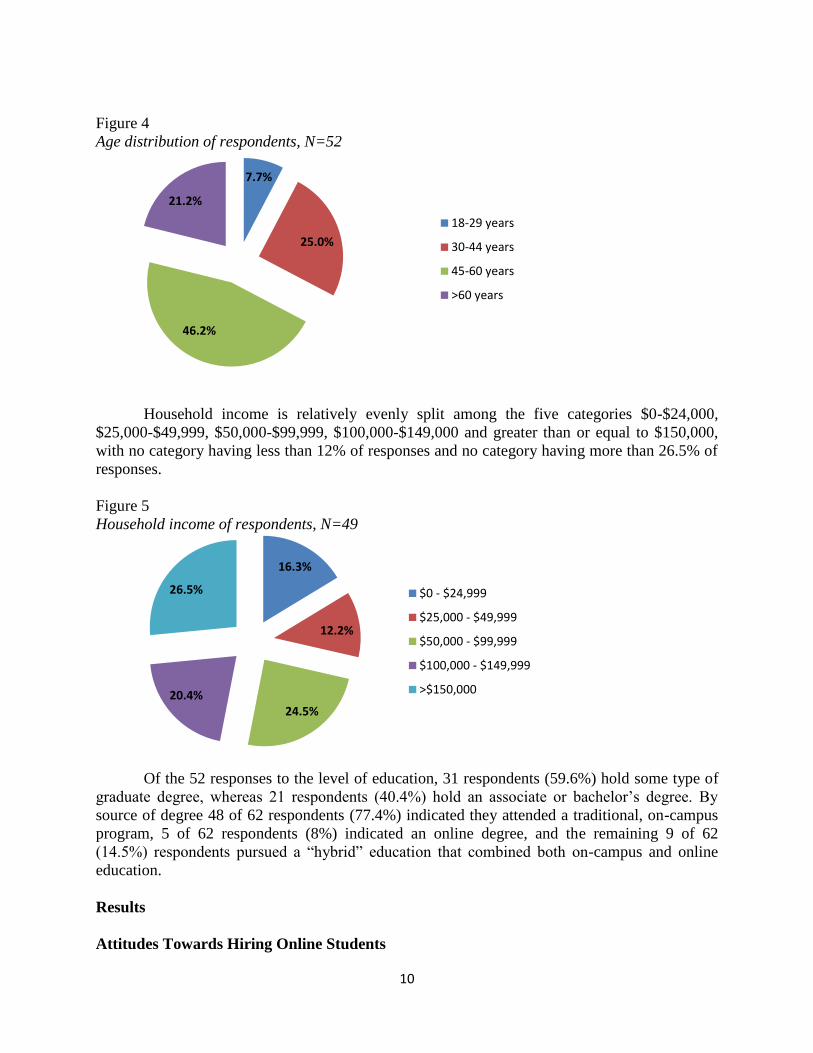
Respondents were roughly equally split between female (53.8%) and male (46.2%) for
the 52 responses to the Gender question. The age distribution of respondents and distribution of
household income is provided in Figures 4 and 5. The largest number of respondents (46.2%) is
in the 45-60 year old category, roughly equal numbers are in the over 60 years old and 30-44
years old categories and only 7.7% are in the 18-29 years old category.
43.7%
14.1%
42.3%
Small (1-100 employees)
Midsize (101-500 emloyees)
Large (Over 500 emloyees)
46.5%
28.2%
25.4%
Non-Management/Human Resources
Supervisor or Manager
Executive
10
Figure 4
Age distribution of respondents, N=52
Household income is relatively evenly split among the five categories $0-$24,000,
$25,000-$49,999, $50,000-$99,999, $100,000-$149,000 and greater than or equal to $150,000,
with no category having less than 12% of responses and no category having more than 26.5% of
responses.
Figure 5
Household income of respondents, N=49
Of the 52 responses to the level of education, 31 respondents (59.6%) hold some type of
graduate degree, whereas 21 respondents (40.4%) hold an associate or bachelor’s degree. By
source of degree 48 of 62 respondents (77.4%) indicated they attended a traditional, on-campus
program, 5 of 62 respondents (8%) indicated an online degree, and the remaining 9 of 62
(14.5%) respondents pursued a “hybrid” education that combined both on-campus and online
education.
Results
Attitudes Towards Hiring Online Students
7.7%
25.0%
46.2%
21.2%
18-29 years
30-44 years
45-60 years
>60 years
16.3%
12.2%
24.5% 20.4%
26.5% $0 - $24,999
$25,000 - $49,999
$50,000 - $99,999
$100,000 - $149,999
>$150,000
11
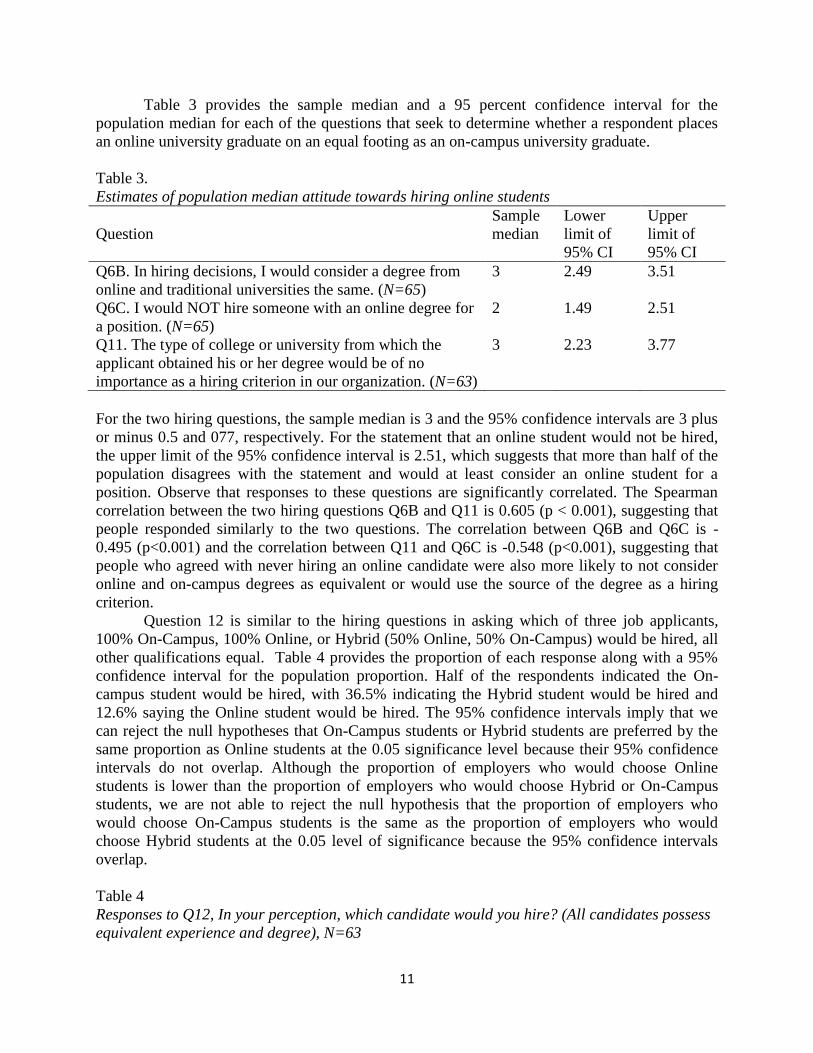
Table 3 provides the sample median and a 95 percent confidence interval for the
population median for each of the questions that seek to determine whether a respondent places
an online university graduate on an equal footing as an on-campus university graduate.
Table 3.
Estimates of population median attitude towards hiring online students
Question
Sample
median
Lower
limit of
95% CI
Upper
limit of
95% CI
Q6B. In hiring decisions, I would consider a degree from
online and traditional universities the same. (N=65)
3 2.49 3.51
Q6C. I would NOT hire someone with an online degree for
a position. (N=65)
2 1.49 2.51
Q11. The type of college or university from which the
applicant obtained his or her degree would be of no
importance as a hiring criterion in our organization. (N=63)
3 2.23 3.77
For the two hiring questions, the sample median is 3 and the 95% confidence intervals are 3 plus
or minus 0.5 and 077, respectively. For the statement that an online student would not be hired,
the upper limit of the 95% confidence interval is 2.51, which suggests that more than half of the
population disagrees with the statement and would at least consider an online student for a
position. Observe that responses to these questions are significantly correlated. The Spearman
correlation between the two hiring questions Q6B and Q11 is 0.605 (p < 0.001), suggesting that
people responded similarly to the two questions. The correlation between Q6B and Q6C is -
0.495 (p<0.001) and the correlation between Q11 and Q6C is -0.548 (p<0.001), suggesting that
people who agreed with never hiring an online candidate were also more likely to not consider
online and on-campus degrees as equivalent or would use the source of the degree as a hiring
criterion.
Question 12 is similar to the hiring questions in asking which of three job applicants,
100% On-Campus, 100% Online, or Hybrid (50% Online, 50% On-Campus) would be hired, all
other qualifications equal. Table 4 provides the proportion of each response along with a 95%
confidence interval for the population proportion. Half of the respondents indicated the On-
campus student would be hired, with 36.5% indicating the Hybrid student would be hired and
12.6% saying the Online student would be hired. The 95% confidence intervals imply that we
can reject the null hypotheses that On-Campus students or Hybrid students are preferred by the
same proportion as Online students at the 0.05 significance level because their 95% confidence
intervals do not overlap. Although the proportion of employers who would choose Online
students is lower than the proportion of employers who would choose Hybrid or On-Campus
students, we are not able to reject the null hypothesis that the proportion of employers who
would choose On-Campus students is the same as the proportion of employers who would
choose Hybrid students at the 0.05 level of significance because the 95% confidence intervals
overlap.
Table 4
Responses to Q12, In your perception, which candidate would you hire? (All candidates possess
equivalent experience and degree), N=63

12
Candidate
Sample
proportion
95% Lower limit for
population proportion
95% Upper limit for
population proportion
100% On-Campus 0.501 0.381 0.635
Hybrid
(50% On-Campus, 50%
Online)
0.365
0.243
0.487
100% Online 0.126 0.042 0.212
One regularity stands out among the willingness to hire items in the survey when they are
analyzed by demographic variables. If the respondent either received an online degree or has a
hybrid background as a student, then they are more likely to favor online students and less likely
to discriminate against them. To explore this relationship, define a binary variable that takes on
the value 1 if the respondent completed a 100% On-campus degree and the value 0 otherwise.
This variable has 62 responses, with 48 respondents with on-campus degrees and 14 with either
hybrid or online degrees.
The null hypothesis that the distribution of responses to a Likert item is the same across
the binary variable of respondents who attended a traditional on-campus university or did not
attend a traditional on-campus university can be tested using the Wilcoxon rank sum test
described earlier. For Q6B, “In hiring decisions, I would consider a degree from online and
traditional universities the same,” we can reject the null hypothesis that the distribution of
responses across the types of university attended by the respondent at a significance level less
than 0.0001, and the probability of drawing a higher response (i.e., greater agreement with the
statement) to Q6B from someone who obtained their degree either online or from both online
and on-campus than from an online respondent is 0.90. For question Q6C, “I would NOT hire
someone with an online degree for a position,” the null hypothesis that the distribution of
responses is the same by the source of the respondent’s degree can be rejected at the 0.0001
significance level, and the probability of drawing a larger response (i.e., more agreement with the
statement) from someone with an on-campus degree is 0.84. Finally, for question Q11, “The type
of college or university from which the applicant obtained his or her degree would be of no
importance as a hiring criterion in our organization,” the null hypothesis that the distribution of
responses is the same regardless of the source of respondent’s degree can be rejected at the
0.0005 level of significance and the probability of drawing a larger response from a respondent
with a hybrid or online degree than from an respondent with an on-campus degree is 0.80. All of
these results suggest that respondents who obtained their degree online or through a hybrid
arrangement are more sympathetic to hiring students with inline degrees.
Table 5 provides sample medians and confidence intervals for population medians by the
whether respondent’s degree came from a traditional university of not. As suggested by the
results of the hypotheses tests just discussed, the sample medians for the questions are quite
different for these two groups. For example, for Q6C, “I would NOT hire someone with an
online degree for a position,” the sample median from respondents who went to traditional
universities is 3, which suggests that roughly equal numbers of these respondents agree and
disagree with the statement, In contrast, for respondents who either attended online universities
only or have hybrid educational backgrounds, the median response to “I would NOT hire
someone with an online degree for a position” is 1, which represents Strongly disagree, so that

13
more than half of this subgroup strongly disagree with the statement. Similarly, for respondents
who are graduates of on-campus universities, the sample medians for questions Q6B and
QA11C, which state that online students are on equal footing as traditional students, are each 2,
which means that more than half of this subsample of respondents disagrees with the statements
that job applicants who are graduates of traditional universities and job applicants who are
graduates of online universities are on equal footing.
Table 5.
Estimates of population median attitude towards hiring online students by whether respondent’s
degree was from traditional university or online/hybrid
Traditional university
Question
Sample
median
Lower
limit of
95% CI
Upper
limit of
95% CI
Q6B. In hiring decisions, I would consider a degree from
online and traditional universities the same. (N=48)
2 1.13 2.86
Q6C. I would NOT hire someone with an online degree for
a position. (N=48)
3 2.36 3.64
Q11. The type of college or university from which the
applicant obtained his or her degree would be of no
importance as a hiring criterion in our organization. (N=48)
2 1.01 3..04
(continued)
Online or hybrid
Question
Sample
median
Lower
limit of
95% CI
Upper
limit of
95% CI
Q6B. In hiring decisions, I would consider a degree from
online and traditional universities the same. (N=14)
4 2.41 4.99
Q6C. I would NOT hire someone with an online degree for
a position. (N=14)
1 1.00 2.00
Q11. The type of college or university from which the
applicant obtained his or her degree would be of no
importance as a hiring criterion in our organization. (N=14)
4 1.59 4.99
Similar results are obtained for Q12, “In your perception, which candidate would you
hire? (All candidates possess equivalent experience and degree).” The null hypothesis that the
choice of who would be hired among On-Campus candidates, Online candidates and Hybrid
candidates of equal qualifications does not differ by whether the respondent’s degree was
obtained On-campus or not can be rejected at less than the 0.001 level of significance using a chi
square test of independence.

14
The data are depicted below in Figure 6. Figure 6 indicates that a respondent with an on-
campus degree is about twice as likely to hire a job candidate with an on-campus degree than a
job candidate with an online or hybrid degree (31 on-campus versus 16 online or hybrid)
whereas a respondent with an online or hybrid degree is 14 times as likely to hire a candidate
with a hybrid degree or online degree rather than a person with an on-campus degree (14 online
or hybrid hires to 1 on-campus hire). Another way of looking at the data of Figure 6 is that 5 of
the 7 (71%) of the total hires of online students come from respondents with a degree that is
hybrid or online, even though respondents with a hybrid or online degree comprise only 22% (14
out of 62) of the total responses to the question.
Figure 6
Clustered bar chart of Q12, “In your perception, which candidate would you hire? (All
candidates possess equivalent experience and degree” by whether respondent’s degree was on-
campus or online/hybrid
Chi square tests for independence indicate that although our sample contains some
evidence of a slightly stronger bias against online students in small firms than in large or midsize
firms, none of the other demographics, including census area, industry, gender, degree or age is
associated with a larger or smaller propensity to hire online students versus traditional, on-
campus students.
Attitudes Towards Online Education
Table 6 provides the sample median response and a 95% confidence interval estimate for
the population median response to Q6A, “Online and traditional universities’ degrees are equal
in rigor,” Q7, “Graduates with online degrees have been mostly unsuccessful in my industry,”
Q10A, “Online and traditional courses offer the same flexibility,” Q10B, “Online and traditional
courses offer the same course material” and Q10C, “Online and traditional courses offer the
same learning experience.”
Table 6
Sample median and 95% confidence interval for population median for attitudes towards online
education
Survey item
Sample
Median
Lower
limit of
95% CI
Upper
limit of
95% CI
31
1
14
8
2 5
0
5
10
15
20
25
30
35
On-campus degree Hybrid or online degree
Fre
qu
en
cy c
ou
nt
Source of respondent's degree
100% On-Campus

15
Q6A. Online and traditional universities’ degrees are equal
in rigor.
2 1.74 2.26
Q7. Graduates with online degrees have been mostly
unsuccessful in my industry.
3 2.74 3.26
Q10A. Online and traditional courses offer the same
flexibility.
2 1.74 2.26
Q10B. Online and traditional courses offer the same course
material.
3 2.48 3.51
Q10C. Online and traditional courses offer the same
learning experience.
2 1.48 2.51
As Table 6 indicates, more than half of the respondents disagree with the statements that
online universities and traditional universities are equally rigorous, equally flexible, and offer the
same learning experience. None of the margins of error is greater than 0.51, which implies that
we can be 95% confident that more than half of the population disagrees with these statements as
well. Roughly equal numbers of people agree and disagree with the statements that online
students have been unsuccessful in the respondents industry and online and traditional courses
offer the same material. Once again, none of the margins of error are greater than 0.51,
suggesting that population opinion is also fairly evenly split between disagreement and
agreement on these questions.
As was done for the hiring questions, a Wilcoxon rank sum test can be used to test the
null hypothesis that the distribution of responses is the same for the respondents who attended a
traditional on-campus university and the respondents who had either an online or hybrid
education. As was true for the survey items that dealt with hiring discussed above, opinions on
the items concerning attitudes towards online universities differ by the respondent’s previous
knowledge of online education by virtue of the respondent having either a degree from an online
university or having a hybrid educational background. For example, on the question of equal
rigor, the null hypothesis that the distribution of responses is the same for respondents whose
degrees are from traditional, on-campus universities is the same as for all other respondents can
be rejected at the 0.0004 level of significance, and the probability that a respondent with a hybrid
or online degree will answer this item with a higher number (i.e., more agreement) than a
respondent with a traditional degree is 0.80.
Although we might expect that the response to “Graduates with online degrees have been
mostly unsuccessful in my industry” might be based on the respondent’s industry experience
and independent of the respondent’s educational experience, the result of the Wilcoxon rank sum
test is to reject the null hypothesis that respondents who went to traditional universities have the
same distribution of responses as respondents who had hybrid or online educations at the 0.0009
level of significance, and the probability that a respondent with a traditional degree will have a
larger response (i.e., be more likely to agree with the statement) for this statement than a
respondent with a non-traditional degree is 0.77.
Distributions of responses to the various parts of Question 10 also vary by whether the
respondent attended an online school during their university career or not. For each of question
10A, 10B, and 10C, the null hypothesis that the distribution of responses is the same across
respondents who attended traditional on-campus universities or online universities or a hybrid
can be rejected using the Wilcoxon rank sum test at the 0.01 level of significance. Traditional on-
campus students were 71% more likely to give a higher response (i.e., more agreement) to the

16
“same flexibility” question than the respondents with a non-traditional university background,
70% more likely to give a lower response (i.e., less agreement) with the “same course material”
question, and 72% more likely to give a lower response (i.e., less agreement) to the same
learning experience.
Table 7 provides the sample median and 95 confidence interval estimates for the
population median by whether the respondent is a graduate of a traditional, on-campus university
or graduated from an online school or from a hybrid background. All of the sample medians are
different between these two subsamples except for question 10A, “Online and traditional courses
offer the same flexibility,” where the median for both subsamples is 2. Additionally, for
questions Q6A,” Online and traditional universities’ degrees are equal in rigor,” and Q7,
“Graduates with online degrees have been mostly unsuccessful in my industry,” the 95%
confidence intervals for the two groups do not overlap, which implies we could reject the null
hypothesis that the groups have the same population median at the 0.05 level of significance. In
general, the group of respondents that has experienced online education has a more favorable
view of online education.
Table 7
Sample median and 95% confidence interval for population median for attitudes towards online
education by whether the respondent attended a traditional university or online/hybrid
Respondent a Traditional University Graduate
Survey item
Sample
Median
Lower
limit of
95% CI
Upper
limit of
95% CI
Q6A. Online and traditional universities’ degrees are equal
in rigor.
2 1.75 2.25
Q7. Graduates with online degrees have been mostly
unsuccessful in my industry.
3 2.93 3.06
Q10A. Online and traditional courses offer the same
flexibility.
2 1.78 2.22
Q10B. Online and traditional courses offer the same course
material.
3 2.42 3.58
Q10C. Online and traditional courses offer the same
learning experience.
2 1.89 2.11
Respondent a Graduate of Online University or Hybrid Education
Survey item
Sample
Median
Lower
limit of
95% CI
Upper
limit of
95% CI
Q6A. Online and traditional universities’ degrees are equal
in rigor.
4 3.05 4.95
Q7. Graduates with online degrees have been mostly
unsuccessful in my industry.
2 1.62 2.37
Q10A. Online and traditional courses offer the same
flexibility.
2 1.08 2.92
17
Q10B. Online and traditional courses offer the same course
material.
4 3.30 4.70
Q10C. Online and traditional courses offer the same
learning experience.
3 1.81 4.19
The Relationship between Willingness to Hire and Attitudes Towards Online Universities
One problem with analyzing the relationship between the survey items that represent
attitudes towards online education and survey items that reflect hiring practices is the small
sample size, which becomes even smaller when split into the five Likert response categories. To
overcome the problem of small numbers of responses, for each of the items on the survey that
reflects an attitude towards online universities, responses were aggregated into three broad
groups. If the original response to the item was either 1 or 2, it was placed in the combined
category Disagree, if response to the item was 3, it was placed in the category Neutral, and if
response to the item was 4 or 5, it was placed in the combined category Agree. These new
variables comprised of recoded attitude questions were then used to determine if the distribution
of willingness to hire online graduates differed across the attitudes towards the online degree by
using the Kruskal-Wallis test discussed in section I above.
First consider recoded Q6A, “Online and traditional universities’ degrees are equal in
rigor.” We can reject the null hypothesis that the distribution of responses to Q6B, “In hiring
decisions, I would consider a degree from online and traditional universities the same” is the
same across respondents who Agree, are Neutral or Disagree with “Online and traditional
universities’ degrees are equal in rigor” at the 0.0001 level of significance. For the hiring
questions Q6C and Q11, we can reject the null hypothesis that the distribution of responses is the
same across respondents who Disagree are Neutral, or Agree with Q6A at the 0.0041 level of
significance and the the 0.0001 level of significance, respectively. Table 8 provides the sample
median and a 95% confidence interval for the population median for each hiring question by
whether the respondent Disagreed, was Neutral, or Agreed with the statement “Online and
traditional universities’ degrees are equal in rigor.”
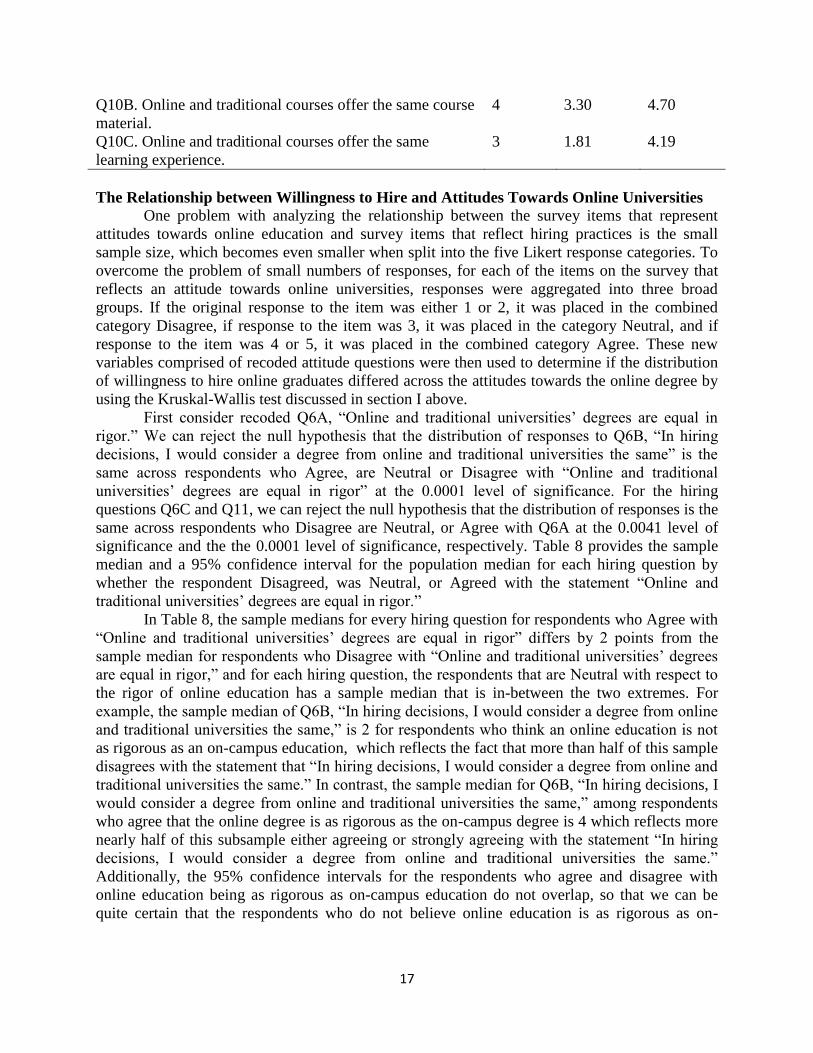
In Table 8, the sample medians for every hiring question for respondents who Agree with
“Online and traditional universities’ degrees are equal in rigor” differs by 2 points from the
sample median for respondents who Disagree with “Online and traditional universities’ degrees
are equal in rigor,” and for each hiring question, the respondents that are Neutral with respect to
the rigor of online education has a sample median that is in-between the two extremes. For
example, the sample median of Q6B, “In hiring decisions, I would consider a degree from online
and traditional universities the same,” is 2 for respondents who think an online education is not
as rigorous as an on-campus education, which reflects the fact that more than half of this sample
disagrees with the statement that “In hiring decisions, I would consider a degree from online and
traditional universities the same.” In contrast, the sample median for Q6B, “In hiring decisions, I
would consider a degree from online and traditional universities the same,” among respondents
who agree that the online degree is as rigorous as the on-campus degree is 4 which reflects more
nearly half of this subsample either agreeing or strongly agreeing with the statement “In hiring
decisions, I would consider a degree from online and traditional universities the same.”
Additionally, the 95% confidence intervals for the respondents who agree and disagree with
online education being as rigorous as on-campus education do not overlap, so that we can be
quite certain that the respondents who do not believe online education is as rigorous as on-

18
campus education are indeed generally less likely to hire graduates with degrees from online
universities.
Table 8
Sample median and 95% confidence interval for population median for each hiring question by
whether the responds Agree, Neutral, or Disagree with “Online and traditional universities’
degrees are equal in rigor.”
Respondent Disagrees with “Online and traditional universities’ degrees are equal in
rigor.”(N=35)
Hiring question
Sample
median
95% Lower
confidence limit
95% Upper
confidence
limit
Q6B. In hiring decisions, I would consider a
degree from online and traditional universities
the same.
2
1.80
2.20
Q6C. I would NOT hire someone with an online
degree for a position.
3
2.05
3.95
Q11. The type of college or university from
which the applicant obtained his or her degree
would be of no importance as a hiring criterion
in our organization.
2
0.98
3.02
Respondent is Neutral with “Online and traditional universities’ degrees are equal in
rigor.”(N=12)
Hiring question
Sample
median
95% Lower
confidence limit
95% Upper
confidence
limit
Q6B. In hiring decisions, I would consider a
degree from online and traditional universities
the same.
3
2.08
3.92
Q6C. I would NOT hire someone with an online
degree for a position.
2
0.80
3.20
Q11. The type of college or university from
which the applicant obtained his or her degree
would be of no importance as a hiring criterion
in our organization.
3
2.18
3.82
(continued)
Respondent Agrees with “Online and traditional universities’ degrees are equal in
rigor.”(N=16)
Hiring question
Sample
median
95% Lower
confidence limit
95% Upper
confidence
limit
Q6B. In hiring decisions, I would consider a

19
degree from online and traditional universities
the same.
4 3.03 4.97
Q6C. I would NOT hire someone with an online
degree for a position.
1
0.45
1.55
Q11. The type of college or university from
which the applicant obtained his or her degree
would be of no importance as a hiring criterion
in our organization.
4
3.40
4.60
Table 9 displays sample medians and 95% confidence intervals for population medians
for each of the hiring questions by whether the respondent agrees is neutral, or disagrees with
“Online and traditional courses offer the same course material.” Results in Table 9 are similar to
results in Table 8, although not quite as string insofar as the 95% confidence intervals have a
little bit of overlap between the respondents who agree and disagree with “Online and traditional
courses offer the same course material.”
Table 9
Sample median and 95% confidence interval for population median for each hiring question by
whether the responds Agree, Neutral, or Disagree with “Online and traditional courses offer the
same course material.”
Respondent Disagrees with “Online and traditional courses offer the same course
material.”(N=16)
Hiring question
Sample
median
95% Lower
confidence limit
95% Upper
confidence
limit
Q6B. In hiring decisions, I would consider a
degree from online and traditional universities
the same.
2
0.90
3.10
Q6C. I would NOT hire someone with an online
degree for a position.
3
2.07
3.93
Q11. The type of college or university from
which the applicant obtained his or her degree
would be of no importance as a hiring criterion
in our organization.
1
0.01
2.09
(continued)
Respondent is Neutral with “Online and traditional courses offer the same course
material.”(N=17)
Hiring question
Sample
median
95% Lower
confidence limit
95% Upper
confidence
limit
Q6B. In hiring decisions, I would consider a
degree from online and traditional universities
the same.
3
1.93
4.07

20
Q6C. I would NOT hire someone with an online
degree for a position.
2
0.90
3.10
Q11. The type of college or university from
which the applicant obtained his or her degree
would be of no importance as a hiring criterion
in our organization.
2
0.72
3.28
Respondent Agrees with “Online and traditional courses offer the same course
material.”(N=30)
Hiring question
Sample
median
95% Lower
confidence limit
95% Upper
confidence
limit
Q6B. In hiring decisions, I would consider a
degree from online and traditional universities
the same.
4
2.78
5.22
Q6C. I would NOT hire someone with an online
degree for a position.
2
1.13
2.87
Q11. The type of college or university from
which the applicant obtained his or her degree
would be of no importance as a hiring criterion
in our organization.
4
3.00
4.99
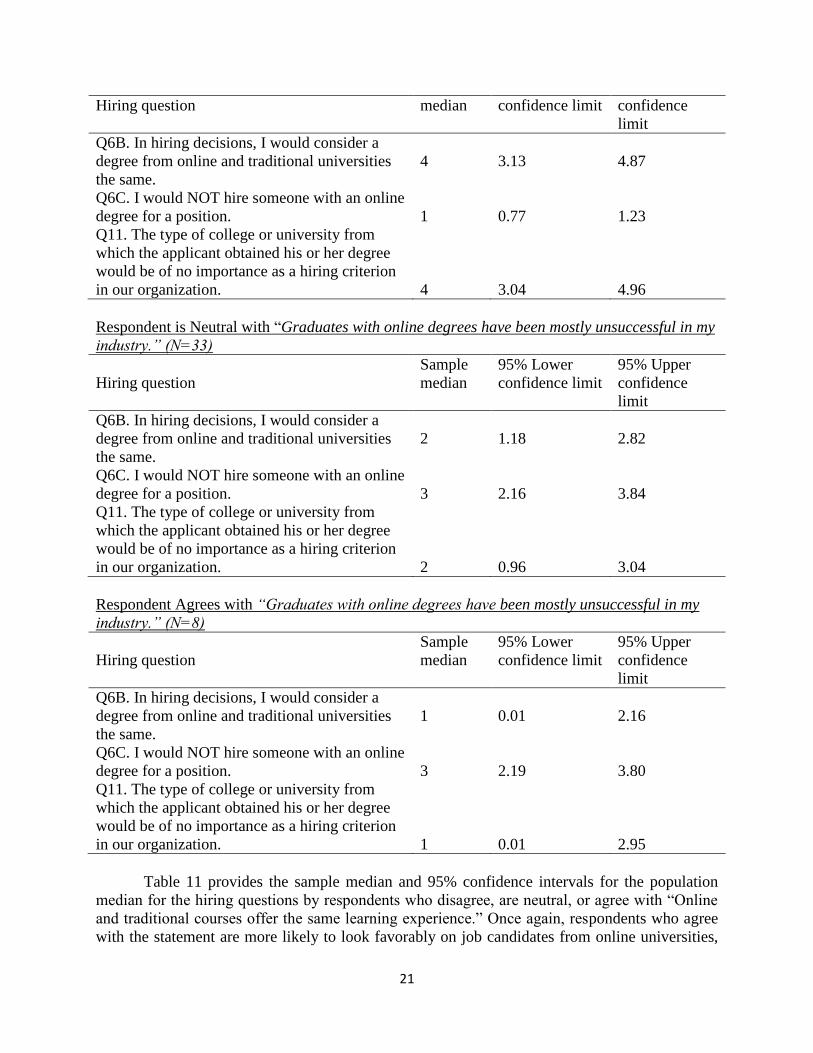
As we might expect, observing a graduate or graduates of online universities fail in their
profession has an extremely negative impact on respondents’ willingness to hire graduates of
online universities in the future. Table 10 provides sample medians and 95% confidence intervals
for population medians for the hiring questions by groups of respondents based on whether the
respondents agree, are neutral or disagree with “Graduates with online degrees have been mostly
unsuccessful in my industry.” For example, the median response to “In hiring decisions, I would
consider a degree from online and traditional universities the same” is 4 for respondents who
disagree with “Graduates with online degrees have been mostly unsuccessful in my industry”
and the median response to “In hiring decisions, I would consider a degree from online and
traditional universities the same” is 1 for respondents who agree with “Graduates with online
degrees have been mostly unsuccessful in my industry.” Also, observe that none of the
confidence intervals for the population medians for the group that agrees with “Graduates with
online degrees have been mostly unsuccessful in my industry” and the group that disagrees with
that statement overlap, so that we can be quite confident that there is a difference in the
likelihood that these populations consider the source of the degree when making a hiring
decision.
Table 10
Sample median and 95% confidence interval for population median for each hiring question by
whether the responds Agree, Neutral, or Disagree with “Graduates with online degrees have
been mostly unsuccessful in my industry.”
Respondent Disagrees with “Graduates with online degrees have been mostly unsuccessful in my
industry.”(N=23)
Sample 95% Lower 95% Upper
21
Hiring question median confidence limit confidence
limit
Q6B. In hiring decisions, I would consider a
degree from online and traditional universities
the same.
4
3.13
4.87
Q6C. I would NOT hire someone with an online
degree for a position.
1
0.77
1.23
Q11. The type of college or university from
which the applicant obtained his or her degree
would be of no importance as a hiring criterion
in our organization.
4
3.04
4.96
Respondent is Neutral with “Graduates with online degrees have been mostly unsuccessful in my
industry.” (N=33)
Hiring question
Sample
median
95% Lower
confidence limit
95% Upper
confidence
limit
Q6B. In hiring decisions, I would consider a
degree from online and traditional universities
the same.
2
1.18
2.82
Q6C. I would NOT hire someone with an online
degree for a position.
3
2.16
3.84
Q11. The type of college or university from
which the applicant obtained his or her degree
would be of no importance as a hiring criterion
in our organization.
2
0.96
3.04
Respondent Agrees with “Graduates with online degrees have been mostly unsuccessful in my
industry.” (N=8)
Hiring question
Sample
median
95% Lower
confidence limit
95% Upper
confidence
limit
Q6B. In hiring decisions, I would consider a
degree from online and traditional universities
the same.
1
0.01
2.16
Q6C. I would NOT hire someone with an online
degree for a position.
3
2.19
3.80
Q11. The type of college or university from
which the applicant obtained his or her degree
would be of no importance as a hiring criterion
in our organization.
1
0.01
2.95
Table 11 provides the sample median and 95% confidence intervals for the population
median for the hiring questions by respondents who disagree, are neutral, or agree with “Online
and traditional courses offer the same learning experience.” Once again, respondents who agree
with the statement are more likely to look favorably on job candidates from online universities,

22
with two of the three 95% confidence intervals not overlapping between the agree and disagree
groups.
The Kruskal-Wallis test for differences in distributions indicates only weak evidence for
a difference in distributions of the hiring questions for groups based on agreement, neutrality, or
disagreement with Q10A, “Online and traditional courses offer the same flexibility,” so estimates
of population medians are not provided for this grouping.
Table 11
Sample median and 95% confidence interval for population median for each hiring question by
whether the responds Agree, Neutral, or Disagree with “Online and traditional courses offer the
same learning experience.”
Respondent Disagrees with “Online and traditional courses offer the same learning
experience.”(N=40)
Hiring question
Sample
median
95% Lower
confidence limit
95% Upper
confidence
limit
Q6B. In hiring decisions, I would consider a
degree from online and traditional universities
the same.
2
1.84
2.16
Q6C. I would NOT hire someone with an online
degree for a position.
2
1.02
2.98
Q11. The type of college or university from
which the applicant obtained his or her degree
would be of no importance as a hiring criterion
in our organization.
2
1.10
2.90
Respondent is Neutral with “Online and traditional courses offer the same learning experience.”
(N=11)
Hiring question
Sample
median
95% Lower
confidence limit
95% Upper
confidence
limit
Q6B. In hiring decisions, I would consider a
degree from online and traditional universities
the same.
3
2.14
3.86
Q6C. I would NOT hire someone with an online
degree for a position.
2
1.00
3.54
Q11. The type of college or university from
which the applicant obtained his or her degree
would be of no importance as a hiring criterion
in our organization.
3
1.56
4.44
(continued)
Respondent Agrees with “Online and traditional courses offer the same learning experience.”
(N=11)

23
Hiring question
Sample
median
95% Lower
confidence limit
95% Upper
confidence
limit
Q6B. In hiring decisions, I would consider a
degree from online and traditional universities
the same.
5
3.76
5.00
Q6C. I would NOT hire someone with an online
degree for a position.
1
1.00
1.84
Q11. The type of college or university from
which the applicant obtained his or her degree
would be of no importance as a hiring criterion
in our organization.
4
3.42
4.58
Responses to Open Ended Questions
Response rates for open ended “comments” that followed Likert questions were generally
very low, with the exception of the open-ended comment after question 12, which sought the
respondent’s choice among three hypothetical candidates with online, on-campus, or hybrid
degrees and equal qualifications In the comments, a plurality of respondents said they would not
base the decision on the source of the applicant’s degree, several respondents said they preferred
hybrid because it showed adaptability to different modes of learning, and several respondents
said on-campus due to the social interaction aspect of on-campus versus online learning.
Question 8 asked for open ended responses to the question “How do you perceive
education at online universities. One lens to view the responses through is by grouping the
responses to the open-ended question Q8 by increasing responses to a hiring question, such as
Q6B, “In hiring decisions, I would consider a degree from online and traditional universities the
same.” Of the 12 people who strongly disagree with Q6B, several questioned the rigor of online
education, including doubts about the difficulty of the classes and whether the student did the
work. A similar number believe that active engagement with a professor and other students in the
classroom is an essential component to post-secondary education. At the other end of the
spectrum, of the 10 people who strongly agreed with question Q6B, several mentioned
experiences with online education and believe it to be as rigorous as on-campus and a similar
number state that whether online education is good or not depends on either the student, the
online school, or both.
Question 9 asks for thoughts about online universities that stand out. Convenience and
the access to advanced education for non-traditional students (e.g., older people who are fulltime
workers with families) are the most frequently mentioned. Cheating by students, poor quality of
education, and the perception of a lower quality education are also frequently mentioned as less
favorable traits.
Question 13 asked for perceptions of differences between on-campus and online
universities. Comments that were more favorable towards online universities stressed the
flexibility and convenience of an online education, whereas less favorable comments stressed the
collaborative, social, possibly more rigorous experience of on-campus schools.
Discussion and Conclusion

24
There are two strikingly consistent statistical regularities in the survey:
Respondents’ attitudes towards online education are significantly more positive if the
respondent has had experience with online education.
Hiring practices are less biased against graduates of online universities the more positive
a respondent’s attitude towards online universities with respect to, for example, the rigor
of online universities relative to on-campus universities.
The results suggest a variety of measures that can be taken by both universities and graduates of
online. Students need to address the issue of rigor. For some disciplines, external certification by
a professional association can stand in as certification for the quality of education. For example,
becoming a Certified Public Accountant (CPA) may be a satisfactory substitute as a signal of
knowledge for an online degree of unknown and dubious quality from the employer’s
perspective. For undergraduate degrees, additional post-undergraduate exams such as the
Graduate Record Exams (GREs), Law School Admissions Test (LSAT), or Medical College
Admissions Test (MCAT) may also add weight and credence to grade point average from an
online school, even if graduate school is not a career goal.
Additional negative employer perceptions that the job seeker can overcome include the
perception that online students are less skilled socially and by the nature of online education as
an individual pursuit, perhaps not as well suited to becoming members of a team of employees as
an on-campus student. These perceptions can be allayed by demonstration of collaborative
projects that were completed online at an online university as well as by volunteer work that
demonstrates an ability to work as part of a team. One advantage that online graduates may be
able to demonstrate is an enhanced ability to use technology to collaborate effectively and meet
project goals.
Online universities have continued to focus marketing efforts on convenience features
that all online schools share rather than features that distinguish one online school from another.
Although U.S. News ranks online schools as it does on-campus schools, the rankings of online
schools are very likely not as well known to employers as rankings of their on-campus
counterparts. One would assume that competitive pressure among online schools will ultimately
encourage online schools to develop measures of their performance and promote those measures
among the public in a manner that differentiates the schools similar to the distinction of, for
example, Ivy League on-campus schools from second or third tier state on-campus institutions.
Such measures will presumably focus on the success and accomplishments of their graduates.
Survey results discussed here suggest that the level of rigor and the similarity of course content
between on-campus and online schools are a leading source of bias against online university
graduates.
Finally, as observed above, people’s perception of online schools is more favorable if
they have attended an online school. As more people attend online schools over time and the
number of graduates of online schools sitting on the hiring side of the desk increases, we can
anticipate more favorable treatment of online university graduates.

25
References:
Adams, J., & DeFleur, M. H. (2006). The Acceptability of Online Degrees Earned as a
Credential for Obtaining Employment. Communication Education, 55(1), 32-45.
Allen, I., & Seaman, J. (2005). Growing by degrees: Online education in the United States, 2005.
Sloan Consortium, 1-24.
Astani, M, & Ready, K.J. (2010). Employer’s Perceptions of Online vs. Traditional Face-To-
Face Learning. The Business Review, 16(2)
Bonvillian, W. B., & Singer, S. R. (2013). The Online Challenge to Higher Education. Issues In
Science & Technology, 29(4), 23-30.
Chua, A., & Lam, W. (2007). Quality assurance in online education: The Universitas 21 Global
approach. British Journal Of Educational Technology, 38(1), 133-152.
doi:10.1111/j.1467-8535.2006.00652.x
Columbaro, N.L, & Monaghan, C.H, (2009). Employer Perceptions of Online Degrees: A
Literature Review. Online Journal of Distance Learning Administration, 12(1)
Hyman, P. (2012). In the Year of Disruptive Education. Communications Of The ACM, 55(12),
20-22. doi:10.1145/2380656.2380664
Nance, M. (2007). Online degrees increasingly gaining acceptance among employers. Diverse
Issues in Higher Education, 24(4), 50. Retrieved from
http://search.proquest.com/docview/194232677?accountid=14872
Linardopoulos, N. (2012). Employers' perspectives of online education. Campus - Wide
Information Systems, 29(3), 189-194. doi:http://dx.doi.org/10.1108/10650741211243201
Rauh, J. (2011). The Utility of Online Choice Options: Do Purely Online Schools Increase the
Value to Students? Education Policy Analysis Archives, 19(34),
Robinson, C. and Hullinger, H. (2008). New Benchmarks in Higher Education: Student
Engagement in Online Learning. Journal of Education for Business.
Russell, T. L. (2001). The no significant difference phenomenon: A comparative research
annotated bibliography on technology for distance education. Raleigh, NC: North
Carolina State University.
Tabatabaei, M., & Gardiner, A. (2012). Recruiters' Perceptions of Information Systems
Graduates with Traditional and Online Education. Journal Of Information Systems
Education, 23(2), 133-142.
Vukelic, B., & Pogarcic, I. (2011). Employers' Evaluation Of Online Education. Annals Of
Daaam & Proceedings, 1471-1472.