Embed Size (px)
Citation preview

Michael J. BradfordDepartment of Biology. McGill UniversityJ205 Ave. Dr. Penfield. Montreal. Quebec H3A- JBJ. CanadaPresent address: Department of Fisheries and Oceans. West Vancouver Laboratory
4 J60 Marine Drive. West Vancouver. BC V7V JN6. Canada
Precision of recruitmentpredictions from earlylife stages of marine fishes
Abstract. - To test the hypothesis that year-class strength in marine fishes is determined in the earlylarval stages. and that these stagescan be used to predict recruitment,I modeled the recruitment processusing a modified form of key-factoranalysis. Using data compiled fromthe fish literature, I found a significant relationship (R2 0.90, P«O.OOl,n 97) between the mean and interannual variance of stage-specific mortality rates that provided varianceestimates for the model. The R 2
values for the true correlation between abundances of small larvaeand subsequent recruitment for fourexample species of marine fish werepredicted to lie between 0.10 and0.57, depending on the assumptionsof the model. I therefore suggestthat recruitment levels are ~ixed
after the early-larval period. However, the precision of sample correlations are too low (10-yr data series)to empirically test whether abundances or mortality rates of early larvae are in reality strongly or poorlycorrelated with recruitment. Aftermetamorphosis, the strength of thetrue relationship and the precision ofsample correlations increase sufficiently to permit precise forecastingof recruitment. Recruitment is acomplex process in which variationin all life stages contributes substantially to the variability in final abundance; therefore, researchers shouldrecognize the importance of the laterprerecrnit stages and the interactions among all stages.
Manuscript accepted 6 May 1992.Fishery Bulletin, U.S. 90:439-453 (1992).
A major problem in the managementof marine fisheries is the unpredictable fluctuations in stock size resulting from variable recruitment. Hjort(1913) first recognized this recruitment variability and proposed a number of hypotheses that linked thesurvival of small first-feeding larvaeand subsequent year-class strength(reviewed by Wooster and Bailey1989). These hypotheses have formedthe basis of much research on theearly life history of fishes, researchwhich has been largely focused on the'critical period' during the transitionfrom endogenous to exogenousmodes of feeding. While much hasbeen learned about the biology oflarval fish, the evidence for a criticalperiod of increased mortality and alink between the larval stage andrecruitment remains equivocal (May1974, Ware and Lambert 1985,Peterman et al. 1988, Campana et aI.1989). Explanations for this failurehave ranged from sampling andtechnical difficulties, such as inappropriate scales of sampling (Leggett1986, Taggart and Leggett 1987,McGurk 1989), to the suggestion thatno such critical period exists, andthat all prerecruit stages contributeto some degree to variability in yearclass strength (Sissenwinp. 1984, Anderson 1988, Peterman et aI. 1988).
There have been few attempts tomodel the recruitment process toassess the likelihood that early-larvalmortality is a dominant feature ofyear-class variability. Manipulations
of life tables have shown that smallchanges in larval mortality have thepotential to cause great variationin recruitment (Smith 1985, Houde1987 and 1989, Pepin and Myers1991); however, the influence of thelarval stages in a fully dynamic modelincorporating variability in all stageshas not been investigated. In particular, the role of postlarval mortality in causing recruitment variabilityis unclear and has been the cause ofsome controversy (Sissenwine 1984,Peterman et aI. 1988, Taggart andFrank 1990, Wooster and Bailey1989).
An often-stated justification forresearch on the early life history offish is to provide short-term forecastsof recruitment, thereby allowingmanagers to adjust fishing regulations in response to changes in stocksize (Gulland 1989). While it is obvious that the stages very close to recruitment will give the most accuratepredictions, sampling these stages isoften difficult and expensive (Smith1985), unless they are caught incidentally in other fisheries. Rather, efforts have usually been concentratedon finding a predictive relationshipbetween recruitment and the abundance or some measure of survival oflarvae and recruits, on the workingassumption that Hjort's hypothesis ofyear-class determination at this earlystage is valid (Peterman et al. 1988,Cushing 1990).
The utility of short-term (Le., annual) predictors of recruitment in the
439

440 Fishery Bulletin 90(3). J992
larval, late-larval, and juvenile periods outlined above.Expressing survival rates as instantaneous mortalities,M = -In(S), and taking logs of the abundances give theusual equation of key-factor analysis (Varley and Gradwell 1960):
where Nk is the abundance of stage k, and m is a normal random deviate that simulates random interannualvariability in mortality of interval k.
The complete independence of mortality of one stagewith that of a subsequent stage is probably an unrealistic assumption because, for example, years whichare good for yolksac larval survival may also be goodfor the survival of older larvae. This can be modeledby introducing covariances between the intervalspecific mortality rates (Gerrodette et al. 1984). Covariation between interval-specific mortality rates wasmodeled by assuming that there was a positive corre-
where Nr and Ne are log abundances of recruits andeggs of a particular cohort, and the Mj values areinterval-specific instantaneous mortalities for four intervals defined above. I assume, following Hennemuthet al. (1980) and Peterman (1981), that log abundancesand instantaneous mortality rates are normally distributed with stage-specific variances described below.This multiplicative process results in lognormally distributed recruitment, consistent with empirical results(Hennemuth et al. 1980). All subsequent references toabundance made in this paper are to log-transformedvalues.
Since I am interested in short-term forecasting, Iassumed that stock size and, therefore, mean egg production are stationary in time and that variation in eggproduction is independent of recruitment. Thus, in theabsence of density-dependent processes, recruitmentis linearly related to egg production.
To introduce stochastic variation in the model, theabundance of eggs, Ne , and the interval-specific mortality rates were simulated as normal random variables.As the time-series of egg production was stationary andmy interest is in correlations rather than abundances,the abundance of eggs and the mortality rates all hada mean of O.
To start the sequence of calculations in a given modelyear, the initial abundance of eggs was randomlychosen. In the simplest version of the model, whichassumes mortality in each interval is independent ofthe others and is density-independent, the followingequation was then used to calculate the numbers ofeach subsequent stage:
(1)
The model
management of fish stocks has recently been challenged by Walters and Collie (1988) and Walters (1989).In simulated management examples, Walters (1989)finds that only extremely accurate forecasts of recruitment can offer significant improvements over using thelong-term mean recruitment in stock assessmentmodels. Thus, while studies of the early stages ofmarine fish may reveal insights into their ecology, itis unclear whether sufficiently accurate forecasts ofrecruitment will ever be possible from these earlystages.
In this paper I first pose the question, "How strongare the correlations between abundances or mortalityrates of the early life stages and recruitment likely tobe?" I develop a simple analytical model based on keyfactor analysis (Varley and Gradwell 1960, Manly1977). I use parameter estimates compiled from aliterature survey to calculate the expected correlationsbetween life stages for the prediction of fish recruitment. I suggest that the assertion that year-classstrength is fixed in the early-larval stages is not general, and, furthermore, under likely field conditions itwill be difficult to quantitatively test this hypothesis.
I developed a simple model to simulate the variabilityin population numbers and the strength of correlationsbetween life stages. In brief, the model generated annual abundances and mortality rates over a specifiednumber of years from which correlations betweenearly-life-history stages and recruitment were calculated. This process was repeated in a Monte Carlofashion to estimate the sampling distribution of thecorrelation coefficients.
I divided the egg-recruit period into four intervals:(1) egg-yolksac larvae, (2) early-feeding larvae, (3) latefeeding larvae, and (4) juveniles from metamorphosisto age 1, which I assumed to be the age of recruitment.I assumed that populations would be sampled at fivedistinct times that divide the egg-recruit period intofour intervals. Sampling points were: eggs spawned(Ne), first-feeding larvae (Nfl, young larvae (N1),metamorphs (Nm), and recruits (Nr). First-feeding larvaewere operationally defined as larvae that have justbegun to feed, while young larvae were defined ashaving an age of 10 days after the onset of feeding.
In any year, the number of recruits is the productof the number of eggs spawned and the survival ratesof the prerecruit stages:
Recruitment = Eggs' Sys . Sel . Su . Sj,
where the subscripts refer to the egg-yolksac, early-

Bradford: Recruitment predictions from early life stages of marine fishes 441
lation between the mortality rate of adjacent intervalsacross years. The mortality of a given interval in anymodel year then depends partially on the mortality ofthe previous period in that same year. With P equal tothe correlation between adjacent interval-specific mortality rates, I used the following equation to calculatethe mortality rate of successive intervals:
Table 1Daily mortality rates (M) and interval durations (t, in days)for four species used as examples in the analysis. Egg mortality includes the yolksac period up to first feeding; larvalperiods explained in text. Values were adapted from Houde(1987; cod Ga.dus lIw1'hua, and herring Cl-upea ha1'engus),Smith (1985; anchovy Engraulis 1I/.ordax), and Zijlstra andWitte (1985; plaice Pleuronectes platessa.).
Species
Egg
M t
Earlylarvae
M t
Latelarvae
M t
Juveniles
M t
To generalize the results, I used four fish species asexamples (Table 1). These were not chosen to be representative of a specific stock or situation, but ratherto indicate the effect of different life histories on ourability to forecast recruitment. To parameterize themodel for a specific species, the interannual varianceof the number of eggs laid and the mortality of eachprerecruit stage was required.
I obtained estimates of the variance in the numberof eggs spawned from published reconstructions ofstock abundances (Table 2). Except for cod, I used theresiduals of linear regressions of log(eggs) on time toestimate the variance. since time trends existed forsome stocks.
Estimates of the variability in mortality rates for allprerecruit stages are unavailable; I therefore soughta predictive relationship between interannual varianceand the mean of daily mortality rates. This allowedestimation of the variances of mortality rates of theearly life stages from mean daily rates. I surveyed theliterature for papers containing 2 or more years ofestimates of age- or stage-specific mortality for thesame population or stock. All stages from egg to adultwere used, for marine, freshwater, and anadramousfish species. No screening of the data was done exceptfor estimates from adult fish, where only estimatesusing methods independent of catch-data analysis wereused (Le., tagging). Most adult estimates were fromlightly or unfished stocks. In some cases I estimatedmortality from annual estimates of abundance or fromregressions of log abundance on time. All estimateswere converted to daily values using annual estimatesof stage duration if available, or the long-term averagestage duration. Daily mortalities were then averaged
Model parameters
In this equation. the actual mortality for stage k+ 1 isa linear combination of the random variables simulatingthe variability in stages k and k + 1. The correlationcoefficient determines how much mortality in stagek + 1 is similar to that of stage k. The ratio of standarddeviations in the first term scales the contribution ofthe mortality of the previous interval to the appropriatevariance. To simplify, I assumed throughout this paperthat there was no covariance between the number ofeggs spawned and mortality in subsequent intervals.
Finally. density-dependent mortality was incorporated in some versions of the model. Density-dependentmortality was added to the juvenile period, followingsuggestions of Houde (1987) and Smith (1985) that thisis the most likely interval for density effects. While anumber of formulations are possible, I chose a powerfunction (Peterman 1982):
Y = aXb,
where in this case X and Yare the abundances ofjuveniles and recruits, respectively. For densityindependent mortality, b = 1; b is <1 for densitydependent cases. The parameter a is thus the densityindependent survival rate. After taking logs, the logof the abundance of recruits is now a function ofthe log of the number of metamorphs, Nm• and thedensity-independent mortality, Mj :
(2)
In the stochastic simulations, this equation was usedto calculate recruitment with a random normal deviatesubstituted for Mj •
The full model was run for 1000 10-yr trials in SAS(1987), and a matrix of abundances and mortality ratesfor each stage was built up. For each 10-yr trial, correlation coefficients were calculated between thevarious predictors of recruitment (Le., abundances andmortality rates of each of the prerecruit stages), andthe numbers of recruits and summary statistics of thedistributions of correlation coefficients were derived.
CodHerringAnchovyPlaice
0.061 18 0.160 100.050 21 0.080 100.250 7 0.160 100.068 38 0.104 10
0.063 460.034 700.050 790.045 77
0.010 2910.015 2640.012 2690.008 245

442
over the number of years of data available, and thevariance calculated. Both variates were log-transformed, and a least-squares regression was fitted tothe data.
I used the variance-mean relationship to calculate theinterannual variance in mortality from mean daily mortality rates extracted from published life tables (Table1). I split the larval period and defined the first 10 daysof feeding as the early stage. This period correspondsto the usual definition of the 'critical period' for firstfeeding larvae (Leggett 1986): few marine larvae cansurvive more than 10 days without feeding (Miller etal. 1988). Except for anchovy, where values were takendirectly from Smith (1985), the daily mortality rate forthe early period was set at twice the average rate forthe whole larval period. Mortality rates for the lateperiod were adjusted so that the mortality for the totallarval period matched the published life tables. Theresult of these calculations was that the daily mortality rates of the early-larval interval were about 2.5times those for the late-larval period. It is difficult toassess whether this decline is realistic, because thereis considerable variability in the decline in mortalityover time in empirical studies; in many cases mortality has been found to be nearly constant over much ofthe larval period (Dahlberg 1979), while there are othercases where significant declines have been observed(Le., Savoy and Crecco 1988). Declines in mortality withlarval age may be accentuated by a possible bias dueto sampling interval (Taggart and Frank 1990). Thevariance in mortality over the duration of a particularinterval was then calculated as the product of thesquare of the interval's duration (in days), and thevariance of the daily mortality rate predicted from thevariance-mean relationship.
Covariatlon in mortality rates
Two scenarios were developed concerning the effectsof covariation between mortality rates. In the independent case, all mortality rates were varied independently of one another, while for the 'covariance'version, mortality rates of adjacent stages were assumed to be correlated across years. Few data areavailable to estimate the strength of these correlations,so I assumed P values for the correlations between adjacent Mk based on the likelihood of common agentsof mortality. I assigned a relatively low P value of0.25 for the correlation between the egg/yolksac periodand the early-larval mortality because early-larval mortality is thought to be strongly affected by feeding success, which does not affect egg survival. Nonetheless,predation pressures are probably similar for bothstages, causing some covariation in mortality rates.A P value of 0.5 was used between the early- and late-
Fishery Bulletin 90(3). J992
Table 2Interannual variability in log-transformed egg production andrecruitment. compiled from literature values. All egg estimates are residuals from linear regressions of log abundanceon time, except for cod where an intermediate value betweenherring and plaice was used.
Species Var(N.) Var(N,)
Cod 0.075 0.40Herring 0.081 1.92Anchovy 0.282 1.91Plaice 0.055 0.14
Data sourcesCod: mean of 5 northwest Atlantic stocks in Koslow et al.
(1987).Herring: mean of 7 northwest Atlantic stocks in Winters and
Wheeler (1987).Anchovy: eggs-Peterman et al. (1988), recruitment-Methot
(1989).Plaice: Bannister (1978).
larval intervals because of the similarity of habitatbetween these two periods. For the pelagic species,anchovy and herring, P = 0.25 was used for the correlation between the late-larval and juvenile intervals,while for the demersal species, cod and plaice, I setP = 0, reflecting the major habitat shifts associated withmetamorphosis.
Denslty-dependence
To explore the effects of density-dependence on correlations, I ran the model with b = 1.0, the densityindependent case, or b = 0.7, simulating moderatelystrong density-dependent mortality. The variance ofjuvenile mortality predicted from Figure 1 is in factthe sum of both the density-independent and densitydependent sources of mortality. To estimate thedensity-independent component of mortality (Mj ) required for Eq. (2), I had to remove the densitydependent mortality from the total juvenile mortalitypredicted by Figure 1. Rearranging Eq. (2) and solving for the total juvenile mortality (Mjtot) yields
In the models without covariances between mortalityrates, and in the covariance model for cod and plaicewhere there is no covariation in mortality across metamorphosis, taking variances yields
In these cases, to find Var(Mj ) I ran the stochastic

Bradford: Recrui[ment predic[ions from early life s[ages of marine fishes 443
model up to the metamorph stage and calculated themedian Var(Nm). Var(Mj ) was then found by subtraction using Var(Mjtot ) predicted from Figure 1 (Table3). For herring and anchovy in the covariance model,the equation above should include a term for the covariance between Mjtot and Nm • In these cases, Var(Mj )
was found by trial by running the model with differentvalues of Var(Mj ) and matching the median Mjtot withthe value predicted from the regression equation ofFigure 1.
To provide objective criteria for evaluating recruitment hypotheses, I defined two performance criteriafor the correlations with recruitment. Recruitmentresearch is commonly east as a search for the stagewhen "year-class strength is determined" or "recruitment is fixed." I define such a stage as having anR2>0.50 with reeruitment, i.e., being able to accountfor at least half of the variability in year-class strength.A more rigorous standard of R2>0.80 was set for correlations to be used for management purposes (Walters1989).
Results
Table 3Variances of juvenile mortality rates V(Mj ) used in the four versions ofthe model and the variance of log recruitment, V(Nr ), generated by themodel. Model versions include density-dependent (DD) or independent (DI)juvenile mortality and. in some cases, covariance between stage-specificmortality rates (COV). Variances for Mj in the DD models are for thedensity-independent component only. and were found by simulation.
Species V(Mj ) V(Nr ) V(Mj ) V(N r ) V(Mj ) V(N r ) V(Mj )
Cod 0.45 1.49 0.45 2.04 0.35 0.87 0.34Herring 0.91 1.49 0.91 2.08 0.85 1.14 0.92Anchovy 0.58 2.54 0.58 3.91 0.40 1.36 0.45Plaice 0.22 1.64 0.22 2.46 0.09 0.79 0.09
Variance-mean relationship
There was a highly significant relationship (R2 0.90,P<O.OOOl, n 97) between the log of mean daily stagespecific mortality and the log of the interannual variance in the daily mortality rate (Fig. 1). The variancein mortality rate was independent of the number ofyears of data comprising each point (multiple regression with mean mortality, P 0.81 for sample size). Thesquare root of sample size was used as a weight in allanalyses. There was no significant effect of life history(freshwater, marine, or anadramous) on the varianeemean relationship (ANCOVAR; for slopes and adjustedmeans, all P>0.20). There was no difference in the relationship between the variance and mean of mortalityamong the egg, juvenile, and adult stages (P>0.5), butthe slope for the larval stage was significantly different from the other three stages (interceptP 0.10, slopeP 0.010). Because there were a number of studies onthe same species, I also averaged the data across bothspecies and stage to decrease the non-independence ofthe data due to eommon phylogeny. The variance-meanregression for this averaged dataset was almost iden-
tical to the full set (R 2 0.92, P<O.OOOl,n 53); the regression parameters differedby <2%. In this ease, the regression for thelarvae was not different than for the otherthree stages (intercept P 0.28, slope P 0.11),suggesting the significant effect found forthe full dataset may have been due to theoverrepresentation of some species. I therefore used the overall regression (Fig. 1) topredict the variance of mortality of allstages, rather than using a separate regression for larvae. This is a conservative pro-cedure for rejecting Hjort's hypothesis,because the single regression predicts amore variable mortality for the early-larvalstage than does the separate larval regression; the single regression producesstronger correlations between abundance of
1.151.592.161.04
DD-COV
o
DD
-2-4
DI-COV
Log Daily Mortality
o
-6
DI
o 00-20 '--_"_---L_----'--_-'----_--L-_-'--_'-----l
-8
-5
Q)Ul::as.;::
-10as>C)
.9-15
FIgure'Relationship between interannual variance in daily mortality rates and mean daily mortality from published values. Symbols indicate eggs (*), larvae (¢), juveniles (_), and adults(D). Equation of the line: In{Var(M)} = 2.231 In(M) - 1.893(R~ 0.90. P<0.0001). Regression uses the square root ofnumber of years comprising each data point as weights.
o

444 Fishery Bulletin 90(3). J992
400
_.. -:.., /
300
.... .....;..
Density Dependent
Covariance
-- Density Dependent
100 200 300 400
Age (Days)
100 200
... -.-
.-'i
I..... "." -. ::....... ~....
.... -.-: ..
......~ ..0.8
0.6
0.8
Figure 3As in Figure 2, except both versions include density-dependentjuvenile mortality; lower panel also incorporates mortalitycovariances.
capability. At the end of the early-larval stage, R2values increased; and in 4 of 16 cases in Figures 2 and3 the R2 values exceeded 0.50. However, no valuesexceeded 0.80, the suggested requirement for recruitment forecasting to be beneficial for management(Walters 1989).
In nearly all cases, the majority (R2>0.50) of recruitment variation was predictable at the age of metamorphosis. The exception was the herring example,which gave low correlations because of high variability in the juvenile mortality rate. Half the correlationsmet the forecasting requirement of R2>0.80 by theage of metamorphosis; these cases occurred in specieswith the lowest juvenile mortality rates.
The success of larval mortality rates in predictingrecruitment was lower than for larval abundance estimates. The correlation between the mortality rate ofthe early-larval period and recruitment was stronglyaffected by the presence of covariation between stagespecific mortality rates; without these covariances theaverage R2 was 0.12; the largest value was 0.18.When the covariances were incorporated, these correlations are increased, although none exceed 0.5 (Fig. 4).Ten of 16 R2 values exceeded 0.50 for the much
400
400
300
300
Density Independent
Covariance
200
Density Independent
100 200
Age (Days)
100
0.8
0.6
0.4
0.2
""0l!!III~
0-end:
0.8
0.6
0.4
0.2
Figure 2Predicted R 2 values for correlations between recruitmentand early life stages for cod (0 I, anchovy (.), plaice (.), andherring (0). For each species, symbols represent, from leftto right: abundance of eggs (at t = 0), first-feeding larvae, 10-dlarvae, and metamorphs. Dotted line indicates the strengthof correlations required for recruitment prediction (Walters1989). Both examples include density-independent juvenilemortality; lower panel also incorporates covariance betweeninterval-specific mortality rates.
Correlations betweenearly life history and recruitment
Correlations between abundances at early life stagesand recruitment increased in strength as the intervalbetween the two stages decreased (Figs. 2, 3). Overall,covariances in mortality rates across stages increasedR2 values between early abundances and recruitmentby 0.01-0.25, while density-dependent juvenile mortality had only a small and usually negative effect on R2values.
Correlations between egg or first-feeding larvae andrecruitment were weak; the average R2 over all species and models was 0.05 for eggs and 0.20 for firstfeeding larvae. None of the values exceeded 0.50, indicating that these early stages have little predictive
early larvae and recruitment than the separate larvalregression.

Bradford: Recruitment predictions from early life stages of marine fishes 445
0.8
0.8 I-
Model Version
E-Iarvae
Stage Sampled
F-feedingEgg
o
0.8
1.0 ,--------------~
!"0 0.6~I1l::Jg 0.4
ri:0.2
its 95% confidence limits; the intercept was derived byconstraining the line through the mean of both variables. For the cod-DI model, increasing the slope to theupper confidence limit increased the R2 for the correlations between the abundance of recruits and earlylarvae or metamorphs by about 0.05; decreasing theslope lowered R2 values by similar amounts. Therewas little effect on correlations involving the egg orfirst-feeding stages. I also recalculated the correlationswith the intercept of the variance-mean regression atits 95% confidence limits. With the intercept at itslower limit, R2 values increased by 0.01-0.04, and atthe upper limit the correlations decreased by a similaramount. Thus, the overall results are not particularlysensitive to the sampling error associated with the datain Figure 1.
I also varied the length of the early-larval period. Inthe life tables (Table 2), I fixed the early-larval periodat 10 days and set the daily mortality rate at twice theaverage for the whole larval period. In sensitivity runsI varied this period from 5 to 15 days; duration andmortality rate of the late-larval period were recalculated to keep the total mortality for the larval periodconstant. The duration of this period of high larval mortality had a strong effect on the strength of the correlation between abundance of larvae sampled at theend of the early period and recruitment. When theearly-larval period was increased by 5 days, the R2 inthe cod-DI model increased by 0.21 (Fig. 6).
01 00
0.4
0.6
~.-'-~_ ..~ ... ~ ...•
.-'--'--'.'-~~::;;'.,.G-____ ..~ .. - .. - .. - .. . '" - -0....~tf" /..'
0.: L...L
G_-_-_-_-_-_-_-_s'-__/_···_·__-'-' -1,_1
Ol-CQV OO-CQV
0.6 I-
longer late-larval period. The recruitment-forecastingthreshold of 0.8 was never reached for correlations between recruitment and any larval mortality rate.
A wide range of R2 values can result from a shorttime-series. For example, the 95% range of R'!. valuesfor the correlation of early cod larvae with recruitment(10-yr time-series) in the density-independent modelthat includes covariance in mortality rates extendedfrom 0.07 to 0.86 (Fig. 5). The 95% range decreasesif the true relationship between the variables isstronger; for cod metamorphs the conclusion that thisstage can be used to describe the majority of recruitment variation will nearly always be reached (Fig. 5).
Sensitivity analysis
Two sensitivity analyses were conducted to assessdependence of the results on input parameters. First,stage-specific variances in mortality were recalculatedwith the slope of the variance-mean regression set at
Figure 4Predicted R~ values for correlations between recruitmentand early- and late-larval mortality rates for cod (0), anchovy(_), plaice (*), and herring (0). Axis labels refer to four versions of the model, incorporating density-independent (01) or-dependent (DD) juvenile mortality and covariances betweenmortalities (COV).
Figure 5Variability in sample R~ values (IO-yr series) for the correlation between recruitment and abundances of early stages forcod in the model, with density-independent juvenile mortality and mortality covariances. Shown are the median (bar),interquartile (rectangle), and 95% ranges (line). Data are from1000 runs; note that the criterion for significance (R 2 >O,a 0.05) is 0.40.

446 Fishery Bulletin 90(3). J992
0.8.------------------,
Discussion
Figure 6Effects of altering length of the early-larval stage onrecruitment correlation for the cod DI-COV model.Early stage is defined as having twice the daily mortality rate of the total larval period. Shown are resultswith the early stage set at 5 (_),10 (+), and 15 (D)days. Symbols represent, from left to right: egg, yolksac larvae, early larvae, and metamorph stages.
in less than half of the cases. Variability in the latelarval and juvenile stages is still large enough to influence the strength of correlations of recruitment withlarval abundances. My results suggest that the stage'when year-class strength is determined' (defined hereas R2>0.5) occurs after this early critical period.However, the sensitivity analysis indicates that thestrength of the correlation between the abundance oflarvae and recruitment will depend strongly on the rateat which mortality declines during the larval period,and at what age the larvae are being sampled.
Strong linkages in mortality rates across intervalsalso render the definition of a 'critical period' less concise. Correlations between early life stages and recruitment were stronger when there were linkages, becausesurvival to the age of sampling will be correlated tosurvival in the future. An estimate of mortality or abundance in one stage will be an index of mortality in allearly life stages. This may be especially true for theearly-larval stages (the classical 'critical period') because small larvae are probably subjected to a similarsource of mortality as older larvae, especially if spawning occurs over a protracted period. mixing larvae ofdifferent ages together in the same body of water. Inaddition, environmental conditions during an earlystage may affect survival of the cohort in the future.Poor feeding conditions of early larvae, for example,may have a long-term effect on growth and survival(Frank and McRuer 1989). In these cases, recruitmentwill be somewhat predictable from the early-larvalstages, but this is not support for a strict interpretation of Hjort's hypothesis that an early critical perioddetermines recruitment because mortality is correlatedacross all prerecruit stages.
The difficulty and expense of obtaining accurateestimates of abundances of eggs and larval fish haveled to increased interest in finding indirect estimatesof mortality rates that may be simpler to collect andcould provide an index of year-class strength. Suchmeasures include estimates of growth (Houde 1987),condition, lipid content (Theilacker 1986), and RNA/DNA ratios (Buckley and Lough 1987) as well as oceanographic variables such as upwelling and wind events(Peterman and Bradford 1987). My results show thatsuch mortality estimates made on small larvae are notlikely to be strongly correlated with recruitment(Fig. 4). Mortality estimates on older larvae will havestronger correlations, potentially closer to a value of0.50. Note that the correlations in Figure 4 are fordirect estimates of mortality, indirect indices will bemore poorly related to recruitment. A combination oflarval abundances and mortality rate estimates mayallow more precise prediction of recruitment (Grahamand Sherman 1987, Frank and McRuer 1989); if estimates are accurate and are based on older larvae,
806040
Age (Days)
"Cl!!III
5- 0.4end:.
0.6
My results indicate that only predictions of recruitmentbased on abundances of postmetamorphic fish are likelyto be useful for the management of marine fishes. Thecontribution to recruitment variation made by eggnumber (and, therefore, stock biomass) is very small,a prediction confirmed by most stock-recruit data (Parrish 1973). Correlations involving the abundance ofearly larvae are stronger, but are still too weak forforecasting. The model R2 values for correlations involving early larvae are similar to the range, extendingfrom 0.01 to 0.66, for published values compiled byPeterman et al. (1988). Accurate recruitment forecasting may be possible by sampling during the latelarval period (Graham and Sherman 1987). However,this is highly dependent on parameters and the dynamics of the particular species; only for cases with lowvariability in juvenile mortality or with mortality ratescorrelated across stages are the abundances of late larvae likely to be useful for recruitment forecasting.
Research on recruitment variability has been oriented to the early-larval stages largely as the resultof Hjort's (1913) hypotheses and the observation thatmost of the individuals of a year-class die during thefirst few weeks of life (Wooster and Bailey 1989). Inmy four example species, the average cumulative mortality on the cohort to the 10-d larval stage is 93%(Table 1), yet the variation in abundance of these larvae explains more than 50% of recruitment variability

Bradford: Recruitment predictions from early life stages of marine fishes 447
correlations nearly as strong as those predicted formetamorphs might be possible.
The correlations will be weaker if sampling errorsare included in the estimates of abundance. Preliminarysimulations with random sampling errors with a coefficient of variation of 50% (untransformed abundances)decreased R2 values in Figures 2 and 3 by 0.10-0.15(Bradford unpubl.). Biased estimates, e.g., due to gearavoidance (Lo et al. 1989), will not affect correlationsbetween an early stage and recruitment, unless themagnitude of the bias is correlated with the estimate.Precision, through the use of consistent techniqueacross years, is more important for the purposes offorecasting. Large-scale surveys of abundance of latelarvae or juveniles may be sufficiently accurate for theforecasting of recruitment (Lo et al. 1989) if the stagesampled is likely to be strongly correlated \\ ith recruitment (Fig. 5).
An implicit, though infrequently stated, assumptionof research on early-life-history influences on recruit·ment is that the mean and the interannual variance ofmortality rates are correlated. High mortality alone willnot cause recruitment variation; it must also be coupledwith high interannual variability. The data compiled inFigure 1 provide evidence that this is generally true,and that the interannual variability in the larval periodis proportionately no greater than that found for otherstages. In addition, my sensitivity analysis suggeststhat the general conclusions of this paper are robustto the sampling variability of this relationship. However, detailed investigation of the recruitment dynamics of an individual species will require estimation ofthe variance of stage-specific mortality rates, becausethe predictive power of Figure 1 is still relatively lowfor any particular case, and the biology of an individualspecies may not result in rates that follow the overallaverage pattern. Examples are provided by specieswhich spawn during periods of extreme climatic eventssuch as wind storms (e.g., capelin Mallotus l'illosus orred drum Sc-iaenaps ocellatus, reviewed by Taggart andFrank 1990). In these cases, interannual variability inthe mortality of the earliest stages is probably largerthan predicted by the regression of Figure 1, and thecorrelation between the early stages and recruitmentis likely to be stronger than I have predicted. In contrast, for the North Sea plaice a relationship (R2 0.7)was found between egg abundance and recruitment(Zijlstra and Witte 1985), which is higher than mymodel predicts for this species (although just withinthe 95% range). This species has relatively low recruitment variation, suggesting that larval and juvenile survival rates are not as variable as predicted by Figure1, or that density-dependent mortality might be important in regulating recruitment (Zijlstra and Witte1985).
The recruitment variances generated by various versions of the model tend to be higher than publishedvalues (Tables 2, 3). These literature estimates will likely be underestimates of the true variability in recruitment, because errors in catch sampling and ageing cangreatly reduce recruitment variability estimated fromsequential population analysis (Rivard 1989, Bradford1991). Alternatively, my recruitment variances couldbe too high because I have either overestimated thevariances of mortality rates or underestimated theseverity of density-dependent mortality. Since the datain Figure 1 include sampling error, all of the variancesin Tables 2 and 3 will be somewhat inflated. If sampling error is proportional to the rate of mortality, thesensitivity analysis suggests that removing samplingerror (i.e., lowering the intercept of Fig. 1) will haveonly a slight effect on recruitment correlations.
One additional source of variability not explicitly considered in my analysis is the effect of varying stageduration, due to interannual variability in growth rates.Houde (1987, 1989) has demonstrated through life-tablemanipulation that small variations in larval growth mayhave large effects on the number of metamorphs produced. The effect on recruitment will be bufferedsomewhat as shortening the larval period will increasethe length and, therefore, the total mortality of thejuvenile stage. However, if the variation in growthrates is due to temperature, Pepin (1991) suggests thatthe offsetting effects of temperature on developmentand mortality will result in no net effect of temperaturevariation on cumulative mortality over the egg and larval stages. In this case, by not including variation ingrowth rates I will have overestimated the variabilityin larval mortality. However, to some extent the effects of growth-rate variation are already included inmy model because many of the estimates in Figure 1are based on total stage length and will, therefore, include the effects of varying stage duration caused byvariation in growth rates in the calculation of theaverage daily mortality rate.
The sampling variability of correlations from shortdatasets makes it difficult to draw inferences about thecauses of recruitment variability. This low precisionsuggests that confidence limits around the sampleestimates, r or R2, should always be supplied, muchin the same way that standard errors are given for sample means. A population correlation from Figures 2 and3 is a value that would be obtained from a very longtime-series of data, and is a true measure (in the context of the model) of the contribution of an early lifestage to recruitment variation. However, there is agood chance (e.g., >30% for early larvae in Fig. 5) thata sample correlation between the abundance of an earlystage and recruitment may not be significantly different from O. Even if the correlation is significant,

448
statements about whether the relationship is, in reality, weak or strong cannot be made because the 95%confidence limits around the sample correlation arewide (Fig. 5). Published correlations between early lifestages and recruitment vary greatly in strength (e.g.,Peterman et al. 1988, Stevenson et al. 1989, Cushing1990); unfortunately with short data series, true differences in the biology of these species cannot bedistinguished from sampling error. The correlationsbetween early larval abundances and recruitment compiled by Peterman et al. (1988) also illustrate this point:in only 1 of 7 cases do the 95% confidence limits aroundR2 not include both 0.2 and 0.8. This problem of lowprecision is less serious when the true correlation islikely to be fairly high (Fig. 5, metamorphs).
The precision of correlations is also relevant to analyses involving oceanographic or climatic variables andrecruitment. These studies usually invoke hypothesesthat the environmental variables are agents of larvalmortality, either through transport or their effects onthe production or concentration of larval food (Shepherd et al. 1984, Hollowed and Bailey 1989); therefore,their true correlations with recruitment can be nostronger than the correlations for mortality ratesdirectly (Fig. 4). Yet the sampling variability of R2 fora short series of data suggests that there will be a goodchance of finding at least one strong sample correlation among a group of 4-5 predictors that may be, inreality, only weakly related to recruitment. Addingmore data will result in the sample correlation declining towards P ; this frequently results in the sample correlation becoming nonsignificant (Koslow et al. 1987,Walters and Collie 1988, Prager and Hoenig 1989). Mymodel results suggest environmental variables will bestrongly correlated with recruitment only if the environmental factor is related to mortality across allprerecruit stages (e.g., Fig. 4; covariance models).
In summary, my analysis indicates that it is unlikelythat estimates of abundance of survival rates of the eggand early-larval stages of marine fish will lead to usefulpredictions of recruitment. Although mortality in theearliest life stages is a major source of recruitmentvariability, the late-larval and juvenile periods are alsoimportant. Peterman et al. (1988), Fritz et al. (1990),and Pepin and Myers (1991) argue for the need for coordinated research on all prerecruit stages, rather thanfocusing only on the early stages, and my results support this view. The modeling approach I have developedhere can be easily modified for any particular speciesto estimate a priori the likelihood of success of proposed recruitment research and to suggest particularly fruitful avenues of investigation.
Fishery Bulletin 90(3). J992
Acknowledgments
This analysis would not have been possible withoutthe efforts of many scientists in estimating the vitalrates of fish populations in multiyear studies. I thankG. Cabana for discussions of variability and correlationsand for help collecting data. This paper has been improved through the comments of G. Cabana. M. LaPointe, B. McKenzie, R.M. Peterman and D. Roff, andtwo reviewers. Partial support was provided by postgraduate fellowships from the National Science andEngineering Research Council of Canada (NSERC) andthe Max Bell Foundation, and NSERC operatinggrants to D. Roff.
Citations
Ahlstrom, E.H.1954 Distribution and abundance of egg and larval populationsof the Pacific sardine. Fish. Bull., U.S. 56:83-140.
Alexander, G.R., and D.S. Shetter1969 Trout production and angling success from matched
plantings of brook trout and rainbow trout in East Fish Lake,Michigan. J. Wildl. Manage. 33:682-692.
AI-Hossaini, Moo Q. Lui, and T.J. Pitcher1989 Otolith microstructure indicating growth and mortality
among plaice, Pleuronectes platessa, post-larval sub-cohorts. J.Fish. BioI. 35(Suppl. A):81-90.
Allen, R.L.1977 Status of the upper Columbia river salmon and steelhead
runs. In Schwiebert, E. (ed.), Columbia river salmon andsteelhead, p. 23-30. Am. Fish. Soc. Spec. Pub!. 10, Bethesda.
Anderson, J.T.1984 Early life history of redfish (Sebastes spp.) on Flemish
Cap. Can. J. Fish. Aquat. Sci. 41:1106-1116.1988 A review of size dependent survival during pre-recruit
stages of fishes in relation to recruitment. J. Northwest At!.Fish. Sci. 8:55-66.
Bannister, R.C.A.1978 Changes in plaice stocks and plaice fishelies in the North
Sea. Rapp. P.-Y. Reun. Cons. Int. Explor. Mer 172:86-101.Bannister, R.C.A., D. Harding, and S.J. Lockwood
1974 Larval mortality and subsequent year-class strength inthe plaice (Pleuronectes plate-ssa). In Blaxter, J.H.S. (ed.), Theearly life history of fish, p. 21-37. Springer-Yerlag, NY.
Barnaby, J.T.1944 Fluctuations in abundance of red salmon, Oncorhynch1/snerka, of the Karluk River, Alaska. Fish. Bull., U.S. 50:237-295.
Bradford, M.J.1991 Effects of ageing errors on recruitment time series esti
mated from sequential population analysis. Can. J. Fish.Aquat. Sci. 48:555-558.
Buckley, L.Joo and R.G. Lough1987 Recent growth, biochemical composition, and prey field
on larval haddock (MelanograllmJ;us aeglRfinus) and Atlanticcod (Gadus lIwrh-ua) of Georges Bank. Can. J. Fish. Aquat.Sci. 44:14-25.

Bradford: Recruitment predictions from early life stages of marine fishes 449
Campana. S.E.. K.T. Frank. P.C.F. Hurley. P.A. Koeller.F.H. Page, and P.C. Smith
1989 Survival and abundance of young Atlantic cod (Gadusnwrhua) and haddock (Melanog1"Qiln1nll,s aegl~fin·II,s) as indicators of year-class strength. Can. J. Fish. Aquat. Sci. 46(Suppl. 1):171-182.
Chadwick, E.M.P.1982 Stock-recruitment relationship for Atlantic salmon (SaIWJ
salar) in Newfoundland rivers. Can. J. Fish. Aquat. Sci. 39:1496-1501.
1987 Causes of variable recruitment in a small Atlantic salmonstock. In Dadswell, M.J., et aI. (eds.), Common strategies ofanadromous and catadromous fishes, p. 390-401. Am. Fish.Soc. Symp. 1, Bethesda.
Clady, M.D.1975 Early survival and recruitment of smallmouth bass in
northern Michigan. J. Wildl. Manage. 39:194-200.Cushing, D.H.
1990 Plankton production and year-class strength in fishpopulations: An update of the match/mismatch hypothesis.Adv. Mar. BioI. 26:250-294.
Dahlberg, M.D.1979 A review of survival rates of fish eggs and larvae in rela
tion to impact assessments. Mar. Fish. Rev. 41(3):1-12.Dey. W.P.
1981 Mortality and growth ofyoung-of-year striped bass in theHudson river estuary. Trans. Am. Fish. Soc. 110:151-157.
Dragesund, 0 .• and O. Nakken1973 Relationship between parent stock size and year class
strength in Norwegian spring spawning herring. Rapp.P.-V. Reun. Cons. Int. Explor. Mer 164:15-29.
Farris, D.A.1960 Abundance and distribution of eggs and larvae and sur
vival of larvae of jack mackerel (Trach:urus symmetricus).Fish. Bull., U.S. 61:247-279.
Foerster, R.E.1968 The sockeye salmon (Oncorhynchus nerka). Fish. Res.
Board Can. Bull. 162, 422 p.Forney, J.L.
1971 Development of dominant year classes in a yellow perchpopulation. Trans. Am. Fish. Soc. 100:739-749.
Frank. K.T.• and J.K. McRuer1989 Nutritional status offield-eollected haddock (Melanogram
-mus aeglefinus) larvae from southwestern Nova Scotia: Anassessment based on morphometric and vertical distributiondata. Can. J. Fish. Aquat. Sci. 46(Suppl. 1):125-133.
Franklin, D.R.• and L.L. Smith1963 Early life history of the northern pike with special ref
erence to the factors influencing the numerical strength of yearclasses. Trans. Am. Fish. Soc. 92:91-110.
Freeburg, M.H., W.W. Taylor, and R.W. Brown1990 Effect of egg and larval survival on year-class strength
of lake whitefish in Grand Traverse Bay, Lake Michigan.Trans. Am. Fish. Soc. 119:92-100.
Fritz, E.S., L.B. Crowder. and R.C. Francis1990 The National Oceanic and Atmospheric Administration
plan for recruitment fisheries oceanography research. Fisheries (Bethesda) 15:25-31.
Gerrodette, T•• D. Goodman, and J. Barlow1984 Confidence limits for population projections when vital
rates vary randomly. Fish. Bull, U.S. 83:207-215.Graham, J.J.. and K.M. Sherman
1987 Recruitment mechanisms of 2-year-old atlantic herringto the Maine fishery: The larval stage. In Hoyt, R.D. (ed.),lOth annual larval fish conference, p. 61-68. Am. Fish. Soc.Symp. 2. Bethesda.
Gulland, J.A.1989 Fish populations and their management. J. Fish. BioI.
35A:1-9.Harding, D., J.H. Nichols. and D.S. Tungate
1978 The spawning of plaice (Pleuronectes platessa) in thesouthern North Sea and English Channel. Rapp. P.-V. Reun.Cons. Int. Explor. Mer 172:102-113.
Hatch, J.T., and J.C. Underhill1988 Abundance, distribution, and mortality of larval lake
herring in western Lake Superior. In Hoyt, R.D. (ed.), 11thannual larval fish conference, p. 95-103. Am. Fish. Soc.Symp. 5, Bethesda.
Heessen, H.J.L., and A.D. Rijnsdorp1989 Investigations on egg production and mortality of cod(Gadus morhll,a) and plaice (Pleuronectes platessa) in thesouthern and eastern North Sea in 1987 and 1988. Rapp.P.-V. Reun. Cons. Int. Explor. Mer 191:15-20.
Hennemuth, R.C.. J.E. Palmer, and B.E. Brown1980 A statistical description of recruitment in eighteen
selected fish stocks. J. Northwest Atl. Fish. Sci. 1:101-111.Hjort, J.
1913 Fluctuations in the great fisheries of northern Europeviewed in the light of biological research. Rapp. P.-V. Reun.Cons. Int. Explor. Mer 19:1-228.
Hollowed, A.B., and K.M. Bailey1989 New perspective on the relationship between recruitment
of Pacific hake (Merlucius productus) and the ocean environment. In Beamish, R.J., and G.A. McFarlane (eds.), Effectsof ocean variability on recruitment and an evaluation ofparameters used in stock assessment models, p. 207-220.Can. Spec. Publ. Fish. Aquat. Sci. 108.
Houde. E.D.1987 Fish early life dynamics and recruitment variability.
In Hoyt, R.D. (ed.), lOth annual larval fish conference, p.17-29. Am. Fish. Soc. Symp. 2, Bethesda.
1989 Subtleties and episodes in the early life of fishes. J. Fish.BioI. 35A:29-38.
Howe, A.B.• P.G. Coates, and D.E. Pierce1976 Winter flounder estuarine year-class abundance, mortal
ity, and recruitment. Trans. Am. Fish. Soc. 105:647-657.Johannessen, A.
1986 Recruitment studies of herring in Lindaaspollene,western Norway, 1-3. Fiskeridir. Skr. Ser. Havunders. 18:139-240.
Jonsson. B•• S. Skulason, S.S. Snorrason, O.T. Sandlund,H.J. Malmquist, P.M. Jonasson, R. Gydemo. and T. Lindem
1988 Life history variation of polymorphic Arctic charr (Satvelinus alpinus) in Thingvallavatn. Iceland. Can. J. Fish. Aquat.Sci. 45:1537-1547.
Kawanabe. H.1969 The significance of social structure in production of the
ayu, PI.ectoglos$us altivel-is. In Northcote, T.G. (ed.), Symposium on salmon and trout in streams, p. 243-265. H.R.MacMillan Lect. Fish., Univ. Brit. Col., Vancouver.
Koslow, J.A., K.R. Thompson. and W. Silvert1987 Recruitment to northwest Atlantic cod (Gadus mordua)
and haddock (Melanogra-m-mus aeglefinus) stocks: The influence of stock size and climate. Can. J. Fish. Aquat. Sci.44:22-39.
Kramer, R.H., and L.L. Smith1962 Formation of year classes in largemouth bass. Trans.
Am. Fish. Soc. 91:29-41.

450
Leggett, w.e.1986 The dependence of fish larval survival on food and pred
ator densities. In Skreslet, S. (ed.), The role of freshwateroutflows in coastal marine systems, p. 117-137. SpringerVerlag, Berlin.
Lo, N.C.H., J.R. Hunter. and R.P. Hewitt1989 Precision and bias in estimates of larval mortality. Fish.
BulL, U.S. 87:399-416.Lockwood. S.J.
1980 Density-dependent mortality in O-group plaice (Pleuronectes platessa) populations. J. Cons. Cons. Int. Explor. Mer39:148-153.
Manly, B.J.F.1977 The determination of key factors from life table data.
Oecologia 31:111-117.Manooch, C.S., and G.R. Huntsman
1977 Age, growth. and mortality of the reg porgy, Pagruspargrus. Trans. Am. Fish. Soc. 106:26-35.
Mansfield, P.J., and J.D. Jude1986 Alewife (Alosa pseudoha1'engus) survival during the first
growth season in southeastern Lake Michigan. Can. J. Fish.Aquat. Sci. 43:1318-1326.
Mathews, S.B.1984 Variability of marine survival of Pacific salmonids: A
review. In Pearcy, W.G. (ed.), The influence of ocean conditions on the production of salmonids in the north Pacific, p.161-182. Oreg. State Univ., Corvallis.
Mathews. S.B., and F.W. Olson1980 Factors affecting Puget Sound coho salmon (Onc.orh!f'l..
C.h1/S kisutch) runs. Can. J. Fish. Aquat. Sci. 37:1373-1378.May. R.C.
1974 Larval mortality in marine fishes and the critical periodconcept. In Bla.''Cter, J.H.S. (ed.I, The early life history offish,p. 3-19. Springer-Verlag, Berlin.
McDonald. J., and J.M. Hume1984 Babine Lake sockeye salmon (Oncorhynchus nerka)
enhancement program: Testing some of the major assumptions. Can. J. Fish. Aquat. Sci. 41:70-92.
McGurk, M.D.1989 Advection, diffusion and mortality of Pacific herring lar
vae elupea hareng'l.l.8 pallasi in Barnfield Inlet. British Columbia. Mar. Ecol. Prog. Ser. 51:1-18.
McNeil. W.J.1969 Survival of pink and chum salmon eggs and alevins. In
Northcote, T.G. (ed.), Symposium on salmon and trout instreams, p. 101-117. H.R. MacMillan Lect. Fish., Univ. Brit.Col., Vancouver.
Methot, R.D.1989 Synthetic estimates of historical abundance and mortality
for the northern anchovy. In Edwards, E.F., and B.A. Megrey(eds.), Mathematical analysis of fish stock dynamics, p.66-82. Am. Fish. Soc. Symp. 6, Bethesda.
Miller, T.J., L.B. Crowder, J.A. Rice, and E.A. Marshall1988 Larval size and recruitment mechanisms in fishes:
Towards a conceptual framework. Can. J. Fish. Aquat. Sci.45:1657-1670.
Nickelson, T.E.1986 Influences of upwelling, ocean temperature, and smolt
abundance on marine survival of coho salmon (Onc.orhynchuskisutc.h) in the Oregon production area. Can. J. Fish. Aquat.Sci. 43:527-535.
Nielson, L.A.1980 Effect of walleye (Stizostedion ·vitreum 1titreu7l~) preda
tion on juvenile mortality and recruitment of yellow perch(Perca.flavescens) in Oneida Lake, New York. Can. J. Fish.Aquat. Sci. 37:11-19.
Fishery Bulletin 90(3). J992
Palomera, I.. and J. L1eonart1989 Field mortality estimates of anchovy larvae, Engra1tlis
enerasicolus, in the western Mediterranean. J. Fish. BioI.35(Suppl. A):133-138.
Parker. R.R.1968 Marine mortality schedules of pink salmon of the Bella
Coola River, central British Columbia. J. Fish. Res. BoardCan. 25:757-794.
Parrish. B.B. (editor)1973 Fish stocks and recruitment. Rapp. P.-V. Reun. Cons.
Int. Explor. Mer 164.Pearcy, W.G.
1962 Ecology of an estuarine population of winter flounder,Pseudople1tronec.tes americ.amtS. III. Distribution, abundance,growth, and production of juveniles; survival of larvae andjuveniles. Bull. Bingham Oceanogr. Collect. Yale Univ. 18:39-64.
Pepin. P.1991 Effect of temperature and size on development, mortality
and survival rates of the pelagic early life stages of marinefish. Can. J. Fish. Aquat. Sci. 48:503-518.
Pepin, P.. and R.A. Myers1991 Significance of egg and larval size to recruitment vari
ability of temperate marine fish. Can. J. Fish. Aquat. Sci.48:1820-1828.
Peterman, R.M.1981 Form of random variation in salmon smolt-adult relations
and its influence on production estimates. Can. J. Fish. Aquat.Sci. 38:1113-1119.
1982 Nonlinear relation between smolts and adults in BabineLake sockeye salmon (Onc.orhync.k~ nerka) and implicationsfor other salmon populations. Can. J. Fish. Aquat. Sci. 39:904-913.
Peterman. R.M., and M.J. Bradford1987 Wind speed and mortality rate of a marine fish, the
northern anchovy, Engraulis 1nordax. SCIence (Wash. DC)235:354-356.
Peterman, R.M.. M.J. Bradford. N.C.H. Lo, and R.D. Methot1988 Contribution of early life stages to interannual variability
in recruitment of northern anchovy (E'YIffI'U;ulis 1nordax). Can.J. Fish. Aquat. Sci. 45:8-16.
Poole. J.C.1969 A study ofwinter flounder mortality rates in Great South
Bay, New York. Trans. Am. Fish. Soc. 98:611-616.Prager, M.H.. and J.H. Hoenig
1989 Superposed epoch analysis: A randomization test of environmental effects on recruitment with application to chubmackerel. Trans. Am. Fish. Soc. 118:608-618.
Pritchard, A.L.1948 Efficiency of natural propagation of the pink salmon
(Oncorhynch:us gorbuscha) in McClinton Creek, B.C. J. Fish.Res. Board Can. 7:224-236.
Rivard, D.1989 Overview of the systematic, structural, and sampling
errors in cohort analysis. In Edwards, E.F., and B.A. Megrey(eds.), Mathematical analysis of fish stock dynamics, p.49-65. Am. Fish. Soc. Symp. 6, Bethesda.
Roberson. K., and R.H. Holder1987 Development and evaluation of a streamside sockeye
salmon (Oncorhynchus nerka) incubation facility, GulkanaRiver, Alaska. In Smith, H.D., L. Margolis, and C.C. Wood(eds.), Sockeye salmon (Onc.orhynckus nerka) population biologyand future management, p. 191-197. Can. Spec. Pub!. Aquat.Sci. 96.

Bradford: Recruitment predictions from early life stages of marine fishes 451
SAS1987 SAS/STAT guide for personal computers, version 6.
SAS Inst. Inc.. Cary, NC.Savoy. T.F.• and V.A. Crecco
1988 The timing and significance of density-dependent anddensity-independent mortality of American shad. Alosa. sapidissima. Fish. Bull.. U.S. 86:467-488.
Seelbach, P.W.1987 Effect of winter severity on steelhead smolt yield in
Michigan: An example of the importance of environmentalfactors in determining smolt yield. In Dadswell. M.J.. et a!.(eds.), Common strategies of anadromous and catadromousfishes. p. 441-450. Am. Fish. Soc. Symp. 1. Bethesda.
Shepherd. J.G.. J.G. Pope, and R.D. Cousens1984 Variations in fish stocks and hypotheses concerning their
links with climate. Rapp. P.-V. Reun. Cons. Int. Explor. Mer185:255-267.
Shetter, D.S.1961 Survival of brook trout from egg to fingerling stage in
two Michigan trout streams. Trans. Am. Fish. Soc. 90:252-258.
Sissenwine, M.P.1984 Why do fish populations vary? In May. R.M., (ed.), Ex
ploitation of marine communities, p. 59-94. Springer-Verlag,Berlin.
Smith, P.E.1985 Year-class strength and survival of O-group clupeoids.
Can. J. Fish. Aquat. Sci. t1.2(SuPP!. 1):69-82.Stevenson, D.K., K.M. Sherman, and J.J. Graham
1989 Abundance and population dynamics of the 1986 yearclass of herring along the Maine coast. Rapp. P.-V. Reun.Cons. Int. Explor. Mer 191 :345-350.
Sunby, S.. H. Bjorke, A.V. Soldal. and S. Olsen1989 Mortality rates during the early life stages and year-class
strength of northeast Arctic cod (Gad1Ls mo,/·hM). Rapp.P.-V. Reun. Cons. Int. Explor. Mer 191:351-358.
Taggart, C.T., and K.T. Frank1990 Perspectives on larval fish ecology and recruitment pro
cesses: Probing the scales of relationships. In. Sherman, K..C.M. Alexander. and B.D. Gold (eds.). Large ecosystems: Patterns. processes and yields, p. 151-164. Am. Assoc. Adv. ScL,Wash. DC.
Taggart. C.T., and W.C. Leggett1987 Short-term mortality in post-emergent larval capelinMallotus/,illosus. I. Analysis of multiple in situ estimates.Mar. Eco!. Prog. Ser. 41:205-217.
Taylor. W.W., M.A. Smale, and M.H. Freeberg1987 Biotic and abiotic determinants of lake whitefish (Core
gOll1l8 clllpeafo"/'1nis) recruitment in northeastern Lake Michigan. Can. J. Fish. Aquat. Sci. 44(Supp!. 2):313-323.
Theilac:ker. G.U.1986 Starvation-induced mortality of young sea-caught jack
mackerel, Tra.ch1LTUS S1j1nmetricus, detet'mined with histological and morphological methods. Fish. BuI!., U.S. 84:1-17.
Thorne. R.E., and J.J. Ames1987 A note on variability of marine survival of sockeye salmon
(Oncorhynch.1tS nerka) and effects of flooding on spawning success. Can. J. Fish. Aquat. Sci. 44:1791-1795.
Turner. J.L.. and U.K. Chadwick1972 Distribution and abundance of young-of-year sttiped bass,
Morone saxatilis. in relation to river flow in the SacramentoSan Joaquin estuary. Trans. Am. Fish. Soc. 101:442-452.
Uphoff. J.H.1989 Environmental effects on survival of eggs. larvae. and
juveniles of striped bass in the Choptank River, Maryland.Trans. Am. Fish. Soc. 118:251-263.
Van Woert. W.F.1980 Exploitation. natural mortality, and survival of small
mouth bass and largemouth bass in Shasta Lake. California.Calif. Fish Game 66:163-171.
Varley. G.C.. and G.R. Gradwell1960 Key factors in population studies. J. Anim. Eco!. 29:
399-401.Walters, C.J.
1989 Value of short-term forecasts of recruitment variationfor harvest management. Can. J. Fish. Aquat. Sci. 46:1969-1976.
Walters, C.J., and J.S. Collie1988 Is research on environmental factors useful to fisheries
management? Can. J. Fish. Aquat. Sci. 45:1848-1854.Walton, C.J.
1987 Parent-progeny relationships for an established population of anadramous alewives in a Maine lake. In Dadswell.M.J.. et aI. (eds.). Common strategies of anadromous andcatadromous fishes. p. 451-454. Am. Fish. Soc. Symp. 1,Bethesda.
Ward, B.R., and P.A. Slaney1988 Life history and smolt-to-adult survival of Keogh River
steelhead trout (Sallno gairdne?'i ) and the relationship to smoltsize. Can. J. Fish. Aquat. Sci. 45:1110-1122.
Ware. D.M.. and T.C. Lambert1985 Early life history of Atlantic mackerel (Scomber scom
brus) in the southern Gulf of St. Lawrence. Can. J. Fish.Aquat. Sci. 42:577-592.
Watanabe, Y., and N.C.U. Lo1989 Larval production and mortality of Pacific saury. CO[{l
lab·is saim. in the northwestern Pacific Ocean. Fish. Bull.,U.S. 78:601-613.
Winters, G.U.• and J.P. Wheeler1987 Recruitment dynamics of spring-spawning herring in the
Northwest Atlantic. Can. J. Fish. Aquat. Sci. 44:882-900.Wooster. W.W.. and K.M. Bailey
1989 Recruitment of marine fishes revisited. In Beamish,R.J., and G.A. McFarlane (eds.). Effects of ocean variabilityon recruitment and an evaluation of parameters used in stockassessment models, p. 153-159. Can. Spec. Pub!. Fish. Aquat.Sci. 108.
Zijlstra, J.J.• and J. IJ. Witte1985 On the recruitment of O-group plaice in the North Sea.
Neth. J. Zoo!. 35:360-376.Zijlstra. J.J.• R. Dapper, and J. IJ. Witte
1982 Settlement, growth and mortality of post-larval plaice(P[euronecfes platessa) in the western Wadden Sea. Neth. J.Sea. Res. 15:250-272.

452 Fishery Bulletin 90/3). 1992
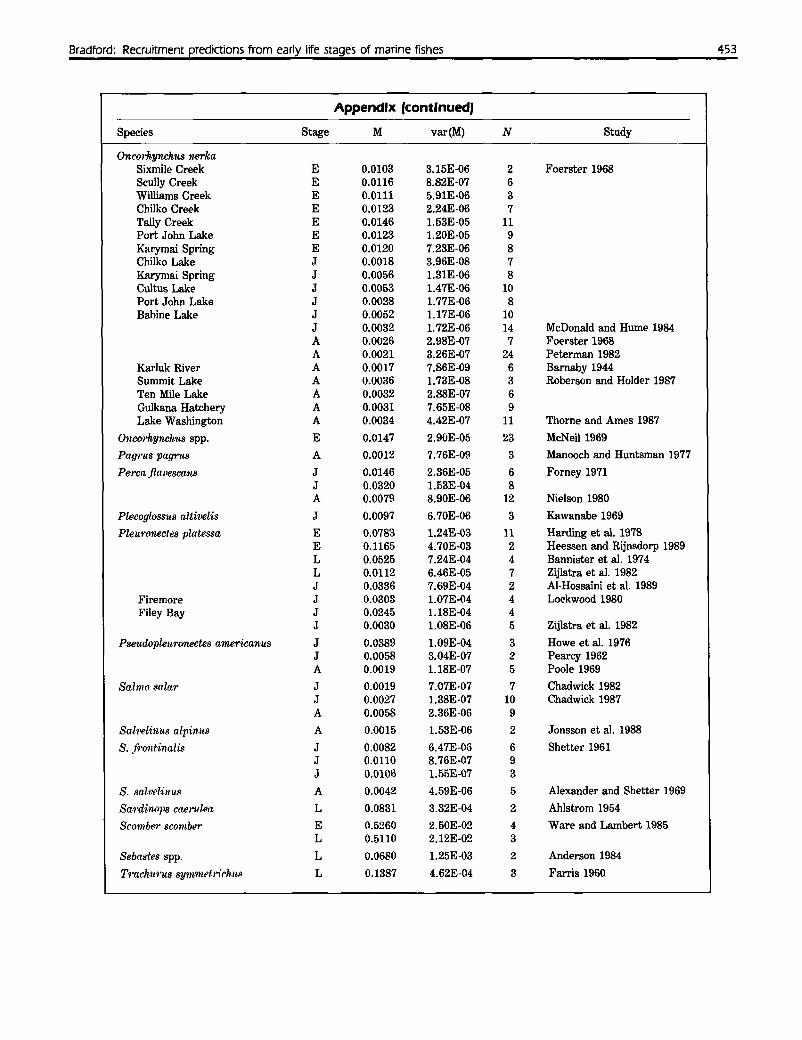
AppendixDaily mortality rates and interannual variances plotted in Figure 1. Stage refers to egg (E), larval (L), juvenile (J), oradult (A) periods. For anadromous salmon, fry-smolt and smolt-adult mortality were classified as juvenile and adult mor-tality, respectively. N is the number of years of data in each study.
Species Stage M var(M) N Study
Alosa pse.'lUlohare.ngus L 0.0490 4.31E-04 9 Mansfield and Jude 1986L 0.1980 1.07E-04 8 Walton 1987
A. sapidissima L 0.0524 2.96E-04 8 Savoy and Crecco 1988L 0.0978 1.28E-03 8L 0.2290 3.50E-03 8J 0.0027 1.30E-07 8J 0.0185 5.08E-06 8
Glupea harengus E 0.3135 2.80E-02 2 Dragesund and Nakken 1973L 0.2060 1.10E-02 2L 0.0275 3.38E-04 11 Graham and Sherman 1987L 0.1168 1.83E-03 4 Johannessen 1986L 0.0900 8.98E-03 2 McGurk 1989
Golala.bis .~aira L 0.0726 9.19E-04 14 Watanabe and Lo 1989
Core.gonus a.rtedii L 0.5000 1.63E-02 2 Hatch and Underhill 1988
C. dupeaforrnis E 0.0299 6.40E-05 2 Taylor et aI. 1987L 0.0143 9.30E-05 2L 0.0216 2.10E-04 2 Freeberg et al. 1990
Engra.ulis encrasicolis L 0.2000 1.11E-02 3 Palomera and Lleonart 1989
E.1no·rdux E 0.3600 1.53E-02 13 Peterman et al. 1988L 0.1860 5.52E-04 13J 0.0180 9.77E-06 13
Esox lucius L 0.1650 3.60E-03 3 Franklin and Smith 1963
Gadus rnorhua E 0.1890 4.84E-03 3 Campana et aI. 1989L 0.1940 2.37E-03 3E 0.2304 1.48E-02 7 Heessen and Rijnsdorp 1989L 0.1010 5.63E-04 8 Sunby et aI. 1989J 0.0312 8.90E-05 7
Me.lanograrnrnus ae.gle./in·us E 0.1270 4.43E-03 3 Campana et aI. 1989L 0.2630 8.56E-03 3
Micro-pterous dolomieui E 0.0890 7.12E-05 3 Clady 1975L 0.0310 7.74E-05 3A 0.0007 6.00E-09 2 Van Woert 1980
M. salmoides L 0.0224 9.90E-05 3 Kramer and Smith 1962J 0.0078 1.BOE-06 4
Morone suxatilis L 0.1770 4.50E-04 2 Dey 1981J 0.0040 2.00E-06 2L 0.1550 4.30E-03 6 Uphoff 1989J 0.0530 2.80E-04 10 Turner and Chadwick 1972
Oncorhyn.chus gorbuscha. E 0.0097 5.32E-06 6 Pritchard 1948J 0.0260 7.80E-05 3 Parker 1968A 0.0080 1.65E-06 3
O. kisutch A 0.0028 1.37E-07 8 Mathews 1984A 0.0078 5.15E-07 17 Mathews and Olson 1980A 0.0049 3.51E-07 22 Nickelson 1986
O. mykiss J 0.0036 1.85E-05 3 Seelbach 1987A 0.0020 1.02E-07 4 Allen 1977A 0.0022 3.08E-07 7 Ward and Slaney 1988
Bradford: Recruitment predictions from early life stages of marine fishes
Appendix (continued)
Species Stage M var(M) N Study
Oncorhynchu,tJ nerkaSixmile Creek E 0.0103 3.15E-06 2 Foerster 1968Scully Creek E 0.0116 8.82E-07 6Williams Creek E 0.0111 5.91E-06 3Chilko Creek E 0.0123 2.24E-06 7Tally Creek E 0.0146 1.53E-05 11Port John Lake E 0.0123 1.20E-05 9Kllrymai Spring E 0.0120 7.23E-06 8Chilko Lake J 0.0018 3.96E-08 7Karymai Spring J 0.0056 1.31E-06 8Cultus Lake J 0.0053 1.47E-06 10Port John Lake J 0.0028 1.77E-06 8Babine Lake J 0.0052 1.17E-06 10
J 0.0032 1. 72E-06 14 McDonald and Hume 1984A 0.0026 2.98E-07 7 Foerster 1968A 0.0021 3.26E-07 24 Peterman 1982
Karluk River A 0.0017 7.86E-09 6 Barnaby 1944Summit Lake A 0.0036 1.73E-08 3 Roberson and Holder 1987Ten Mile Lake A 0.0032 2.88E-07 6Gulkana Hatchery A 0.0031 7.65E-08 9Lake Washington A 0.0034 4.42E-07 11 Thorne and Ames 1987
Oncorhynch11.S spp. E 0.0147 2.90E-05 23 McNeil 1969
Pa.grus pagru8 A 0.0012 7.76E-09 3 Manooch and Huntsman 1977
Pe·rca j7mlf3scans J 0.0146 2.36E-05 6 Forney 1971J 0.0320 1.53E-04 8A 0.0079 8.90E-06 12 Nielson 1980
Plecoglossus alti-z.el-is J 0.0097 6.70E-06 3 Kawanabe 1969
Pleuronectes pllltessa E 0.0783 1.24E-03 11 Harding et al. 1978E 0.1165 4.70E-03 2 Heessen and Rijnsdorp 1989L 0.0525 7.24E-04 4 Bannister et al. 1974L 0.0112 6.46E-05 7 Zijlstra et al. 1982J 0.0336 7.69E-04 2 Al-Hossaini et al. 1989
Firemore J 0.0303 1.07E-04 4 Lockwood 1980Filey Bay J 0.0245 1.18E-04 4
J 0.0030 1.08E-06 5 Zijlstra et al. 1982
Pseudopleuronectes americanus J 0.0389 1.09E-04 3 Howe et al. 1976J 0.0058 3.04E-07 2 Pearcy 1962A 0.0019 1.18E-07 5 Poole 1969
Sallno salar J 0.0019 7.07E-07 7 Chadwick 1982J 0.0027 1.38E-07 10 Chadwick 1987A 0.0058 2.36E-06 9
Sab.elinus alt.linus A 0.0015 1.53E-06 2 Jonsson et al. 1988
S. fmnt-inalis J 0.0082 6.47E-OG 6 Shetter 1961J 0.0110 8.76E-07 9J 0.0106 1.55E-07 3
S. salwlinus A 0.0042 4.59E-06 5 Alexander and Shetter 1969
Sa."l'dinops ca.erulea L 0.0831 3.32E-04 2 Ahlstrom 1954
Scornber scomb,'I' E 0.5260 2.50E-02 4 Ware and Lambert 1985L 0.5110 2.12E-02 3
Sebastes spp. L 0.0680 1.25E-03 2 Anderson 1984
Tr'achurus syrnmetrichus L 0.1387 4.62E-04 3 Farris 1960
453