Embed Size (px)
Citation preview

ABSTRACT Hardin, Craig William. Fixed Abrasive Diamond Wire Saw Slicing of Single Crystal SiC Wafers and Wood. (Under the direction of Dr. Albert Shih) This study investigates the effects of process parameters on fixed abrasive diamond
wire saw machining. The effects of wire speed, rock frequency, and downfeed rate on
cutting forces and surface roughness are studied during diamond wire saw slicing of
single crystal SiC wafers. This study also investigates the machining of wood with
oscillatory and looped style wire saws. The effects of feed rate, wire speed, coolant, and
grain orientation on the cutting forces and surface roughness are studied.
The design of the cutting experiments using three different wire saws are presented.
The first experiment uses a Diamond Wire Technology Millennium spool-to-spool
rocking motion diamond wire saw to machine single crystal SiC wafers. The next
experiments use a Murg looped wire saw and a Model 7243 oscillatory wire saw from
Well Diamond Wire Saws to machine pine and oak.
A data acquisition system was constructed to record cutting forces, and signal-
processing techniques were developed for removing noise. The diamond wire performed
well, and afterwards the machined surfaces of all materials were measured to determine
their surface roughness. A scanning electron microscope was used to examine the SiC
wafers. Finally, the results and the direction of future work in this area are discussed.

Fixed Abrasive Diamond Wire Saw Slicing of Single Crystal SiC Wafers and Wood
by Craig William Hardin
A thesis submitted to the Graduate Faculty of North Carolina State University
in partial fulfillment of the requirements for the Degree of Master of Science
DEPARTMENT OF MECHANICAL AND AEROSPACE ENGINEERING
Raleigh
2003
APPROVED BY:
_____________________________ _____________________________
_____________________________
Chair of Advisory Committee

ii
BIOGRAPHY Craig Hardin was born in Gastonia, North Carolina in April of 1980. He is the son of
Bill and Gail Hardin. Craig enrolled at North Carolina State University in August of
1998. He spent four years pursuing his Bachelor of Science degree in Mechanical
Engineering and co-oped at GKN Automotive along the way. He enrolled in the five
year B.S./M.S. program in the final year of his undergraduate studies. He graduated with
his undergraduate degree in May of 2002. Craig has spent the last twelve months
pursuing a Master of Science degree in Mechanical Engineering under the guidance of
Dr. Albert J. Shih. Craig is currently searching for a job, and is hoping to be gainfully
employed soon after his graduation.

iii
ACKNOWLEDGEMENTS
I would like to thank some of the people who helped me conduct this research project.
Dr. Albert J. Shih worked as my advisor to first set up the project and to help in every
step of its completion. Richard Lemaster provided funding, support, and advice from the
Wood Tooling and Machining Research Group. I would like to thank my family and
friends for supporting me during my graduate studies. I would also like to dedicate this
thesis to Hazel Hardin, who passed away during the writing.

iv
TABLE OF CONTENTS
LIST OF FIGURES ............................................................................................................vi LIST OF TABLES ............................................................................................................ viii NOMENCLATURE ...........................................................................................................ix 1 Introduction................................................................................................................. 1
1.1 Fixed Abrasive Diamond Wire ........................................................................... 2 1.2 Advantages of Diamond Wire Machining .......................................................... 5
1.2.1 Thin Kerf..................................................................................................... 5 1.2.2 Complicated Contour Cutting ..................................................................... 6
1.3 Literature Review................................................................................................ 6 2 Experiment Design and Setup ..................................................................................... 8
2.1 Equipment Utilized ............................................................................................. 8 2.1.1 Diamond Wire Technology Diamond Wire Saw........................................ 8 2.1.2 Well Diamond Wire Looped Wire Saw.................................................... 10 2.1.3 Well Diamond Wire Oscillatory Wire Saw .............................................. 10 2.1.4 Diamond Wire........................................................................................... 12 2.1.5 Dynamometer............................................................................................ 12 2.1.6 Data Acquisition ....................................................................................... 13 2.1.7 Feed Mechanism for Wood Experiments ................................................. 13 2.1.8 Scanning Electron Microscope ................................................................. 13 2.1.9 Surface Roughness Measurement ............................................................. 14
2.2 Materials Used ................................................................................................ 14 2.3 Experiment Design ......................................................................................... 16
2.3.1 Single Crystal SiC Experiment Design..................................................... 16 2.3.2 Oscillatory Saw Experiment Design ......................................................... 19 2.3.3 Looped Wire Saw Experiment Design...................................................... 22
3 Wire Saw Machining Mechanics .............................................................................. 24 3.1 Kinematics of the Rocking Motion................................................................... 24 3.2 Balance of Wire Cutting Force ......................................................................... 26
4 Single Crystal SiC Machining Experiment 1 Results ............................................... 28 4.1 Data Acquisition............................................................................................. 28
4.1.1 Tangential Force ....................................................................................... 29 4.1.2 Normal Force ............................................................................................ 32
4.2 Cutting Force and Surface Roughness Results ................................................. 37 4.3 Scanning Electron Microscope Surface Characterization................................. 41
5 Single Crystal SiC Machining Experiment II Results .............................................. 46 5.1 Data Acquisition ............................................................................................... 46 5.2 Cutting Force and Surface Roughness Results ................................................. 47 5.3 Scanning Electron Microscope Analysis .......................................................... 49
6 Oscillatory Style Wood Machining Results.............................................................. 51 6.1 Data Acquisition ............................................................................................... 51
6.1.1 Tangential Force ....................................................................................... 52 6.1.2 Normal Force ............................................................................................ 54
6.2 Cutting Force and Surface Roughness Results ................................................. 55 6.2.1 Baseline Results ........................................................................................ 58

v
6.2.2 Guide Pulley Test Results ......................................................................... 59 6.2.3 Higher Feed Speed Test Results ............................................................... 59
7 Looped Style Wood Machining Results ................................................................... 61 7.1 Data Acquisition ............................................................................................... 61 7.2 Cutting Force and Surface Roughness Results ................................................. 61
7.2.1 Baseline Results ........................................................................................ 64 7.2.2 Coolant Test Results ................................................................................. 65 7.2.3 Feed Speed Test ........................................................................................ 65
8 Conclusion ................................................................................................................ 67 References ......................................................................................................................... 70 Appendix A....................................................................................................................... 73
vi
LIST OF FIGURES
Chapter 1 Figure 1.1: Traditional inner diamond saw blade for silicon wafer slicing. ....................2 Figure 1.2: An illustration of wire saw machining a wafer .............................................2 Figure 1.3: SEM micrographs of fixed abrasive wire: Winter/Saint-Gobain (a)
and Well Diamond Wire Saws (b)................................................................. 3 Figure 1.4: Diamond abrasive on: Winter/Saint-Gobain(a) and Well Diamond
Wire Saws (b). ............................................................................................... 4 Figure 1.5: Kerf comparison in circular and diamond wire saw machining..................... 5 Figure 1.6: Contour cut made on Well Diamond Wire Saws Murg looped wire
saw................................................................................................................. 6
Chapter 2 Figure 2.1: Wire saw used in this experiment ................................................................... 9 Figure 2.2: Looped wire saw diagram ............................................................................ 10 Figure 2.3: Oscillatory wire saw diagram....................................................................... 11 Figure 2.4: Winter/Saint-Gobain (a) and Well Diamond Wire Saws (b) fixed
abrasive wire................................................................................................ 12 Figure 2.5: (a) Flat-sided and (b) conventional single crystal SiC wafers..................... 15 Figure 2.6: (a) Oak and (b) pine samples for machining. ............................................... 15 Figure 2.7: Single crystal SiC mounted inside of wire saw............................................ 16 Figure 2.8: Wood machining setup ................................................................................. 19 Figure 2.9: Two types of cutting for wood ..................................................................... 20 Figure 2.10: Oscillatory saw and the wire guide pulleys ................................................ 21
Chapter 3 Figure 3.1: Kinematics of yoke rocking mechanism...................................................... 24 Figure 3.2: The setup of capacitance wire bow sensor and the effect of rocking
motion on wire bow sensor output .............................................................. 25 Figure 3.3: Force diagram of wire saw machining ......................................................... 26
Chapter 4 Figure 4.1: Diagram of cutting force directions .............................................................. 29
vii
Figure 4.2: FT calibration curve ...................................................................................... 30 Figure 4.3: Measured and locally averaged FT ............................................................... 31 Figure 4.4: Bow sensor calibration plot.......................................................................... 33 Figure 4.5: Bow sensor voltage to force conversion plot ............................................... 34 Figure 4.6: Bow sensor output during machining with rocking motion......................... 35 Figure 4.7: Final FN output ............................................................................................. 36 Figure 4.8: Experiment I cutting force and surface roughness results............................ 38 Figure 4.9: Coolant delivery system diagram................................................................. 40 Figure 4.10: SEM micrographs characterizing damage types ........................................ 42 Figure 4.11: SEM micrographs of machined SiC surface machined at (a) 0.0127 (mm/s),
(b) 0.00508(mm/s) ..................................................................................... 43
Chapter 5 Figure 5.1: Typical tangential force plots ....................................................................... 47 Figure 5.2: Single crystal SiC experiment II results ....................................................... 48
Chapter 6 Figure 6.1: Wood machining force directions ................................................................ 51 Figure 6.2: Tangential force calibration.......................................................................... 52 Figure 6.3: FT drift rate plot ............................................................................................ 53 Figure 6.4: Oscillatory wire saw data ............................................................................. 54 Figure 6.5: Oscillatory wire saw normal force ............................................................... 55 Figure 6.6: Oscillatory force and surface roughness results ........................................... 57
Chapter 7 Figure 7.1: Oscillatory force and surface roughness results of baseline and coolant tests................................................................................................ 62 Figure 7.2: Oscillatory force and sur face roughness results of high feed speed test. ..... 63

viii
LIST OF TABLES
Chapter 1 Table 1.1: Diamond wire data........................................................................................... 4
Chapter 2 Table 2.1: Constant process parameters in Experiment I. .............................................. 17 Table 2.2: Experiment I test matrix. ............................................................................... 18 Table 2.3: Constant process parameters Experiment II .................................................. 18 Table 2.4: SiC test 2 experimentation matrix ................................................................. 19 Table 2.5: Oscillatory saw baseline test matrix .............................................................. 20 Table 2.6: Oscillatory saw wire guide pulley test matrix ............................................... 21 Table 2.7: Oscillatory saw feed speed test matrix .......................................................... 21 Table 2.8: Loop wire saw baseline test matrix ............................................................... 22 Table 2.9: Loop saw cross cut coolant test parameters................................................... 22 Table 2.10: Loop saw cross cut feed speed test parameters............................................ 23
Chapter 4 Table 4.1: Force values for foam ceramic cutting experiments …………..................... 54
Chapter 5 Table 5.1: Effects of measurement method on surface roughness values ………… ..... 69 Table 5.2: Surface roughness values for Douglas Fir machined surface …………....... 69

ix
NOMENCLATURE Symbol Description dw Drum width on oscillatory saw lw Distance between drums on oscillatory saw dr Diameter of guide pulleys lr Distance between guide pulleys ψ1 Measured bow angle 1 ψ2, Measured bow angle θ1 Wire bow angle 1 θ2 Wire bow angle 2 α Rock angle FT Measured tangential cutting force FN Measured normal cutting force T1 Tension in wire to right of workpiece T2 Tension in wire to left of workpiece fT Specific tangential force fN Specific normal force Ra Surface roughness
1
1 Introduction Material costs are driving the need for a method of machining wood with a lower kerf
loss. Fixed abrasive diamond wire saw machining was investigated for use in cutting various
species of wood. Wood machining has been traditionally dominated by the use of saw
blades. Fixed abrasive diamond wire developed for use by the semiconductor industry, and
is significantly thinner than even the most advanced thin kerf saw blades. This can lead to
significant material cost savings in a production environment.
Single crystal SiC is becoming an important electronic ceramic for blue and green laser
diodes, high power semiconductors, microwave and RF power transistors, and optoelectronic
applications. Compared to Si, SiC is significantly harder and more difficult to slice into
wafers that meet the tight warp and total thickness variation (TTV) specifications. The
scratch marks and subsurface damages on the machined surface have been the concern of
utilizing the diamond wire saw technology. The development and use of large, 200 mm and
300 mm (8 inch and 12 inch) diameter single crystal silicon wafers has also revitalized
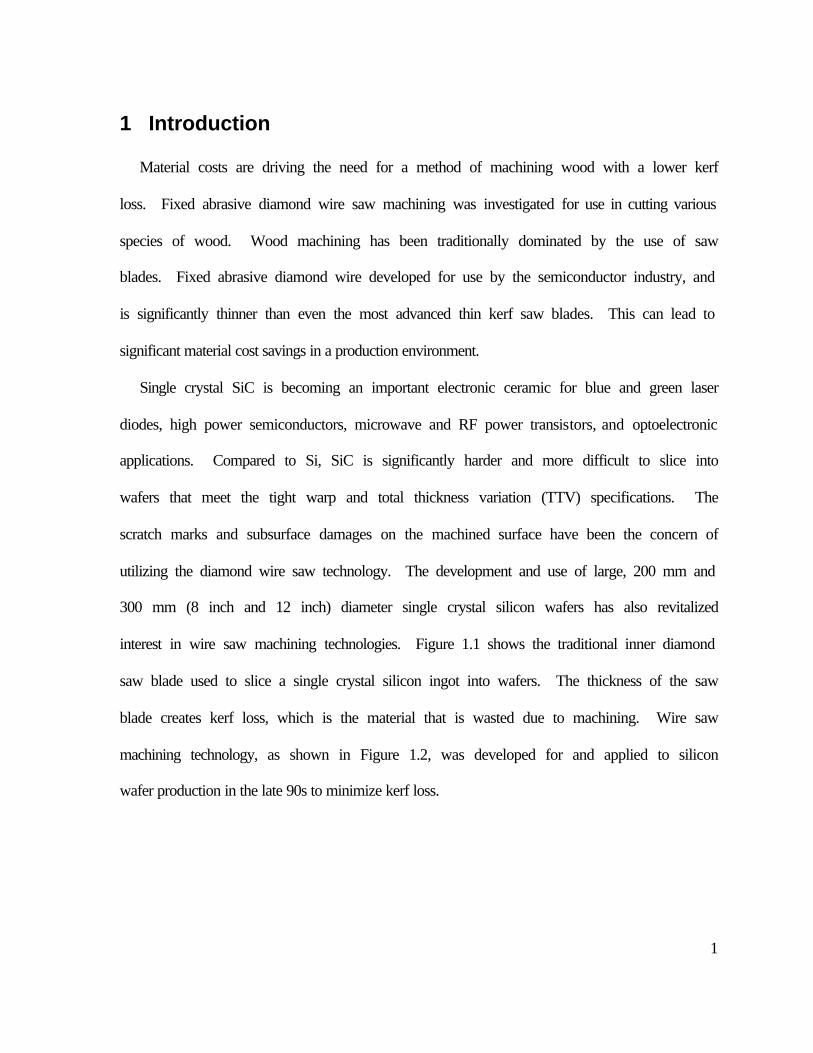
interest in wire saw machining technologies. Figure 1.1 shows the traditional inner diamond
saw blade used to slice a single crystal silicon ingot into wafers. The thickness of the saw
blade creates kerf loss, which is the material that is wasted due to machining. Wire saw
machining technology, as shown in Figure 1.2, was developed for and applied to silicon
wafer production in the late 90s to minimize kerf loss.

2
Figure 1.1: Traditional inner diamond saw blade for silicon wafer slicing. Mitsubishi [1]
Figure 1.2: An illustration of wire saw machining a wafer. Bekaert[2]
1.1 Fixed Abrasive Diamond Wire There are many different methods to produce fixed abrasive diamond wire. Every
manufacturer uses a slightly different method. The diamond wire used has a steel core,
which varied in size from 0.22 to 0.50 mm in diameter. This experiment utilizes two
different types of wire. The SiC machining experiment uses a 0.22 mm nominal diameter, 25
µm nominal size diamond grit, electroplated bond, and a steel core wire. Winter/Saint-
Gobain manufactured the wire used for the SiC. A SEM micrograph of the wire used in the
SiC experiments is shown in figure 1.3(a). Figure 1.3(a) shows the 25 µm diamond abrasive
Polyethylene rollers with grooves for wire guide
Workpiece
Wire spool

3
in the wire. The pine and oak machining experiments used two types of wire from Well
Diamond Wire Saws. Well Diamond Wire Saws uses a stainless core, and then has a
bonding layer that diamonds are effectively rolled on to. The diamond size was 64 µm, and
both 0.3 mm and 0.5 mm core wires were used. The high wire speed wood experiments
utilized a new technology of a continuous looped wire. Well Diamond Wire Saws
manufactures the looped wire in their typical fashion of rolling on the diamonds, and then
laser welding the two ends together to form one continuous loop. Table 1.1 contains all of
the data on the diamond wire used in each experiment. A SEM micrograph of a Well
Diamond Wire Saws wire is shown in Figure 1.3(b).
Figure 1.3: SEM micrographs of fixed abrasive wire: Winter/Saint-Gobain (a) and Well
Diamond Wire Saws (b).

4
Figure 1.4: Diamond abrasive on: Winter/Saint-Gobain(a) and Well Diamond Wire Saws(b).
Table 1.1: Diamond wire data. Winter/Saint-Gobain Well Standard
Wire Well
Continuous Loop
Experiment SiC tests 1 and 2 Oak and Pine; Rip and Crosscut
Oak and Pine; Rip and Crosscut
Core Material Steel Stainless Steel Stainless Steel Core Diameter 0.2 mm 0.5 mm 0.3 mm Diamond Grit
Size 25 µ m 64 µ m 64 µ m
Manufacturing Method
Electroplating diamonds with a nickel
layer
Mechanically affixing the
diamonds to wire
Mechanically affixing the diamonds to
wire, laser weld ends to form
loop

5
1.2 Advantages of Diamond Wire Machining
Fixed abrasive diamond wire has two advantages over conventional wood machining. It
has a very small diameter, which allows for an extremely small kerf loss. It also has the
advantage of being able to make complicated contour cuts.
1.2.1 Thin Kerf
For wood, fixed abrasive diamond wire has the capability to replace many applications in
thin kerf circular saw and band saw machining. Diamond wire machining has a much
smaller kerf loss than any conventional wood cutting applications. A typical thin kerf saw
requires a very accurate spindle and precision controls. The best thin kerf saw can only
produce a kerf loss of 1mm. Fixed abrasive diamond wire can produce a kerf loss at least
two times smaller. Figure 1.5 compares various thin kerf saws and the diamond wires used
in this experiment.
0
0.5
1
1.5
2
2.5
3
3.5
150 200 250 300 350
Blade Diameter (mm)
Ker
f (m
m)
Super thin saws laminate blade
Super thin saws ripsaw blade
Super thin saws splitting blade
Dewalt thin kerf blade
Well Looped Wire
Well Oscillatory Wire
Figure 1.5: Kerf comparison in circular and diamond wire saw machining.

6
1.2.2 Complicated Contour Cutting
Fixed abrasive diamond wire allows for complicated contour cutting. Conventional wood
working tools can’t cut complicated geometry without backing out the workpiece, and
restarting the cut from another location. Many curves in furniture manufacturing are limited
because they can only be as tight as the band saw blade can twist. Diamond wire has the
ability to change directions at any point during the cutting process. Figure 1.6 is a
demonstration of the contour cutting done on a high-speed Well Diamond Wire Saws looped
wire saw.
Figure 1.6: Contour cut made on Well Diamond Wire Saws Murg looped wire saw.
1.3 Literature Review Wire saw machining, including both loose and fixed abrasive methods, is a relatively new
technology. Ito and Murata [3], Tokura, et al. [4], and Ishikawa et al. [5] conducted the early
wire saw machining experiments. Li, Kao, and Prasad [6] presented a model and analysis of
the contact between the abrasive and workpiece due to rolling indentation in the free-abrasive

7
wire saw machining of a silicon wafer. Sahoo, et al. [7] applied the finite element method to
analyze the vibration modes in wire saw cutting of thin wafers. Bhagavat and Kao [8] and
Bhagavat, et al. [9] presented the finite element analysis of elasto-hydrodynamic interaction
in free-abrasive diamond wire machining. Clark, et al. [10,11] present analysis of process
monitoring, and wood machining of diamond wire machining.
Most of the breakthroughs in wire saw technology are documented as patents. A survey
was conducted on wire saw related patents in the United States. A process for cutting brittle
semiconductor materials with a diamond wire saw was first developed by H. Mech [12,13] in
the 1970s. There are only three patents in the 1970s [12–14] and two patents in the 1980s
[15,16] on the wire saw related machining technology. The number of patents increased
slightly before the mid 1990s [17–20] and significantly increased after 1998. Further
developments are shown in patents granted in 1998 [21–25], 1999 [26–29], 2000 [30–39],
2001 [40–45] and 2002 [46-50].
This review demonstrates that wire saw machining remains a proprietary technology and
there is a lack of research on fixed abrasive diamond wire saw machining. With the needs
for continuous improvements in semiconductor, ceramic, and woodworking industries, new
diamond wires and wire saw machines are expected to continue evolving to achieve more
precise, efficient, and cost-effective machining.

8
2 Experiment Design and Setup
This chapter describes how the experiments were performed. It includes sections
describing the equipment used to conduct the experiments and the materials the experiments
were conducted on. There is also a section describing how the process parameters were
chosen to form the testing matrixes.
2.1 Equipment Utilized Many tools were used in this study to perform the experiments and to analyze the results.
The following sections describe the major equipment used such as the wire saws, the fixed
abrasive diamond wire used in each experiment, components in the dynamometer system, the
scanning electron microscope used, the scanning acoustic microscope used, and the devices
used to measure surface roughness.
2.1.1 Diamond Wire Technology Diamond Wire Saw A Millennium Series rocking motion slicing fixed abrasive diamond wire saw was used in
this study to machine the single crystal SiC. This saw utilizes the spool-to-spool model of
cutting, where the wire reverses direction periodically. The machine possesses the ability to
conduct rocking motion cutting at three speeds (slow 0.15 Hz, medium 0.30 Hz, and fast 0.50
Hz) at up to 6 degrees of wire rock. The wire is run between two spools. The leading wire
spool is connected to a motor that pulls the wire to produce the wire movement, and the
trailing wire spool is connected to a motor that opposes this movement to provide a specified
wire tension. When the wire travels fully from one spool to the other, the direction of wire
movement reverses, switching the function of each motor between leading and trailing
functions. Each spool also contains a buffer amount of wire, which helps the machine to run
smoothly. The wire speed is user selectable for any speed between 2.5 and 15 (m/s). The
wire tension supplied by the trailing motor is programmable between 13 and 50 N.

9
This wire saw slices by slowly feeding the wire into the workpiece. To achieve this, the
whole wire yoke structure, including both wire spools and all four wire guide pulleys, is
mounted is mounted on two vertical slides. The work piece remains stationary throughout
the machining process. The stepping motor turns a ball screw, which drives the yoke
mechanism up or down as a unit. The stepping motor has 240 steps per rotation, and its
gearing results in 10 motor rotations for every 2.54 mm linear downfeed. The two methods
of downfeed rate control are wire bow angle rate and specified linear downfeed rate. All of
the tests performed in this experiment kept a constant linear downfeed rate, which was varied
throughout the experimentation. For the bow angle controlled downfeed rate, the machine
can be programmed to find a downfeed rate that causes a set wire bow angle of anywhere
between 0.1 and 6 degrees. The specified linear downfeed rates are user selectable between
0.00127 and 0.635 (mm/s).
Figure 2.1: Wire saw used in this experiment.
Controller
Wire-guide pulleys
Wire tensioning
pulleys
Wire spools
Workpiece
Capacitance wire bow
sensor
Dynamometer
10
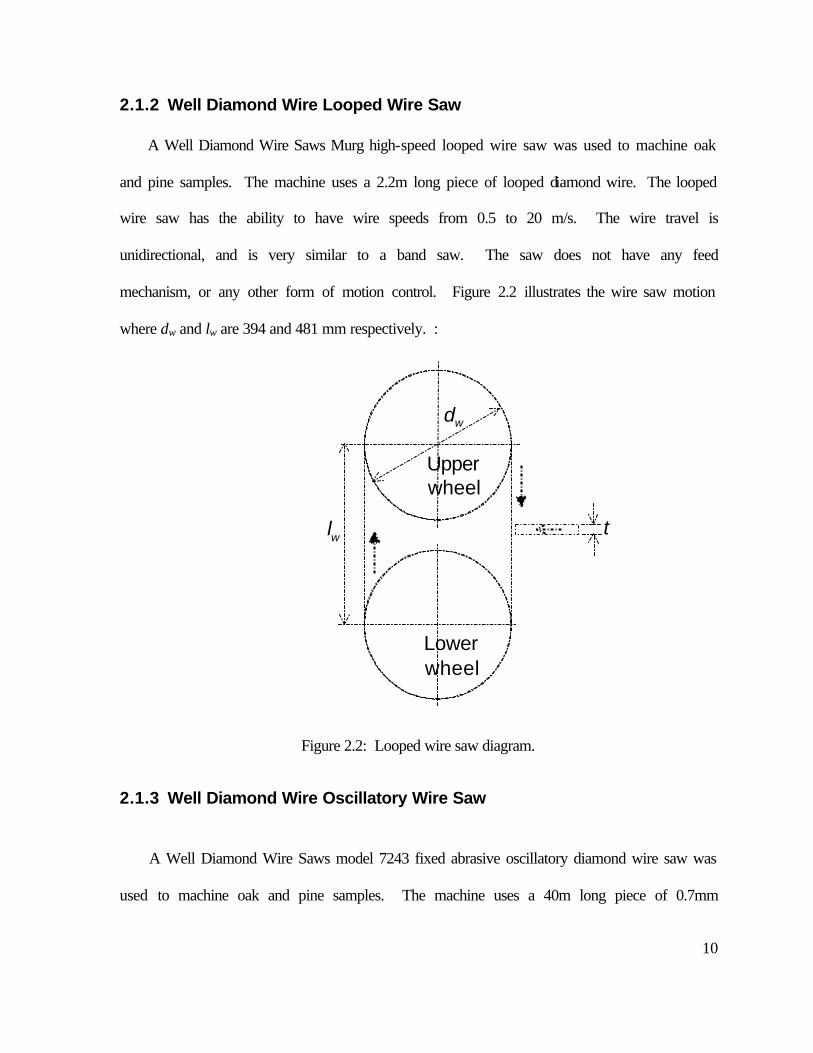
2.1.2 Well Diamond Wire Looped Wire Saw A Well Diamond Wire Saws Murg high-speed looped wire saw was used to machine oak
and pine samples. The machine uses a 2.2m long piece of looped diamond wire. The looped
wire saw has the ability to have wire speeds from 0.5 to 20 m/s. The wire travel is
unidirectional, and is very similar to a band saw. The saw does not have any feed
mechanism, or any other form of motion control. Figure 2.2 illustrates the wire saw motion
where dw and lw are 394 and 481 mm respectively. :
Lowerwheel
dw
t
Upperwheel
lw
Figure 2.2: Looped wire saw diagram.
2.1.3 Well Diamond Wire Oscillatory Wire Saw
A Well Diamond Wire Saws model 7243 fixed abrasive oscillatory diamond wire saw was
used to machine oak and pine samples. The machine uses a 40m long piece of 0.7mm

11
diamond wire. The oscillatory wire saw has the ability to have wire speeds from 0 to 1.5
(m/s). The wire travel is oscillatory, and is a cross between a conventional slicing saw and a
scroll saw. The 40 m piece of wire runs from the upper drum to the lower drum, then the
motion reverses. The drums have individual grooves cut in them for the wire to spool
around. This way the wire does not ever come in contact with another section of wire. This
can solve many problems associated with wire wear. Conventional wire saws wind the wire
on spools, and the wire is constantly in contact with other pieces of wire. This can cause
premature failure, and a decrease in overall machining effectiveness. Wire guides were
installed on a series of cuts to see the benefit of keeping the motion of the wire more precise.
The saw does not have any feed mechanism, or any other form of motion control. The user
must feed the piece in manually. Figure 2.3 illustrates the wire saw motion where dw, lw, dr,
lr are 470, 927, 25, and 112 mm respectively.
Lowerwheel
Upperwheel
dr
lr
Figure 2.3: Oscillatory wire saw diagram.
12
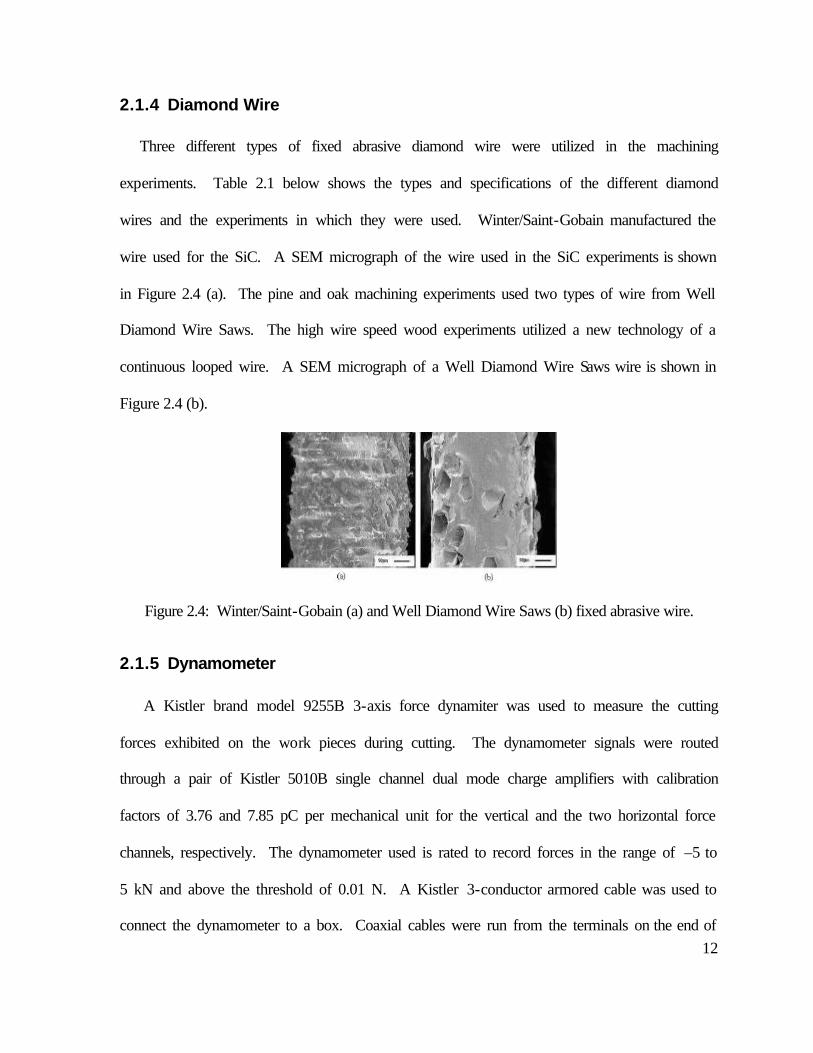
2.1.4 Diamond Wire Three different types of fixed abrasive diamond wire were utilized in the machining
experiments. Table 2.1 below shows the types and specifications of the different diamond
wires and the experiments in which they were used. Winter/Saint-Gobain manufactured the
wire used for the SiC. A SEM micrograph of the wire used in the SiC experiments is shown
in Figure 2.4 (a). The pine and oak machining experiments used two types of wire from Well
Diamond Wire Saws. The high wire speed wood experiments utilized a new technology of a
continuous looped wire. A SEM micrograph of a Well Diamond Wire Saws wire is shown in
Figure 2.4 (b).
Figure 2.4: Winter/Saint-Gobain (a) and Well Diamond Wire Saws (b) fixed abrasive wire.
2.1.5 Dynamometer A Kistler brand model 9255B 3-axis force dynamiter was used to measure the cutting
forces exhibited on the work pieces during cutting. The dynamometer signals were routed
through a pair of Kistler 5010B single channel dual mode charge amplifiers with calibration
factors of 3.76 and 7.85 pC per mechanical unit for the vertical and the two horizontal force
channels, respectively. The dynamometer used is rated to record forces in the range of –5 to
5 kN and above the threshold of 0.01 N. A Kistler 3-conductor armored cable was used to
connect the dynamometer to a box. Coaxial cables were run from the terminals on the end of

13
the dynamometer cable to the charge amplifiers and were connected through BNC cable
connectors.
2.1.6 Data Acquisition A National Instruments PC-based data acquisition system was used to record force signals
from the dynamometer and the wire bow signal from the wire saw machine’s controller.
These signals were collected inside a National Instruments SCB-68 terminator block. A
model 184749A-02 shielded cable connected the terminator block to a PCI-6035E model PC-
based PCI data acquisition card. This card has a theoretical sampling rate of 200 thousand
samples per second spread across 16 single ended channels. The card supports 8 channels if
they are measured as differential signals.
2.1.7 Feed Mechanism for Wood Experiments
The saws manufactured by Well Diamond Wire Saw do not have a changeable feed rate;
therefore, the wood machining experiments required a feed mechanism to advance the work
piece into the diamond wire. An Isel Automation linear unit was used. A programmable
panther controller controlled it. The linear unit allowed for a variety of reliable feed speeds
for all of the wood testing.
2.1.8 Scanning Electron Microscope A Hitachi S-4700 cold field emission scanning electron microscope was used to take SEM
micrographs of the SiC wafers, diamond wire samples, and cutting debris. The voltage was
set to 10 kV for every image. Some of the materials were non-conductive; therefore the
14
specimens required a coating layer of conductive material to produce good micrographs. A
gold/platinum sputtering machine was used in these cases to coat the specimens.
2.1.9 Surface Roughness Measurement A Talysurf 120 contact stylus surface roughness measurement machine was used to obtain
values for Ra for the machined SiC surfaces. This machine uses a diamond stylus to measure
the height of the workpiece surface along a profile line. Each measurement used 60
consecutive 0.08 mm cutoff lengths for a listed overall profile length of 4.8 mm.
A Mitutoyo Surftest stylus system was used to determine the surface quality on the
machined wood surfaces. This machine also uses a diamond stylus to measure the profile of
the surface. Each measurement used a profile length of 2.4 mm.
2.2 Materials Used
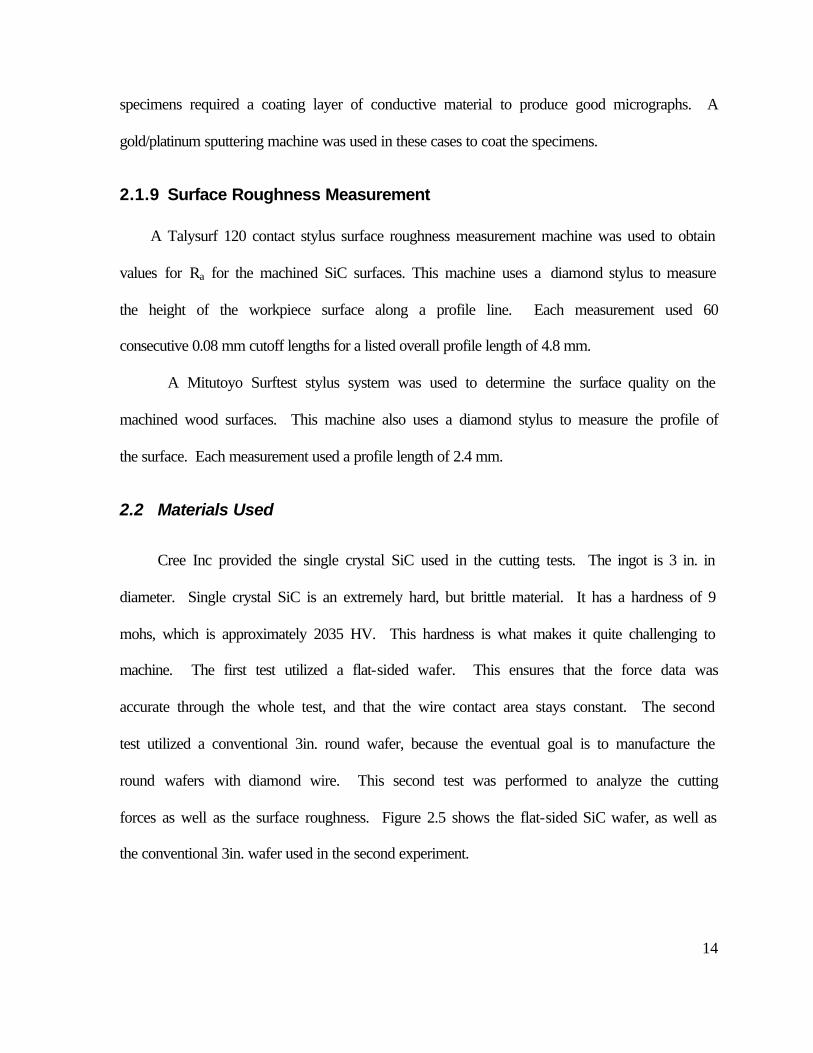
Cree Inc provided the single crystal SiC used in the cutting tests. The ingot is 3 in. in
diameter. Single crystal SiC is an extremely hard, but brittle material. It has a hardness of 9
mohs, which is approximately 2035 HV. This hardness is what makes it quite challenging to
machine. The first test utilized a flat-sided wafer. This ensures that the force data was
accurate through the whole test, and that the wire contact area stays constant. The second
test utilized a conventional 3in. round wafer, because the eventual goal is to manufacture the
round wafers with diamond wire. This second test was performed to analyze the cutting
forces as well as the surface roughness. Figure 2.5 shows the flat-sided SiC wafer, as well as
the conventional 3in. wafer used in the second experiment.
15
Figure 2.5: (a) Flat-sided and (b) conventional single crystal SiC wafers.
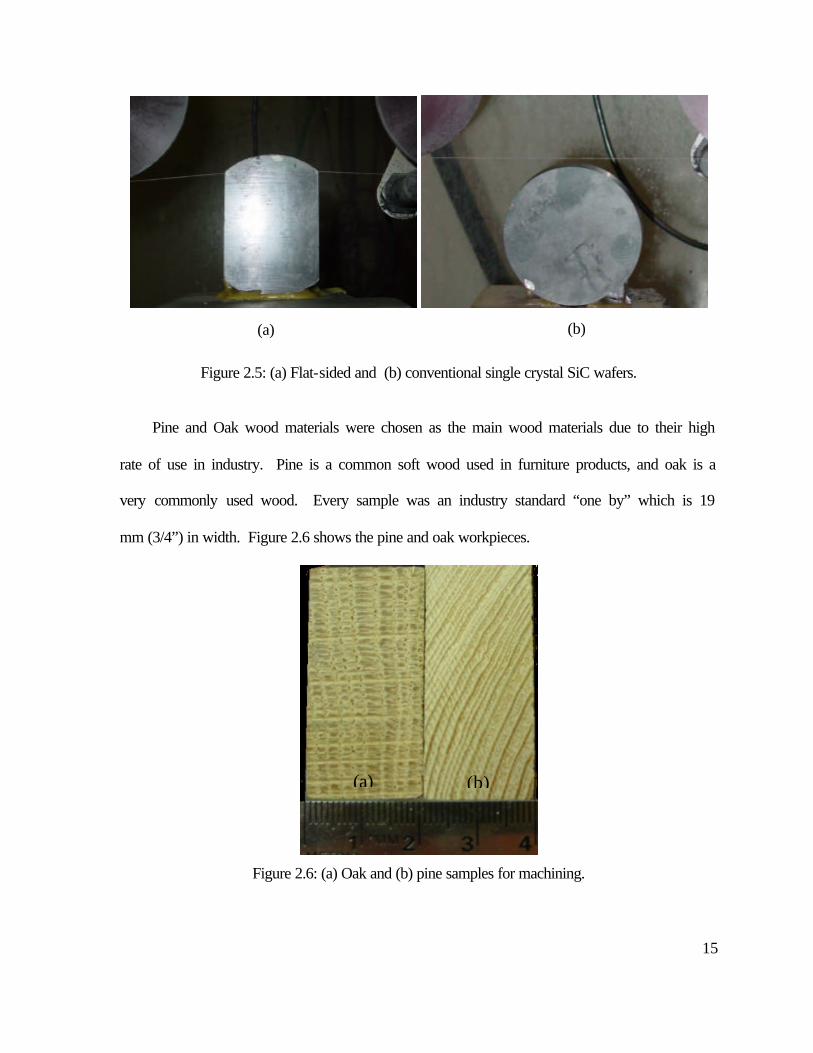
Pine and Oak wood materials were chosen as the main wood materials due to their high
rate of use in industry. Pine is a common soft wood used in furniture products, and oak is a
very commonly used wood. Every sample was an industry standard “one by” which is 19
mm (3/4”) in width. Figure 2.6 shows the pine and oak workpieces.
Figure 2.6: (a) Oak and (b) pine samples for machining.
(a) (b)
(b) (a)

16
2.3 Experiment Design Three separate tests were designed. The single crystal SiC test was designed using the
Diamond Wire Technology Millennium Slicing Saw. The wood testing was designed as a
unit that could be placed on any wire saw that has vertically running wire. Every test was set
up to measure cutting forces at various feed speeds.
2.3.1 Single Crystal SiC Experiment Design The Millennium Series Slicing Saw was fitted with the force dynamometer, and the data
acquisition system was setup and calibrated. An adapter plate was fabricated to serve as a
mounting plate for the single crystal SiC. Figure 2.7 shows the complete assembly when
mounted inside the wire saw.
Figure 2.7: Single crystal SiC mounted inside of wire saw.
Single Crystal Silicon Carbide
Dynamometer
Capacitance Bow Sensor
Diamond Wire
Adapter Plate

17
Test matrices were developed to test the effects of the downfeed rate, rocking frequency,
and wire speed on the cutting forces and surface roughness. The first cutting test utilized the
piece of single crystal SiC that had flat sides, while the second test utilized the conventional
round wafer. The Diamond Wire Technology Millennium Series Slicing Saw has a variety of
process parameters, but only a small amount of them were varied during the cutting
experiments. The wire used in this experiment was already partially used. This is because
diamond wire has a break-in period, where the forces greatly change as the diamonds are
initially worn. This wire allowed us to accurately measure all of the forces, without
experiencing any variation in the wire. The table below shows the process parameters that
were held constant for the slicing tests on the flat-sided wafer.
Table 2.1: Constant process parameters in Experiment I. Wire Length 185.928 m Left and Right Buffer Length 45.7 m Wire Velocity 10.16 (m/s) Rock Angle 2 deg. Rock Frequency 0.3 Hz Wire Tension 22.24 N Coolant Water After Cut Dwell 6 sec Saw Retraction Off
Cutting Experiment I was designed to test the effect of downfeed on the surface
roughness. Therefore a set of three downfeed speeds were chosen for analysis. The
following test matrix shows the varied parameters and their total cut depth into the
workpiece.

18
Table 2.2 Experiment I test matrix. Cut Number Downfeed Rate (mm/s) Cut Depth (mm) 1 0.0127 12 (7mm lead-in) 2 0.00508 5 3 0.00127 5
The second single crystal SiC test was set up to test the effect of rocking frequency and
wire speed on the cutting forces and surface roughness of the SiC. This second test used new
diamond wire. This test also looks at the effects of new wire, and its effective break-in
period. The process parameters that were held constant for the second series of tests is
below.
Table 2.3: Constant process parameters Experiment II. Wire Length 185.928 m Left and Right Buffer Length 45.7 m Downfeed Rate 0.0127 (mm/s) Rock Angle 2 deg. Wire Tension 22.24 N Coolant Water After Cut Dwell 6 sec Saw Retraction Off
Experiment II was designed to test the effect of wire speed and rocking frequency on the
surface roughness. Therefore four rocking frequencies and three wire speeds were chosen for
analysis. The following test matrix shows the varied parameters and their total cut depth into
the SiC workpiece.

19
Table 2.4 SiC test 2 experimentation matrix. Cut Wire Speed (m/s) Rock Frequency (Hz) Cut Depth (mm) 1 10.16 0 13.35 (7mm lead-in) 2 10.16 0.15 6.35 3 10.16 0.30 6.35 4 10.16 0.50 6.35 5 8.128 0.15 6.35 6 8.128 0.30 6.35 7 8.128 0.50 6.35 8 11.18 0.15 6.35 9 11.18 0.30 6.35 10 11.18 0.50 13.35 (7mm lead-out)
2.3.2 Oscillatory Saw Experiment Design The Well Diamond Wire Saws model 7243 oscillatory style diamond wire saw was fitted
with the Isel Automation linear slide, the force dynamometer, and the data acquisition
system. An adapter plate was fabricated to serve as a mounting plate for dynamometer. A
top plate was also fabricated to clamp down on the workpiece as it is being machined. Figure
2.8 shows the complete assembly when mounted.
Figure 2.8: Wood machining setup.
Slide
Dynamometer
Workpiece
Clamping Plate

20
Two different styles of cuts were investigated on the oscillatory wire saw. A rip is a cut
that travels in the same direction as the grain; it is illustrated in Figure 2.9(a). A cross cut is a
cut that travels across the grain structure, and is illustrated in Figure 2.9(b).
Figure 2.9: Two types of cutting for wood.
This experiment was set up to evaluate the surface roughness, as well as analyze the
cutting forces. A 0.5mm nominal diameter Well fixed abrasive diamond wire with a 64 µm
diamond size was used in all of the experiments. A series of baseline cuts were run on the
pine and oak samples. The baseline test matrix is shown below in the table.
Table 2.5 Oscillatory saw baseline test matrix. Workpiece Cut Type Feed Speed (mm/s) Wire Speed (m/s) Oak Rip (with guides) 0.5 0.5, 1.0, 1.5 Oak Cross Cut (with guides) 0.5 0.5, 1.0, 1.5 Pine Rip (with guides) 0.5 0.5, 1.0, 1.5 Pine Cross Cut (with guides) 0.5 0.5, 1.0, 1.5
A series of test were then expanded from the baseline matrix. The first set of tests was to
see the effect of wire guide pulleys that are close to the sample while it is being machined.
The pulleys are 112 mm apart, and they keep the wire from deflecting during the machining
(a) Rip cut (b) Cross cut
21
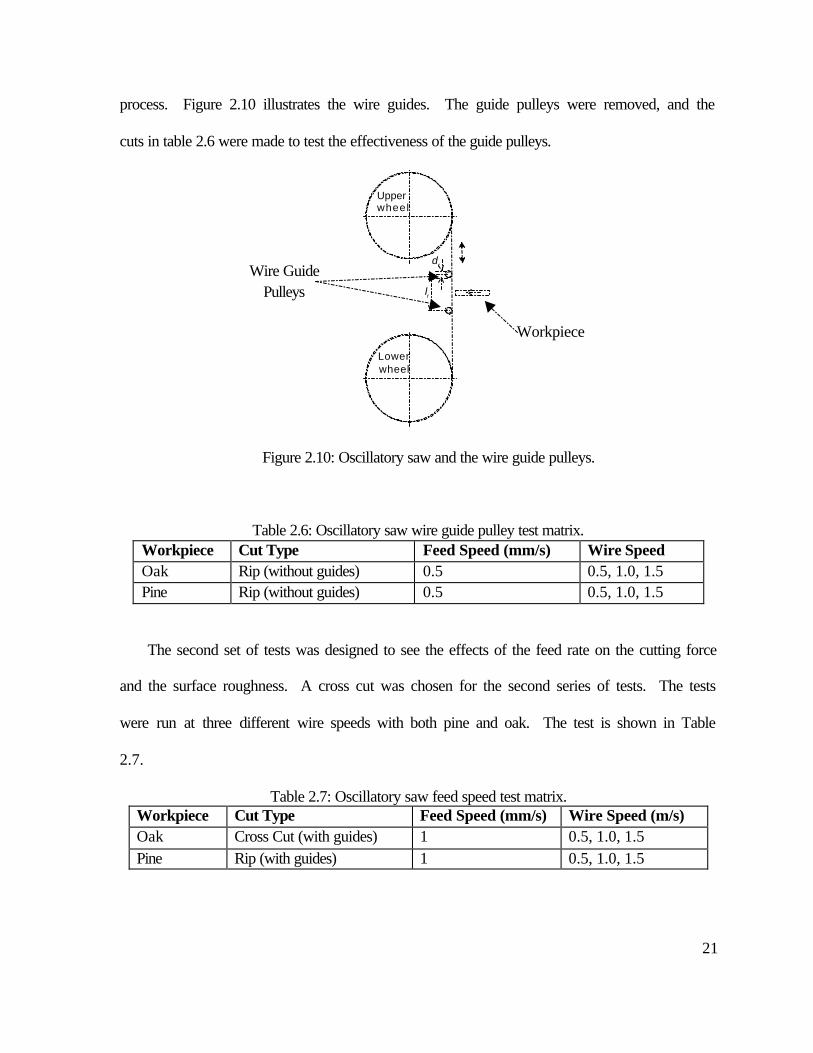
process. Figure 2.10 illustrates the wire guides. The guide pulleys were removed, and the
cuts in table 2.6 were made to test the effectiveness of the guide pulleys.
Lowerwheel
Upperwheel
dr
lr
Figure 2.10: Oscillatory saw and the wire guide pulleys.
Table 2.6: Oscillatory saw wire guide pulley test matrix. Workpiece Cut Type Feed Speed (mm/s) Wire Speed Oak Rip (without guides) 0.5 0.5, 1.0, 1.5 Pine Rip (without guides) 0.5 0.5, 1.0, 1.5
The second set of tests was designed to see the effects of the feed rate on the cutting force
and the surface roughness. A cross cut was chosen for the second series of tests. The tests
were run at three different wire speeds with both pine and oak. The test is shown in Table
2.7.
Table 2.7: Oscillatory saw feed speed test matrix. Workpiece Cut Type Feed Speed (mm/s) Wire Speed (m/s) Oak Cross Cut (with guides) 1 0.5, 1.0, 1.5 Pine Rip (with guides) 1 0.5, 1.0, 1.5
Workpiece
Wire Guide Pulleys
22
2.3.3 Looped Wire Saw Experiment Design The Well Diamond Wire Saws Murg model looped style diamond wire saw was fitted
with the Isel Automation linear, the force dynamometer, and the data acquisition system slide
as shown in Figure 2.8. The looped wire saw has such a high wire speed that it allows much
higher feed speeds. A series of baseline tests were made at a variety of feed speeds. The test
matrix in Table 2.8 shows the baseline tests that were designed.
Table 2.8 Loop wire saw baseline test matrix. Workpiece Cut Type Feed Speed (mm/s) Wire Speed (m/s) Oak Rip 0.5, 1, 1.5, 2 20 Oak Cross Cut 0.5, 1, 1.5, 2 20 Pine Rip 0.5, 1, 1.5, 2 20 Pine Cross Cut 0.5, 1, 1.5, 2 20
Two sets of test were developed to compare to the baseline data. The first set of tests used
a small amount of coolant to cool the wire. One problem that can occur while diamond wire
machining is that the wire can become hot. The friction due to cutting produces large
amounts of heat, which can cause premature wire failure. The set of tests were designed with
a very small amount of coolant dripping on the wire while it machined the wood. The test
parameters are shown in Table 2.9.
Table 2.9: Loop saw cross cut coolant test parameters. Workpiece Cut Type Feed Speed (mm/s) Wire Speed (m/s) Oak Cross Cut (with coolant) 0.5, 1, 1.5, 2 20 Pine Cross Cut (with coolant) 0.5, 1, 1.5, 2 20
The second set of tests was designed to see the limits of the feed speed. It was set up to
explore the limits of feed speed in looped wire saw machining. The feed speed is the most

23
important factor in wood machining, because that is what is limiting its application to wood.
Table 2.10 shows the set of parameters for the feed speed test.
Table 2.10: Loop saw cross cut feed speed test parameters. Workpiece Cut Type Feed Speed (mm/s) Wire Speed (m/s) Pine Cross Cut 0.5, 1, 1.5, 2, 2.5, 3,
3.5, 4
20

24
3 Wire Saw Machining Mechanics
A model has been developed to analyze the kinematics and cutting mechanics of the
rocking motion used in the Diamond Wire Technology Millennium Series rocking motion
slicing fixed abrasive diamond wire saw. The model also shows the balance of forces in
diamond wire cutting.
3.1 Kinematics of the Rocking Motion The mechanism used to generate the rocking motion of the yoke in the diamond wire saw
machine used in this study is shown in Fig. 3.1. Two pins in a circular arc slot are used to
guide the yoke oscillating around a point, marked by A in Figure. 3.1, in the middle of the
wire between two pulleys. A stepping motor drives a pinion on a circular rack gear to rotate
the entire yoke assembly, including wire pulleys, the section of wire between two pulleys,
and the capacitance sensor, around point A during cutting.
Pins
A Wire
Rocking motor and pinion
Yoke
Pulley
Gear Rack
Figure 3.1: Kinematics of yoke rocking mechanism.
25
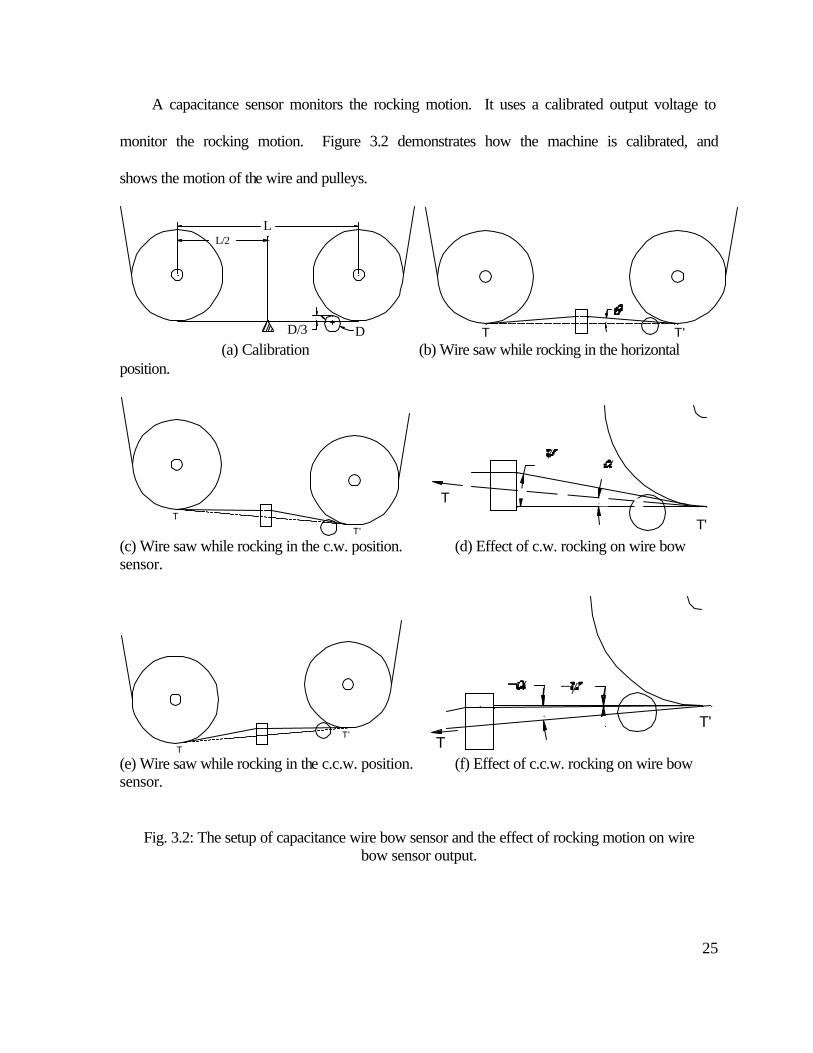
A capacitance sensor monitors the rocking motion. It uses a calibrated output voltage to
monitor the rocking motion. Figure 3.2 demonstrates how the machine is calibrated, and
shows the motion of the wire and pulleys.
L
D/3 D
L/2
T T' (a) Calibration (b) Wire saw while rocking in the horizontal position.
T
T' T'
T
(c) Wire saw while rocking in the c.w. position. (d) Effect of c.w. rocking on wire bow sensor.
T'
T TT'
(e) Wire saw while rocking in the c.c.w. position. (f) Effect of c.c.w. rocking on wire bow sensor.
Fig. 3.2: The setup of capacitance wire bow sensor and the effect of rocking motion on wire bow sensor output.

26
3.2 Balance of Wire Cutting Force Assume the cutting occurs in a narrow area and can be simplified as a point of contact.
As shown in Figure 3.3, four forces are acting at the point of cutting, marked as B, on the
wire. The FT and FN are the cutting forces. The wire tension forces are T1 and T2 acting in
opposite directions. Under the small rocking angle assumption, two wire bow capacitance
sensors, as shown in Fig. 3.3, are used to measure angles ψ1 and ψ2, where ψ1 = θ1 + α and
ψ2 = θ2 – α. θ1 and θ2 are the wire bow angles on both sides.
T'
T
T
N
B2
1
2
1
2
1
Figure 3.3: Force diagram of wire saw machining.
The balance of forces at point B can be expressed as:
0coscos 1122x =+−=Σ ψψ TTFF T (1)
0sinsin 1122y =−−=Σ ψψ TTFF N (2)
Among the six variables in Eqs. (1) and (2), FT, FN, ψ1, and ψ2 can be measured. A was
dynamometer may be required to measure FN. Wire tensions T1 and T2 can be isolated by
rearranging Eqs. (1) and (2).

27
1221
22
1 sincossincos
cossin
ψψψψ
ψψ
+
+−=
NT FFT (3)
1221
112 sincossincos
cossinψψψψ
ψψ++
= NT FFT (4)
When the cutting point B is in the middle of the wire section between two pulleys, as
illustrated in Figs. 3.2(a) and 3.2(b), ψ1 = θ + α, ψ2 = θ – α, and only one wire bow sensor is
required.

28
4 Single Crystal SiC Machining Experiment 1 Results
The cutting forces and surface roughness of single crystal SiC machined by fixed a
Diamond Wire Technology Millennium Series Slicing Saw are studied in this chapter. The
effects of downfeed speed, wire speed, and rock frequency are investigated. Scanning
electron microscopy is used to visually characterize the surface roughness, and compared to
stylus profilometer measurement results.
4.1 Data Acquisition In all, there were two signals measured by the data acquisition system used in this study.
Of the three available force channels from the dynamometer, only the one channel measuring
the force in the tangential direction, FT, was used in every cut. The normal force was
determined by acquiring the capacitance sensor signal, and then converting that voltage to a
force. The force was calculated using the bow sensor calibration, and the normal force signal
from the force dynamometer. Figure 4.1 is a diagram of the directions of the recorded forces.
The following sections provide a brief description of each signal.

29
Figure 4.1: Diagram of cutting force directions.
4.1.1 Tangential Force
The tangential cutting force, FT, was calculated using the voltage output from the force
dynamometer. The first step in acquiring FT is calibrating the dynamometer. A scale was
hooked up to the dynamometer, and then forces of 5, 10, 5, and 0 lbs. were applied. The
following curve was generated during calibration.
FT
FN

30
-0.45 -0.4
-0.35 -0.3
-0.25 -0.2
-0.15 -0.1
-0.05 0
0.05
1 51 101 151
Time (s)
Vo
ltag
e (V
)
Figure 4.2: FT calibration curve
After the force plot was generated a calibration factor was developed. The average voltage
gain for each weight was calculated then a final calibration factor was found to be 0.009125
(V/N). This factor was placed in the Labview program, which recorded the force data from
the dynamometer and applied the calibration factor to the data. The first single crystal SiC
test utilized a scan rate of 1000 (points/s). The forces do not change rapidly, so this rate is
considered over sampling.
The raw data was imported into Dadisp, which is a data analysis tool. A moving
average was performed to remove the noise due to the charge amplifiers and cross talk
between the channels. Over sampling the data allowed for moving averages to take every
1500 points and create an average from those. Figure 4.3 shows the raw data, and the data
after the linear averaging.
5 lbs. 5 lbs.
10 lbs.
31
0 50 100 150 200 250 300
Time (s)
-60 -40 -20
0 20 40 60 80
Tan
gent
ial F
orce
(N
)
0 50 100 150 200 250 300
Time (s)
-2
-1
0
1
2
Tan
gent
ial F
orce
(N
)
(b) Localized (1500 points) averaging
(a) SiC Cut 1_6 Tangential Force as recorded
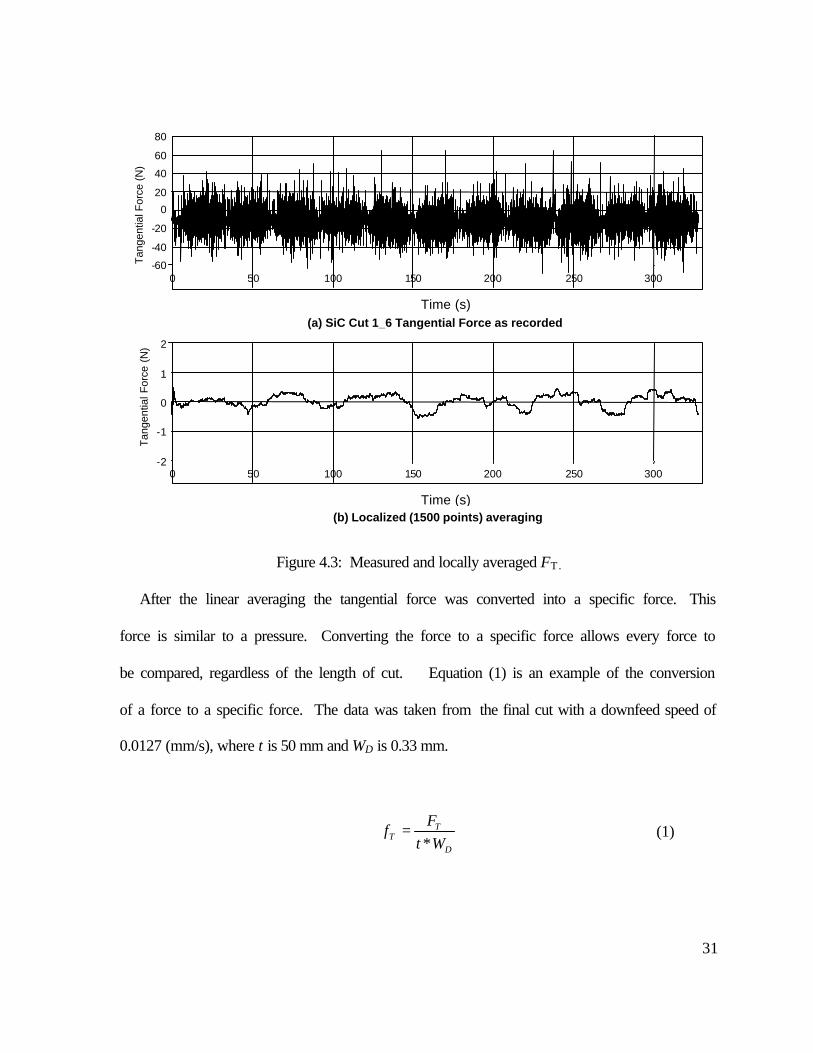
Figure 4.3: Measured and locally averaged FT.
After the linear averaging the tangential force was converted into a specific force. This
force is similar to a pressure. Converting the force to a specific force allows every force to
be compared, regardless of the length of cut. Equation (1) is an example of the conversion
of a force to a specific force. The data was taken from the final cut with a downfeed speed of
0.0127 (mm/s), where t is 50 mm and WD is 0.33 mm.
D
TT Wt
Ff
*=
(1)

32
4.1.2 Normal Force The normal force, FN, is challenging to acquire, due to its small magnitude. A
piezoelectric dynamometer is not able to sense a force that does not change over a long
duration. The nature of a piezoelectric dynamometer is to sense dynamic forces, and the
normal force is quite stagnant as well. The tangential forces change frequently due to the
change in the wire direction, however the wire is constantly moving down, which creates a
stagnant normal force. The magnitude of the force is also quite small, which creates
problems. The bow capacitance sensor on the diamond wire saw was used to circumvent this
problem. The first step in the process is to record the normal forces from the dynamometer
while the bow sensor calibration is taking place. The method is similar to the method
mentioned in [10], but it does not convert the voltage output to an angle before converting to
a force. The Figure 4.4 shows the normal force on the dynamometer and the voltage from
the capacitance sensor.

33
0 5 10 15 20 25 30 35 40 45 50 55 60 Sec
-30 -20 -10
0
Volts
W5: decaycalibrate2.1.Decaycalibrate
0 5 10 15 20 25 30 35 40 45 50 55 60 Time (s)
0 1 2 3 4 5 6
Vol
ts
Bowsensor Output
0 5 10 15 20 25 30 35 40 45 50 55 60 Time (s)
1.5 2
2.5 3
3.5 4
4.5
Vol
ts
Bow Sensor (moving average 50 points)
0 5 10 15 20 25 30 35 40 45 50 55 60 Time (s)
-150 -100
-50 0
50 100 150
New
tons
Normal Force Output
0 5 10 15 20 25 30 35 40 45 50 55 Time (s)
0
5
10
15
20
New
tons
Normal Force (moving average 50 points)
Figure 4.4: Bow sensor calibration plot.
This information gives a direct correlation from the voltage output to the force. A
calibration curve was generated with the output data, and a third order polynomial was fit to
the data. The calibration curve is below in Figure 4.5.

34
y = 0.85x3 - 5.083x2 + 12.40x - 7.63
0
2
4
6
8
10
12
0 0.5 1 1.5 2 2.5 3 3.5 4 4.5 5
Bow Sensor Output Voltage (V)
FN
(N)
Force Output
Third OrderApproximation
Figure 4.5: Bow sensor voltage to force conversion plot.
Due to the rocking motion of the wire saw, the output of the wire bow capacitance sensor
is a sinusoidal plot, but it has a linear trend due to the increase in forces while machining.
Figure 4.6 shows the output of the capacitance sensor while machining with a 0.15 Hz
rocking frequency.

35
50 60 70 80 90 100 110 120 130 140 150 160 170 180 190 200 Time (s)
1.1
1.15
1.2
1.25
1.3
1.35 B
ow S
enso
r (V
)
Localized (50 Points) averaging
Figure 4.6: Bow sensor output during machining with rocking motion.
The final step to acquiring the normal cutting force is removing the sinusoidal movement
in the data, which is due to the rocking motion of the wire saw. A linear trend is taken from
the data, which basically keeps the increase in the normal force, while removing the
movement due to the rocking motion. The final data is shown below in Figure 4.7.

36
0 50 100 150 200 250 300 350 400 450 500 Time (s)
-0.1
0
0.1
0.2
0.3
0.4 Ver
tical
For
ce (
N)
Wire deflection converted to vertical force
Figure 4.7: Final FN output.
After the linear averaging the normal force was converted into a specific force. This force
is similar to a pressure. Converting the force to a specific force allows every force to be
compared, regardless of the length of cut. Equation (1) shows an example of the conversion
of a force to a specific force. The data was taken from the final cut with a downfeed speed of
.0127 (mm/s).
D
NN Wt
Ff
*=
(1)

37
4.2 Cutting Force and Surface Roughness Results
The main objective of this test was to examine the cutting forces and surface roughness of
the flat-sided single crystal SiC wafer. The downfeed velocity was varied as was discussed
in the experimental setup. The test parameters were described in Table 2.2. After all of the
data was processed, and the surface roughness was evaluated the following results were
tabulated in figure 4.8.

38
00.020.040.060.08
Sp
ecif
ic
Tan
gen
tial
F
orc
e, f
T
(N/m
m/m
m)
`
0
0.02
0.04
0.06
0.08
0.000 0.002 0.004 0.006 0.008 0.010 0.012 0.014
Downfeed Rate (mm/s)
Net
Sp
ecif
ic F
orc
e (N
/mm
/mm
)
0
0.1
0.2
0.3
0.4
Ra (
µm)
0
0.02
0.04
0.06
0.08S
pec
ific
No
rmal
F
orc
e, f
N
(N/m
m/m
m)
00.30.60.91.21.5
Fo
rce
Rat
io
(fN/f
T)
Figure 4.8: Experiment I cutting force and surface roughness results.

39
The specific normal force, fN changed as expected. As the downfeed rate increased fN
increased as well. The normal force for the cut with the downfeed rate set at 0.0013 (mm/s)
had a normal force of approximately 0.018 (N/mm/mm). As the downfeed increased, FN
increased as well. The fastest downfeed had the highest normal specific force, which was to
be expected. The final specific normal force was 0.0540 (N/mm/mm). The downfeed was
increased over the interval by a factor of 10, while the normal specific force increased by a
factor of 3.5.
The specific tangential force, fT changed in a different manner compared to the normal
force. The force actually initially increased as the downfeed increased, but it actually
decreased as the downfeed increased the final cut. The tangential force only varied by
approximately 8%, but it still showed a trend that goes against conventional logic. This trend
could likely be explained by a number of different circumstances. The most obvious is that
the first cut that was made in the wafer was made at a downfeed rate of .0127 (mm/s). This
cut also had the least tangential force, which goes against conventional logic. The possible
explanation is that this cut had better access to the coolant, which can reduce cutting forces.
The farther the cut is away from the top, the harder it is for the same volume of coolant to
reach the cutting surface, and lubricate and cool the wire. The Figure 4.12 shows the coolant
system, which could explain the tangential force phenomena.

40
Figure 4.9: Coolant delivery system diagram.
The force ratio is also an important part of the cutting. The ratio varied from 1 to 4, but
compared to the force ratio of 3 to 15 for CBN grinding of zirconia [51], 3 to 10 for CBN
grinding of M2 tool steel [51], 4 to 9 for CBN grinding of silicon nitride [52], 5 to 5.5 for
diamond grinding of silicon nitride [53], and 2 to 22 for diamond wire machining of SiC and
TTZ foam ceramics [11], this force ratio is lower and may indicate more efficient material
removal than traditional grinding.
The surface roughness is quite interesting. It seems to follow the same trend as the
specific tangential forces. Every point corresponded directly with the specific tangential
force. This is a very important finding, and it helped set up the second round of testing. The
values of Ra varied from 0.18 to 0.29 µm. The high level of feed speed did not seem to
affect the surface finish. The surface roughness results also show the importance of the
coolant while cutting, since it affects the tangential forces. The values are important while
comparing to various other methods. The industry standard with a diamond slurry saw is 0.1
µm, and the recorded values are quite close and show promise for the technology.
The net specific force just shows the trend of the magnitude of the forces. It follows the
logical trend of increasing with increased feed speed. The net force is a good indicator of the
Coolant Tubes

41
total magnitude as well, which can easily be overlooked while looking at individual force
components.
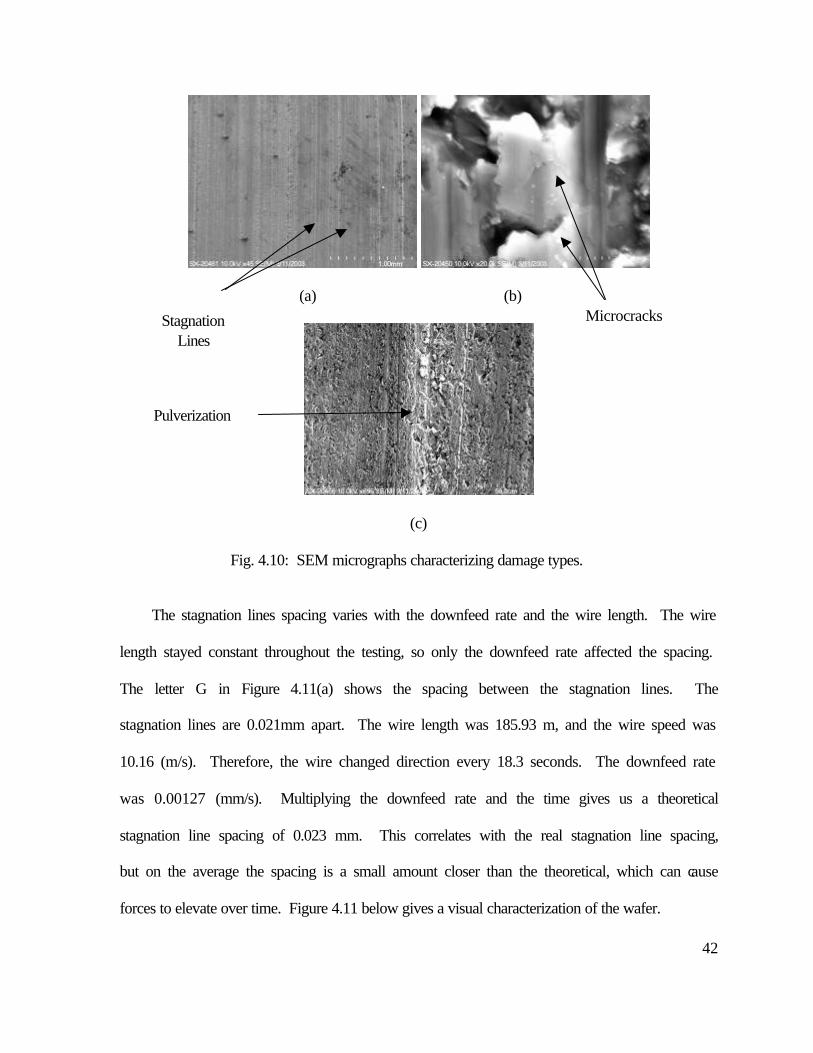
4.3 Scanning Electron Microscope Surface Characterization
Scanning electron microscopy is a good way to visually characterize the surface
roughness due to machining. There are a few major types of damage that are evident on the
surface in the single crystal SiC. The first type of damage is called a stagnation line. Shown
in Figure 4.10(a), it occurs when the diamond wire reverses direction. The wire saw never
stops the downfeed, which places extra forces on the wire each time it stops and reverses
direction. A line is clearly visible on the wafer whenever the wire reverses direction. The
second type of damage is microcracking, which is shown in Figure 4.10(b). This is common
whenever a very brittle material is machined. The final type of visible damage is surface
pulverization, and is shown in Figure 4.10(c). This is type of damage is characterized by
deeper damage into the surface, and the material is visibly pulverized.
42
(a) (b)
(c)
Fig. 4.10: SEM micrographs characterizing damage types.
The stagnation lines spacing varies with the downfeed rate and the wire length. The wire
length stayed constant throughout the testing, so only the downfeed rate affected the spacing.
The letter G in Figure 4.11(a) shows the spacing between the stagnation lines. The
stagnation lines are 0.021mm apart. The wire length was 185.93 m, and the wire speed was
10.16 (m/s). Therefore, the wire changed direction every 18.3 seconds. The downfeed rate
was 0.00127 (mm/s). Multiplying the downfeed rate and the time gives us a theoretical
stagnation line spacing of 0.023 mm. This correlates with the real stagnation line spacing,
but on the average the spacing is a small amount closer than the theoretical, which can cause
forces to elevate over time. Figure 4.11 below gives a visual characterization of the wafer.
Stagnation Lines
Microcracks
Pulverization

43
Close-up of A Close-up of C
Close-up of B Close-up of D (a) (b)
Fig. 4.11: SEM micrographs of machined SiC surface machined at (a) 0.00127 (mm/s), (b) 0.00508(mm/s).
A
B
C
D
G

44
Close-up of E
Close-up of F
(c)
Fig. 4.11: SEM micrographs of machined SiC surface at (c) 0.0127(mm/s). (cont.)
E
F

45
Figure 4.11(a) shows the damage at a stagnation line under the fastest of the three feed
speeds. The series of pictures shows some microcracking, but not much pulverization. The
stagnation lines are quite close together because with a slower downfeed the wire reverses
directions many more times.
The second series of micrographs describes the damage done at 0.00508 (mm/s)
downfeed. The difference in damage is quite noticeable along the stagnation lines. The lines
are much farther apart, due to the faster downfeed, but there are large regions of
pulverization and microcracking. The damage also appears to be much deeper as well.
Figure 4.11(c) characterizes the damage done with a downfeed rate of 0.00127 (mm/s).
The damage done at this downfeed rate is quite evident. The biggest difference is the size of
the cracks and the depth of the pulverization. The final micrograph zooms in on a large piece
of SiC that was severely damaged. It is almost twice in size compared to any other damage
found.
In summary the downfeed affects the damage to the wafer. The faster the downfeed rate
is, the farther apart the stagnation lines are, but the damage is more severe. It appears to be a
difficult balancing act.

46
5 Single Crystal SiC Machining Experiment II Results After completing the first experiment it was quite evident that the tangential force, FT, is
the driving force behind the surface roughness. The second set of tests was set up to evaluate
the effects of new wire, rock frequency, and wire speed on surface roughness. Therefore,
only the tangential force was examined in this experiment because it is the determining factor
in the overall surface roughness. A conventional round wafer was used in this experiment
because the ultimate application of wire sawing technology is machining complete wafers. A
new wire was used in this experiment as well to investigate wire wear, and the forces
associated with breaking in a new wire.
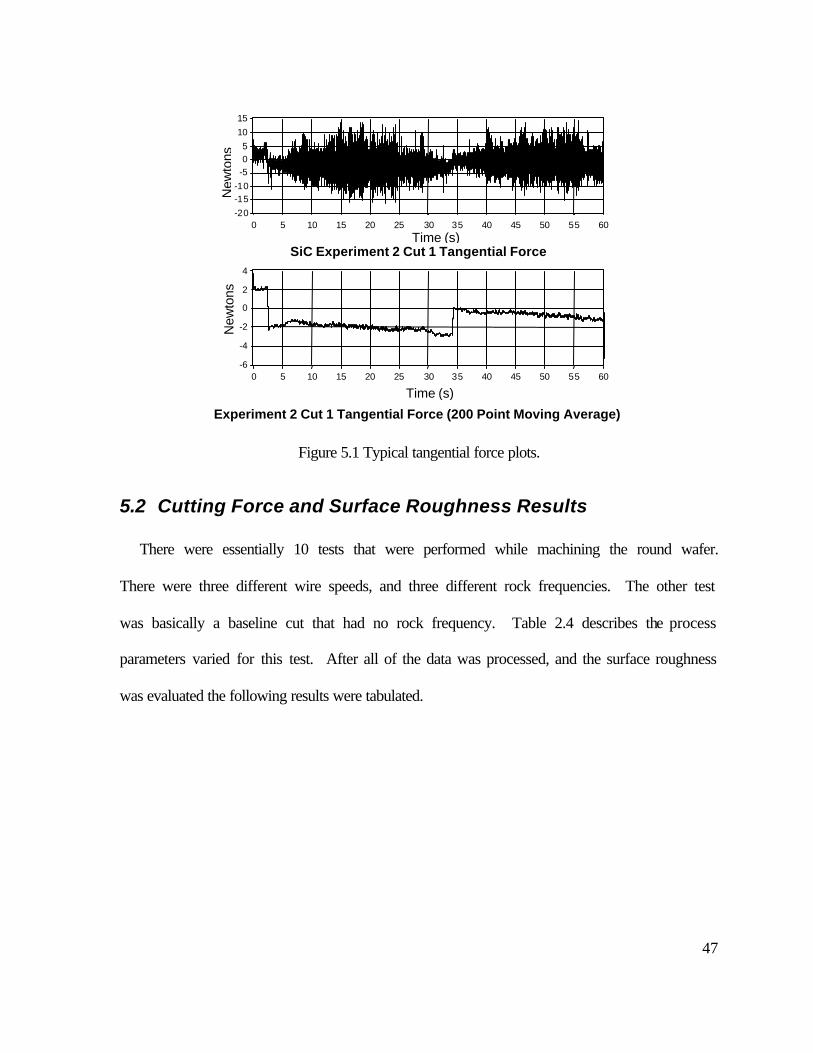
5.1 Data Acquisition
The first test showed that FT was the most important force, so it was the only force
investigated in this set of experiments. The only signal measured in this experiment was the
tangential force. It was acquired in the exact same method that was explained in section
5.2.1, except a specific force was not calculated because the width of the wafer changes
throughout the machining process. The plot below shows a typical tangential force during
the second experiment.
47
0 5 10 15 20 25 30 35 40 45 50 55 60 Time (s)
-20 -15 -10 -5 0 5
10 15
New
tons
0 5 10 15 20 25 30 35 40 45 50 55 60 Time (s)
-6 -4 -2 0 2 4
New
tons
Experiment 2 Cut 1 Tangential Force (200 Point Moving Average)
SiC Experiment 2 Cut 1 Tangential Force
Figure 5.1 Typical tangential force plots.
5.2 Cutting Force and Surface Roughness Results There were essentially 10 tests that were performed while machining the round wafer.
There were three different wire speeds, and three different rock frequencies. The other test
was basically a baseline cut that had no rock frequency. Table 2.4 describes the process
parameters varied for this test. After all of the data was processed, and the surface roughness
was evaluated the following results were tabulated.

48
0
1
2
3
4
5
6
FT
(N)
Rock Freq. 0 S M F S M F S M F
Wire Speed 10.1 (m/s) 8.1 (m/s) 11.3 (m/s)
0.0
0.5
1.0
1.5
2.0
2.5
3.0
Ra (
µm)
Rock Freq. 0 S M F S M F S M F
Wire Speed 10.1 (m/s) 8.1(m/s) 11.3(m/s)
Figure 5.2 Single crystal SiC experiment II results.
The force plot above could be described as showing a process in which the wire is being
broken in. There is a period in which the diamond abrasive wears greatly, and then becomes
close to steady state for a period of time. That describes the initial low forces, then as the
tests went on, the forces increased. The tangential force also shows the effects of the rocking
motion. The first point in the force plot is a test that has no rocking motion. This point has
49
much higher forces than the next few cuts have. Therefore, the rocking motion and the
kinematic analysis performed in chapter 3 is justified.
The wire speed was varied throughout experiment II, but the effects of the wire speed
seemed to be overshadowed by the effects of the wire breaking in. The wire speeds were
also varied by a small amount compared to some of the other parameters, which could also
explain the negligible effects of wire speed.
The surface roughness results also showed some interesting trends. The first trend is that
the rocking motion greatly affects the surface roughness. The Ra without rocking was close
to 2.7 µm, while the highest Ra with rocking motion was only 1.5 µm. The surface
roughness was the worst while machining the middle of the wafer, which could be explained
by the coolant once again not reaching the cutting surface well. The middle of the wafer
has the largest surface length, which means the coolant may not have saturated the area well.
The best surface roughness obtained was about 0.59 µm. This is not as good as the first test,
but it is still acceptable.
Overall this test showed the phenomena of an abrasive breaking in. It also illustrated the
importance of rocking motion on surface roughness. It finally illustrated that the rocking
frequency did not appear to make a large impact on the force or surface roughness, but
rocking motion was clearly important to obtaining a good surface roughness.
5.3 Scanning Electron Microscope Analysis
Scanning electron microscopy is an excellent way to visually characterize the surface
roughness due to machining. The SEM pictures in Appendix 1 show the three main types of
surface damage, which were described in section 4.3. The three types of damage are
50
stagnation lines, microcracking, and surface pulverization. There is a large crack visible in
A.1(b) and figure A.2(a), but it should be noted that that crack is a material defect, and was
not caused by machining. Their test number refers them to the parameters of each
experiment, which are listed above in Table 5.1.
The damage on this wafer is quite similar to the damage in the first experiment. All of
the three types of damage were quite evident. The damage can be quite deep in some
regions, such as in Figure A.2(b). Another interesting region is shown in Figure A.1(a).
The first test was run with no rocking conditions, and the overall damage is very different
than the test areas on the wafer with rocking conditions. The damage seems to be much
worse, and the whole area seems pulverized. It appears as if the SiC was ripped out, and
never machined. Overall the damage is very similar in type to the original test on the flat-
sided wafer, but it differs in magnitude in certain areas.

51
6 Oscillatory Style Wood Machining Results
The main objectives of the oscillatory style wire saw testing were to try to investigate the
cutting forces and to quantify the surface roughness. A higher speed cutting test was
performed to see if the machine was capable of machining at faster feed speeds. The effects
of a series of guide pulleys on the surface roughness and the cutting forces were also
investigated.
6.1 Data Acquisition
The data acquisition system was used to acquire the cutting forces. This series of test
used the force measurement system, except it was mounted on the linear feed mechanism.
The normal force was calculated in a different manner than the single crystal SiC tests. The
feed speeds were much faster than the diamond wire saw, so the force dynamometer was
used to acquire all of the force data. Figure 6.1 below diagrams the cutting forces and their
direction.
Figure 6.1: Wood machining force directions.
FT
FN
Wire

52
6.1.1 Tangential Force
The tangential force was acquired from the piezoelectric force dynamometer. The
direction of the tangential force is normal to the dynamometer, and it had to be calibrated.
Weights were placed on the dynamometer in a sequence of 0, 6, 12, 18, 24, 30, 36, 30, 24,
18, 12, 6, and 0 lbs. The plot below shows the voltage output due to the weights.
0
0.5
1
1.5
2
2.5
0 3 6 9 12 15 18 21
Time (s)
Vol
tage
(V
)
Figure 6.2: Tangential force calibration.
The calibration factor from above was found to be 0.009772 (V/N). It is evident that the
end of the plot does not go back to zero voltage. This is due to a drift in the voltage. The
experiments beforehand focused on the change in force when the wire changed directions,
however the forces here are somewhat stagnant, and therefore the drift rate needs to be
calculated.

53
The final challenge in calculating the tangential cutting force is calculating the drift rate of
the charge amplifiers. Every charge amplifier has its own unique drift rate due to the set up
of the circuitry and the nature of piezoelectric force calculation. The output of the whole
data acquisition system was recorded while no forces were being applied to the
dynamometer. The plot below shows the overall drift rate of the data acquisition system.
0 5 10 15 20 25 30 35 40 45 50 55 60 Time (s)
0 5
10 15 20 25 30
New
tons
Figure 6.3: FT drift rate plot
After the drift rate was determined, FT could be calculated. A moving average was
performed again, to remove unnecessary noise that is inherent in the data acquisition system.

54
0 5 10 15 20 25 30 35 40 45 50 55 60 Time (s)
-10 20 50
New
tons
0 5 10 15 20 25 30 35 40 45 50 55 60 Time (s)
-10 10 30
New
tons
0 5 10 15 20 25 30 35 40 45 50 55 60 Time (s)
-30
-10
10
New
tons
Oscillatory Tangential Force After Processing
Oscillatory Tangential Force (100 Point Moving Average)
Oscillatory Tangential force
Figure 6.4 Oscillatory wire saw data.
The final step in the force analysis process was to convert the force to a specific force. The
method used is exactly the same as what was described in section 4.1.1. The only difference
is that t, the workpiece thickness is 19.05 mm, and WD, the wire diameter was 0.5 mm.
6.1.2 Normal Force
The normal force, FN, was calculated with similar methods to FT. The dynamometer was
calibrated, and so was the drift rate. It was acquired in the exact same method that was
explained in section 5.2.1. Figure 6.4 shows a typical tangential force during the second
experiment.
55
0 5 10 15 20 25 30 35 40 45 50 55 60 Time (s)
-10
0
10
20
30
40 N
ewto
ns
0 5 10 15 20 25 30 35 40 45 50 55 60 Time (s)
-5 0 5
10 15 20 25
New
tons
Final Oscillatory Averaged Normal Force (100pts )
Oscillatory Normal Force
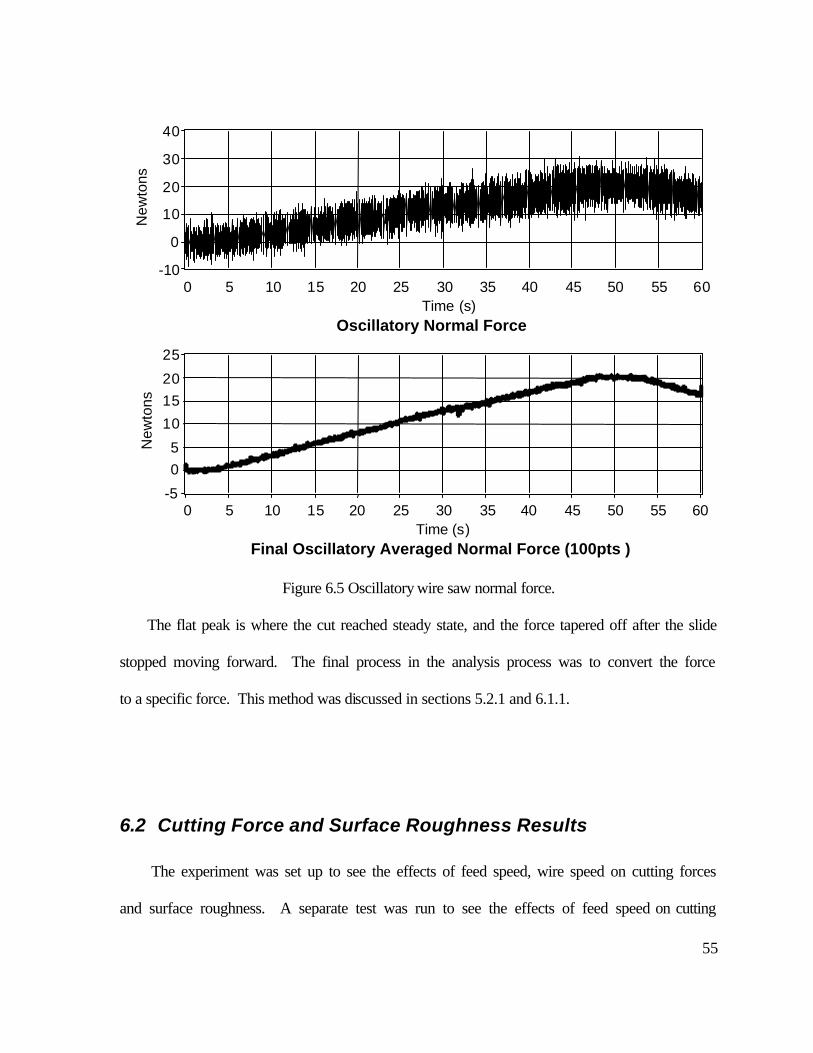
Figure 6.5 Oscillatory wire saw normal force.
The flat peak is where the cut reached steady state, and the force tapered off after the slide
stopped moving forward. The final process in the analysis process was to convert the force
to a specific force. This method was discussed in sections 5.2.1 and 6.1.1.
6.2 Cutting Force and Surface Roughness Results
The experiment was set up to see the effects of feed speed, wire speed on cutting forces
and surface roughness. A separate test was run to see the effects of feed speed on cutting

56
forces. The machine’s capabilities were taken to the limits during the testing and the
following test matrix sums up the experiments run on the oscillatory wire saw. Tables 2.5
through 2.7 describe the process parameters in the experiments. After all of the data was
processed, and the surface roughness was evaluated, the following results were tabulated in
Figure 6.6.
57
Cross cut (with guide)Rip cut (with guide)Rip cut (no guide)Cross cut, fast feed (with guide)
0
3
6
9
Sp
ecif
ic N
orm
al
Fo
rce
(N/m
m/m
m)
0
1
2
3
4
5
Fo
rce
Rat
io (F
N/F
T)
02468
10
Net
Sp
ecif
ic F
orc
e (N
/mm
/mm
)
0
1
2
3
4
Sp
ecif
ic T
ang
enti
al F
orc
e (N
/mm
/mm
)
Cross cut (with guide)Rip cut (with guide)Rip cut (no guide)Cross cut, fast feed (with guide)
0
1
2
3
4
0 0.5 1 1.5 2Wire Speed (m/s)
Ra (
µm)
0 0.5 1 1.5 2Wire Speed (m/s)
Oak Pine
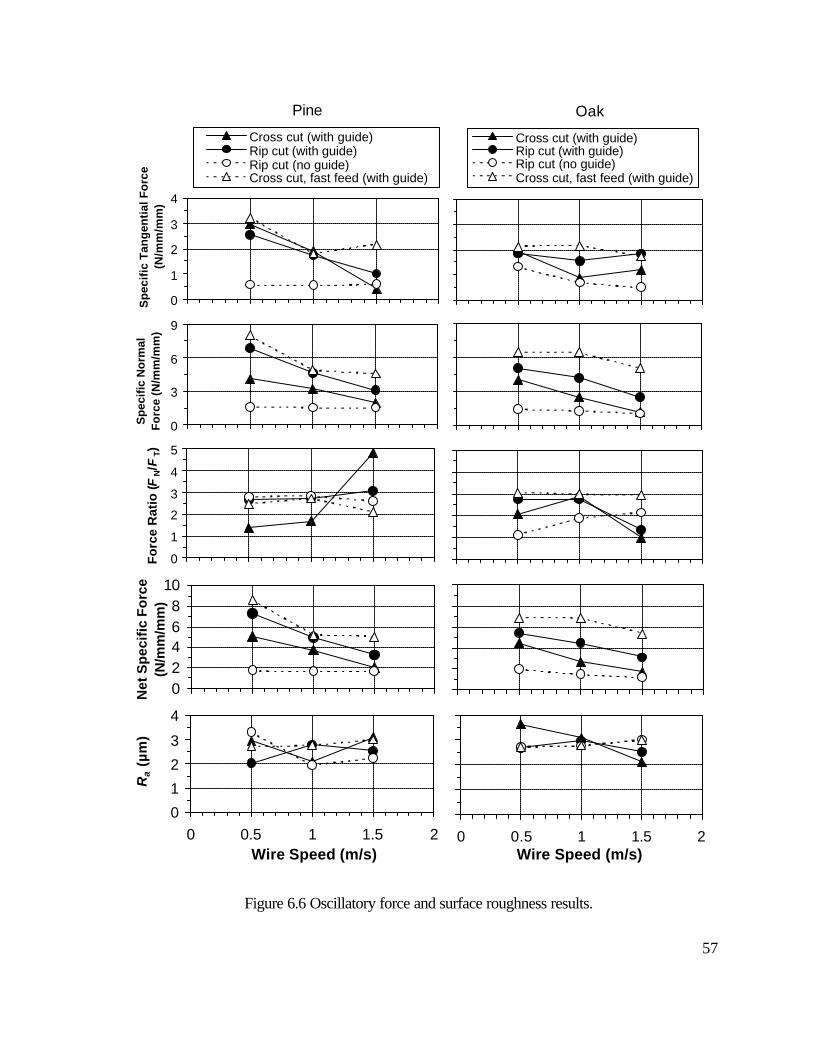
Figure 6.6 Oscillatory force and surface roughness results.
58
6.2.1 Baseline Results
The baseline tests in this experiment show the differences between a rip cut and a cross
cut with guide pulleys. The rip cut and cross cut had very similar specific tangential forces,
fT . They both linearly decreased with a linear decrease in wire speed. The Pine workpieces
had a larger linear decline with the wire speed, but overall both species showed similar
trends. This was expected, and goes with conventional theory.
The specific normal forces, fN, gave different force results. The specific normal force
decreased linearly with a linear increase in wire speed. The pine cross cut tests had almost
half the specific normal forces than the rip cut. The oak had similar trends, but it did not have
as large of a difference between the two cuts. Overall fN was much higher than the fT . This
is due to the combination of feed rate and wire speed.
The force ratio did change, but not to a large degree. The pine ratio stayed from 0.35 to
0.65. This demonstrated that the cutting was effective, and is similar to the results that Clark
[9] reported while machining wood with diamond wire.
The net specific force showed a definite correlation to the wire speed. The rip cut in both
pine and oak showed a magnitude much higher than a cross cut. This could be due to the
difference between cutting across the grain verses cutting with the grain.
The surface roughness did not show much a correlation with wire speed or feed speed. It
basically stayed within a range of 2 to 3 µm. The surface is far better than cuts made on a
band saw, which could not be read on the surface profilometer.

59
6.2.2 Guide Pulley Test Results
The first experiment showed the effects of the guide pulleys. The rip cut performed had
much a much lower fN. The observation is that the wire guides cause the force to be
transmitted to the workpiece rather than dissipated by deflecting the wire. This is desirable
because wire deflection creates less precision in the cutting, and also slows the cutting
greatly. The forces were lowered, but the cutting was neither efficient nor desirable.
The specific normal forces were also much lower without the guides. This was due to the
same explanation given above, and the wire deflected a large amount.
The force ratio was quite similar to every other cut, and basically stayed constant during
the machining process. The ratio was not affected by cutting speed or wire speed.
The wire guide pulleys did not affect the surface roughness. The surface roughness stayed
within the 3 to 4 µm level. The oak and pine specimens showed similar trends in surface
roughness.
6.2.3 Higher Feed Speed Test Results
The second experiment showed the effects of a higher feed speed on a cross cut. The
specific normal force was much higher at the higher feed speed, which would be expected.
The pine results were quite similar to the lower speed rip cut. The oak results were quite
similar as well. The wire speed did lower the tangential forces, but not at the same rate as the
slower feed speed.
The specific normal force was affected by the feed speed in a similar manner as the
tangential force. The fN was very similar to the rip at the slower feed speed as well. The

60
wire speed lowered the normal forces, but with a much smaller slope. The oak and pine
results were quite similar.
The force ratio was once again similar to lower feed speeds, and there does not seem to be
a correlation from feed speed to force ratio.
The net specific force was quite similar to the rip cut in both pine and oak. The forces
were overall a small amount higher, but it was only about a 10% increase at most.
The surface roughness was not affected by the elevated feed speed. This is quite
encouraging, because it shows that feed speed can be elevated without sacrificing the surface
roughness values.

61
7 Looped Style Wood Machining Results
The main objectives of the looped style wire saw testing was to try to investigate the
cutting forces and to quantify the surface roughness. Two basic tests were performed; one
looked at the effects of coolant over a range of cut types and feed speeds. The other
investigated the cutting speed limits of the looped wire saw.
7.1 Data Acquisition
The exact same data acquisition method and system was used in the oscillatory style
experiments, which was described in section 6.1.1 and 6.1.2.
7.2 Cutting Force and Surface Roughness Results
The experiment was set up to see the effects of feed speed and coolant on a number of
different types of cuts. A separate test was run to see the effects of high feed speed on
cutting forces. The machine’s capabilities were taken to the limits during the testing and the
following test matrix sums up the experiments run on the oscillatory wire saw. The test
matrices are shown in Tables 2.8 through 2.10. After all of the data was processed, and the
surface roughness was evaluated, the following results were tabulated. Figure 7.1 shows the
baseline data as well as the coolant tests. Figure 7.2 shows the high feed speed cross cut test
on pine.

62
0
0.3
0.6
0.9
1.2
1.5
Sp
ecif
ic T
ang
enti
al
Fo
rce,
FT (
N/m
m/m
m)
Cross cut (no coolant)Rip cut (no coolant)Cross cut (with coolant)
0
0.5
1
1.5
2
2.5
Sp
ecif
ic N
orm
al F
orc
e,
FN (
N/m
m/m
m)
Cross cut (no coolant)Rip cut (no coolant)Cross cut (with coolant)
0
1
2
3
4
Fo
rce
Rat
io (
FN/F
T)
Pine Oak
0
1
2
3
4
0 0.5 1 1.5 2 2.5
Feed Rate (mm/s)
Ra
(µm
)
0 0.5 1 1.5 2 2.5
Feed Rate (mm/s)
0
0.5
1
1.5
2
2.5
Net
Sp
ecif
ic F
orc
e (N
/mm
/mm
)
Figure 7.1 Oscillatory force and surface roughness results of baseline and coolant tests.
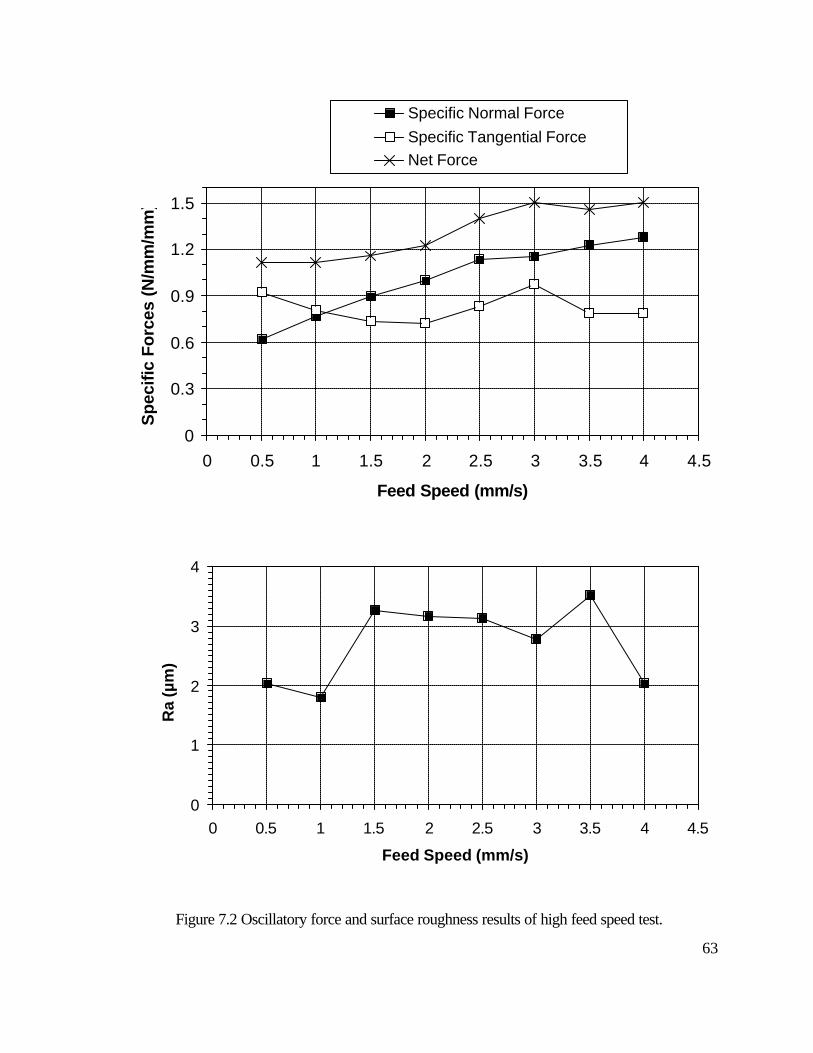
63
0
0.3
0.6
0.9
1.2
1.5
0 0.5 1 1.5 2 2.5 3 3.5 4 4.5
Feed Speed (mm/s)
Spe
cific
For
ces
(N/m
m/m
m)
Specific Normal ForceSpecific Tangential ForceNet Force
0
1
2
3
4
0 0.5 1 1.5 2 2.5 3 3.5 4 4.5
Feed Speed (mm/s)
Ra
(µm
)
Figure 7.2 Oscillatory force and surface roughness results of high feed speed test.

64
7.2.1 Baseline Results
The first set of plots in Figure 7.1 display the specific tangential forces. They show some
very interesting trends. The first trend is that an increase in feed speed definitely decreases
fT . This is what would be expected with conventional machining. The second observation is
that a rip cut with diamond wire requires much more force. This is a trend that is appearing
in all experiments. This is most likely due to the grain microstructure of the wood. The most
interesting part of the plot showed decidedly that pine had lower machining forces overall.
This might be due to the fact that some of the pine came out almost charred looking, which
means that the wood was heating up a lot, and machining faster because of this.
fN showed many of the same trends that the specific tangential force showed. The cross
cut once again showed a much lower normal cutting force. The increased feed rate also
increased the machining forces, which is to be expected.
The force ratio showed that the cutting was quite effective. It has ratios similar to those
that Clark [9] investigated in his wood machining experiments. The pine force ratios seemed
to increase slightly with the increase in feed speed. The oak force ratios varied more during
the experiments, but they still showed fairly efficient cutting was taking place.
The net specific force shows how the overall force magnitude changes. It basically shows
the same principles involving the feed speed. The feed speed increased the forces, and the
rip cut had much higher forces overall.
The surface roughness is also very interesting. Every one of the tests performed all had a
surface roughness within 1 to 3.5 µm. The feed speed seemed to slightly affect the surface
roughness, but it was not totally detrimental. The most important fact is that the surface
65
roughness of this wood is magnitudes better than wood machined on a band saw. The
surface roughness could not be read properly on the surface roughness analysis tools used.
Overall the experiment showed many interesting trends, but also validated many trends
that were expected. One interesting note is that oak could not sustain a rip at the highest feed
speed. The experiment was started, but was stopped quickly to preserve the looped wire saw.
7.2.2 Coolant Test Results
The coolant decreased the tangential specific cutting forces, especially in the oak
experiments. The pine tangential forces didn’t respond the same, but the overall trend is
positive. They still show the same trends that the dry tests ran, but the force is lower overall.
The specific normal cutting force also decreased when coolant was applied. Both oak and
pine normal cutting forces were reduced with the usage of a small amount of coolant.
Overall the coolant also lowered the net forces, which is also to be expected. The specific
normal and tangential forces were lowered; therefore the magnitude was lowered as well.
The coolant did seem to improve the surface finish as well. It could be explained as
something like a wet sanding process, where water acts as a lubricant. It could also be
explained by keeping the wire cooler, which allowed it to cut as it was designed.
7.2.3 Feed Speed Test
The second high feed speed cross cut on pine showed interesting results. The test
showed the limits of the feed speed with the looped wire saw. These results show that a
much higher feed speed can be used with a looped wire test. The forces increased while the
feed speed increased, which was expected.

66
The high feed speed test also showed that the surface roughness is not compromised while
machining at high speeds. They were somewhat higher, but overall they were quite
acceptable. This experiment shows that the looped wire saw is superior in cutting speed and
the surface roughness is not compromised, which is desirable.

67
8 Conclusion
With increasing material costs for wood materials, there exists a need for a method of
machining with lower kerf loss. Fixed abrasive diamond wire saw machining was
investigated for use in cutting wood. Wood machining is traditionally dominated by the use
of steel saw blades. The fixed abrasive diamond wire developed for use by the
semiconductor industry to slice crystal ingots is significantly thinner than even the most
advanced thin kerf saw blades. This can lead to significant material cost savings in a
production environment.
Single Crystal SiC is extremely difficult to machine. The current production methods are
quite time consuming and costly. As demand grows for power and optoelectrical devices
built on this substrate, the demand for faster and more effective machining methods grows as
well. Fixed abrasive diamond wire stands to be a possible method to meet these needs, and
the need for research in this field is very large.
The machining properties of single crystal SiC were examined. The effects of wire speed,
feed speed, and rock frequency on surface roughness and cutting forces were explored. The
first experiment showed that the cutting forces were directly correlated with surface
roughness. It also showed that downfeed rate does not affect the surface roughness, but it
does the depth of damage in the wafer. A hypothesis was made about the surface roughness
being directly related to the amount of coolant that comes in contact while cutting. This
hypothesis also helped to explain the tangential cutting forces. The scanning electron
microscope micrographs provided a visual characterization of the damage. The formation of

68
stagnation lines was found to be due to a slowdown in wire speed, but no slow down in
downfeed rate. The surface roughness was within a range of 0.2 to 0.3 µm.
The second SiC machining experiment examined the surface roughness and tangential
forces of a complete silicon wafer being machined with new diamond wire. This experiment
showed the effects of breaking in a new wire, and the surface roughness associated with that
process. It also examined the effects of rocking frequency on surface roughness. The
portion of the wafer made without rocking motion was found to have a much worse surface
roughness. The presence of rocking motion was found to affect the surface roughness more
than the actual value of the rock frequency.
The oscillatory wood machining experiment showed that wire speed plays a large roll in
the forces. The ability of a wire saw to machine at high feed speeds was found to be
dependent on the wire speed. The effects of having wire guides that keep the wire from
deflecting were also investigated. The wire guides appeared to keep the wire from
deflecting, but did increase cutting forces. The overall outcome is that the oscillatory saw
machines wood well at slow feed speeds, but the feed rate was still slow compared to the
ones achieved by the looped wire saw. The surface roughness was found to be 2 to 3 µm,
which is extremely good for wood products.
The looped high wire speed saw was found to be able to maintain the fastest feed speeds
of any wire saw investigated. The wire ran at close to 13 times the feed speed that the
oscillatory wire saw operated at. The maximum feed rate was found to be 4 times faster than
the oscillatory saw. The surface roughness was in the range of 3 to 4 µm, which was a little
worse than the oscillatory saw, but is still magnitudes better than any other wood machining
method.

69
In conclusion there is still a large amount of research left to be performed in the fixed
abrasive wire saw field. The effects of the rock angle should be investigated while
machining single crystal SiC. The controller in the Millennium Series Slicing Saw should be
modified to be able to slow down the downfeed while the wire is reversing direction. The
coolant delivery system should also be investigated to see if there is any way to improve the
coolant flow. Finally a new series of tests should be run to investigate the surface roughness
after these modifications.
The wood machining results showed that there is also a need for more research in this
field. A machine with a higher wire speed than 20 (m/s) should be found and investigated for
wood machining. The feed rates in the looped wire saw were much higher than explored
elsewhere, but are still nowhere near the capabilities of conventional thin kerf saws.
Overall the findings are quite informative, and can stand as a great place to start for
further experiments.

70
References
[1] Mitsubushi, 1998, Pathway to the Production of High Purity Silicon, Mitsubushi Advanced Materials.
[2] Bekaert, 1999, Sawing Wire, Bekaert Steel Cord Product Group, Zwevege, Belgium. [3] S. Ito, R. Murata, Study on machining characteristics of diamond abrasive wire, Journal
of Mechanical Engineering Lab, Tokyo, Japan 41 (5) (1987) 236-244. [4] H. Tokura, S. Nakayama, M. Yoshikawa, Cutting performance of diamond plated wire
tools, Journal of Japan Society of Precision Engineering 58 (12) (1992) 2013-2018. [5] K. Ishikawa, H. Suwabe, K. Kanayama, M. Makino, and H. Yoshida, Study on
machining characteristics of wire tool with electrodeposited diamond grains, Transactions of Japan Society of Mechanical Engineers 60 (573) (1994) 1815-1820.
[6] J. Li, I. Kao, V. Prasad, Modeling stresses of contacts in wire saw slicing of polycrystalline and crystalline ingots: application to silicon wafer production, ASME Journal of Electronic Packaging 120 (1998) 123-128.
[7] R.K. Sahoo, V. Prasad, I. Kao, J. Talbott, and K. P. Gupta, Towards an integrated approach for analysis and design of wafer slicing by a wire saw, ASME Journal of Electronic Packaging 120 (1998) 35-40.
[8] M. Bhagavat, I. Kao, Computational model for free abrasive machining of brittle silicon using a wiresaw, ASME International Mechanical Engineering Congress and Exposition, Nashville, TN, ASME Design Engineering Division, DE-104 (1999) 21-30.
[9] M. Bhagavat, V. Prasad, and I. Kao, Elasto-hydrodynamic interaction in the free abrasive wafer slicing using a wiresaw: modeling and finite element analysis, ASME Journal of Tribology 122 (2) (2000) 394-404.
[10] W.I. Clark, A.J. Shih, C.W. Hardin, R.L. Lemaster, S.B. McSpadden, Fixed abrasive diamond wire machining – part I: process monitoring and mechanics of wire cutting, International Journal of Machine Tools and Manufacture (2002) 523-532.
[11] W.I. Clark, A.J. Shih, C.W. Hardin, R.L. Lemaster, S.B. McSpadden, Fixed abrasive diamond wire machining – part II: experiment design and results, International Journal of Machine Tools and Manufacture (2002) 533-542.
[12] H. Mech, Machine and method for cutting brittle materials using a reciprocating cutting wire, US Patent Number 3,831,576 (1974).
[13] H. Mech, Machine for cutting brittle materials, US Patent Number 3,841,297 (1974). [14] H. B. McLaughlin, Use X and Y table to contour cut the workpiece, US Patent
Number 4,016,856 (1977). [15] R. C. Wells, Wire saw, US Patent Number 4,494,523 (1985). [16] R. C. Wells, T. J. Hatfield, Wire saw machine, US Patent Number 4,655,191 (1987). [17] T. Kurokawa, Wire saw, US Patent Number 4,903,682 (1990). [18] N. Takeuchi, Brittle material cutting method, US Patent Number 5,201,305 (1991). [19] K. Toyama, E. Kiuchi, K. Hayakawa, Wire saw and slicing method using the same, US
Patent Number 5,269,285 (1993).

71
[20] R. Bonzo, H.G. Shafer, J.P. Trentelman, Apparatus and method for wire cutting glass-ceramic wafers, US Patent Number 5,564,409 (1996).
[21] C. Hauser, Wire Sawing Device, US Patent Number 5,758,633 (1998). [22] C. Hauser, Wire Sawing Device, US Patent Number 5,787,872 (1998). [23] K. Toyama, Wire saw cutting method synchronizing workpiece feed speed with wire
speed, US Patent Number 5,810,643 (1998). [24] C. Hauser, Device for wire sawing provided with a system for directing wire permitting
use of spools of wire of very great length, US Patent Number 5,829,424 (1998). [25] J. B. Hodsden, Apparatus and method for slicing a workpiece utilizing a diamond
impregnated wire, US Patent Number 5,878,737 (1998). [26] C. Hauser. Wire Saw Device, US Patent Number 5,910,203 (1999). [27] K. Miyoshi, T. Suzuki, K. Takahashi, Y. Goto, A. Shiba, S. Wada, Wire type slicing
machine and method, US Patent Number 5,944,007 (1999). [28] K. Toyama, Wire saw cutting apparatus synchronizing workpiece feed speed with
wire speed, US Patent Number 5,947,789 (1999). [29] J. B. Hodsden, Apparatus and method for slicing a workpiece utilizing a diamond
impregnated wire, US Patent Number 5,964,210 (1999). [30] J. B. Hodsden, J. B. Hodsden, Continuous wire saw loop and method of manufacture
thereof, US Patent Number 6,065,462 (2000). [31] S. T. Buljan, R. M. Andrews, Brazed superabrasive wire saw and method therefore, US
Patent Number 6,102,024 (2000). [32] K. Egglhuber, Wire saw and method of using it, US Patent Number 6,098,610 (2000). [33] K. Asakawa, H. Oishi, Ingot slicing method and apparatus therefore, US Patent Number
6,065,461 (2000). [34] M. Ikehara, Method using a wire feeding device for a multi-wire saw, US Patent Number
6,109,253 (2000). [35] S. Katamachi, Wire saw for slicing brittle materials with an ingot loading and unloading
mechanism, US Patent Number 6,135,103 (2000). [36] I. Ueoka, J. Sugawara, A. Mizogouchi, H. Oshita, M. Yamanaka, H. Ogawa, N.
Urakawa, H. Yoshinaga, Wire-saw and its manufacturing method, US Parent Number 6,070,570 (2000).
[37] D. A. Witte, T. Ragan, Method of slicing silicon wafers for laser marking, US Patent Number 6,112,738 (2000).
[38] F. C. Yu, Diamond wire saw, US Patent Number 6,105,568 (2000). [39] J. B. Hodsden, Apparatus and method for slicing a workpiece utilizing a diamond
impregnated wire, US Patent Number 6,024,080 (2000). [40] J. B. Hodsden, Rocking apparatus and method for slicing a workpiece utilizing a
diamond impregnated wire, US Patent Number 6,279,564 (2001). [41] S. Nagatsuka, S. Okubo, H. Kawarai, H. Oishi, K. Asakawa, J. Matsuzaki, Wire saw
control method and wire saw, US Patent Number 6,178,961 (2001). [42] S. Ohashi, M. Matsuzawa, Saw wire assembly, cutting method utilizing the same, and
system therefore, US Patent Number 6,178,962 (2001). [43] K. Egglhuber, Wire saw and process for cutting off shaped articles, US Patent
Number 6,234,159 (2001).

72
[44] H. Oishi, K. Asakawa, J. Matsuzaki, Wire Sawing Machine, US Patent Number 6,237,585 (2001).
[45] K. Onizaki, K. Ogawa, Wire saw cutting method and apparatus therefore, US Patent Number 6,283,111 (2001).
[46] O. Kononchuk, G. Preece, Apparatus and method for reducing bow and warp in silicon wafers sliced by a wire saw, magnets using wire saw, and voice coil motor, US Patent Number 6,352,071 (2002).
[47] M. Chikuba, H. Ishida, Method for cutting rare earth alloy, method for manufacturing rare earth alloy plates and method for manufacturing rare earth alloy, US Patent Number 6,381,830 (2002).
[48] C. Hauser, Wire sawing device for cutting fine slices using angular crossing of at least two sawing yarn layers, US Patent Number 6,408,839 (2002).
[49] H. Oishi, K. Asakawa, J., Matsuzaki, K. Ashida, Slurry useful for wire-saw slicing and evaluation of slurry, US Patent Number 6,422,067, (2002).
[50] J. B. Hodsden, Continuous wire saw loop and method of manufacture thereof, US Patent Number 6,311,684 (2002).
[51] A.J. Shih, T.M Yonushonis, M.B. Grant, T.O. Morris and S.B. McSpadden, Vitreous bond CBN wheel for high speed grinding of ceramic and M2 steel, Transaction of the North American Manufacturing Research Institution of SME 26 (1998) 195-200.
[52] A.J. Shih, M.B. Grant, T.M. Yonushonis, T.O. Morris and S.B. McSpadden, High speed and high material removal rate grinding of ceramics using the vitreous bond CBN wheel, Machining Science and Technology 4 (2000) (1) 43-58.
[53] B.K. Rhoney, A.J. Shih, R.O. Scattergood, J.L. Akemon, D.J. Gust, and M.B. Grant, Cylindrical wire electrical discharge machining of metal bond diamond wheels for ceramic grinding, International Journal of Machine Tools and Manufacture. (accepted)
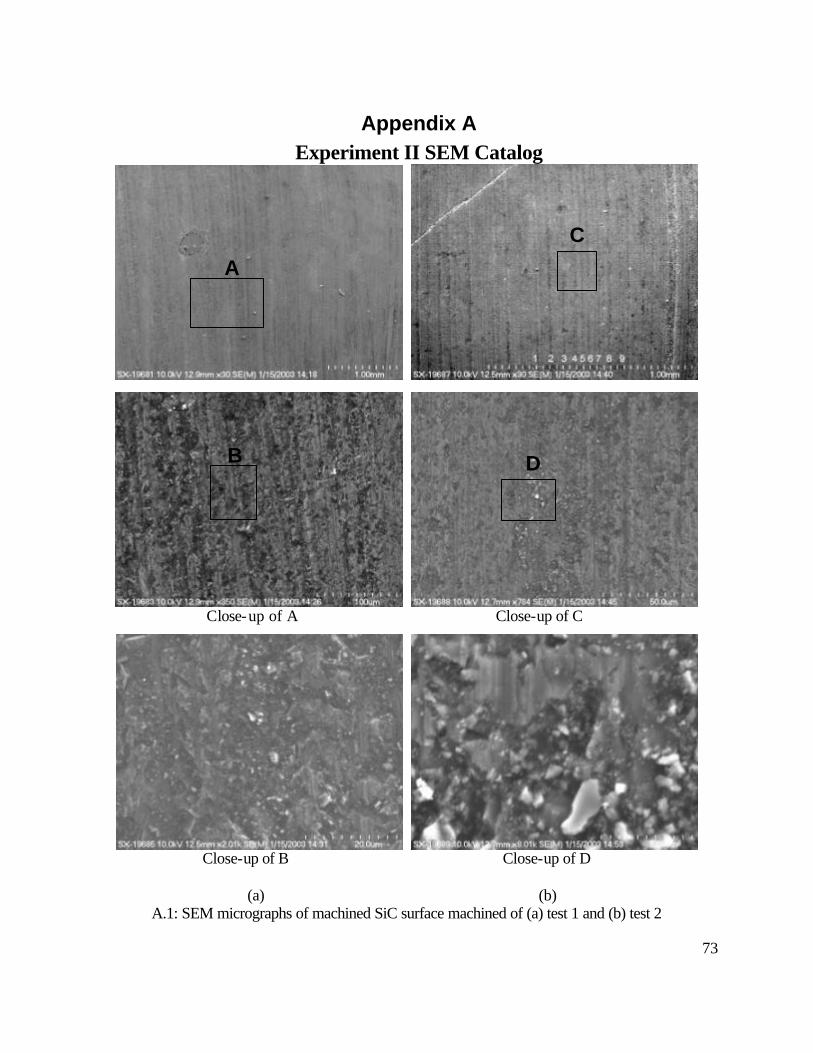
73
Appendix A Experiment II SEM Catalog
Close-up of A Close-up of C
Close-up of B Close-up of D
(a) (b)
A.1: SEM micrographs of machined SiC surface machined of (a) test 1 and (b) test 2
A
B
C
D

74
Close-up of A Close-up of C
Close-up of B Close-up of D
(a) (b)
A.2: SEM micrographs of machined SiC surface machined of (a) test 3 and (b) test 4
A
B
C
D

75
Close-up of A Close-up of C
Close-up of B Close-up of D (a) (b)
A.3: SEM micrographs of machined SiC surface machined of (a) test 5 and (b) test 6
B D
A C

76
Close-up of A Close-up of C
Close-up of B Close-up of D (a) (b)
A.4: SEM micrographs of machined SiC surface machined of (a) test 7 and (b) test 8
B D
C A

77
Close-up of A Close-up of C
Close-up of B Close-up of D (a) (b)
A.5: SEM micrographs of machined SiC surface machined of (a) test 9 and (b) test 10
B
D
A C