Embed Size (px)
Citation preview
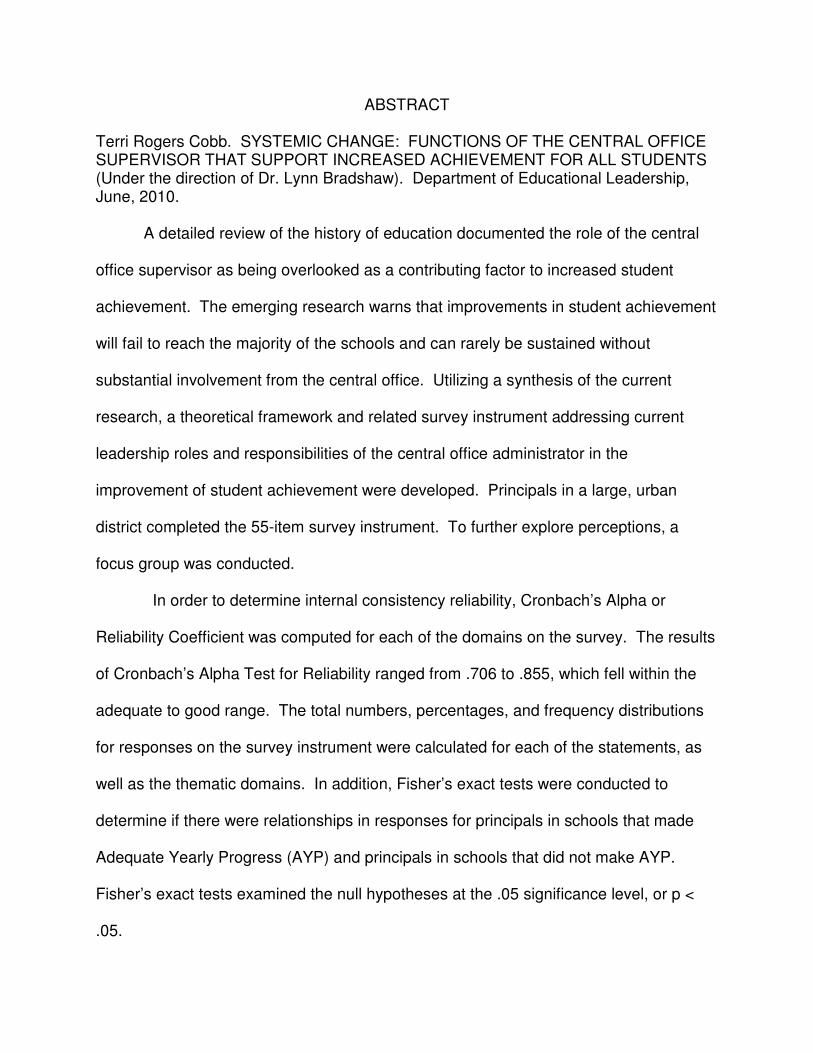
ABSTRACT Terri Rogers Cobb. SYSTEMIC CHANGE: FUNCTIONS OF THE CENTRAL OFFICE SUPERVISOR THAT SUPPORT INCREASED ACHIEVEMENT FOR ALL STUDENTS (Under the direction of Dr. Lynn Bradshaw). Department of Educational Leadership, June, 2010.
A detailed review of the history of education documented the role of the central
office supervisor as being overlooked as a contributing factor to increased student
achievement. The emerging research warns that improvements in student achievement
will fail to reach the majority of the schools and can rarely be sustained without
substantial involvement from the central office. Utilizing a synthesis of the current
research, a theoretical framework and related survey instrument addressing current
leadership roles and responsibilities of the central office administrator in the
improvement of student achievement were developed. Principals in a large, urban
district completed the 55-item survey instrument. To further explore perceptions, a
focus group was conducted.
In order to determine internal consistency reliability, Cronbach’s Alpha or
Reliability Coefficient was computed for each of the domains on the survey. The results
of Cronbach’s Alpha Test for Reliability ranged from .706 to .855, which fell within the
adequate to good range. The total numbers, percentages, and frequency distributions
for responses on the survey instrument were calculated for each of the statements, as
well as the thematic domains. In addition, Fisher’s exact tests were conducted to
determine if there were relationships in responses for principals in schools that made
Adequate Yearly Progress (AYP) and principals in schools that did not make AYP.
Fisher’s exact tests examined the null hypotheses at the .05 significance level, or p <
.05.

The findings of the study supported essential functions for the central office in
improving student achievement. Furthermore, this study revealed that a statistical
relationship did not exist between the perceptions of principals in schools that met AYP
and principals of schools that did not meet AYP. The findings, implications, and
recommendations for further study are discussed.
SYSTEMIC CHANGE: FUNCTIONS OF THE CENTRAL OFFICE SUPERVISOR
THAT SUPPORT INCREASED ACHIEVEMENT
FOR ALL STUDENTS
A Dissertation
Presented to
The Faculty of the Department of Educational Leadership
East Carolina University
In Partial Fulfillment
Of the Requirements for the Degree
Doctor of Education
by
Terri Rogers Cobb
June, 2010

SYSTEMIC CHANGE: FUNCTIONS OF THE CENTRAL OFFICE SUPERVISOR
THAT SUPPORT INCREASED ACHIEVEMENT
FOR ALL STUDENTS
by
Terri Rogers Cobb
APPROVED BY:
CHAIR OF DISSERTATION:_______________________________________________ Lynn Bradshaw
COMMITTEE MEMBER:__________________________________________________
Harold Holloman, Jr. COMMITTEE MEMBER:__________________________________________________
Lane Mills
COMMITTEE MEMBER:__________________________________________________ Marjorie Ringler
COMMITTEE MEMBER:__________________________________________________
Joe Peel INTERIM CHAIR OF THE DEPARTMENT OF EDUCATIONAL LEADERSHIP:
________________________________________________ William Rouse, Jr.
ACTING DEAN OF THE GRADUATE SCHOOL:
________________________________________________ Paul Gemperline

©Copyright 2010 Terri Rogers Cobb

DEDICATION
I dedicate this dissertation to my husband and best friend, Warren. No matter
which direction our personal and professional lives have taken us, you have always
encouraged me to hold tight to my beliefs, passions, and dreams. I could feel your
presence through the difficult times, your satisfaction as hurdles were passed, and your
pride in times of celebration. For this, I will be eternally grateful.
ACKNOWLEDGEMENTS
English poet John Donne wrote, “No man is an island.” I sincerely believe his
words to be true and know that completion of this doctoral program was possible only
through the support of many wonderful people. I begin by thanking the East Carolina
University faculty within the Department of Educational Leadership. I learned much from
every phase of the process. The experience has been very rewarding, professionally
and personally. Your expertise, knowledge, and commitment to a quality program are to
be admired. I extend a special thanks to my dissertation committee; Dr. Lynn Bradshaw,
Dr. Harold Holloman, Dr. Lane Mills, Dr. Joe Peel, and Dr. Marjorie Ringler. Your
willingness to give freely of your time and advice was invaluable as I moved through this
process. To my Chair, Dr. Lynn Bradshaw, there are no words that can adequately
express my gratitude. You always asked the right questions to move me to the next
level. Your patience, knowledge, wisdom, and sincere concern made the difference. I
left every conversation with confidence and a desire to do my best.
During the last several years, I have appreciated the collegiality from my cohort
members. You added to my experiences through your experiences. Even though we
will no longer meet through the program, I know we will continue these relationships
throughout our lives. I would particularly like to thank Pam Breedlove and Dave
Schwenker. I have appreciated our professional relationships and, more importantly,
your friendships.
Finally, I would like to thank Dr. Del Burns and Ann Bagley, two former
colleagues. Dr. Burns strongly encouraged me to pursue this degree and removed
barriers to make it possible. Ann Bagley supported me with technical advice. I

appreciate both of you for your encouragement throughout the process and extend to
you my sincere gratitude.
TABLE OF CONTENTS
LIST OF FIGURES.............................................................................................. xvi LIST OF TABLES................................................................................................ xvii CHAPTER 1: INTRODUCTION........................................................................... 1 Statement of the Problem.......................................................................... 1 Purpose of the Study................................................................................. 5 Overview of Methodology.......................................................................... 6 Setting…………………………………………………………………... 8 Adequate Yearly Progress (AYP) results……………............... 8 Organization of schools………….……………………………… 10 Organization of central office…….…………………………….. 10 Research Questions........................................................................ 10 Null Hypotheses……………………………………………………….. 10 Definition of Terms........................................................................... 12 Adequate Yearly Progress (AYP)……………………………….. 12 Central office supervisor……………………………….…………
12
End-of-Course (EOC)………………………….………………..
14
End-of-Grade tests (EOG)……………………………….………. 14 No Child Left Behind Act of 2001 (NCLB)…………………….. 15
Student achievement……………………………………………. 15 Thematic domain……………………......................................... 15 Significance of Study................................................................................... 15 Assumptions................................................................................................ 16
Limitations of the Study.............................................................................. 16 Adequate Yearly Progress……………………………………............. 17 Working Conditions……………………………………………............. 17 Selection Criteria for Participation in Focus Group…………………. 17 Selection Criteria for Participation in the Survey……………………. 17 Testing Data..................................................................................... 17 Relevance to Other Districts............................................................ 17 Research Organization.............................................................................. 18 CHAPTER 2: REVIEW OF THE LITERATURE................................................... 19 Theoretical Framework……………………………………………………….. 19 History of Supervision................................................................................ 21 Supervision as Inspection................................................................ 24 Supervision as Social Efficiency......................................................
31
Democratic Supervision................................................................... 37 Scientific Supervision....................................................................... 43 Supervision as an Agent of Change................................................ 49 Clinical Supervision......................................................................... 54 Supervision as Leadership.............................................................. 57 Current Influences..................................................................................... 60 Restructuring Movement.................................................................. 60 Standards Movement....................................................................... 64 Challenges....................................................................................... 65 Emerging Research................................................................................... 68
Systemic Focus................................................................................ 71 Develop a shared vision......................................................... 71 Maintain communication with stakeholders…………………. 72 Develop trust among stakeholders…………………………… 73 Become keeper of the vision................................................. 73 Develop a multi-year plan...................................................... 74 Ensure an equity agenda....................................................... 75 Implement a cycle of continuous improvement...................... 75 Serve as brokers.................................................................... 76 Become a service provider.................................................... 77 Balance school autonomy with central office responsibility..........................................................................
78
Commitment to Instruction............................................................... 78 Ensure alignment and a clear focus...................................... 79 Identify research based programs and practices................... 80 Coordinate instructional materials.......................................... 80 Use of Data to Drive Decisions........................................................ 81 Collect and analyze data........................................................ 81 Develop formative assessments and benchmarking……….. 81 Utilize program evaluation..................................................... 82 Investment in Professional Development......................................... 83 Ensure high quality professional development...................... 83 Provide professional development focused on instruction….
84
Provide professional development for role-alike groups……
84
Provide professional development for central office……….. 84 Maintain support for new employees..................................... 85 Establish structures for learning communities....................... 85 Leadership Development.................................................................. 86 Encourage distributed leadership.......................................... 86 Ensure strong instructional leadership from administrators... 87 Provide leaders with the knowledge to become change savvy……………………………………………………………...
88
Work with institutions of higher education.............................. 89 Offer advancement opportunities........................................... 89 Optimal Use of Human and Financial Resources............................ 89 Ensure equitable, efficient, and transparent distribution of resources...............................................................................
90
Assist schools in understanding finances.............................. 90 Seek alternative revenues..................................................... 91 Identification of Intervention Strategies............................................ 91 Support multi-tiered intervention............................................ 91 Provide professional development related to intervention strategies...............................................................................
92
Summary……………………………………………………………………….. 92 CHAPTER 3: METHODOLOGY.......................................................................... 95 Statement of the Problem…………………………………………………….. 95 Research Questions.................................................................................. 96 Population.................................................................................................. 96
Setting.............................................................................................. 96 Student Population........................................................................... 97 Demographics........................................................................ 97 Special needs of students...................................................... 97 Free/reduced lunch status..................................................... 97 Qualifications of Principals............................................................... 103 Organization of Central Office………………………………………… 103 Design of Study.......................................................................................... 105 Development of the Survey…………………………………………… 105 Reliability Coefficient…………………………………………………… 106 Participants...................................................................................... 108 Limitations of the Study………………….......................................... 108 Adequate Yearly Progress (AYP).......................................... 108 Working conditions…………………………………………….. 108 Participation in focus group………………………………….... 108 Selection criteria for participation in the survey...................... 108 Testing data used…………………………………................... 109 Relevance to other districts................................................... 109 Analysis of Data......................................................................................... 109 Focus Group.............................................................................................. 110 Summary.................................................................................................... 111 CHAPTER 4: DATA ANALYSIS…………………………………………………….. 113 Description of Participants……………………………………………………. 114
Tests for Reliability…………………………………………………………….. 115 Analysis of Data………………………………………………………………... 118 Research Question #1…………………………………………………... 118 Systemic focus……….………………………….………………. 121 Commitment to instruction…………………………………….. 121 Use of data to drive decisions…..……………..…………….... 125 Investment in professional development………..…………… 125 Leadership development………………………………………. 125 Optimal use of human and financial resources……………… 128 Identification of intervention strategies……………..………… 128 Research Question #2………….……………………………………….. 132 Fisher’s exact tests…….………………………………..……… 133 Hypotheses……………………………………………………… 134 Focus Group Interview…………………………………………............ 138 Summary………………………………………………………………………. 139 CHAPTER 5: DISCUSSION AND RECOMMENDATIONS……………………… 141 Summary……………………………………………………………………….. 141 Assumptions……………………………………………………………… 143 Participants……….………………………………………………………. 143 Survey…………….………………………………………………………. 143 Findings and Discussion……………………………………………………... 144 Research Question #1…….……………………………………............. 144 Systemic focus………………………….………………………. 147
Commitment to instruction…………………..…………………. 148 Use of data to drive decisions...……………………………….. 148 Investment in professional development…………….............. 149 Leadership development………………………………………. 149 Optimal use of human and financial resources……………… 149 Identification of intervention strategies……………………….. 150 Research Question #2………………………………………………….. 150 Limitations of the Study………………………………………………… 153 Adequate Yearly Progress (AYP)……………………………... 153 Working conditions……………………………………………… 153 Selection criteria for participation in survey………………….. 153 Participation in focus group…………………………………..... 154 Testing data used….……………………………………………. 154 Relevance to other districts……………………………………. 154 Implications……..………………………………….………….......................... 154 Implications for District Leaders, Boards of Education, and Policy-Making Bodies…………………………..……………………….
155
Implications for School and Central Office Administrators………… 157 Implications for Institutions of Higher Education……………………. 157 Recommendations……..…………………………………………................... 158 Recommendations for State-Policy Makers, State Boards of Education, and Local Boards of Education…………………..............
158
Revise state and local policies and related regulations and procedures (R&P)……………………......................................
158
Establish state-wide standards of practice…………………… 159 Develop state-wide assessments for central office standards of practice…………………………………….............................
159
Include assessment results in state accountability models… 160 Recommendations for Practices within Districts…………….............. 160 Acknowledge the issues and accept the challenge…………. 160 Provide stakeholders with opportunities to increase awareness of the need for new roles and relationships……
160
Establish clear responsibilities for principals and central office administrators…………………………………………….
161
Review the organizational structure of the central office…… 161 Provide necessary professional development for central office administrators and principals………….........................
162
Provide opportunities for collaboration………………………. 162 Maintain support for schools that did and did not make AYP 163 Utilize functions within thematic domains to prioritize funding…….………………………………………………………
163
Recommendations for Institutions of Higher Education…….............. 163
Lay the foundation for new roles and relationships between the school and the central office……………………………….
163
Place increased emphasis on preparation programs for supervisors ……………………………………………………....
164
Organize content of preparation programs around thematic domains…………………………………………………………..
164
Include skills for collaboration in preparation programs…….. 165 Support districts by providing on-going training……………. . 165

Assist states and local districts in developing tools for assessing central office support for increased student achievement………………………………………………………
165 Recommendations for Further Research…………………………….. 166 Perception of central office supervisors…………………….. 166 Perceptions of teachers………………………………………. 166 Comparison of Title I and non-Title I schools………………. 167 Comparison of perceptions of novice and experienced principals………………………………………………………..
167
Perceptions of principals by level (elementary, middle, high)…………………………..…………………………………
168
Perceptions in other districts…………………………………. 168 Case studies of districts effective in implementing changes in the relationship among schools and the central office…..
168
Conclusion………………………………………………………………………. 169 REFERENCES...................................................................................................... 171 APPENDIX A: INSTITUTIONAL REVIEW BOARD APPROVAL LETTER……. 208 APPENDIX B: SCHOOL DISTRICT REVIEW BOARD APPROVAL LETTER…. 210 APPENDIX C: SOURCES OF THEMATIC DOMAINS IN CENTRAL OFFICE FUNCTIONS..........................................................................................................
211
APPENDIX D: SURVEY FOR PRINCIPALS………………………………....……..
213
APPENDIX E: INVITATION TO PRINCIPALS TO PARTICIPATE IN STUDY….
217
APPENDIX F: FOCUS GROUP QUESTIONS……………………………………... 218
LIST OF FIGURES
1. Theoretical framework for the functions of the central office in improving student achievement………………..................................................................
7
2. Shifting models of educational supervision..................................................... 23 3. Analysis of thematic domains within the theoretical framework...................... 70 4. Central office organizational chart……………………………………………… 104 5. Percentages of responses………………………………………………………. 146
LIST OF TABLES
1. Fisher’s Exact Tests Examining Principals’ Perceptions of the District’s Role in Improving Student Achievement……….………..................................
9
2. North Carolina 2008-09 Proficiency Target Goals.......................................... 13 3. Growth in Student Population......................................................................... 98 4. Shifting Demographics.................................................................................... 100 5. Number of Items on Survey…………………………………………………….. 6. Comparison of AYP Status for District and AYP Status for Study…………..
107
116 7. AYP Status of Schools Represented by Participants………………………….
117
8. Reliability Coefficient……………………………………………………………… 119 9. Summary for Frequencies in Seven Thematic Domains……………………… 120 10. Responses to Individual Items under Systemic Focus……………….............
122
11. Responses to Individual Items under Commitment to Instruction……………
124
12. Responses to Individual Items under Use of Data to Drive Decisions……… 126 13. Responses to Individual Items under Investment in Professional Development……………………………………………………………………….
127
14. Responses to Individual Items under Leadership Development…………….
129
15. Responses to Individual Items under Optimal Use of Human and Financial Resources………………………………………………………………………….
130
16. Responses to Individual Items under Identification of Intervention Strategies………………………………………………………………………..…
131
17. Results of Fisher’s Exact Tests………………………………………………….
135

CHAPTER 1: INTRODUCTION
Statement of the Problem
A Nation at Risk: The Imperative for Educational Reform, credited with initiating
several decades of pointed discussions about America’s public schools, stunned
educators and the public, and as a result, elevated interest in identifying strategies that
increased student achievement (Hunt, 2008). Two decades later, the enactment of the
reauthorization of the Elementary Secondary Education Act (ESEA) as the No Child Left
Behind (NCLB) Act of 2001, Public Law 107-110 (2002), not only reminded educators of
their obligation to provide every child with an appropriate education but made it a legal
requirement as well (Berry, Darling-Hammond, Hirsch, Robinson, & Wise, 2006;
Danielson, 2006; Danielson, Doolittle & Bradley, 2007; Hunt, 2008; No Child Left Behind
Act of 2001). Even with this mandate, national trend lines starting in 2000 demonstrated
clear evidence that growth in reading and math slowed after the enactment of NCLB
(Bracey, 2008; Carbo, 2007; Duffett, Farkas, & Loveless, 2008). Reading achievement
for students on the National Assessment of Educational Progress (NAEP) remained the
same and, in some cases, declined between 2001 and 2006 (National Center for
Education Statistics, 2006). While math showed a slight increase from 2001 until 2006,
the recent release of the 2009 NAEP results was framed by stagnated math scores for
fourth grade students (Cavanagh, 2009b). In addition, the achievement gap between
white and non-white students has remained unchanged, which has further shattered
hopes that schools were moving in the right direction (Ravitch, 2009).
The results have left school-based educators asking if the demands of
accountability are realistic (Fullan; 1997; Fullan, 2010(c); Goertz & Duffy, 2003; Guskey,

2
2007; Guzman, 2010), and researchers posing difficult questions as to whether
improvements in American public schools are even possible under the new mandates
(Dufour, Dufour, Eaker, and Karhanek, 2010; Dufour & Eaker, 1998; Finn, 1991; Fullan,
1997; Guzman, 2010; Sarason, 1990; Schlechty, 2001). These questions come as no
surprise since the best efforts to meet the mandates have only yielded modest results,
and neither top-down, side-ways, or bottom-up efforts have achieved the desired
improvements (Beck & Murphy, 1989; Dufour & Eaker; Pajak, Adamson, & Rhoades,
1998; Fullan, 2010(c); Schlechty).
Even though much has been written in the last several decades about the need
for school-based change (Arterbury, 1991; Bjork & Blasé, 2009; Blasé & Blasé, 1994,
1997; Bradley, 1995; Brown, 1990; Carr, 1988; Chapman, 1990; Darling-Hammond,
1997; David, 1996; Ellis & Fouts, 1994; Finn, 1991; Finn & Walberg, 1994; Hill & Bonan,
1991; Imber & Duke, 1984; Noel, Slate, Brown, & Tejeda-Delgado, 2008; Rose, 2007;
Weber, 1971; Weick, 1982), it has become painfully apparent that the school does not
exist in seclusion and cannot be expected to lead the charge alone (Daresh, 2004;
Hargreaves, 1997; Hatch, 2009; Honig & Copland, 2008; Le Floch, Carlson, Taylor, &
Thomsen, 2006; Markward, 2008; Protheroe, 2008; Rallis & Highsmith, 1986; Togneri &
Anderson, 2003a). The compelling evidence that schools cannot meet these mandates
in isolation, combined with the consequences of failing to meet the mandates, are too
great for districts to ignore. Leaders must pay attention to the growing research, which
warns educators that if schools are required to tackle the issues without substantial
involvement from the central office, improvements will fail to reach the majority of the
3
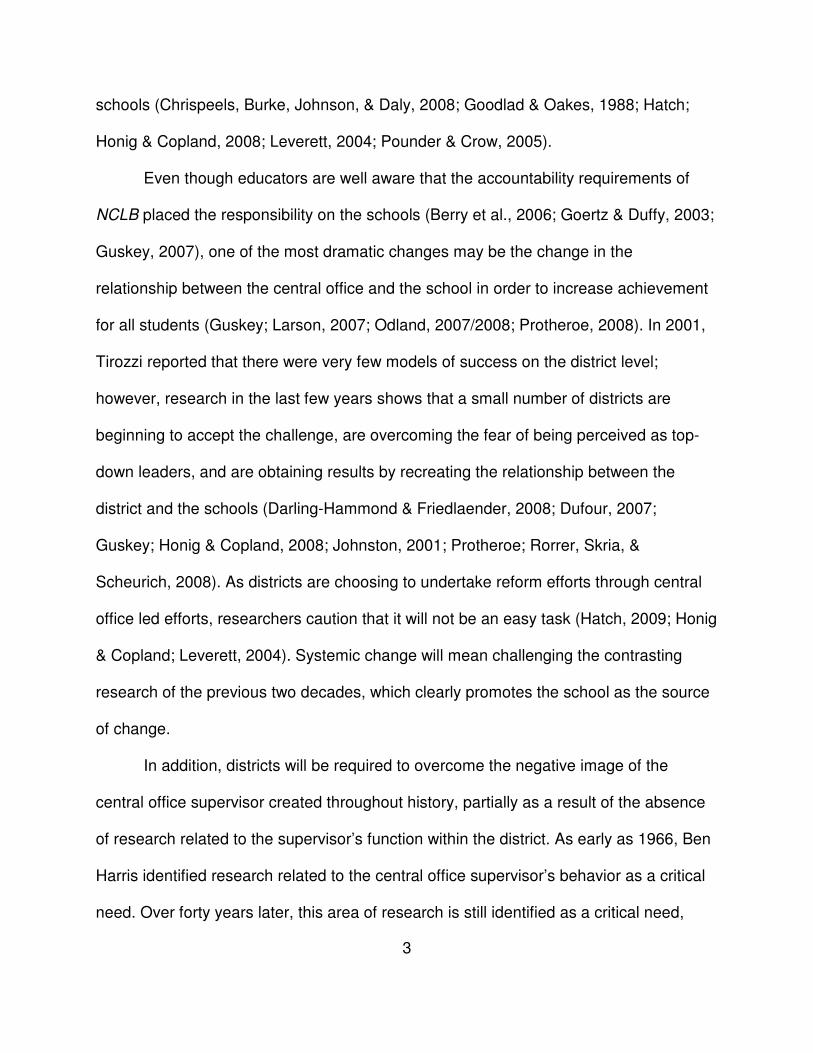
schools (Chrispeels, Burke, Johnson, & Daly, 2008; Goodlad & Oakes, 1988; Hatch;
Honig & Copland, 2008; Leverett, 2004; Pounder & Crow, 2005).
Even though educators are well aware that the accountability requirements of
NCLB placed the responsibility on the schools (Berry et al., 2006; Goertz & Duffy, 2003;
Guskey, 2007), one of the most dramatic changes may be the change in the
relationship between the central office and the school in order to increase achievement
for all students (Guskey; Larson, 2007; Odland, 2007/2008; Protheroe, 2008). In 2001,
Tirozzi reported that there were very few models of success on the district level;
however, research in the last few years shows that a small number of districts are
beginning to accept the challenge, are overcoming the fear of being perceived as top-
down leaders, and are obtaining results by recreating the relationship between the
district and the schools (Darling-Hammond & Friedlaender, 2008; Dufour, 2007;
Guskey; Honig & Copland, 2008; Johnston, 2001; Protheroe; Rorrer, Skria, &
Scheurich, 2008). As districts are choosing to undertake reform efforts through central
office led efforts, researchers caution that it will not be an easy task (Hatch, 2009; Honig
& Copland; Leverett, 2004). Systemic change will mean challenging the contrasting
research of the previous two decades, which clearly promotes the school as the source
of change.
In addition, districts will be required to overcome the negative image of the
central office supervisor created throughout history, partially as a result of the absence
of research related to the supervisor’s function within the district. As early as 1966, Ben
Harris identified research related to the central office supervisor’s behavior as a critical
need. Over forty years later, this area of research is still identified as a critical need,
4
which has resulted in supervision from the central office becoming basically overlooked
as a factor in contributing to the improvement of student achievement (Chrispeels et al.,
2008; Cunningham, 1963; Grove, 2002; Pajak, 1989; Rorrer et al., 2008; Tyack, 2002;
Wimpelberg, 1987). Finn (1991) captured the widely held belief of the central office in
the following statement: “The school is the vital delivery system, the state is the policy
setter (and chief paymaster), and nothing in between is very important” (Finn, p. 246).
William Bennett, former U. S. Secretary of Education, and other colleagues, reinforced
this belief when they used “the blob” to describe the educational hierarchy because of
the difficulty in implementing organizational change that impacts student learning
(Bennett, Finn & Cribb, 1999, pp. 628-634). This notion reinforced the role of the central
office supervisor that emerged throughout history as one that is strongly identified with a
bureaucratic, ineffective, top-down approach. With extremely limited research to dispute
that accusation, the role of the central office supervisor may be the least understood
and most ill-defined position in the educational hierarchy (Glanz, 1977; Harris &
Chrispeels, 2006; Harris, 1998; Honig & Copland, 2008; MacIver & Farley-Ripple, 2008;
Pajak, 1989).
Pajak (1989) described the central office supervisor as the invisible role (pp. 179-
180). Central office supervisors have been expected to remain behind the scenes,
silently supporting the instructional efforts of teachers and principals. While supervisors
have expressed that the invisible role was necessary for moving the organization
forward, the consequence has been that supervisors have been dismissed by school-
based educators and the public as one of the critical elements for increased student

5
achievement (Glanz, 1977; Honig & Copland, 2008; MacIver & Farley-Ripple, 2008;
Pajak, 1989).
District leaders can easily discover that the negative picture of the central office
painted throughout history still exists in the minds of educators and the public. One
example can be seen when Leverett (2004) implied that principals and teachers on the
frontline managed to survive the changes by paying very little attention to the central
office. In addition, recent evidence of the public’s failure to recognize the important role
of the central office in the success of the school is seen in public response to budget
cuts imposed by the current economic situation. While stakeholders support funding for
education, they readily offer deep cuts in central office positions in lieu of school-based
positions, programs, and supplies (Ramquist, 2009; Reader reactions to state budget
cuts, 2009; UFT press release-reaction to budget cuts, 2009). Currently, research
related to the role of the central office is still in its infancy and very little is known about
the role of the central office in district improvement (Fullan, 1991; Harris & Chrispeels,
2006; Honig & Copland, 2008; MacIver & Farley-Ripple, 2008; Pajak et al., 1998). If the
emerging research is correct and school improvement cannot occur or be sustained
without district involvement (Honig & Copland), there is a sense of urgency in identifying
district functions that contribute to improvements in academic achievement for all
students.
Purpose of the Study
This study adds to the limited research by exploring the functions of the central
office in improving achievement for all students. Utilizing a synthesis of current
research, seven thematic domains were identified as essential functions of the central
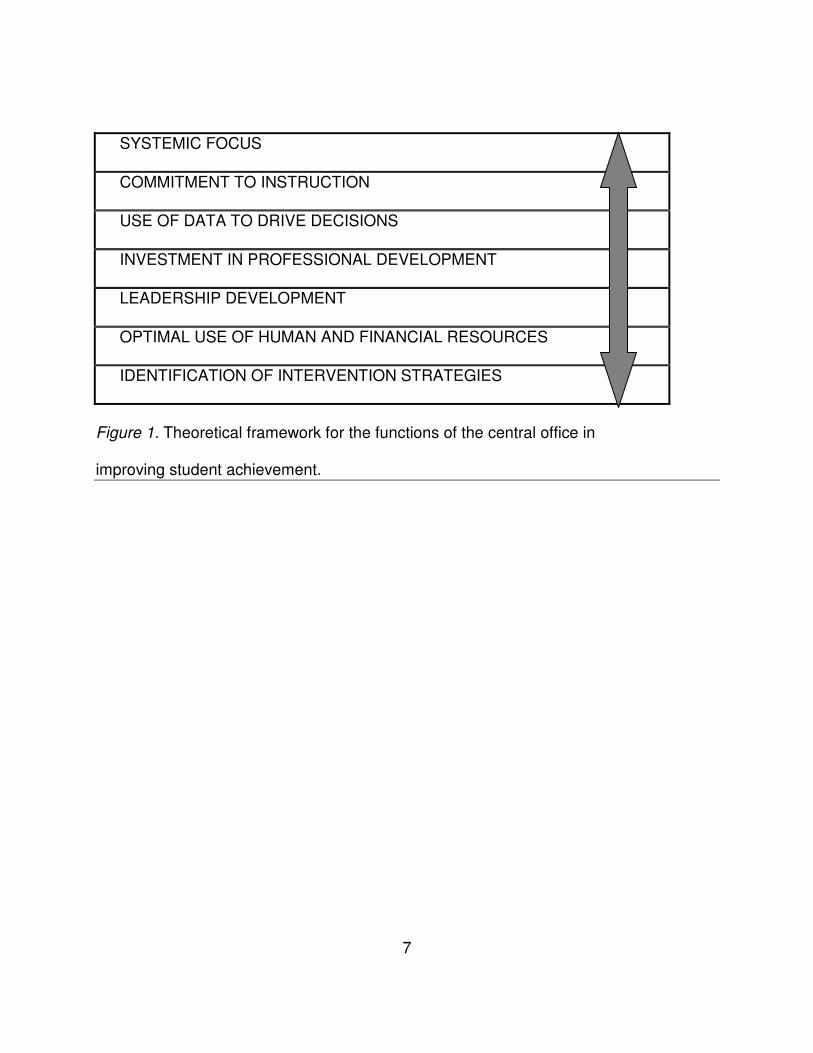
6
office in improving achievement for all students (see Figure 1: Theoretical framework for
the functions of the central office in improving student achievement). The purpose of
this study was to determine whether principals agreed or disagreed with the domains
identified within the research. This study also determined if there are relationships in
perceptions of principals in schools that met Adequate Yearly Progress (AYP) under No
Child Left Behind (NCLB) and schools that did not meet AYP under NCLB. This
information is critical in identifying how the central office can best serve the schools in
increasing achievement for all students.
Overview of Methodology
Information gathered utilizing current research, ideology, and practice was
synthesized to identify the role of central office in increasing student achievement. From
this synthesis, seven thematic domains were identified. These domains were used to
form a theoretical framework for the functions of the central office in effective district
reform. This framework can be found in chapter 2, Review of the Literature.
From this framework, a survey was developed (see Appendix C: Survey for
Principals). Utilizing the survey, principals were asked their perceptions of these district
functions in improving student achievement. The difference between the perceptions of
principals representing schools that met AYP and principals representing schools that
did not meet AYP was explored for the following thematic domains found within the
theoretical framework: systemic focus, commitment to instruction, use of data to drive
decisions, investment in professional development, leadership development, optimal
use of human and financial resources, and identification of intervention strategies.
7
SYSTEMIC FOCUS
COMMITMENT TO INSTRUCTION
USE OF DATA TO DRIVE DECISIONS
INVESTMENT IN PROFESSIONAL DEVELOPMENT
LEADERSHIP DEVELOPMENT
OPTIMAL USE OF HUMAN AND FINANCIAL RESOURCES
IDENTIFICATION OF INTERVENTION STRATEGIES
Figure 1. Theoretical framework for the functions of the central office in improving student achievement.
8
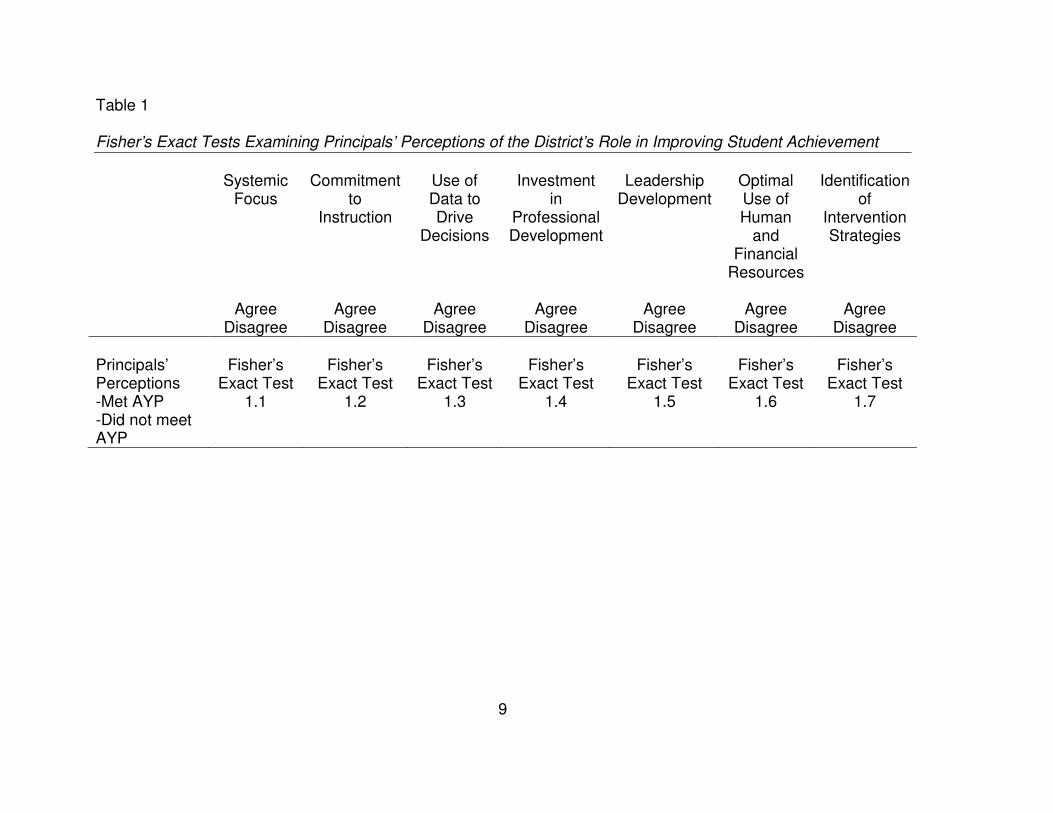
The total number of responses, related percentages, and frequency distributions
for responses to statements on the survey were calculated to determine which district
functions principals perceive as essential in increasing student achievement. A series of
seven Fisher’s Exact Tests were performed to determine if there is a relationship
between principals’ responses to the district’s role in increasing student achievement
and whether the school met AYP or did not meet AYP (see Table 1: Fisher’s Exact
Tests Examining Principals Perceptions of the District’s Role in Improving Student
Achievement). After surveys were returned, participants were invited to participate in a
focus group to further explore the level of consensus among responses on the survey
(Patton, 2002).
Setting
The study was conducted in a large urban district located in the Southeast. At the
end of the twentieth day at the opening of the 2009-2010 school year, the district served
139,599 students in grades kindergarten through twelfth grade, making the district the
18th largest school district in the nation. Eleven municipalities, as well as the
surrounding county, are within the attendance area. During the 2009-10 school year, the
district consisted of 159 schools. Included in the total number of schools are two
alternative middle schools, two non-traditional high schools, and two 9th grade centers
(Wake County Public Schools District Overview 2008-09, n.d.).
Adequate Yearly Progress (AYP) results. The most recent test results for the
district, the 2008-09 state mandated tests, were used to determine schools that met
Adequate Yearly Progress (AYP). Even though the district currently has 159 schools,
three of the schools opened during the 2009-2010 school year and were not included in
9
Table 1
Fisher’s Exact Tests Examining Principals’ Perceptions of the District’s Role in Improving Student Achievement
Systemic
Focus Commitment
to Instruction
Use of Data to Drive
Decisions
Investment in
Professional Development
Leadership Development
Optimal Use of Human
and Financial
Resources
Identification of
Intervention Strategies
Agree
Disagree Agree
Disagree Agree
Disagree Agree
Disagree Agree
Disagree Agree
Disagree Agree
Disagree Principals’ Perceptions -Met AYP -Did not meet AYP
Fisher’s Exact Test
1.1
Fisher’s Exact Test
1.2
Fisher’s Exact Test
1.3
Fisher’s Exact Test
1.4
Fisher’s Exact Test
1.5
Fisher’s Exact Test
1.6
Fisher’s Exact Test
1.7

the 2008-09 test results. Of the 156 schools, 98 schools or 62.8% made Adequate
Yearly Progress (AYP).
Organization of schools. The schools are divided into seven areas supervised by
area superintendents. Area superintendents report to a chief area superintendent, who
reports directly to the superintendent.
Organization of central office. The central office is divided into six major areas,
reporting to six chief officers: (1) Chief of Staff, (2) Chief Business Officer, (3) Chief
Communications Officer, (4) Chief Facilities and Operations Officer, (5) Chief Academic
Officer, and (6) Chief Area Superintendent (see Figure 4: Central Office Organizational
Chart).
Research Questions
The study addressed the following research questions:
1. Which district functions do principals believe are essential in improving
achievement for all students: systemic focus, commitment to instruction, use
of data to drive decisions, investment in professional development, leadership
development, optimal use of human and financial resources, and identification
of intervention strategies?
2. Is there a statistical relationship between the perceptions of principals of
schools that made AYP and principals of schools that did not make AYP?
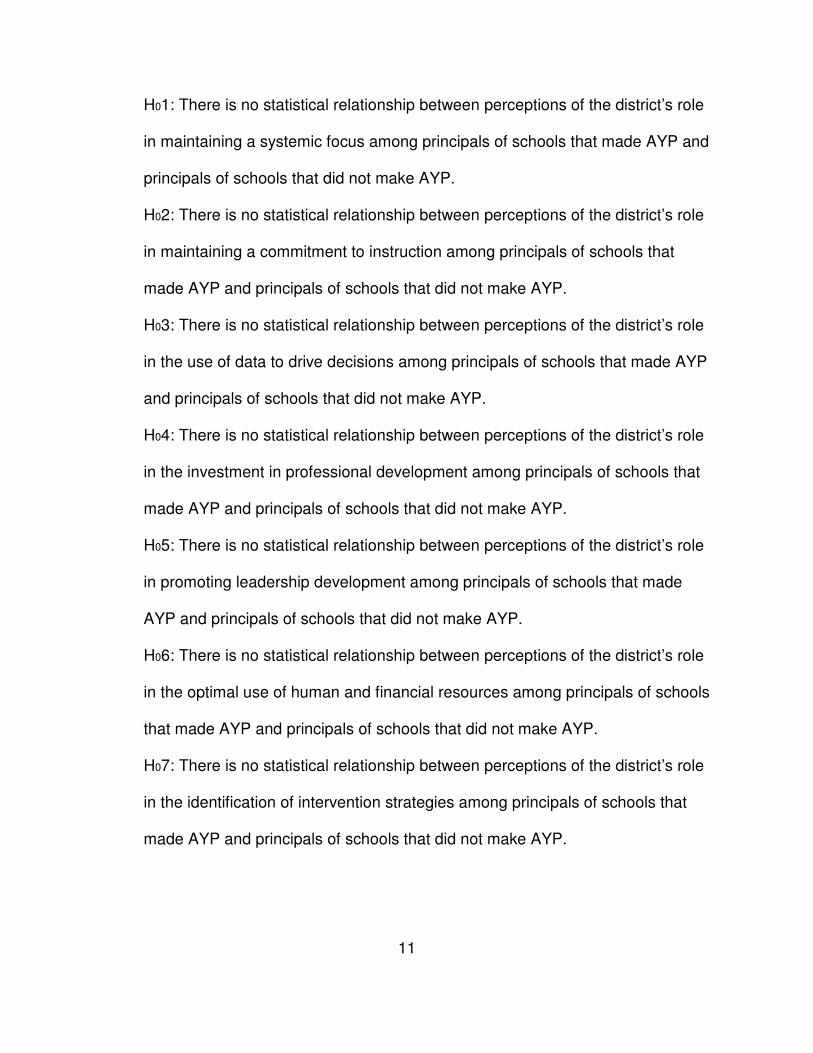
Null Hypotheses
The null hypotheses addressed principals’ perceptions regarding the district’s
role in increasing achievement for all students in each of the thematic domains within
the theoretical framework:
11
H01: There is no statistical relationship between perceptions of the district’s role
in maintaining a systemic focus among principals of schools that made AYP and
principals of schools that did not make AYP.
H02: There is no statistical relationship between perceptions of the district’s role
in maintaining a commitment to instruction among principals of schools that
made AYP and principals of schools that did not make AYP.
H03: There is no statistical relationship between perceptions of the district’s role
in the use of data to drive decisions among principals of schools that made AYP
and principals of schools that did not make AYP.
H04: There is no statistical relationship between perceptions of the district’s role
in the investment in professional development among principals of schools that
made AYP and principals of schools that did not make AYP.
H05: There is no statistical relationship between perceptions of the district’s role
in promoting leadership development among principals of schools that made
AYP and principals of schools that did not make AYP.
H06: There is no statistical relationship between perceptions of the district’s role
in the optimal use of human and financial resources among principals of schools
that made AYP and principals of schools that did not make AYP.
H07: There is no statistical relationship between perceptions of the district’s role
in the identification of intervention strategies among principals of schools that
made AYP and principals of schools that did not make AYP.
12
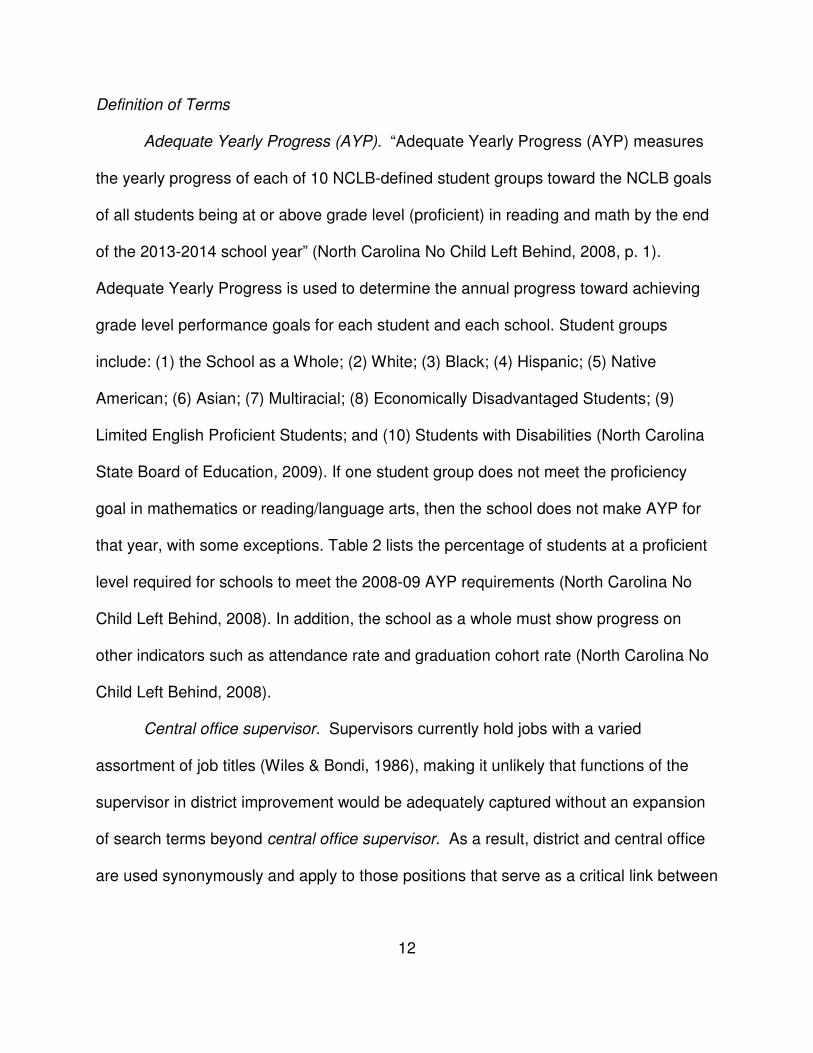
Definition of Terms
Adequate Yearly Progress (AYP). “Adequate Yearly Progress (AYP) measures
the yearly progress of each of 10 NCLB-defined student groups toward the NCLB goals
of all students being at or above grade level (proficient) in reading and math by the end
of the 2013-2014 school year” (North Carolina No Child Left Behind, 2008, p. 1).
Adequate Yearly Progress is used to determine the annual progress toward achieving
grade level performance goals for each student and each school. Student groups
include: (1) the School as a Whole; (2) White; (3) Black; (4) Hispanic; (5) Native
American; (6) Asian; (7) Multiracial; (8) Economically Disadvantaged Students; (9)
Limited English Proficient Students; and (10) Students with Disabilities (North Carolina
State Board of Education, 2009). If one student group does not meet the proficiency
goal in mathematics or reading/language arts, then the school does not make AYP for
that year, with some exceptions. Table 2 lists the percentage of students at a proficient
level required for schools to meet the 2008-09 AYP requirements (North Carolina No
Child Left Behind, 2008). In addition, the school as a whole must show progress on
other indicators such as attendance rate and graduation cohort rate (North Carolina No
Child Left Behind, 2008).
Central office supervisor. Supervisors currently hold jobs with a varied
assortment of job titles (Wiles & Bondi, 1986), making it unlikely that functions of the
supervisor in district improvement would be adequately captured without an expansion
of search terms beyond central office supervisor. As a result, district and central office
are used synonymously and apply to those positions that serve as a critical link between

Table 2 North Carolina 2008-2009 Proficiency Target Goals
Grades 3-8 (%) Grade 10 (%)
Year Reading Math Reading Math
2008-09 43.2 77.2 38.5 68.4

14
the district and the school in continuous improvement efforts (Land, 2002; McLaughlin,
1990).
End-of-Course tests (EOC). End-of-Course Tests (EOC) are aligned to the North
Carolina Standard Course of Study and are used to calculate levels of proficiency for
the individual student and groups of students in a particular school or school systems at
the secondary level. These tests are also used to calculate state accountability in
meeting Adequate Yearly Progress (AYP) (see a definition of Adequate Yearly Progress
above) (Understanding the North Carolina End-of-Course Tests, 2007). End-of-Course
tests given in the 2008-09 school year were Algebra I, Algebra II, Biology, Chemistry,
Civics and Economics, English I, Geometry, Physical Science, Physics, and U.S.
History (North Carolina School Report Cards, 2009). The End-of-Course tests are
taken by students within the final five days of courses on a block schedule and within
the final ten days of courses on a traditional schedule (Understanding the North
Carolina End-of-Course Tests).
End-of-Grade tests (EOG). End-of-Grade (EOG) Tests are curriculum-based
multiple-choice achievement tests at grades 3–8 (North Carolina End-of-Grade Tests,
2007). During the 2008-09 school year, students were tested in the areas of reading
and mathematics (North Carolina School Report Cards, 2009). These tests are aligned
to the North Carolina Standard Course of Study and are used to calculate student
growth and levels of proficiency for the individual student and groups of students in a
particular school or school system. These tests are also used to calculate state
accountability in meeting Adequate Yearly Progress (AYP) (see a definition of Adequate

15
Yearly Progress above). The End-of-Grade tests are given during the last three weeks
of a school year (North Carolina End-of-Grade Tests).
No Child Left Behind Act of 2001 (NCLB). According to the North Carolina
Department of Public Instruction, the No Child Left Behind (NCLB) Act of 2001
emphasizes:
standards for teachers and new consequences for Title I schools that do not
meet student achievement standards for two or more consecutive years. The
law's major goal is for every school to be proficient in reading/language arts and
mathematics by 2013-14 as measured by state tests (North Carolina No Child
Left Behind, n. d.).
Student achievement. Throughout this study, student achievement was
referenced. For the purpose of this study, student achievement is defined by results on
End-of-Grade (EOG) tests for elementary and middle schools and results on End-of-
Course (EOC) tests for high schools, which are the major tests used for determining
Adequate Yearly Progress (AYP).
Thematic domain. Utilizing the current research, functions of the central office
essential in increasing student achievement were identified. These functions were
organized by themes. Seven thematic domains were identified, which served as the
theoretical framework for this study.
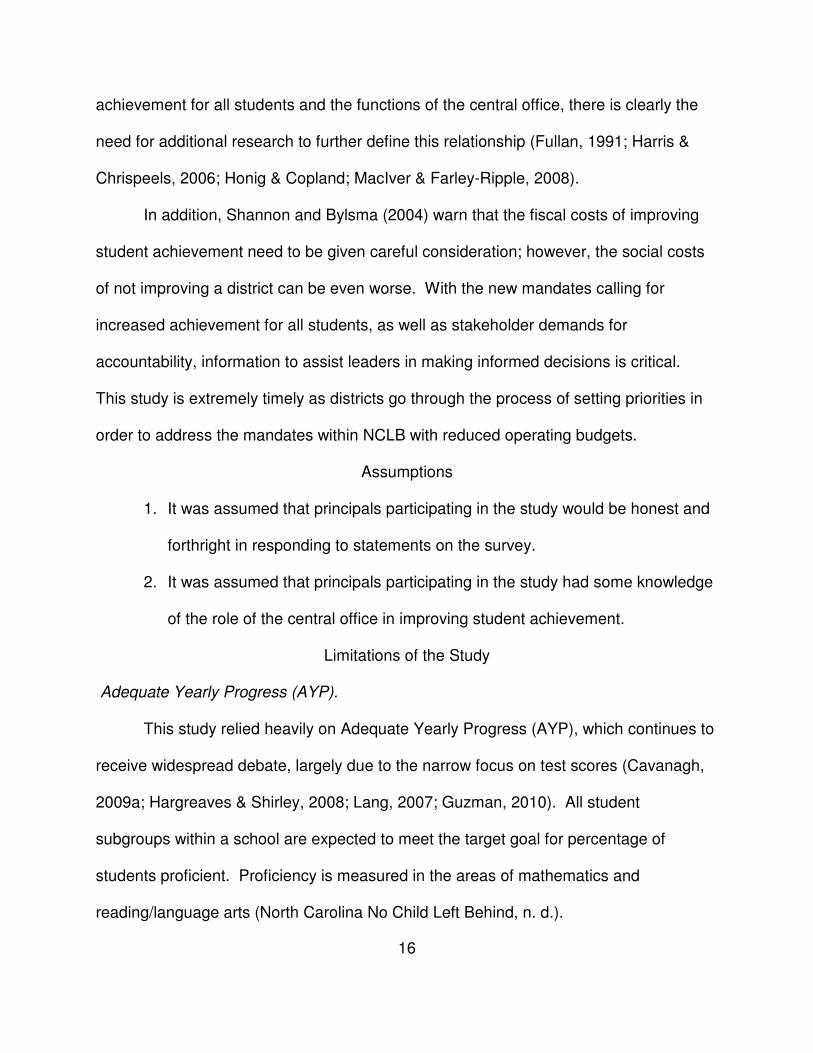
Significance of Study
District reform has outpaced the research that defines the relationship between
the school and the central office in increasing achievement for all students (Honig &
Copland, 2008). While a review of the research in chapter 2 connects increased
16
achievement for all students and the functions of the central office, there is clearly the
need for additional research to further define this relationship (Fullan, 1991; Harris &
Chrispeels, 2006; Honig & Copland; MacIver & Farley-Ripple, 2008).
In addition, Shannon and Bylsma (2004) warn that the fiscal costs of improving
student achievement need to be given careful consideration; however, the social costs
of not improving a district can be even worse. With the new mandates calling for
increased achievement for all students, as well as stakeholder demands for
accountability, information to assist leaders in making informed decisions is critical.
This study is extremely timely as districts go through the process of setting priorities in
order to address the mandates within NCLB with reduced operating budgets.
Assumptions
1. It was assumed that principals participating in the study would be honest and
forthright in responding to statements on the survey.
2. It was assumed that principals participating in the study had some knowledge
of the role of the central office in improving student achievement.
Limitations of the Study
Adequate Yearly Progress (AYP).
This study relied heavily on Adequate Yearly Progress (AYP), which continues to
receive widespread debate, largely due to the narrow focus on test scores (Cavanagh,
2009a; Hargreaves & Shirley, 2008; Lang, 2007; Guzman, 2010). All student
subgroups within a school are expected to meet the target goal for percentage of
students proficient. Proficiency is measured in the areas of mathematics and
reading/language arts (North Carolina No Child Left Behind, n. d.).
17
Working Conditions
Other factors within the district and the schools that typically influence working
conditions such as time, atmosphere, school leadership, district leadership, facilities,
resources, and teacher involvement (North Carolina State Board of Education, 2009)
were not taken into account for this study.
Selection Criteria for Participation in Focus Group
Convenience sampling was the method utilized for selecting participants in the
focus group.
Selection Criteria for Participation in the Survey
Participant selection criteria did not include distinguishing factors such as
experience in teaching, longevity in their current position, previous administrative
positions held in the North Carolina Public School System or any other state. Adequate
Yearly Progress (AYP) was taken from the 2008-09 school year, which at the time of the
study was the latest available data. The participants for this study were based on 2009-
2010 assignments.
Testing Data
The only student achievement data used for this study were North Carolina End-
of-Grade (EOG) tests and End-of-Course (EOC) tests, used to measure Adequate
Yearly Progress (AYP). Other testing data such as Effectiveness Indexes, EVAAS and
the State Growth Model were not used for selecting participants.
Relevance to Other Districts
The study was limited to one large, urban district. Since the narrative summative
was an analysis from multiple studies, it is hoped that the findings will provide insights
18
for other districts. However, each school district has unique characteristics and serves
as a reflection of the community it represents, which should be considered.
Research Organization
Chapter 1 is an introduction including a statement of the problem, the purpose, an
overview of the methodology, and significance of the study. Chapter 2 discusses the
theoretical framework used in the study and the history of supervision, including the
models of supervision that emerged: (1) supervision as inspection, (2) supervision as
social efficiency, (3) democratic supervision, (4) scientific supervision, (5) supervision as
an agent of change, (6) clinical supervision, and (7) supervision as leadership. In
addition, chapter 2 includes current influences and challenges as well as a narrative
synthesis of the emerging research related to the supervisor’s role in district
improvement. The synthesis of the current research forms the theoretical framework for
the study and serves as the foundation for the survey used within the study. Chapter 3
discusses the methodology used within this study. Chapter 4 contains an analysis of
the data, and chapter 5 presents summary statements and recommendations for future
studies.
CHAPTER 2: REVIEW OF THE LITERATURE
The purpose of this chapter is to review and synthesize the literature and
research related to the support provided by central services for the schools in improving
student achievement. A history of central office supervision is presented first. Current
influences on education are presented next. Finally, a synthesis of research on the role
of the central office services is included. The emerging themes were used to develop
the theoretical framework for the study. Sources utilized in this review were identified
using the search terms: central office, restructuring, district reform, student
achievement, school district, school improvement, supervisor, change, support,
systemic, superintendents, and principals. Two major data bases, Education Research
Complete and ERIC via EBSCO Host, were accessed. In addition, an ancestry
approach was used in which possible sources for inclusion were identified through
reference lists (Rorrer et al., 2008). Current research was incorporated throughout the
study.
Theoretical Framework
An essential component of this study was a synthesis of the research used to
identify thematic domains for a theoretical framework. Essential components from
multiple studies were extracted in order to identify a core of fundamental functions for
the central office considered critical in improving student achievement. Completing this
research required an expansion of search terms beyond central office supervisor.
Supervisors currently hold jobs with a varied assortment of job titles (Glatthorn, 1998;
Wiles & Bondi, 1986). A broad search was utilized to increase the probability that
functions of the supervisor would be adequately captured. The expansion of job titles
for central office supervisors is discussed in more detail in chapter 2 under the section
entitled, Supervision as Leadership. The research of Rorrer et al. (2008) supported this
action and noted that the research to date does not separate the supervisors’ roles but
uses district as a collective term to describe support for the schools from the system
level, including the superintendent.
The synthesis was limited to studies that addressed multiple criteria for district
involvement in school improvement since 2001. Even though NCLB was enacted in
2002, the date of the reauthorization of the Elementary Secondary Education Act
(ESEA) as the No Child Left Behind (NCLB) Act occurred in 2001, which was the date
selected for this search.
As recommended in a study utilizing a narrative synthesis by Rorrer et al. (2008),
mapping available evidence is consistent with this methodology and allows a process
for tracking sources. Thus, this search yielded fifty-four (N=54) sources, including 7
research briefs (N=7), 20 studies that were considered empirical research (N=20), 20
studies that were expert opinions (N=20), and 7 articles that were a general review of
the research (N=7) (see Appendix C: Sources of Thematic Domains for Central Office
Functions). From the synthesis, functions of the central office essential for improving
achievement for all students were identified. These functions were grouped into seven
thematic domains, which served as the theoretical framework for this study (see Figure
1, Theoretical framework for functions of the central office in improving student
achievement). These domains included; systemic focus, commitment to instruction, use
of data to drive decisions, investment in professional development, leadership
development, optimal use of human and financial resources, and identification of

21
intervention strategies. While the functions are presented separately, there is
considerable overlap, which is a reflection of the research (English, 2009; Fullan &
Levin, 2009; Snipes, Doolittle, & Herlihy, 2002). In the section, Emerging Research,
these seven functions are presented with additional explanations and detail.
History of Supervision
Sergiovianni (1982) stressed that to understand past failures, it is critical to
review the influencing factors from a historical perspective. Supervision has been
shaped by many factors unique to American education and reflective of social
movements and values of a particular era. As values have shifted, so have all facets of
education, including teaching and supervision (Alfonso, Firth, & Neville, 1975; Clark,
1975; Glanz, 1998; Karier, 1982). Even with these shifts, many practices have survived
from one era to the next, supporting the importance of having knowledge of the history
in understanding current practice and ideology (Sergiovianni, 1982).
It is no accident, for example, that schools throughout the states and territories of
the United States share a remarkable resemblance in organization and structure. The
requirements of accrediting agencies and state education departments for program and
licensing approval, for example, provide certain uniformity in thought and practice about
education in general and teaching and supervision in particular that overrides any
diversity assumed by the public commitment to state and local control. This uniformity
occurs in reaction to certain societal forces and expectations. Standards and practices
are ideologies that reflect the pressures dominant in our society. To understand fully
present practice in supervision, therefore, historical analysis is necessary (Sergiovianni,
1982, p. 1).
22
In this body of research, three sources were identified that provided tables in
which the changing models of supervision or administration were compared over a
specific timeframe. Wiles and Bondi (1986) provided a table which listed the periods in
which the different models of supervision were utilized, beginning with the nineteenth
century and ending in the 1980s. Alfonso et al. (1975) expanded this information in a
similar table, which included the history through the 1970s. In a table presented by
Alfonso et al., models from each era were identified, as well as the predominant practice
and supervisory personnel responsible for the practice. Pajak (1993) provided a table
depicting the concepts of educational leadership beginning in 1940 and ending in 1990.
This table listed the models, the years in which the models were utilized, the mission of
each model, the methods and the guiding principles.
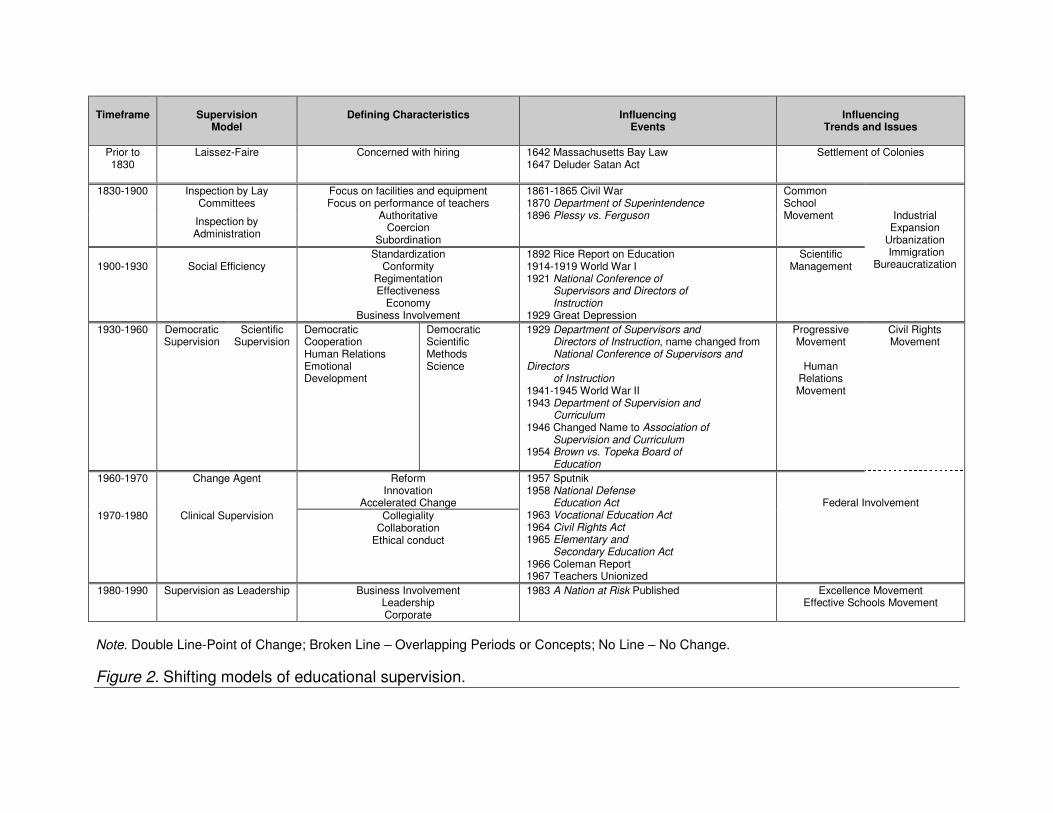
As a result of this body of research, a comparison table was also developed,
which expanded upon the work of these earlier studies, to assist in identifying changing
supervisory models throughout the history of education (see Figure 2: Shifting Models of
Educational Supervision). The intent of this table is to identify the supervisory models
from the 1800s through 1990, the defining characteristics, the influencing events and
the influencing trends. Not only does this information assist the reader in identifying the
shifting models, but it also documents the internal and external events that influenced
the outgrowth of each model.
Timeframe
Supervision
Model
Defining Characteristics
Influencing
Events
Influencing
Trends and Issues
Prior to 1830
Laissez-Faire
Concerned with hiring 1642 Massachusetts Bay Law 1647 Deluder Satan Act
Settlement of Colonies
1830-1900 Inspection by Lay Committees
Focus on facilities and equipment Focus on performance of teachers
Authoritative Coercion
Subordination
1861-1865 Civil War 1870 Department of Superintendence 1896 Plessy vs. Ferguson
Common School Movement
Industrial Expansion
Urbanization Immigration
Bureaucratization
Inspection by Administration
1900-1930
Social Efficiency
Standardization Conformity
Regimentation Effectiveness
Economy Business Involvement
1892 Rice Report on Education 1914-1919 World War I 1921 National Conference of Supervisors and Directors of Instruction 1929 Great Depression
Scientific Management
1930-1960 Democratic Supervision
Scientific Supervision
Democratic Cooperation Human Relations Emotional Development
Democratic Scientific Methods Science
1929 Department of Supervisors and Directors of Instruction, name changed from National Conference of Supervisors and Directors of Instruction 1941-1945 World War II 1943 Department of Supervision and Curriculum 1946 Changed Name to Association of Supervision and Curriculum 1954 Brown vs. Topeka Board of Education
Progressive Movement
Human
Relations Movement
Civil Rights Movement
1960-1970 Change Agent
Reform Innovation
Accelerated Change
1957 Sputnik 1958 National Defense Education Act 1963 Vocational Education Act 1964 Civil Rights Act 1965 Elementary and Secondary Education Act 1966 Coleman Report 1967 Teachers Unionized
Federal Involvement 1970-1980 Clinical Supervision
Collegiality
Collaboration Ethical conduct
1980-1990 Supervision as Leadership Business Involvement Leadership Corporate
1983 A Nation at Risk Published Excellence Movement Effective Schools Movement
Note. Double Line-Point of Change; Broken Line – Overlapping Periods or Concepts; No Line – No Change.
Figure 2. Shifting models of educational supervision.

24
Supervision as Inspection
The first reference to supervision was in the eighteenth century in Boston
(Alfonso et al., 1975). Prior to the eighteenth century, legislation such as the
Massachusetts Bay Law of 1642 and the Deluder Satan Act of 1647 signified the high
priority placed on education (Alfonso et al.). These laws established the first steps
toward compulsory attendance, holding parents accountable for the education of their
children. In historical accounts, tremendous emphasis was placed on the selection of
teachers with certain religious and moral qualities. Reference was made to local
leaders of the town visiting the school, but no reference was made to the inspecting of
teachers’ instructional methods (Barr, Burton, & Brueckner, 1947).
Between 1830 and 1850, the Common School Movement led by Horace Mann in
Massachusetts emerged as the first state educational system (Karier, 1982). The
purpose of the Common School was to ensure the teaching of common values of
society. This Movement, initiated by increased focus on nationalism, and as a result of
concerns over the economy resulting from immigration and industrialization, extended
state authority within the schools. Reformers encouraged a more bureaucratic
educational system in order to increase efficiency, standardize the curriculum, and
control teacher behavior (Karier). Increasingly, control of the school was vested in local
civic and religious leaders and committees of citizens with the authority to visit and
inspect schools (Alfonso et al., 1975; Barr et al., 1947; Karier; Lucio & McNeil, 1962).
By the end of the Civil War, America had greatly extended state authority in education.
The second half of the nineteenth century was characterized by industrial expansion,
economic growth, and bureaucratization. Every aspect of society was affected including
25
the schools (Alfonso et al.; Barr et al.; Karier; Lucio & McNeil). By the last quarter of the
nineteenth century, the schools had become more bureaucratic and the responsibility
for supervision was gradually shifted to board-appointed employees (Alfonso et al.;
Glanz, 1998).
It is important to note that the principal, not the superintendent, was the first
board-appointed employee to oversee the school (Alfonso et al., 1975). This position
became more frequently observed in the nineteenth century. A lead teacher, often
referred to as a master teacher, principal, or head teacher, was singled out and
assigned prescribed, managerial duties (Alfonso et al.; Campbell, Fleming, Newell, &
Bennion, 1987). Supervision responsibilities and duties consisted primarily of
maintenance of the building, school attendance records, coordinating use of equipment
and supplies, and providing lay committees with reports. Supervision required for
improving instruction was not a component of the early responsibilities (Alfonso et al.;
Anderson & Davies, 1956; Barr et al., 1947; Campbell et al., 1987). Even though the
principalship appeared before the superintendence, the position lagged behind the
superintendence in assumption of supervisory responsibilities, primarily because of the
teaching duties usually assigned to the principal. The principal reported directly to the
board of education prior to the superintendent’s position. From the onset of the
superintendent’s position, the principal was expected to obey the directives of the
superintendent. Supervisor responsibility to make decisions related to teacher
performance did not reside with the principal, but was solely the responsibility of lay
committees, followed by the superintendent (Glanz, 1991).

26
The first steps toward including a central office in the organizational structure of a
school system occurred during the nineteenth century with the practice of appointing
superintendents. Some of the first superintendents were appointed in accordance with
state legislation; others were selected by city/town councils (Campbell et al., 1987). By
1870, there were twenty-nine superintendents of schools serving as chief executive
officers according to the Seventh Yearbook for the National Society for the Scientific
Study of Education (Campbell et al.).
The first superintendents, initially referred to as school commissioners, usually
began their careers as teachers and were generally not highly educated or
professionally trained (Campbell et al., 1987; Tyack, 1974). The superintendent’s
position emerged mainly in an effort to relieve boards of education from administrative
duties, and in turn, produce a more efficient and productive system (Alfonso et al., 1975;
Campbell et al.; Tyack).
Boards of education met with many challenges in establishing the position.
Fearing the position might be viewed as having authority previously vested in the
boards of education, boards struggled in defining the role and often remained highly
involved in administrative work even after the position was established. Distinctions in
the governance role of the boards of education and the administrative functions of the
superintendent were not clearly defined. In addition, principals and teachers did not
support the establishment of the superintendent’s position for fear of losing privileges
they had previously enjoyed (Campbell et al., 1987). Evidence of these struggles was
seen in urban districts such as Philadelphia, Cleveland, Baltimore, and Detroit. These
boards of education created superintendent positions only to abolish the positions

27
several years later (Barr et al., 1947; Campbell et al.; Rogers, 1952). The growing size
and complexity of educational programs were reasons that the superintendent’s position
was increasingly seen in districts at the end of the nineteenth century and the beginning
of the twentieth century (Barr et al.; Rogers). Issues that boards of education now had
to consider included (a) university courses and certification required for school
administration, (b) high schools changed from selective to universal institutions, (c)
organizations such as the American Association of School Administrators emerged, (d)
research emphasized the need for a diversified curriculum to meet the needs of the
varying capacities of students, (e) schools had new responsibilities for health and
vocational education, and (f) technology continued to expand (Rogers).
Even after the need for the role was established, determining the method to meet
these new responsibilities caused increased tension between boards and educators. It
was not uncommon for boards of education to appoint two superintendents to a district,
one in charge of the educational programs and the other responsible for the financial
affairs of the district. This practice did not last long in favor of one superintendent as the
executive officer (Anderson & Davies, 1956; Tyack, 1974). The establishment of the
Department of Superintendence as a division within the National Educational
Association (NEA) in 1870 is evidence of the increased recognition of the position as a
profession (Crabtree, 1934).
Once the position was established, the superintendent quickly assumed the
responsibilities for supervision as defined by the lay committees and boards of
education. Supervisory responsibilities were initially viewed as oversight involving three
functions: inspection, direction, and improvement (Ayer & Barr, 1928, p. 347).
28
Inspection was clearly identified as the priority and can be seen in publications from the
era. G. T. Fletcher (1888), a member of the Massachusetts School Board, expressed
the general views of the public when he stated that supervision was increasingly critical
to the success of schools, thus making the superintendence a necessary factor in the
public schools. In describing the supervisory responsibilities, he stated, “School
inspection is now the most important element of school supervision” (Fletcher, p. 101).
An early perspective from a superintendent describing the expectations of inspections
can be seen in the writings of John Philbrick (1876):
An inspection is a visitation for the purpose of observation, of oversight, of
superintendence. Its aim is to discover to a greater or lesser extent the tone and
spirit of the school, the conduct and application of the pupils, the management
and methods of the teacher, and the fitness and conduction of the premises.
Good inspection commends excellences, gently indicates faults, defects and
errors, and suggests improvements as occasion requires. By the expectation of
visits of inspection, of the right sort, teachers are stimulated to fidelity, and to
efforts for advancement in efficiency (p. 3).
Gradually, the focus of inspections shifted from the facilities and equipment to the
monitoring of instructional methods and reforming incompetent teachers. This change
was prompted by the widely held belief that most teachers performed inadequately (Barr
et al., 1947). This shift was promoted by prominent educators such as William Torrey
Harris (1881), A.W. Edson (1893), Frank Fitzpatrick (1900), and James A. Greenwood
(1904). The belief that teachers needed reform can be seen in the writings of T.M.
Balliet (1893) when he stated the only way to reform a school was to “secure a
29
competent superintendent; second, to let him ‘reform’ all the teachers who are
incompetent and can be ‘reformed’; thirdly to bury the dead” (pp. 437-438).
Supervisors commanded excellence, but they rarely did more than suggest
improvements. Methods by supervisors to improve teaching practices usually involved
presenting the teacher with approved materials and strategies, and then expecting
teachers to produce coordinated and consistent instruction. Follow-up inspection of the
classrooms was the method used to obtain information concerning fidelity to the
application of the approved materials and strategies. As a result, teachers were often
still unprepared for the demands that were increasingly thrust upon them. In rare
situations in which suggestions for instructional improvement were made, this process
was indirect with no follow-up. Teachers deemed ineffective were handled through
punitive methods. When serious deficiencies in performance occurred, no attempts
were made to improve the teacher or the situation; instead the teacher was dismissed
(Barr et al., 1947; Bolin & Panaritis, 1992; Glanz, 1998).
While authors varied in their description of the interactions between supervisors
and teachers, some authors describe how coercion was used by the supervisor (Barr et
al., 1947; Bolin & Panaritis, 1992). Tyack (1974) explained how this early educational
system also required subordination. Since women were generally subordinate to men,
the employment of women as teachers thus augmented the authority of a largely male
administrative staff (Bolin & Panaritis; Tyack; Tyack & Hansot, 1981).
The evaluation of student learning was viewed as a method of determining
teacher effectiveness. Learning was seen as a mechanical process that could and
should be directed, consisting mainly of memorization of facts. To ensure that teachers

30
were teaching the approved curriculum and students were learning, it was not unusual
for supervisors to administer tests to students during inspections of the classroom (Barr
et al., 1947; Tyack, 1974). “The chief measure of evaluation was the amount of factual
recall demonstrated by the students in the prescribed areas of study” (Alfonso et al.,
1975, p. 21).
During the latter part of the nineteenth century, the curriculum in many districts
was extended to include special subjects beyond reading, writing, and mathematics
(Barr et al., 1947). The principal and teachers were often unprepared to provide
instruction in these new subjects. In order to fill this gap, districts would employ a
special teacher to travel from school to school to provide instruction. The special
teacher would often work from and more closely with the central office than the schools.
As the new subjects science, social studies, music, and art became recognized as
much a part of a child’s education as the previous offerings, classroom teachers were
expected to teach all subjects offered in the schools. As a result, the traveling specialist
transitioned to a role intended to support schools and teachers throughout the entire
district (Barr et al.).
The twentieth century began to usher in changes in the role of supervisors,
driven by changes in society. However, the concept of supervision as inspection was
well entrenched in the educational setting and continued to influence supervision. As a
new bureaucratic organization emerged, the influence of inspection could be seen in
and was compatible with the next model of supervision, social efficiency (Alfonso et al.,
1975; Glanz, 1998).
31
Supervision as Social Efficiency
Social efficiency as a supervisory model appeared between 1900 and 1920;
however, its presence was felt in educational supervision until the time of the Great
Depression (Campbell et al., 1987). The era was shaped by centralization led by
business and professional elites, often referred to as administrative progressives
(Tyack, 1974). Efficiency was viewed as the answer to central problems including
industrialization, urbanization, and immigration (Cremin, 1964). As a result,
regimentation, efficiency, and economy dominated society. As Thomas Cochran
(1972) observed, “On a fundamental level the goals and values of a business oriented
culture established the rules of the game; how men were expected to act, what they
strove for, and what qualities or achievements were rewarded” (p. 304).
The term scientific management, thought to be synonymous with efficiency,
became well known throughout every household during this era (Alfonso et al., 1975).
Scientific management permeated all aspects of business, industry, and education, and
was praised as a method to manage tasks effectively, efficiently, and objectively
(Alfonso et al.; Callahan, 1962). Even though Louis Brandeis coined the term, scientific
management, Frederick Winslow Taylor was credited for defining the principles (Fine,
1997, p. 289). Taylor described the most important element of scientific management in
the following statement:
Perhaps the most prominent single element in modern scientific management is
the task idea. The work of every workman is fully planned out by the
management at least one day in advance, and each man receives in most cases
complete written instruction, describing in detail the task which he is to

32
accomplish, as well as the means to be used in doing the work. And the work
planned in advance in this way constitutes a task which is to be solved, as
explained above, not by the workman alone, but in almost all cases by the joint
effort of the workman and the management. The task specifies not only what is
to be done but how it is to be done and the exact time allowed for doing it
(Taylor, 1911, p. 17).
Researchers such as Dr. Joseph Mayer Rice, pediatrician and educational
reformer, shocked the public in 1892 with a series of reports declaring American
education a disaster and ‘unscientific’ as compared with other countries (Berube, 1994).
As a result, great efforts were exerted to apply identical standards found in factories to
school districts, schools, and classrooms. Applying these standards to education was
seen as the answer to meet societal needs including the changing needs of industry
and an increasingly multicultural society. It was also seen as the answer for dealing
with teacher ineffectiveness, which was clearly on the minds of the public by this time
(Bolin & Panaritis, 1992; Callahan, 1962). Callahan labeled the educational
administrative bureaucracy of this era a “cult of efficiency” as a result of the influence of
scientific management.
Scientific management sparked the work of others during this era. An example
of a major effort to apply ‘scientific management’ to education was made by Frank
Bobbitt (1913). Within this research, it was clearly stated that the supervisory members
were responsible for defining the organizational goals. In education, the superintendent
was compared to the plant manager, who must be prepared to organize all forces in his
command, direct them, and supervise them in order to secure the desired product.

33
Students were referred to as the finished product. Teachers were seen as clearly
responsible for the outcome as seen in the following:
Setting up standards of ultimate attainment can be of but little service unless we
have at the same time the necessary scales and methods for measuring the educational
product so as to determine with at least reasonable accuracy whether the product rises
to standard. Ordinarily, the teacher, if asked whether his eighth-grade pupils could add
at the rate of 65 combinations per minute with an accuracy of 94%, could not answer
the question or he needs a measuring scale that will serve him in measuring his product
as well as the scale of feet and inches serve in measuring the product of the steel plant
(Bobbitt, 1913, p. 14). Several years later, Bobbitt compared the entire educational
system to a building process and described the need for standards at each grade level
based on the needs of the adult citizen. This research influenced the standardization of
the curriculum:
For meeting present-day conditions, our people need a large amount of reliable
information. The simple and logical thing to do is discover the information
needed, to lay it out in sequential form for the twelve grades of the public school,
and then simply to have it studied and mastered. The people need certain well-
known skills. The logical thing is to lay out a set of scientifically graded drill
exercises that will produce these skills (Bobbitt, 1934, p. 257).
This comparison by Bobbitt further contributed to assessments intended to measure the
teacher’s efficiency, emphasis on conformity, and adhesion to curriculum, which
became commonly used by educational supervisors (Barr, 1931). This practice was

34
believed to be much more effective than the arbitrary standards previously used (Bolin
& Panaritis, 1992).
Scientific management identified leadership methods and positions of authority
as well. Reformers of this era viewed the organization as one of good and truth, if only
information could be effectively passed from the experts to the workers. Tyack and
Hansot (1981) captured the role of the expert leader in the following statement:
The older millennial vision of the pioneers was subsumed under a new form of
consensus in which management and scientific experts acquired an awesome
power: an ability to define what was normal and desirable (p. 9).
Well-known scientists such as Edward L. Thorndike advocated for improvements by
giving the experts the authority to run businesses and education to everyone’s benefit
(Alfonso et al., 1975, Campbell et al., 1987; Stetson, 1903). Educational leaders such
as Ellwood P. Cubberly (1927) supported this idea by arguing that the organization of
schools was inefficient for meeting the needs of society and allowed less qualified
people to make critical decisions. “The process is one of subordination, centralization,
reorganization, and re-delegation, with a view to producing a unified series of public
schools better calculated to meet modern educational conditions and needs”
(Cubberley, p. 355).
The impact on education was that decision-making was shifted upward and
inward. Boards of education delegated more administrative powers to an expert
superintendent and his staff so they could reshape the schools. These new
responsibilities resolved any lingering doubts as to whether the superintendence was
needed (Anderson & Davies, 1956; Karier, 1982; Norton, 1952; Rogers, 1952).

35
District level administrators used their newfound powers to define the standards.
This information was passed to the specialists, increasingly referred to as supervisors,
who delivered the information as directed. Alfonso et al. (1975) compared this new role
to the factory foreman (p. 21). The major responsibility of the supervisor became one of
impacting student learning by controlling teacher behavior. In a similar manner,
principals and teachers exercised little judgment, prescribed methods were delivered as
precise plans to be followed rather than an outline intended to provide guidance
(Alfonso et al.; Bolin & Panaritis, 1992; McNeil, 1982). Barr et al. (1947) argued that
while the interaction between the supervisor and the teacher was limited, a great leap
forward was taken when compared to previous years. Researchers of a later era, such
as Bolin and Panaritis, observed that even with this increased support, teachers were
alone in the classroom and there was no guarantee of consistency in implementing the
course of study. Alfonso et al. summarized this era as one of leading teacher groups
and providing them with the findings.
As school governance and administrative responsibilities became more clearly
established, the proliferation of specialized administrative roles emerged. Specialists in
the fields of business administration, curriculum development and personnel
administration were some of the first positions to be added. In larger urban districts,
these positions quickly became even more specialized to include areas such as staff
personnel, school business, pupil personnel, data-processing services, federal
regulations, and negotiations-contract administration (Anderson & Davies, 1956;
Campbell et al., 1987; Lucio & McNeil, 1962).

36
Scientific management had supporters from many aspects of society, but not
everyone supported the concept. Educators were increasingly among those
challenging its effectiveness (Alfonso et al., 1975; Berube, 1994; Karier, 1982; Lovell &
Wiles, 1983; Lucio & McNeil, 1962). A study conducted by Barr and Reppen (1935) left
no doubt of teachers’ views of supervisors. Among the complaints, it noted that
teachers charged supervisors with planning poorly, needlessly distracting the class,
promoting fads and set techniques, engaging in purposeless change, and using ratings
to make “snap judgments.” When asked to evaluate superintendents, no marked
differences appeared. Barr and Reppen summarized by stating, “Some teachers are
very certain that they would be happier and some are convinced that their work would
be more efficient if all supervision were abolished” (p. 12). Glanz (1998) further
supported these studies when he noted a teacher’s perception of the supervisor as the
“snoopervisor” (p. 54).
Educators expressed their frustration with bureaucratic school governance and
“factory-type” education employed by supervisors (Glanz, 1998; Tumin, 1963). J.W.
Crabtree (1914), President of the State Normal Schools in Wisconsin, wrote:
…the school with all its machinery and equipment is not run for the purpose of
providing him a living wage, but for the deep seated purpose of promoting
intelligence, education, and love of work among young people (p. 148).
Criticism was also advanced by distinguished college professors. Boyd H. Bode (1935),
a professor at Ohio State University, advocated that the schools had a larger
responsibility to society and called for schools to assume leadership for social change
and end scientific management altogether:

37
“By transforming the school and the family in the spirit of this newer attitude we
shall discover increasingly the deeper meaning of democracy and shall give a
continuous reinterpretation to our traditional ideals of liberty and equality of
opportunity “(p. 3).
Even though the supervisor’s position took its place in the educational hierarchy
during this timeframe, the position between the superintendent and the teacher proved
to be a very vulnerable one. Supervisors had hoped that applying scientific
management to ratings in determining teacher efficiency would give acceptance to their
work, when in fact it had met with resounding failure (Glanz, 1991). H.O. Rugg (1920),
a professor at Lincoln School of Teachers College, expressed the widely held views
when he declared teacher ratings as anti-democratic, unprofessional and inadequate
measures of teachers’ efficiency. “Movement to rate teachers is at a standstill. The
movement cannot be said to have succeeded, however. The present writer believes it
needs a new impetus and a new emphasis” (Rugg, p. 674).
Some researchers attributed the call for a new supervisory model to the
recognition that techniques of business and industry would not work in an institution
whose primary function was the education of children (Callahan, 1962). Others merely
saw scientific management as no longer relevant to address what society viewed as the
purpose of education (Ravitch, 1983).
Democratic Supervision
Democratic supervision as a model for supervision emerged in the 1920s and
extended through the mid-1950s (Alfonso et al., 1975; Glanz, 1991, 1998). This
timeframe was greatly influenced by and linked to the Progressive Movement. Some

38
authors described this movement as the first and most powerful reform in the history of
education because of the significant impact on the structure of education (Berube &
Berube, 2007; Rederfer, 1985).
At the onset of this model, society was facing many complex issues sparked by a
number of national events. One such event occurred in 1917 when President Woodrow
Wilson asked Congress for a declaration of war on Germany, the beginning of American
involvement in World War I. Glanz (1998) described how Wilson incarnated the
progressive movement by calling for the country to “make the world safe for democracy”
(p. 54). During this era, democratic principles of governance made their way into all
areas of society and organizational governance including educational administration
and instructional supervision (Alfonso et al., 1975; Barr et al., 1947). Education became
a focus as the public increasingly recognized the school as an institution that could
influence human development as well as transfer sound democratic social order within
society (Barr et al.; Berube, 1994).
This new wave of reform addressed the relationship between teachers and
supervisors, but it also shifted the goals of education. The shift was away from
intellectual development and mastery of subject matter to concern for social and
emotional development and the adoption of “functional” objectives related to areas such
as vocation, health, and family life (Brueckner, 1947; Gross & Gross, 1975; Ravitch,
1983). This change also alleviated fears that instructional methods were not developing
the students’ full intellectual ability by expanding the focus on areas other than the core
academic subjects (Gross & Gross; Ravitch, 1983).
39
The most profound and comprehensive treatment of democracy in education can
be found in the work of John Dewey (Berube, 1994; Campbell et al., 1987; Glanz, 1998;
Ravitch, 1983). Dewey’s work provided a strong philosophical rationale that widely
appealed to educators following World War I. Dewey advocated for education to be
built upon individual differences and linked to practical objectives intended to prepare
the student for life. Moderating the role of authority in the classroom was considered
critical in assisting students to learn self-discipline as well as creative habits (Campbell
et al.). Dewey (1903) was convinced that the societal needs were not reflected in the
educational system. He challenged educators to implement structures that reflected
democratic principles of society:
…the school has lagged behind the general contemporary social movement;
and much that is unsatisfactory, much of the conflict and of defect, comes from
the discrepancy between the relatively undemocratic organization of the school,
as it affects the mind of both teacher and pupil, and the growth and extension of
the democratic principle in life beyond the school doors (Dewey, p. 193).
The research of this era focused on human factors, and as a result, most
educators came to regard democratic supervision and human relations as essentially
the same (Campbell et al., 1987). The focus also included factors that were thought to
be important determinants of the efficiency and effectiveness of the worker. The
Hawthorne Studies, carried out by Elton Mayo and others, equated to treating
employees well. These studies were thought to be the forerunner of the progressive
movement (Gillespie, 1991). Findings from these studies identified increased
productivity among employees when interaction increased. This research also identified

40
the quality and kind of interaction within the organization as impacting morale and
productivity (Campbell et al.; Carlson, 1996; Cook, 1967; Gillespie; Lovell & Wiles,
1983).
Additional research such as Gestalt psychology supported the shift to a more
democratic approach. Gestalt psychology emphasized how the whole individual must
be considered because of the impact on the situation (Alfonso et al., 1975; Parrish,
1928). Ogden (1928) applied Gestalt psychology to the organization as a whole and
discussed the need for a unification of the parts. This research is credited with bringing
new attention to the internal worlds of teachers and supervisors, feelings and
relationships as well as facts (Pajak & Seyfarth, 1983).
The research of Kurt Lewin and his associates built upon the idea that the social
climate of a work group influences productivity. This research was unique in that it went
outside the realm of industry, examining different educational settings for children
(Campbell et al., 1987). Lewin, Lippitt and White (1939) simulated three different
educational settings including a laissez-faire atmosphere, an autocratic atmosphere,
and a democratic atmosphere. The findings demonstrated that children in the
democratic setting were more productive, socially satisfied, and responded less
aggressively than children in the other two settings. It was also observed that the
children in the democratic setting demonstrated more independence, originality, and
productivity.
The public increasingly called for educational supervisors to avail themselves to
the techniques that emerged from these new scenarios of psychology and sociology
(Gross & Gross, 1975; Wiles, 1980). Democratic and human relations views were

41
attractive to administrators for a number of reasons. Bureaucratization and growth
brought about unprecedented problems related to span of control within large schools
and districts. Superintendents and other administrators now relied on the experience of
principals and teachers (Miller, 1942). In addition, administrators did not enjoy tenure
like teachers. Their professional success depended on their capacity to gain support for
the policies and programs that they administered (Swift, 1971). The changing
environments in the schools and need for improved public relations caused
administrators to view supervision in a different way (Campbell et al., 1987).
Educational supervisors also wanted to separate themselves from the inspectoral
supervision of the past and tried to alter the perception of their roles to a more
democratic function (Campbell et al., 1987; Glanz, 1998). As a result, the supervisor’s
roles became more supporting and sharing rather than directing (Campbell et al.; Glanz,
1991; Gross & Gross, 1975; Wiles, 1980). In many districts, the title of educational
supervisor was replaced by consultant, resource person, helping teacher, or coordinator
(Barr et al., 1947; Lovell & Wiles, 1983). It was not unusual for superintendents to
announce that the new role was to be utilized as a resource and had no authority within
the organization. In working with teachers, the supervisor no longer provided the
teacher with an exact plan to be followed but involved them in the development of the
plan. The chief effect upon supervision was the use of cooperative procedures in the
formulation of policies, plans and procedures, as well as the evaluation of the results
(Barr et al.). Consequentially, the responsibility for school improvement shifted from the
supervisor to the school (Lovell & Wiles). Evidence of the change can clearly be seen
42
in the writings of Bartky (1956), as he described the role of the supervisor during the
latter part of this era:
In reality the central office supervisor is not a supervisor at all but an educational
expert; she is an educator rather than an administrator. It is her task to present the
facts and her interpretation of them. It is the principal’s task to accept or reject that
interpretation…If he accepts it, he does so because she has made her presentation
convincingly... (pp. 231-232).
During this era, the supervisor continued to receive persistent criticism from
teachers. This criticism was attributed to a number of factors including the past role of
the supervisor as inspector, the lack of specialized training for supervisors, and the
nebulous distinction between supervision and administration (Glanz, 1991; Otto, 1946).
Lovell and Wiles (1983) stated that democratic supervision did not necessarily advance
the credibility of the position as supervisors had hoped. While this model worked in
some cases, in all too many it did not. Supervisors waited to be called to the school,
which often resulted in loss of contact. “When they were there, supervisors were often
more interested in being ‘democratic’ than in helping teachers identify and solve
problems” (Lovell & Wiles, 1983, p. 34). Alfonso et al. (1975) stated that waiting for
teachers to identify and move forward the issues was not the intent of a democratic
approach to supervision. In addition, the sharing of responsibilities was never meant to
set aside the supervisor’s position within the organization.
Bolin and Panaritis (1992) described how the committee who developed the
Seventh Yearbook of the Department of Supervisors and Directors of Instruction, later
known as the Association for Supervision and Curriculum Development, failed to reach

43
consensus on a satisfactory definition of supervision. As a result, textbooks such as the
one written by Barr et al. (1947), Supervision, became popular because they attempted
to define supervision. In this textbook, supervision was defined as “an expert technical
service primarily concerned with studying and improving the conditions that surround
learning and pupil growth” (p. 11). Other books such as George Kyte’s (1930), How to
Supervise, also became popular. Kyte defined supervision as “the maximum
development of the teacher into the most professionally efficient person she is capable
of becoming” (p. 45).
Supervisors still sought other methods to attain recognition for their work in the
schools and legitimize their role. In 1921 the National Conference of Supervisors and
Directors of Instruction was organized. By 1929, the organization changed its name to
the Department of Supervisors and Directors of Instruction and was a separate
department within the National Education Association. The organization maintained its
separate identity until 1943 when it merged with the Society of Curriculum Study to
become the department of Supervision and Curriculum Development of the NEA
(Alfonso et al., 1975; Glanz, 1991; Karier, 1982). While the organization had
respectable membership at the onset with nearly 1,600 members, by the mid-thirties it
had lost about 50% of its membership (Glanz, 1991). This change was an indication of
the continuing struggles that supervisors were experiencing.
Scientific Supervision
The endorsement of democracy as the impetus for supervision did not occur in
isolation. A different model, scientific supervision, began to emerge simultaneously
during the 1920s and 1930s but was utilized by many supporters as a form of
44
democratic supervision. While this model was built upon science, similar to scientific
management, the two models were very different. This model was characterized by
pre-war progressivism and was built upon democracy, as well as science and scientific
method (Ravitch, 1983).
Scientific supervision was thought to be compatible with democratic supervision
(Glanz, 1991), and thus, appealed to progressives and supporters of scientific
management. Progressives saw scientific supervision as a method to validate reforms
of the progressive movement using science (Ravitch, 1983). John Dewey, a supporter
of the progressive movement, was a strong advocate for cooperative problem-solving
and critical thinking. He promoted this model for solving educational problems in the
classroom and outside the classroom (Lovell & Wiles, 1983; Ravitch). Lucio and McNeil
(1962) stated that proponents of scientific management supported scientific supervision
partly as a protest against what they saw as confusion of goals that emerged from the
democratic movement. One example can be seen in Frank Bobbitt, most closely
associated with efficiency and influential in applying standardization to the curriculum.
Bobbitt encouraged supervisors to utilize scientific supervision as the Progressive
Movement emerged. This model was viewed as a method for ensuring the
establishment of standards in areas such as teacher preparation programs as well as
the selection of instructional methods (McNeil, 1982).
Barr (1931) believed that the era was the culmination of many years of research
that laid the foundation for scientific supervision:
It is not easy to mark the exact time and place of the beginnings of scientific
supervision, since these beginnings are inextricably interwoven with the scientific

45
study of education itself and with the larger movement of scientific study of
physical and biological phenomena (Barr, 1931, p. 1).
Barr (1931) attributed the release of the studies by Francis Galton, Hereditary Genius,
with setting scientific supervision in motion.
Paul Rankin (1934), Chairman of the Seventh Yearbook of the Department of
Supervisors and Directors of Instruction, provided further evidence of the acceptance of
scientific supervision. Rankin tagged scientific supervision as a method to make
educational advances possible. He identified guidelines required for scientific
supervision to occur, which included: (a) basis upon the facts, (b) quantitative
description of the facts, (c) suspended judgment, (d) concern for all relevant facts, (e)
sensitivity to the problem, (f) efforts to discover rather than to prove, (g) continuous
appraisal, and (h) the quest for ever more inclusive generalization (p. 4).
Scientific supervision was used to justify the use of wide-scale testing (McNeil,
1982). Testing was not limited to students, but standards for teacher performance were
also being established using national teacher examinations. Administrators such as
Jasper Palmer (1929) of the New York Public Schools and Harry Baker (1935) of the
Detroit Public Schools increasingly acknowledged standardized testing as a fair method
of measuring students. While there was an increase in testing, educators and
researchers urged the use of additional criteria in evaluating students and teachers. For
example, Palmer called for testing related to intelligence quotient (I. Q.) to be
accompanied by testing such as the educational quotient (E. Q.) and achievement
quotient (A. Q.). During this era, boards of education and administrators were
encouraged to use National Teacher Examinations in the selection of teachers (Collins,
46
1940; Wood, 1940), while some researchers felt the use of such examinations would
harm the profession (Rowland, 1940). Still others acknowledged that interesting
developments had occurred in the use of the National Teachers Examination, but also
cautioned against using this instrument as the only criteria for selecting teachers, which
can be seen in the following:
The need of better criteria against which to validate the various measures of
teaching efficiency continues important. More prediction studies are needed. In a
large measure the success of the whole program to secure better qualified
teachers rests upon our ability to designate reliably what constitutes teaching
efficiency (Barr, 1943, p. 221).
During this era, there were educators who were not completely convinced of the
compatibility of science and human relations. Even though A. S. Barr was identified as
a supporter of scientific supervision, there is evidence that he was not necessarily
convinced of the compatibility of scientific methods and democracy, which was
demonstrated in his writing. In 1931, Barr wrote a textbook entitled, An Introduction to
the Scientific Study of the Classroom. In this book, he asserted that current methods of
educational research were not adequate and supervision needed to find its own
methods of science. He felt that teaching needed to be broken down into the different
elements and studied individually (Barr, 1931). In 1933, A.S. Barr again expressed his
early concerns with applying scientific methods to democratic supervision. While he
agreed that science in education could help in understanding simple phenomena, he
argued that it was not always applicable to human relationships and should only be
accepted with experimental verification (Barr, 1933). It was ten years later that Barr

47
(1943) wrote another article in which he expressed his concerns with the lack of findings
produced by scientific methods.
As a result of concerns with scientific supervision, McNeil (1982) described how
scientific supervision experienced a change in the early 1940s. Initially, scientific
methods continued to be generated by the supervisor. As democratic supervision
became increasingly embraced by the public, proponents of scientific supervision
sought new ways to incorporate democratic methods. As a result, methods were no
longer developed by the supervisor in isolation and then passed to the teacher. The
focus of the research was centered on the instructional problems as identified by the
participating teacher. The teacher became an active participant and collaborator in the
process:
Supervisors were to help teachers apply scientific methods and attitudes only in
so far as those methods and attitudes were consistent with the social values of
the day. The formulating of hypotheses, the selecting of appropriate research
designs, and the statistical analysis found in the action research centered on
instructional problems of importance to the participating teacher (McNeil, p. 29).
Supervisors of the era were still in search of recognition of their position as
significant to the organization. Supervisors had hoped that scientific supervision would
elevate their status by validating their work among teachers and administrators. For
many supervisors this model was initially viewed as the ideal because it allowed the
supervisor to utilize efficient, cooperative, and scientific methods to improve instruction
(Glanz, 1991).

48
Attempts to distinguish themselves from administrators and autocratic methods
never came to pass. Even though scientific supervision was viewed as a method to
advance innovation, very few scientific findings of the period had validity. Researchers
and supervisors were criticized for their lack of quantitative methods and their failure to
conceptually address the problems (Hodgkinson, 1957). The failure to adequately
address the needs of students for earning a living was increasingly seen. At the 1956
National Convention for the American Association of School Administrators, William
Grede, Past President for the National Association for Manufacturers, blamed the
shortage of well-trained workers on the schools, and challenged educators to
adequately prepare students for work and life in a competitive economy (Grede, 1956).
Teachers and other educators continued to criticize supervisors for their anti-democratic
methods. Supervisors found themselves torn between their administrative obligation to
the superintendent and their obligation to teachers (Glanz, 1991). There was also little
evidence to suggest that scientific supervision ever really gained momentum in the
schools (Glanz, 1991; Ravitch, 1983). By the 1960s, the public began to raise the
question as to whether they wanted teachers spending more and more time engaged in
research, not necessarily aimed at any particular goal, or providing instruction in the
classroom. As a result, action research was re-delegated from the teacher and
supervisor to technical researchers (Hodgkinson).
Glanz (1998) describes how supervisors aligned with curriculum workers in an
attempt to gain recognition. In 1943, a merger took place and the new organization
became the Department of Supervision and Curriculum Development. Three years
later, the name was changed to the Association of Supervision and Curriculum
49
Development (Glanz, 1998; Perkins-Gough & Snyder, 2003). While supervisors had
been consciously trying to separate from administration, Pajak (1993) described how
the founding of ASCD actually brought administration and supervision closer:
“At the time of ASCD founding, supervision in education witnessed an
unprecedented convergence of educational theory, national policy, and social
science research. This alignment culminated in a consensus that democratic
educational leadership comprised the essence of supervisory practice” (p. 165).
Supervision as an Agent of Change
The 1960s and 1970s saw the rise of a new model of supervision fueled by
growing discontent traced to the late 1940s and early 1950s. Researchers and authors
described how the educational pendulum began to swing back toward a revival of
progressivism and called for less focus on the supervisor as a democratic leader and
more focus on the supervisor as an agent of change (Cremin, 1964; Helwig, 1968;
McCoy, 1961; Pajak, 1993; Ravitch, 1983). Policy discussions, spiced with words like
“creative self-expression” and “intrinsic motivation,” quickly yielded to discussions
around “accelerated change” and “innovation” (Cremin; McCoy; Pajak, 1993; Ravitch,
1983). The primary concerns of critics were the failure to recognize emerging issues
and continuing to utilize practices of the past, thus maintaining the status quo (Ravitch,
1983).
Kenneth Benne (1949) introduced the concept of supervision as a change agent
as a method to challenge the status quo. Benne believed that by acting as a change
agent, the supervisor could lead planned instructional change and keep the organization
moving forward. Even though the concept did not immediately receive recognition,

50
dissatisfaction continued to grow and was seen in the writings of J. Chester Swanson
(1956), Superintendent of Schools in Oklahoma City. In the Official Report from the
National Convention of School Administrators, he wrote, “There are too many persons
today for whom schools have done very little” (p. 30). This growing discontent, fueled
by national events, caused the public to demand that the federal government become
involved and initiate improvements in America’s schools. Citizens were now aware of
the influence of education in determining the future of society (Lovell & Wiles, 1983). As
a result, this era witnessed a significant rise in federal involvement in the public schools.
A major event that drew attention to education occurred on October 4, 1957.
When the Soviet Union launched the first successful manned space flight, Americans
were shocked. This event ended the debate over the quality of schools (Garrett, 2008;
Ravitch, 1983; Van Til, 1965). Critics of education, such as Admiral Hyman Rickover,
known as the father of the nuclear submarine, accused the schools of endangering
national security and called for a focus on science, technology, engineering and
mathematics (Ravitch, 1983). Increased federal involvement in the public schools was
supported by people of all political backgrounds. Even though President Eisenhower
had opposed general federal aid to schools on the grounds that it would lead to
increased federal control, reactions to Sputnik prompted Congress to pass the National
Defense Education Act of 1958 (Ravitch, 1983).
Education witnessed federal involvement as the result of Sputnik as well as other
societal issues such as the Civil Rights Movement between 1954 and 1968. Berube
(1994) identified this movement as the second major reform movement in the history of
education. The principle of “separate but equal” validated by the Supreme Court’s

51
decision in Plessy versus Ferguson in 1896 was overturned as it related to the field of
education on May 17, 1954, with Brown versus the Topeka Board of Education
(Williams, 1988, p. 34). This decision as well as subsequent court decisions and
congressional legislation bestowed basic human rights to a segment of the population
within the schools that had been previously denied.
The Coleman Report, released in 1966, supported the changes that were
beginning to occur (Ascik 1984; Ravitch, 1983). This report drew attention to the
performance gap between students from different income families. Family background,
more than the effects of schooling, was identified as the reason for the difference in
student performance. This report reinforced the need for Chapter I and Compensatory
Head Start Programs. In addition, this report encouraged the study of schools that had
been successful in increasing achievement of low socio-economic students. Ascik
further implied that this report led to a new line of study launched during the next
decade, now known as the Effective Schools Movement. Action research became a
means to shatter complacency rather than a means for the teacher and the supervisor
to work together (Hefferman & Bishop, 1965).
During this timeframe, supervision experienced a radical transformation,
characterized by great efforts to demonstrate educational change and innovation
(Alfonso et al., 1975; Pajak, 1993). Democratic methods, as the sole source of
leadership and supervision, lost momentum, and leadership and supervision were
viewed as functions of the position (Alfonso et al.; Helwig, 1968; Pajak, 1993; Toepfer
Jr., 1973). As a result, supervision as an agent of change was viewed as an opportunity
to revive and empower the supervisor who had often been ignored under the previous

52
method of democratic leadership (Klohr, 1965). Even though researchers and authors
of the timeframe urged supervisors to involve teachers in systemic change, the general
descriptions of the era suggested supervisors were challenged to become more
assertive in their work and became more concerned with changing the behavior of
teachers than involving them (Drummond, 1964; Hefferman & Bishop, 1965; Helwig,
1968; Pajak et al., 1998; Ravitch, 1983; Sand, 1965; Van Til, 1965). The purpose of the
supervisor changed overnight from concern for the needs of students and problems of
the teachers to responding to the needs of society (Cunningham, 1963; Neville, 1966;
Ogletree, 1972; Pajak et al., 1998; Sommerville, 1971). While researchers debated the
methods and functions of the supervisor, research also recognized the increased
complexity of the supervisor’s role (Babcock, 1965; Glanz, 1998; Klohr; Lucio & McNeil;
Sand; Van Til). Lucio and McNeil (1962) described the new role of the supervisor as
requiring ‘super vision’ (p. 46). Lucio and McNeil captured this idea in a description of
four functions identified as necessary for the supervisor: (a) forecasting consequences
of procedures and change, (b) balancing and assimilating relevant cultural resources,
(c) systematically ordering procedures for change, and (d) liberating human spirit in
cooperatively developing a new perspective (p. 46).
As supervisors responded to the call for change, programs and goals were
scrapped and new educational plans took their place. Curriculum changes dominated
education, and as a result, the role of the educational supervisor and the curriculum
developer became blurred (Wiles & Bondi, 1986). The instructional focus changed from
training students for adjusting to the problems of the day to developing the knowledge of
students to solve problems of today as well as the future (McCoy, 1961).

53
Proposals for change were thrust upon education from sources external to the
school districts (Lovell & Wiles, 1983). With new funds from foundations and the
government, school systems experimented with new “teacher-proof” curricula, new
staffing patterns, new technology, and new models of professional development for
teachers (Ravitch, 1983, p. 233). Examples of proposed changes were team teaching,
computer-assisted instruction, open classrooms, non-graded programs and a variety of
packaged materials (Lovell & Wiles; Ravitch, 1983).
Efforts by supervisors during the 1940s and 1950s to give teachers more power
were rescinded (Pajak, 1993). To add to the issues with which supervisors were
confronted, militancy among teacher unions emerged in 1967 and continued into the
next decade (Morris & Morris, 1976). Approximately one hundred strikes occurred
throughout the nation in 1976 over salaries and working conditions (Morris & Morris).
The National Education Association (NEA) had previously been an umbrella
organization for virtually all associations of professional educators prior to this time.
The major objectives of the National Education Association (NEA) were to raise
professional standards, promote public support, and increase the quality of public
education (Campbell et al., 1987). The only competitor the organization had was the
American Federation of Teachers (AFT). The platform of the AFT called for the right of
teachers to organize and affiliate with labor. The stunning victory of United Federation
of Teachers, a New York City affiliate of AFT, for exclusive representation rights of New
York teachers was a turning point for the NEA. By 1968, the NEA responded by
adopting the labor-orientation philosophy of AFT. By 1975, all departments whose
members were not teachers had become independent (Campbell et al.).
54
The supervisor during this era did not obtain the status that some authors had
predicted (Klohr, 1965), nor did innovations during the 1960s and 1970s obtain the
desired results that were needed (Lovell & Wiles, 1983). Numerous changes had
occurred in a short period of time leading to overextended curriculums and ambiguous
goals. The first indications that schools were not achieving the desired results were
declining achievement coupled with rising costs (Lovell & Wiles; Wiles & Bondi, 1986).
While the 1980s ushered in another view of leadership and supervision, it did not occur
without attempts from reformers to revive supervision in terms of behaviors and
relationships (Benne, 1949; Harris, 1985; Lovell & Wiles). One such notable model that
emerged was Clinical Supervision.
Clinical Supervision
Clinical Supervision appeared during the 1970s and continued through the
1980s. This model developed parallel to supervision as a change agent. Researchers
and authors had varying views of the importance of this model. Some historical
accounts of education identified clinical supervision as a separate model (Glanz, 1998).
Pajak (1993) placed Clinical Supervision under the previous model, supervision as an
agent of change, but also identified components of democratic supervision within the
model. Bolin and Panaritis (1992) identified Clinical Supervision as significant because
it was rooted in an educational process defined in behavioral terms. While it could be
argued that clinical supervision should be discussed under the subtitles, Democratic
Supervision or Supervision as an Agent of Change, it is being presented separately
here due to the attention it received throughout the literature (Bolin & Panaritis; Glanz,
55
1998; Glickman, 1990; Harris, 1985; Lovell & Wiles, 1983; Mosler & Purpel, 1972;
Pajak, 1993).
Clinical Supervision is most often credited to the work of Morris Cogan and his
colleagues. The model originated at Harvard University as a method to work with
student teachers (Mosler & Purpel, 1972); however, attempts were made to adapt the
model to other professions (Bolin & Pararitis, 1992). Several authors claim that this
model emerged in education as the result of dissatisfaction with the traditional
supervisory practices and models (Bolin & Pararitis; Glanz, 1998). As many new
demands were thrust upon supervisors during the 1970s and 1980s, Glanz (1998)
described how this model was developed to address the lack of focus and sound
conceptual base to guide practice in the field. Evidence of this notion can be seen in
the writing of Goldhammer (1969) when he stated that the model was “motivated,
primarily, by contemporary views of weaknesses that commonly exist in education
practice” (p. 1).
A continuation of the teacher’s professional growth was the central objective for
clinical supervision (Cogan, 1973). During this timeframe, most teachers were wary of
supervisory activities based on past experiences. Cogan argued that very few teachers
can improve without the continuing collaboration of the expert supervisors and
presented this model as a viable option for involving the teacher in change efforts
(Cogan). Through this model, Cogan coined the term “collegiality,” which was used to
refer to the relationship between the supervisor and those being supervised. Glickman
(1990) described clinical supervision as direct human assistance to teachers. Lovell
and Wiles (1983) described clinical supervision as:

56
…An effort by the instructional supervisory behavior system to interact directly
with a teacher or team of teachers to provide support, help, and service to those
teachers in order to improve their performance as they work with a particular
group of students (p. 168).
Clinical supervision placed emphasis on classroom observations, which Cogan
(1973) identified as the distinguishing characteristic. The model listed phases within an
improvement cycle, which Cogan felt should be monitored and adjusted according to
the relationship between the teacher and the supervisor (Garman, 1982). The
structured process was an attempt to move toward better control and greater expertise
among teachers. In this model, Cogan identified eight phases of clinical supervision
required to constitute a full cycle of supervision. These areas included (a) establishing
teacher-supervisor relations, (b) planning with the teacher, (c) planning the observation,
(d) observing instruction, (e) analyzing the teaching-learning processes, (f) planning the
strategy of the conference, (g) conferencing, and (h) renewed planning (pp. 10-11).
Lovell and Wiles (1983) deemed it was less restrictive and equally accurate to label the
phases of clinical supervision under three interdependent dimensions: (a) pre-
observation behavior, (b) observation behavior, and (c) post-observation behavior (p.
172). Even though this model gained general support from educators (Bolin & Panaritis,
1992; Glanz, 1991), the model failed to gain wide acceptance (Garman & Hazi, 1988;
Glanz, 1991; Pajak, 1993). Some authors attributed this lack of support to the narrow
focus on classroom events when society was calling for a change in curriculum (Pajak,
1993).

57
Supervision during this era remained inspectional at times (Glanz, 1998). The
positive impact on the preservation of democratic leadership at a time in which
supervisors were being encouraged to be less democratic was a major strength of
clinical supervision. The emergence of this model was evidence of the lingering impact
of democratic supervision as well as the ambiguity that still revolved around the role of
the supervisor.
Supervision as Leadership
The 1980s led a new decade of reform brought on by claims that educational
standards were mediocre at best and were not keeping pace with changes in society
and advances in technology. This criticism was reinforced by the 1983 release of A
Nation at Risk: The Imperative for Educational Reform published by the U.S.
Department of Education (Pajak & Seyfarth, 1983; Toppo, 2008). This publication, the
result of two years of work by a Blue Ribbon Commission, found poor student
achievement at every level of the educational system (Toppo). The report drew the
attention of all facets of society by declaring current educational standards as
insufficient to meet the needs of students. “…The educational foundations of our society
are presently being eroded by a rising tide of mediocrity that threatens our very future
as a Nation and a people” (U.S. Department of Education, 1983, p. 1). In addition, the
report implied that such mediocrity within the schools was jeopardizing the future
economy of the country (Cuban & Usdan, 2003; Toppo).
Our once unchallenged preeminence in commerce, industry, science, and
technological innovation is being overtaken by competitors throughout the world.
This report is concerned with only one of the many causes and dimensions of the

58
problem, but it is the one that under girds American prosperity, security, and
civility (U.S. Department of Education, p. 1).
School-based change received wide-spread recognition in a flurry of reform efforts
following the release of A Nation At Risk: The Imperative for Educational Reform. As a
result, the Excellence Movement emerged, characterized by increased standards for
students and teachers, as well as a revived involvement from the business community
(Hunt, 2008).
During the era, research in business elevated the role of the chief executive
officer (Ackoff, 1994; Bass, 1985; Pajak, 1993). As effective schools research emerged,
the focus in education shifted to the administrator, particularly the principal (Ascik, 1984;
Boston, 1982; Brookover, Beady, Flood, Schweiter, & Wisenbaker, 1979; De Bevoise,
1984; Edmonds, 1979; Frederiksen, 1975; Lezotte, Edmonds, & Ratner, 1974;
Mayeske, Okada, Beaton, Cohen, & Wisler, 1972; Olson, 1986). With leadership in
business and education at the core of research, a new alignment was encouraged
(Levine, 1986; Pajak, 1993). This alignment resulted in leadership models and theories
from business becoming widely applied to education.
Research during this timeframe focused on the relationship between the leader
and subordinates, and several different leadership models emerged. Douglas
McGregor’s (1960) Theory X and Theory Y argued that the leader’s style was largely
dependent on assumptions about the members of the organization. William Reddin’s
(1970) 3-D Theory of Leadership identified four basic styles of leadership including (a)
related, high on relationship and low on task, (b) integrated, high on relationship and
high on task, (c) dedicated, high on task and low on relationship, and (d) separated, low

59
on relationship and low on task (Reddin, pp. 12-13). Hershey and Blanchard’s (1977)
model, Situational Leadership, expanded upon this work and utilized the four basic
styles to demonstrate how each can be effective or ineffective depending on the
situation. Another popular model was Blake and Mouton’s (1975) Managerial Grid.
This model suggested two criterion that supervisors must consider, ‘concern for people’
and ‘concern for productivity.’
In addition, business and education began to focus heavily on four concepts
including vision, culture, reflection, and transformation (Pajak, 1993, p. 172). The first
study to identify vision as critical to leadership was conducted in a business
environment (Bennis & Nanus, 1985). Wiles and Bondi (1986) applied this concept to
education. In both business and education, the leader’s vision was stressed as critical
to the whole organization. The focus on the culture of an organization, described as
very similar in the business community and the educational community, called attention
to social influences that impact productivity (Pajak et al., 1998; Peters & Waterman,
1982; Senge, 1990). Reflective practitioner, first coined in business, described the
behaviors of the leader to critically review the current situation and determine future
direction (Schon, 1983). Transformational leadership was utilized to describe how
leaders assisted group members in pursuit of common goals focused on higher levels of
needs and values (Burns, 1978). Bass (1985) explained how this model was built on
Maslow’s Hierarchy of Needs, and the transformational leader moved followers from
their own self-interest to the good of the organization.
While the 1980s brought significant changes to the functions of the supervisor,
changes could also be observed in job titles and education hierarchies. Administrators
60
and supervisors tried to work with teachers, but barriers were increasingly evident such
as a result of the unionization of teachers (Wiles & Bondi, 1986). It was during this time
that many supervisors had jobs abolished due to demands of union negotiations. As a
result, many supervisors followed the line of administrators into managerial roles.
Beginning in the mid-1980s supervisors held jobs with an assortment of job titles
(Glatthorn, 1998; Wiles & Bondi) and were now considered a part of administrative
teams in most districts (Wiles & Bondi).
The Excellence Movement had promoted the involvement of administrators and
supervisors in more leadership activities; however, the movement was perceived as top-
down and as a reversion to a management model by most educators (Hunt, 2008). This
realignment of supervision with administration further reinforced the historical role of the
supervisor as one of control, when in reality it only demonstrated that the role had yet to
be defined (Deal, 1987). The Excellence Movement revived disillusion with public
education, which ushered in a major change driven by bottom-up decision-making
(Pajak, 1993).
Current Influences
Restructuring Movement
A new movement, the Restructuring Movement, emerged in the 1990s partly as a
reaction to the previous era. This movement is most recognized for two separate
initiatives, site-based management and a call for national standards (Hunt, 2008). The
movement was widely accepted as strategy based and change oriented, which was a
criticism of the previous era (Dufour & Eaker, 1998).

61
In 1989, President George H. W. Bush held a summit for governors across the
nation to address the need for national goals and standards. A recommendation for six
national goals, later developed and referred to as Goals 2000, emerged (Dufour &
Eaker, 1998, pp. 4-5). From these standards, the National Center on Education and the
Economy developed a system for a national exam, supporting a new level of
accountability (Dufour & Eaker). In 1994, Congress established the National Education
Standards and Improvement Council to review and approve standards at the national
and state levels. A second summit was held in 1996. In order to avoid the perception of
increased federal involvement in the schools, the responsibility for standards was
transferred to the state and responsibility for developing national standards was passed
to professional organizations and curriculum specialists (Dufour & Eaker).
The second prong of this movement related to restructuring within districts and
schools. This change called for the transfer of decision-making to the schools in
determining strategies for achieving the newly established national goals (Conti,
Ellsasser, & Griffin, 2000; Dufour & Eaker, 1998). This movement made its way from
business and highlighted the benefits of involving factory workers in changing their work
roles (Walker, 2004). Educators viewed this change as an effort to challenge the status
quo and move away from a traditional top-down, bureaucratic approach (Hunt, 2008).
Site-based management quickly gained momentum among educators and
researchers (Amundson, 1988; Arterbury, 1991; Bailey, 1992; Champlin, 1987; Conley,
1996; David, 1996; Finn, 1991; Hess, 1995; Murphy, 1989; Myers & Simpson, 1998;
Sergiovanni, 1992). Some researchers called for changes in leadership methods for
those in positions of authority, promoting a focus on human relations by administrators

62
and supervisors (Sergiovanni, 1992). Other researchers called for participatory
decision-making at the school level (David), while still others not only challenged the
traditional structure but also argued for moving the formula for governance to the school
as well (Finn; Myers & Simpson).
Many states responded by enacting laws requiring site-based management, such
as one seen in North Carolina (Site-based management and accountability program,
North Carolina General Statue 115C-105.20, Article 8B, 1996). Boards of education
also responded by adopting policies supporting decentralization and the flattening of the
organization (Hunt, 2008). Between 1986 and 1990 approximately one-third of all
districts across the nation had some form of site-based management (Ogawa & White,
1994). Today, many districts across the nation still are under the umbrella of board
policies related to site-based management, such as the policy enacted in September
1991 by Wake County Board of Education, Raleigh, North Carolina (Wake County
Board of Education, 1991). This policy recognizes the research that emerged during
the 1990’s and encourages the decentralization of decision-making as a method to
improve achievement for all students.
While site-based management called for a different role for the teacher, it also
called for different roles for central office staff (Arterbury, 1991). Rather than delivering
uniform policies and monitoring implementation, supervisors were expected to serve as
resources, and they were encouraged to promote differences among the schools.
Arterbury captured the change in the role of the supervisor, as well as the role strongly
embedded in the minds of educators and the public when he stated:

63
Many central office staff have been viewed as isolated from the campuses, as
experts or specialists in particular academic areas. In site-based decision
making, they will be become integrated into various campus activities. They may
provide training, coordinate district level human and materials resources for the
campus, support school autonomy, and share decision making (p. 3).
While some research cited site-based management as necessary for significant
curriculum and instructional changes (Conti et al., 2000; Finn, 1991; Mohrman &
Wholstetter, 1994; Purkey & Smith, 1985; Robertson, Wohlstettler, & Mohrman, 1995),
Hanson (1993) questioned whether site-based management supported accountability.
Other researchers agreed, and the method became increasingly challenged for the
failure to show gains in student achievement (Dufour & Eaker, 1998; Newmann &
Wehlage, 1995; Odden, 1995; Smylie, 1994). Odden stated that too often site-based
management caused a Christmas Tree Approach to problem-solving (p. 2). This claim
was made partly due to what Odden viewed as a lack of coherent focus or sense of
direction in which schools were randomly choosing programs to address the issues.
Other researchers described how site-based management increased teacher
involvement in peripheral issues but failed to increase the focus on instructional issues
(Dufour & Eaker; Newmann & Wehlage; Smylie).
While the Restructuring Movement is best known for site-based management
and national goals, schools of choice also began to emerge during this timeframe. By
1998, more than 20 states had adopted some form of parental choice (Duffy, 1998).
Researchers such as Chubb and Moe (1990) called for more choice while critics such
as Albert Shanker (1990) challenged the concept as a method for improving schools.

64
The major criticism of the restructuring movement has included the failure to yield
agreement on what changes should be adopted to increase student achievement as
well as actual improvements in student achievement (Duffy, 1998; Dufour & Eaker,
1998). While this research did acknowledge proponents on both sides of the issues
related to site-based management and schools of choice, Duffy further criticized the
restructuring movement for the failure to take a systemic approach. Even though the
remnants of the restructuring movement still exist within schools today, another
movement, the Standards Movement, emerged simultaneously to address student
achievement (Berry et al., 2006; Guskey, 2007; Larson, 2007; Odland, 2007/2008;
Protheroe, 2008).
Standards Movement
The Standards Movement, an attempt to refocus on the needs of all children,
was highlighted by No Child Left Behind (NCLB) Act of 2001 (Berry et al., 2006;
Guskey, 2007; Larson, 2007; Odland, 2007/2008; Protheroe, 2008). This movement,
strongly rooted in A Nation at Risk: The Imperative for Educational Reform (Toppo,
2008), further shifted the focus to the schools by redirecting attention from the teacher
to student achievement (Hunt, 2008; Sipple & Killeen, 2004). Hunt attributed the push
for standards to the actions of educators during the peak of the restructuring movement.
Even though researchers such as Goodlad and Oakes (1988) cautioned against the
failure to address the needs of all students, teachers and principals had given attention
to the school’s overall progress on standardized assessment data but failed to address
the performance of individual students. “In many instances, the averages masked the
comparatively poor performance of students in specific subgroups” (Hunt, p. 582). The

65
parameters for the No Child Left Behind Act of 2001 (2002) now required schools to
look at all subgroups of students with serious sanctions for failing to do so. While the
focus shifted, the necessity for shared decision-making was never erased and the
Restructuring Movement became intertwined with the Standards Movement (Baur &
Bogotch, 2006).
Some educators feared that Goals 2000 would be eliminated by NCLB. While it
became apparent that Goals 2000 would not be eliminated, school improvement did
narrow in scope to only address areas tested under NCLB. In addition, the focus turned
away from the central office with a laser-like focus on the schools. The expectation was
that principals would work with the teachers to address the performance of each child
(Hunt, 2008).
Challenges
At the onset of the Restructuring Movement, the focus shifted to the schools. A
decade later, the Standards Movement increased the focus even more on the schools.
As a result, research centered on schools led by dedicated principals and teachers,
described by Dwyer, Barnett, and Lee (1987) as the Great Hope (pp. 30-32). Fifteen
years later, Togneri and Anderson (2003a) described these successes as “isolated
islands of excellence” (p. 1). These pockets of success could rarely be replicated or
sustained (Copland, 2003; Cuban, 2008; Fullan, 2001; Good, 2008; Togneri &
Anderson, 2003a). Cuban (2008) further summarized flawed assumptions for seeking
answers in these individual schools:
And efforts to shift the responsibility for change from the shoulders of at-risk
children to the backs of school professionals have frequently exhausted those

66
professionals, have often been limited to small numbers of schools, and have
seldom spread throughout school systems (p. 77).
While Gerald Grant (2009) concurred with the difficulty often encountered in replicating
pockets of excellence, he also warned educators and researchers of the potential
negative impact on the parents and students: “…lighthouse schools could be found in
really every city, but they gave false hope to children trapped in collapsing urban
schools…” (p. 117).
Even though the weaknesses in the charismatic leadership theories are
recognized (Togneri & Anderson, 2003a; Yukl, 1999), research shows that the principal
is second only to the classroom teacher in influencing student achievement (Fullan,
2010a). However, principals must have specific skills as instructional leaders (Fullan,
2010a). The current reality is that many districts are having difficulty filling principal
vacancies (Maxwell, 2009; Sunderman, Orfield, & Kim, 2006; Viadero, 2009), and
current principals often do not have the skills to meet the new demands (Helsing,
Howell, Kegan, & Lahey, 2008). Recent data suggests that only half of beginning
principals are still in the positions five years later (Viadero). As the role has shifted
(Bossi, 2007), some educators increasingly view the principalship as more challenging
and less desirable than the job is worth (Lyons & Algozzine, 2006; Pounder & Crow,
2005; Tucker & Codding, 2002). Researchers also implied that while NCLB focused
heavily on teacher quality, silence on the role of principals resulted in failure to provide
principals with adequate support (Sunderman et al., 2006). Districts have been forced
to hire principals with little or no experience, and the result has been high turnover rates

67
and, even worse, too many schools not receiving the leadership they need in attaining
increased student achievement (Connelly & Tirozzi, 2008).
While some researchers hail site-based management as the answer for improved
schools (Arterbury, 1991; David, 1996; Finn, 1991), others claim this change has led to
low morale among teachers and staff (Myers & Goldstein, 1997). To compound the
problem, teachers are leaving the profession altogether or transferring from high needs
schools to more affluent schools as a result of the new accountability demands and the
problems faced in schools serving mainly economically disadvantaged and minority
students (Hanushek, Kain, & Rivkin, 2004; Loeb, Darling-Hammond, & Luczak, 2005;
Shakrani, 2008). Teacher attrition is costing billions at a time when districts are seeing
major decreases in budgets, and students with the greatest need are too often left with
the less knowledgeable and experienced teachers (Shakrani).
Despite the optimism once associated with the Restructuring Movement and the
Standards Movement (Dufour & Eaker, 1998), education has yet seen any significant
changes in teacher practices and student achievement (Bauer & Bogotch, 2006; Beck &
Murphy, 1998; Cuban, 2008; Dufour & Eaker, 1998; Elmore, 1995; Levey & Acker-
Hocevar, 1998; Murphy & Beck, 1995; Odden, 1995), leading some researchers to
declare that leaving schools on their own to resolve school improvement issues does
not work (Dufour, 2007). While site-based teams often admit struggling with issues that
have little impact on student achievement, NCLB is a constant reminder of the high
stakes for failing to increase student achievement (Bauer & Bogotch). Even though
site-based management has been linked to positive changes in satisfaction data among

68
teachers (Walker, 2004). Holloway (2000) reminded educators that satisfaction is not
the same as productivity.
While there will continue to be individual schools that can be successful on their
own, school districts clearly recognize that ensuring all students have comparable
educational experiences will require much more than relying on a one school at a time
approach (Darling-Hammond & Friedlaender, 2008; Dufour & Eaker, 1998; Leverett,
2004). The compelling evidence that administrators and school staffs cannot meet
these mandates in isolation combined with the reality that accountability is here to stay,
have prompted some districts to take a more active role (Corcoran, Fuhrman, &
Belcher, 2001; Darling-Hammond & Friedlaender; Dufour, 2007; Guskey, 2007; Honig &
Copland, 2008; Protheroe, 2008; Rorrer et al., 2008). The results have yielded positive
gains, which has prompted increased awareness of the critical role of the central office
in increasing the capacity of all schools (Leverett).
Emerging Research
While the district’s role in improving teaching and learning may have been
overlooked throughout the history of education (Chrispeels et al., 2008; Cunningham,
1963; Pajak, 1989; Pajak & Glickman, 1989; Rorrer et al., 2008; Wimpelberg, 1987),
Supovitz (2006) argues there is reason for optimism as the twenty-first century unfolds.
Research increasingly shows that gains in student achievement are possible when
schools and districts work together to implement change (Chrispeels et al.). Honig and
Copland (2008) describe how districts across the nation have begun to seek methods to
reinvent themselves as they respond to the mandate of increased achievement for all
students.

69
As districts are beginning to get results through district-led efforts that change the
relationship between the central office and the school (Fullan & Levin, 2009; Honig &
Copland, 2008), researchers and educators are now posing questions as to what the
relationship looks like (Harris & Chrispeels, 2006; MacIver & Farley-Ripple, 2008). A
review of the research clearly reveals distinct functions and roles of the central office
that are essential for improving achievement for all students. For this research, these
functions and roles were grouped under common themes. As a result, seven major
thematic functions defining the role of the central office in reforming districts emerged
(see Figure 3: Analysis of thematic domains within the theoretical framework). While
the functions are presented separately in this research for clarity, there is considerable
overlap, which is a reflection of the research. This result supports the notion that there
are no single-factor solutions and the central office in effective districts performs a
combination of different functions rather than any one function in isolation (English,
2009; Fullan & Levin, 2009; Snipes et al., 2002).
As with previous eras in supervision, defining characteristics also emerged.
Coherence and alignment were consistently mentioned as critical to the success of the
district (Bottoms & Fry, 2009; Chrispeels et al., 2008; English, 2009; Leverett, 2004;
Madda et al., 2007; McLaughlin & Talbert, 2003; Orr, Berg, Shore, & Meier, 2008;
Thornton, Shepperson, & Canavero, 2007). Michael Fullan (2009) summarized by
stating:
It (supervision) also requires coherence among all elements of the system,
including curriculum, instruction, assessment, and intervention practice. Each
element that affects school and classroom improvement must be integrated into
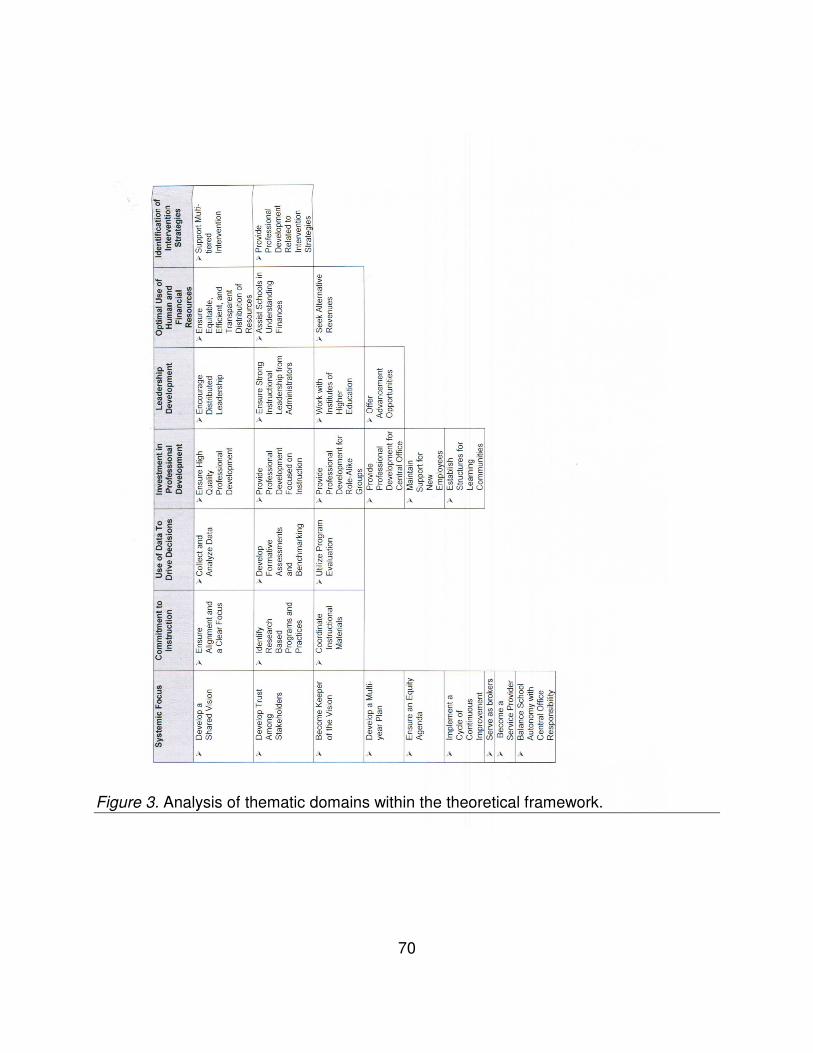
70
Figure 3. Analysis of thematic domains within the theoretical framework.
71
a seamless whole. The alignment and cohesion produces collective efficacy and
results across the entire district (p. 48).
The functions of the central office as identified from the research, combined with
defining characteristics, provide supporting evidence of the critical role of the central
office. Descriptions for each of the seven thematic domains are provided below,
including additional descriptions and details (see Figure 3).
Systemic Focus
The research cautioned that without a systemic focus, organizations run the risk
of individual interpretation and personal agendas, which increases the chance of any
reform failing to improve student learning (Leithwood, Louis, Anderson, & Wahlstrom,
2004; 7 actions that improve school district performance. Newsletter, 2006; Thornton et
al., 2007). This approach should include all schools and all parts of the district, from the
school board to business operations as well as external unions (Mclaughlin & Talbert,
2003). Leverett (2004) captured the intent of this function when he stated: “Silos of
independent, segmented decision-making that spin schools in many directions must be
replaced with integrated efforts across the central office to reduce opportunities for
messages that are incongruent with the system-wide instructional focus” (p. 4).
McLaughlin and Talbert (2003) provide an example from the East Bay Unified School
District where all central office administrators meet twice a week to discuss issues and
problems within the school (McLaughlin & Talbert, 2003).
Develop a shared vision. District reform cannot be random, thus improvement
efforts start with a vision (McBeath, 2006; 7 actions that improve school district
performance. Newsletter, 2006). In 1990, Senge defined vision as the “capacity to hold

72
a shared picture of the future we seek to create” (p. 9). Researchers and experts have
found that a shared vision around learning and teaching with a few well-defined goals
reflecting concrete actions made systemic alignment a reality by building consensus
and creating a sense of urgency from the boardroom to the classroom (Bottoms & Fry,
2009; Chrispeels et al., 2008; McBeath; McLaughlin & Talbert, 2003; Protheroe, 2008;
Snipes et al., 2002; 7 actions that improve school district performance. Newsletter). In a
case study of three districts conducted by Snipes et al., a shared vision among the
schools, the superintendent, the board, and community leaders contributed to
documented gains in student achievement and a narrowing of the achievement gap.
Leaders in all three districts reported that a shared vision set the stage by creating the
necessary conditions for change.
A shared vision has been seen as a departure from the culture usually found in
school districts. With a common vision, school-based staffs viewed the school in the
broader context of federal, state, and local mandates and specialized central office staff
gave up their own agendas and routines for district goals (McLaughlin & Talbert, 2003;
McNeal & Oxholm, 2009; Sharratt & Fullan, 2009; Snipes et al., 2002). The result of
creating a shared vision increased awareness of the issues and problems that existed,
often resulting in a new way of thinking, while a lack of vision clearly became evident in
results (Chafin, 2005).
Maintain communication with stakeholders. Districts that have made significant
gains in student achievement have developed a shared vision through open, routine,
and systematic communication with stakeholders. Communication first starts with the
73
courage to share results, followed by the willingness to seek solutions through
collaborative relationships (Togneri & Anderson, 2008; Waters & Marzano, 2006).
Develop trust among stakeholders. Researchers have also found that a systemic
focus and open communication created a new level of trust, commitment, and
ownership for district results from all stakeholders (Bottoms & Fry, 2009; Foley & Sigler,
2009; Fullan & Levin, 2009; Silverman, 2004). In a study completed by Chhuon, Gilkey,
Gonzalez, Daly, and Chrispeels (2006), trust was enhanced by greater transparency in
decision-making which included expanding conversations related to critical district
issues to individuals beyond the superintendent’s administrative team.
Become keeper of the vision. Assuming the role of “keeper of the vision”
became essential for the central office in reforming districts (MacIver & Farley-Ripple,
2008). The specific function for the central office included removing distractions and
competing programs that prevented staff from maintaining a clear focus (Appelbaum,
2002; Burch & Spillane, 2004; Corcoran et al., 2001; Honig & Copland, 2008). In a
study conducted by Corcoran et al., reluctance to remove previous practices and
ineffective programs was shown to impede the progress of the entire district. This
barrier was further referred to as: “…a focus on the goodness of the option rather than
on its effects” (p. 8). Through interviews conducted with principals and teachers, school
staffs acknowledged the importance of assistance from the central office in reducing
distractions and barriers. School staff also reported appreciation for the feedback from
the central office in identifying ineffective programs that diluted the vision and consumed
valuable resources.

74
Develop a multi-year plan. The central office should assist schools and the
community in making a commitment to a multi-year plan (Chrispeels et al., 2008;
Hannay, Manning, Earl, & Blair, 2006; Leverett, 2004; Murphy & Hallinger, 2001;
Togneri & Anderson, 2003a). Successful districts “recognized there are no quick fixes”
(Togneri & Anderson, 2003b, p. 13). A long-term plan became even more critical in
large, urban districts, particularly those districts with the highest concentration of poverty
(Boyd & Christman, 2003; Stover, 2008). Sharratt and Fullan (2009) applied this
concept to the San Diego Unified School District, which was one of the most closely
watched initiatives in the history of urban school reform. While this study identified
several possible components that emerged from this initiative, the findings also showed
that the San Diego strategy failed partly because the pace of change was too fast. The
leaders of the district did not allow enough time for building relationships and capacity
among teachers and principals. District reform has been shown to require from three to
six years in order to obtain desired results (Stover).
McNeal and Oxholm (2009) further supported this suggestion and linked a multi-
year commitment to the success of stretch goals. Stretch goals were defined by high
standards in which all employees and stakeholders understood it was no longer
“business as usual” (p. 65). Stretch goals required time for building consensus as well
as time for implementation. The central office played a significant role in leading the
charge; however, Stover (2008) also noted the important role of the Board. Not only
must the Board support the multi-year plan, but it must maintain stable leadership to the
extent possible.

75
Ensure an equity agenda. Researchers and experts identified an equity agenda
driven by the central office as critical to reforming districts. Districts that have made
progress have maintained a clear focus on providing all students with an excellent
education (Chrispeels et al., 2008; Copland, 2003; Downey, Steffy, Poston & English,
2009; Foley & Sigler, 2009; Harris & Chrispeels, 2006; Honig & Copland, 2008; Knapp,
Copland, & Talbert, 2003; McLaughlin & Talbert, 2003; Rorrer et al., 2008; Waters &
Marzano, 2006). Leithwood et al. (2004) referred to this component as leading for
social justice, ensuring a quality education for students who have been traditionally
underserved by districts and schools. The central office had a major responsibility for
assisting the district in owning past inequities and removing barriers that hindered a
focus on equity (Harris & Chrispeels).
Following a study conducted by Togneri and Anderson (2003a), findings revealed
the importance of acknowledging low achievement, particularly for poor and minority
children: “The courage to acknowledge negative information was critical to building the
will to change” (p. 5). McNeal and Oxholm (2009) later defined courage as “the
willingness to do the right thing even though it may be more popular or politically
expedient to do otherwise” (p. xii).
Implement a cycle of continuous improvement. In order to realize the vision and
goals, the central office must assist in identifying a district-wide cycle of continuous
improvement or a change model (Brown & Spangler, 2006; Copland, 2003; Foley &
Sigler, 2009; Guskey, 2007; Knapp et al., 2003; Murphy & Meyers, 2008; Thornton et
al., 2007). Murphy and Meyers referred to this process as the performance loop;
Copland referred to the process as the cycle of inquiry; Honig (2004) referred to the

76
process as organizational learning; and Knapp et al. referred to the process as systems
learning. The purpose of this process was to promote strategic planning within the
schools and the district, which allowed the districts to monitor progress and make
adjustments when critical variables changed or when strategies were not achieving the
desired results (Copland; McNeal & Oxholm).
Wake County Public School System, located in North Carolina, is an example of
a large urban district that has embraced the process of aligning strategic planning
throughout the district (D. Burns, personal communication, November 21, 2009). Five
years ago, the district undertook the process of identifying a strategic model of
continuous improvement for the schools which included aligning school improvement
plans with local, state, and national goals with a focus on the needs of the schools.
During the last year, the process has been expanded to the six divisions within central
services with the goal of aligning division plans with local, state, and national goals as
well as school plans. Once the division plans were completed, the process was passed
to departments within each division, and in turn, department plans followed.
Department plans were then translated to individual performance plans. The result has
been greater alignment, increased understanding of the relationship to student
achievement from all departments including finance and auxiliary services, and an
increased focus on student achievement at all levels of the organization (D. Burns,
personal communication, November 21, 2009).
Serve as brokers. The central office has the responsibility of cultivating the
exchange of information within and across the district, including working between the
top of the system and assisting in reform inside the schools (Appelbaum, 2002; Burch &
77
Spillane, 2004; Corcoran et al., 2001; Honig & Copland, 2008; Supovitz, 2008). Burch
and Spillane referred to this role of the central office as brokers. This role includes
increasing Board members’ understanding of policy needs as well as assisting
principals and teachers in acting on district reform policies (Supovitz, 2008). This
support is not limited to conveying information among internal stakeholders but is
extended to external stakeholders as well. For example, subject matter networks such
as the National Writing Project work with districts to increase the focus on literacy
(Lieberman & Wood, 2003). These organizations have played an important role in
improvement efforts; however, a major responsibility becomes monitoring, coordinating,
communicating with, and evaluating external service providers to ensure alignment with
district efforts (Appelbaum; Burch & Spillane; Corcoran et al., 2008; Honig, 2004; Honig
& Copland, 2008).
Become a service provider. In order to support a systemic focus, the central
office must provide a wide range of support. MacIver (2004) described this role as
service provider and Supovitz (2008) described the role as coherer of programs and
resources. This role included a broad range of support responsibilities ranging from
managing, coordinating, and integrating services, to providing expertise in the selection
of instructional programs and strategies (Supovitz, 2008). Supovitz (2008) listed
technology, alignment of textbook selections and drop-out prevention as just a few
examples. Muirhead, Tyler, and Hamilton (2001) included the example of a district-wide
security plan. Foley and Sigler (2009) included ensuring clean and well-maintained
facilities that allow for productive learning environments. While the role can be very
daunting, particularly with other managerial and political responsibilities, Supovitz

78
(2008) stated that this central office role was necessary for improving teaching and
learning.
Balance school autonomy with central office responsibility. Murphy and Hallinger
(2001) found that there was a substantial amount of central office direction in effective
districts. In addition, there was consistency between schools in the districts. Districts
had tight control where decisions were made and how outcomes were inspected.
Greater autonomy for the school was evident in the input and implementation stages of
the decision process.
While the research supports an instructional focus driven by the central office, an
appropriate infrastructure did not mean a lockstep teacher-proof curriculum (Foley &
Sigler, 2009; Thornton et al., 2007; Waters & Marzano, 2006). The central office was
responsible for establishing district-wide instructional goals and standards and
supporting the schools in meeting these standards, while school staffs had responsibility
for determining school specific learning and teaching goals (Foley & Sigler; McLaughlin
& Talbert, 2002). Effective school districts have found a balance between the schools’
autonomy and the central office’s responsibility, which usually meant empowering
schools to customize as needed within a district framework (Appelbaum, 2002; Bottoms
& Fry, 2009; Olson, 2007).
Commitment to Instruction
“Promising school improvement initiatives require district central offices to play
unprecedented, integral leadership roles in strengthening student learning district-wide”
(Honig & Copland, 2008, p. 3). Researchers and experts overwhelmingly identified a
system-wide infrastructure to support instruction as a key component in effective

79
districts (Chhuon et al., 2006; English, 2009; McLaughlin & Talbert, 2002; Protheroe,
2008). In a study of twelve effective districts, Murphy and Hallinger (2001) found that
student learning was the top priority. Excuses as to why high levels of student
achievement could not be attained were absent from the culture.
Ensure alignment and a clear focus. Effective districts developed an
infrastructure to support instruction, which aligned with state standards, district
standards, assessments, and student objectives (Applelbaum, 2002; Downey, 2001;
English, 2009). Shannon and Bylsma (2004) stated that districts improve with: “a
centralized and coordinated approach to curriculum, which is adopted district-wide” (p.
25). This alignment extended to each grade level and each course. English (2009)
refers to this process as alignment between the written, tested, and taught curriculum.
Alignment of the district, state, and federal standards was supported in a study by
Sawchuk (2008). Teachers were shown to base a majority of their instruction on state
standards, furthering the need for alignment.
Downey (2001) noted that most districts had far too many objectives to be taught
in the available time for the typical learner. Schools perform better with a clear focus;
however this is particularly true of low-performing schools. The central office in effective
districts designed a feasible number of objectives to be taught in the time allotted. This
guidance assisted teachers by developing a clear understanding of what should be
taught and what would be tested (7 actions that improve school district performance.
Newsletter, 2006), as well as assisting teachers in pacing their instruction so that
students would reasonably master most objectives (Brown & Spangler, 2006;
Chrispeels et al., 2008; Downey, 2001; Honig & Copland; 2008).
80
Identify research based programs and practices. Effective districts assisted
schools in identifying programs, strategies, and instructional practices supported by
research. This information helped schools understand what high quality instruction
looks like (Supovitz, 2006). Often, school-based personnel do not have the time nor the
expertise required for this type of research. Identifying effective programs from the
central office made it easier for teachers and principals to learn about new programs
(Fullan & Levin, 2009; Togneri & Anderson, 2003b).
Danielson, Doolittle, and Bradley (2007) explained that this component was more
than just identifying effective instructional programs. Staffs should also be provided with
professional development in the use of new programs, and the central office should
work with schools to ensure that practices were implemented with fidelity. Reeves
(2008) completed a study which reinforced the need to implement new approaches with
fidelity. In this study, findings showed that when 90% or more of the teachers
implemented the same effective strategies, the percentage of students who scored
proficient levels increased. Fullan (2009) related this effect to the Wallace findings in
which the degree of collective efficacy resulted in increases in student achievement
across the district.
Coordinate instructional materials. As with identifying effective strategies, school
staffs do not always have the time or expertise to identify and align instructional
materials with the curriculum. The reforming districts assisted in the selection and deep
alignment of instructional materials, including textbooks, to district objectives and
assessments as well as state assessments (Downey, 2001; English, 2009; Supovitz,
2006).
81
Use of Data to Drive Decisions
Having a clear picture of the district based on data can be a highly effective tool
to guide instruction (Kerr, Marsh, Darilek, & Barney, 2006; Shannon & Bylsma, 2004).
In a study conducted over a four-year period by McLaughlin and Talbert (2003),
teachers reported increased utilization of data as critical to evaluating instruction,
establishing school and district norms for problem-solving, and building learning
communities focused on improving instruction. McLaughlin and Talbert (2003)
cautioned that without evidence teachers and administrators cannot be expected to
effectively analyze factors such as curriculum choice, resource allocation, and
strategies for change.
Collect and analyze data. As the collection and disaggregation of student
performance data has become more prevalent in the schools, districts have taken the
role of organizing data so that decision-makers have timely access to data in a user-
friendly format (Bottoms & Frye, 2009; Burch & Spillane, 2004; Copland, 2003; Foley &
Sigler, 2009; Harris & Chrispeels, 2006; Knapp et al., 2003; Supovitz, 2008). Burch and
Spillane used the term data managers when referring to this responsibility. In a study
conducted by Kerr et al. (2006) and a separate study by Supovitz (2008), findings
demonstrated that schools generally did not have access to effective data nor the
technical ability to coordinate available data. On the other hand, in a separate study
conducted by Chrispeels et al. (2008) teachers experienced data overload due to lack of
support in identifying critical data.
Develop formative assessments and benchmarking. In addition to merely
maintaining summative data, effective districts seek additional methods to determine
82
adequate progress (English, 2009; Foley & Sigler, 2009; McLaughlin & Talbert, 2003;
McNeal & Oxholm, 2009). English (2009) emphasized the necessity of criterion
referenced pre- and post- tests, deeply aligned with the curriculum and summative
assessments. In addition, McNeal and Oxholm (2009) suggested that districts utilize
benchmarking data for formal and informal assessment between schools and with
similar districts. Both forms of data can assist teachers, principals, and central office
staff in identifying and determining measurable targets, proactively responding to state
and federal accountability programs, and monitoring outcomes of students, schools, and
district personnel as well as indicators that impact those outcomes (Foley & Sigler;
McLaughlin & Talbert, 2003).
Utilize program evaluation. Improving districts have also supported schools by
providing program evaluations (Corcoran et al., 2001; Honig & Copland, 2008).
Program evaluations have become the analytical process to document a program’s
data-based merit (Scriven, 1991; Thornton et al., 2007). These evaluations serve the
purpose of determining the impact on achievement (Thornton et al.) and in identifying
effective programs that could be replicated (Corcoran et al.).
In a study conducted by Corcoran et al. (2001), districts struggled in this area
and reported that the shift to evidence-based practices proved to be difficult. In the
three districts included in the study, philosophical commitments and political necessities
sometimes prevailed over the data. Findings revealed that program evaluations were
too often pushed aside by “whims, fads, opportunism, and ideology” (p. 80). In order to
improve instruction, districts should make decisions based on evidence, not instinct.
Other researchers agreed and found that successful districts gathered data on multiple
83
issues, based on a multi-measure accountability system (7 actions that improve school
district performance. Newsletter, 2006; Thornton et al., 2007; Togneri & Anderson,
2003b).
Investment in Professional Development
In 1994, Todnem and Warner stated that if, “the individuals within the
organization do not have opportunities to learn how to work within the new system, the
improvement effort will fail” (p. 66). Effective districts have taken steps to ensure
system-wide professional development focused on building the capacity of teachers and
principals to improve teaching and learning. Professional development should be on-
going, job-embedded, and aligned with identified needs and targeted goals (Chrispeels
et al., 2008; English, 2009; Leverett, 2004; McBeath, 2006; Protheroe, 2008; Shannon
& Bylsma, 2004; Supovitz, 2008; Vandiver, 2008). The central office plays a critical role
in determining the context as well as providing the professional development (Spillane &
Thompson, 1997).
Ensure high quality professional development. Researchers have shown that
while educators approved of differentiated instruction for students, failure to apply this
concept to adults is a common occurrence. Togneri and Anderson (2003b) argued that
successful districts replace all traditional, one-way workshops with new approaches. In
order to ensure that the professional development meets the needs of the teachers and
principals, delivery methods should be in varying forms that are coherent and organized
while addressing different levels and needs in a setting that promotes sharing (Chafin,
2005; Foley & Sigler, 2009).

84
Provide professional development focused on instruction. Effective districts
ensure that school-based staff received professional development in use of the
curriculum, and the selections of activities align with the curriculum and support the
needs of the students served (Downey, 2001; Marsh, Kerr, Ikemoto, Darilek, Suttorp,
Zimmer, & Barney, 2005; McBeath, 2006). This training should include developing an
understanding of the district assessments, use of data, intervention strategies as well as
content priorities such as literacy, numeracy, and high school reform (Danielson et al.,
2007; Downey, 2001; Fullan & Levin, 2009).
Provide professional development for role-alike groups. Opportunities for district
supported professional development should not only be made available to teachers and
principals but also other role-alike groups such as coaches, mentors and specialists
(Leverett, 2004). These opportunities can take many forms from formal professional
development to providing opportunities for study groups. Including different groups that
impact instruction builds strength across the district of the knowledge and skills required
to support an instructional focus.
Provide professional development for central office. “The instructional focus
must become everyone’s work at all levels of the district” (Leverett, 2004, p. 4).
Findings have shown that effective districts not only invested in professional
development for school-based staff but central office staff as well (Honig & Copland,
2008). If central offices are going to work in collaboration with the schools and be
viewed as key reform participants, they must learn to support schools more effectively
and deepen knowledge about teaching and learning (Honig & Copland; Leverett;
Silverman, 2004).

85
Maintain support for new employees. Research found that districts with
increases in achievement implemented multiple strategies to assist new employees
(Togneri & Anderson, 2003b). While formal and informal mentoring programs provide
job embedded training, focused professional development also plays a significant role in
assisting new employees in understanding district expectations as well as effective use
of strategies adopted by the district (Grogan & Crow, 2004; Peters, 2009; Togneri &
Anderson, 2003b).
Peters (2009) stated that: “district leadership has a tremendous responsibility for
providing support for the school leader” (p. 71). Darling-Hammond and Baratz-
Snowden (2005) stated: “Helping beginning teachers learn to think systematically about
this complexity (teaching) is extremely important” (p. 118). While the district has a
responsibility to all employees, preparing teachers and principals to lead in the
classroom and the school is extremely critical.
Establish structures for learning communities. Effective districts set up structures
and support schedule changes that allow employees to work as colleagues in learning
communities (Knapp et al., 2003; MacIver & Farley-Ripple, 2008; McLaughlin & Talbert,
2002; Protheroe, 2008). Time spent in conversations related to the district vision
allowed staffs time to plan and share strategies for making the vision a reality.
Opportunities to work in learning communities were critical for central offices as
well as the schools (Hightower, Knapp, Marsh, & McLaughlin, 2002; McLaughlin &
Talbert, 2002; McNeal & Oxholm, 2009). In a study conducted by Honig (2008), this
concept was taken a step further and methods to engage the central office as learning
organizations were explored. While this research recognized that this task would be
86
difficult, partly as a result of previous roles of the central office, recognition of the
importance for central office staff in becoming a learning organization through
partnerships with the schools was deemed necessary for improving student
achievement.
Fullan (2010c) applied this concept to the entire district. This research reinforces
that there are no silos of standards, personnel, curriculum and development, etc.
Everyone has the same access to information, and everyone is a part of the solution.
Schools learn from each other. Fullan coined this level of collaboration as lateral
capacity building and stated that it was one of the most powerful tools available to the
district (p. 12).
Leadership Development
“When people in an organization focus only on their position, they have little
sense of responsibility for the results produced when all positions interact” (Senge,
1990, p. 19). Effective districts developed strategies to redefine leadership
development so that all members felt a sense of ownership for the results (Fullan, 2009;
Fullan & Levin, 2009; Rorrer et al., 2008; Togneri & Anderson, 2003b).
Encourage distributed leadership. Effective leadership that supports instruction
must be distributed among a variety of stakeholders (Togneri & Anderson, 2003a).
Distributed leadership or shared leadership must assist in setting high expectations for
both students and staff (7 actions that improve school district performance. Newsletter,
2006); however, Fullan and Levin (2009) observed that this cannot be accomplished by
maintaining a separate set of standards from the content areas. In addition, leadership
skills must be embedded in the work. Job-embedded leadership development will carry

87
over into other priorities and will focus on improving capacity to implement reform
(Brown & Spangler, 2006; Fullan, 2009; Rorrer et al., 2008).
Distributed expertise or leadership reinforces reciprocal accountability among
staffs (Fink & Resnick, 2001). Dr. Del Burns, Former Superintendent of Wake County
Public School System, advocated that leadership development was important and that
all staffs must learn to lead from where they sit (D. Burns, personal communication,
June 3, 2009).
Ensure strong instructional leadership from administrators. Louis, Leithwood,
Wahlstrom, Michlin, Gordon, Meath, and Anderson (2009) found that leadership
development was the most powerful source of influence over the schools. This report
captured the findings of current research and revealed that reforming districts paid
attention to leadership by advancing the skills of district and school leaders in leading a
common goal of improving student achievement (Brown & Spangler, 2006; Fullan &
Levin, 2009; Helsing et al., 2008; Marsh et al., 2005; McBeath, 2006; McNeal &
Oxholm, 2009).
Reforming districts firmly placed the principal as the instructional leader,
promoting appropriate administrative behaviors that foster shared leadership at all
levels (Brown & Spangler, 2006; Fullan & Levin, 2009; Krajewski, 1984; Marsh et al.,
2005). In a study of five districts conducted by Brown and Spangler, leadership
development for the principal was accomplished in a number of ways. In addition to
consistent, on-going training, content experts or coaches engaged principals in learning
to increase their knowledge of instruction in areas such as content and testing data.
Principals were expected to know what good teaching looked like and to assist in

88
leading professional development at their schools. A strong component of such
processes usually included regular classroom visits to assist with implementation of key
strategies (Brown & Spangler; Leverett, 2004).
Fullan (2009) examined leadership in eight programs and found the following
components to be critical: (1) recruitment of outstanding leaders into programs focused
on instruction and change, (2) curriculum theory linked to practice, (3) coursework that
included field-based experiences, (4) a blending of coaching that supported the analytic
work and assisted in clarifying a basis for practice, (5) creation of cohorts that know how
to collaborate, and (6) procurement of necessary resources (p. 46).
Murphy and Hallinger (2001) focused on the importance of the superintendent
playing an active role in areas of curriculum and instruction. The areas that this
research identified as critical for the superintendent included setting district goals,
selecting district-wide staff development, ensuring district and school goal coordination,
and supervising and evaluating principals. MacIver and Farley-Ripple (2008) agreed
with this study and added that the superintendent must also develop the expertise of the
administrative staff in supporting curriculum and instruction along with other areas of
district focus.
Provide leaders with the knowledge to become change savvy. Leaders in
today’s schools and school districts must be knowledgeable of the change process.
Fullan (2010b) describes how successful organizations are led by individuals who
understand the importance of careful entry, listening, and engaging in fact finding and
joint problem solving (p. 18).

89
Work with institutions of higher education. In a study conducted by Honig and
Copland (2008), one of the methods in which central office staff looked for improved
methods to provide professional development was to partner with institutions of higher
education. McNeal and Oxholm (2009) suggested that this strategy should not only be
used for on-going professional development but for promoting additional degreed
programs as well. As a result, the district would have a better pipeline of quality school
leaders trained to reflect the needs of the district.
Offer advancement opportunities. Many districts used some form of competitive
compensation and a variety of incentives for meeting goals. This strategy included
establishing a career track for teachers that offered advancement for the most effective
individuals (Foley & Sigler, 2009; Protheroe, 2008). Merit pay programs are
increasingly seen across the nation as districts explore options. One such example is
seen in an urban district in North Carolina, where the Board and administrators are
experimenting with the Teacher and Student Advancement Program (TAP). The most
effective teachers are also offered advancement opportunities as a master and/or
mentor teacher (Hui, 2009). Programs such as this one offer teacher bonuses and
salary increases based on improvements in student achievement.
Optimal Use of Human and Financial Resources
Districts must prioritize their resources to align with and drive the district goals
(Fullan & Levin, 2009; Harris & Chrispeels, 2006; Knapp et al., 2003; Togneri &
Anderson, 2003b). Fullan and Levin (2009) described how too often districts and
schools respond as if new programs and activities require new money when the reality
is that existing resources need to be utilized in a more effective manner. Fullan and

90
Levin further recommend abandoning ad hoc programs created to satisfy an individual
for expenditures that support the needs of the district.
Ensure equitable, efficient, and transparent distribution of resources. “To align
the infrastructure with the strategic vision, district leaders ensure the equitable, efficient,
and transparent distribution of public and private resources” (Foley & Sigler, 2009, p. 5).
In case studies conducted by Snipes et al. (2002), districts involved in successful reform
efforts focused resources in schools with the greatest need. These resources included
financial and human resources as well as human capital. Human capital was defined as
capacity-building among teachers and principals (MacIver & Farley-Ripple, 2008;
Snipes et al.).
As with a business, educational leaders must get the greatest value on the dollar,
which means increased efficiency measures to reduce and contain costs (McNeal &
Oxholm, 2009; Murphy & Meyers, 2008). Not only does this mean ensuring appropriate
measures, but educational leaders must also find methods to make the budgets
accessible and understandable for ensuring consumers that they received the best
value for their dollar.
Assist schools in understanding finances. The district has a critical role in
assisting schools in understanding how to prioritize and align resources with the goals
of the system (Appelbaum, 2002; Honig, 2004; MacIver & Farley-Ripple, 2008). The
ability of the district to reach ambitious goals is largely dependent on understanding how
to capitalize on resources. This information not only empowered staffs to make better
decisions but allowed them to fully understand budget implications (Appelbaum).
91
Seek alternative revenues. Districts have a responsibility to seek alternative
resources that flow to the schools to support instruction (Fullan, 2009; McNeal &
Oxholm, 2009; Muirhead et al., 2001). McNeal and Oxholm described one district’s use
of an exclusive distribution contract to increase revenue, while Muirhead et al. described
the district’s responsibility to actively seek grants. Effective districts have taken time to
explore the possibilities, which often includes hiring individuals from the business
community to partner with business leaders to identify alternative sources of revenue in
smaller districts (McNeal & Oxholm).
Identification of Intervention Strategies
A major component in reforming districts was attention to intervention strategies.
Intervention strategies were identified that used NCLB benchmarks for decision-making
(Fullan, 2009; Louis et al., 2009; Muirhead et al., 2001; Protheroe, 2008).
Support multi-tiered intervention. Fullan (2009) found that effective districts
“establish a focused, mostly non-punitive, comprehensive, relentless intervention
strategy” (p. 48). This work supported the earlier work of Louis et al. (2009), which
emphasized multi-tiered intervention services as critical for prevention and
differentiating instruction.
Chafin (2005) expanded this component and suggested that acceleration should
also be included. In this newsletter, a publication from the Center of Comprehensive
School Reform and Improvement, at-risk students were reported as often being placed
in programs focused on practice and drill, and accelerated students were provided more
interactive, “learning for learning’s sake” courses. Chafin further suggested a better
balance, citing accelerated students as often the students that need skills related to how

92
to complete homework and at-risk students need courses that will demonstrate that
education can be fun. Muirhead et al. (2001) included an additional component for
reforming districts to consider which included alternative programs for high school and
middle school students who simply cannot succeed in the traditional learning
environment.
Provide professional development related to intervention strategies. Once
research based intervention strategies are identified, teachers and administrators must
be provided with professional development in the use of the strategies (Danielson et al.,
2007; Fullan, 2009). In addition, it is critical that systems are in place to support schools
throughout the implementation phase as well as in sustaining results.
Summary
Throughout the history of education, identifiable shifts have occurred resulting in
changes in education (Sergiovanni, 1982). These shifts were greatly influenced by
societal events (see Figure 2). Since 1990, education has experienced two additional
movements, which still impact education today (Protheroe, 2008). As of yet, these
movements have not produced the desired results. Evidence can be found in student
achievement since the enactment of NCLB, which shows that results have either
remained the same or declined (Bracey, 2009; Cavanagh, 2009b; Duffet et al., 2008;
National Center for Education Statistics, 2006).
District leaders are recognizing that the consequences are too great to ignore
and are accepting the compelling evidence that schools need assistance in meeting the
mandates. Redefining the relationship between the central office and the school will not
be easy as districts overcome the negative images of the central office supervisor well
93
engrained in the history of education (Hatch, 2009; Honig & Copland, 2008; Leverett,
2004). This change will require districts to shed the fear of being perceived as top-down
leaders and move away from loosely defined site-based management, as well as the ill-
defined curriculum that emerged during the restructuring movement (Darling-Hammond
& Friedlaender, 2008; Dufour, 2007; Guskey, 2007; Honig & Copland, 2008; Protheroe,
2008; Rorrer et al., 2008; Waters & Marzano, 2006). District leaders will be required to
establish responsibilities and parameters of authority for the central office as well as the
school (Larson, 2007; Protheroe; Waters & Marzano). Waters and Marzano referred to
this relationship as defined autonomy (p. 4). Collins (2001) referred to this concept as a
culture of discipline within an ethic of entrepreneurship (p. 126). Waterman (1988)
described this concept as directed empowerment (p. 63), and Dufour (2007) referred to
the relationship as loose-tight leadership (p. 2). This relationship is one in which
schools and the central office operate under non-negotiable goals for learning and
instruction with clearly defined areas of autonomy (Waters & Marzano, p. 4).
Research to define the actual functions of the central office in improving student
achievement will be critical in overcoming the negative images of the supervisor held in
the past (Fullan, 1991; Harris & Chrispeels, 2008; Honig & Copland, 2008; MacIver &
Farley-Ripple, 2008; Pajak et al., 1998). This research attempted to draw upon the
emerging research and identify the functions of the central office targeted as critical to
improving student achievement (see Figure 2). In addition, defining characteristics
emerged, similar to other eras throughout history. These characteristics included
coherence and alignment (Bottoms & Fry, 2009; Chrispeels et al., 2008; English, 2009;
94
Fullan, 2009; Leverett, 2004; McLaughlin & Talbert, 2003; Orr et al., 2008; Thornton et
al., 2007).
Even though practice has outpaced the research, the emerging research is
already warning that improvements will fail to reach to the majority of our schools
without substantial involvement from the central office (Chrispeels et al., 2008; Goodlad
& Oakes, 1988; Hatch, 2009; Leverett, 2004; Pounder & Crow, 2005). This warning
creates a sense of urgency for additional research as leaders seek information to make
evidence-based decisions in an era of accountability supported by limited resources.
CHAPTER 3: METHODOLOGY
This study seeks to increase the scope of the research on the role of the central
office by exploring critical functions of the central office in improving achievement for all
students. As stated in chapter 1, the first purpose of this study is to determine which
district functions principals believe are essential in improving achievement for all
students. Secondly, the study will examine the relationships between perceptions of
principals regarding central office support for increasing student achievement in schools
that met Adequate Yearly Progress (AYP) under No Child Left Behind (NCLB) and
schools that did not meet AYP under NCLB.
Statement of the Problem
While there have been successful individual attempts on the part of schools to
improve student achievement (Darling-Hammond, 1997; Togneri & Anderson, 2003a),
the emerging research argues that the requirements for meeting the mandates of NCLB
are too daunting for the school administrators and teachers to be expected to attempt in
isolation (Corcoran et al., 2001; Daresh, 2004; Hatch, 2009; Honig & Copland, 2008;
Markward, 2008, Protheroe, 2008; Rallis & Highsmith, 1986). Schools do not always
have the knowledge or expertise to address the challenges, and teachers have reported
that NCLB alone does not provide adequate support (Hatch; Le Floch et al., 2006). In
addition, the consequences of failing to improve student achievement under NCLB are
too great for districts to ignore.
Districts are increasingly obtaining results by re-examining the relationship
between the school and the central office (Darling-Hammond & Friedlaender, 2008;
Dufour, 2007; Guskey, 2007; Honig & Copland, 2008; Protheroe, 2008; Rorrer et al.,
96
2008); however, the research to guide these changes lags behind current initiatives
(Fullan, 1991; Honig & Copland; MacIver & Farley-Ripple; Pajak et al., 1998). With the
growing constraints imposed by the current economic situation as well as increased
accountability associated with NCLB, information to assist leaders in making informed
decisions is critical, making this research very timely.
Research Questions
As stated in chapter 1, this study has two major research questions. These
questions are listed below:
1. Which district functions do principals believe are essential in improving
achievement for all students: systemic focus, commitment to instruction, use
of data to drive decisions, investment in professional development, leadership
development, optimal use of human and financial resources, and identification
of intervention strategies?
2. Is there a statistical relationship between the perceptions of principals of
schools that made AYP and principals of schools that did not make AYP?
Population
Setting
The study was conducted in a large urban district with a total of 159 schools
serving students during the 2009-2010 school year. Included in the total number of
schools are two alternative middle schools, two non-traditional high schools, and two
9th grade centers. During the 2009-2010 school year, one high school expansion was
completed and three new elementary schools were opened (Wake County Public
Schools District Overview 2008-09, n.d.). While student achievement has remained

97
consistent with approximately 63% of the schools meeting AYP in 2008-09 (North
Carolina School Report Cards, 2009), the district has undergone tremendous increases
in the size of the student population (see Table 3: Growth In Student Population).
During the last ten years, the district has experienced an average annual growth of
3.77% with the highest percentage at 5.91% and the lowest percentage at 1.36%. This
percentage translates into 7,568 students as the largest increase and 1,893 students as
the smallest increase.
Student Population
Demographics. With the increased growth, the district has experienced shifting
demographics (see Table 4, Shifting Demographics). While the overall percentage of
White and African American students has decreased, the percentage of Asian,
Hispanic, and Multi-Racial has continued to increase.
Special needs of students. Approximately 9.3% of the students within the district
are classified as Limited English Proficient (LEP) and 5.1% require English as a Second
Language (ESL) services. Approximately 26% of the students in grades 4 through 12
were enrolled in Academically Gifted Programs, and approximately 13.9% of the
students were enrolled in Special Needs Programs (Wake County Public Schools
District Overview 2008-09, n.d.).
Free/reduced lunch status. The percentage of free/reduced lunch status ranges
from 10.2% of the students qualifying for reduced or free lunch to 77.9% with an
average of approximately 28.4% (Wake County Public Schools District Overview 2008-
09).
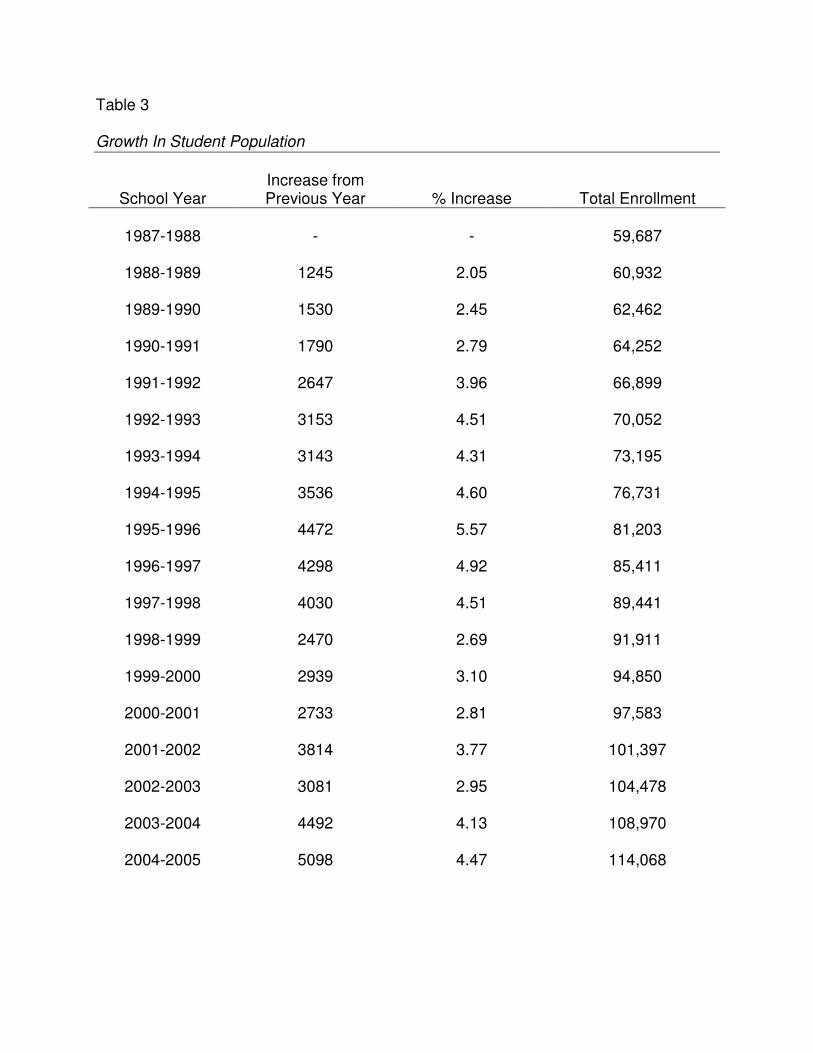
Table 3 Growth In Student Population
School Year Increase from Previous Year
% Increase
Total Enrollment
1987-1988 - - 59,687
1988-1989 1245 2.05 60,932
1989-1990 1530 2.45 62,462
1990-1991 1790 2.79 64,252
1991-1992 2647 3.96 66,899
1992-1993 3153 4.51 70,052
1993-1994 3143 4.31 73,195
1994-1995 3536 4.60 76,731
1995-1996 4472 5.57 81,203
1996-1997 4298 4.92 85,411
1997-1998 4030 4.51 89,441
1998-1999 2470 2.69 91,911
1999-2000 2939 3.10 94,850
2000-2001 2733 2.81 97,583
2001-2002 3814 3.77 101,397
2002-2003 3081 2.95 104,478
2003-2004 4492 4.13 108,970
2004-2005 5098 4.47 114,068
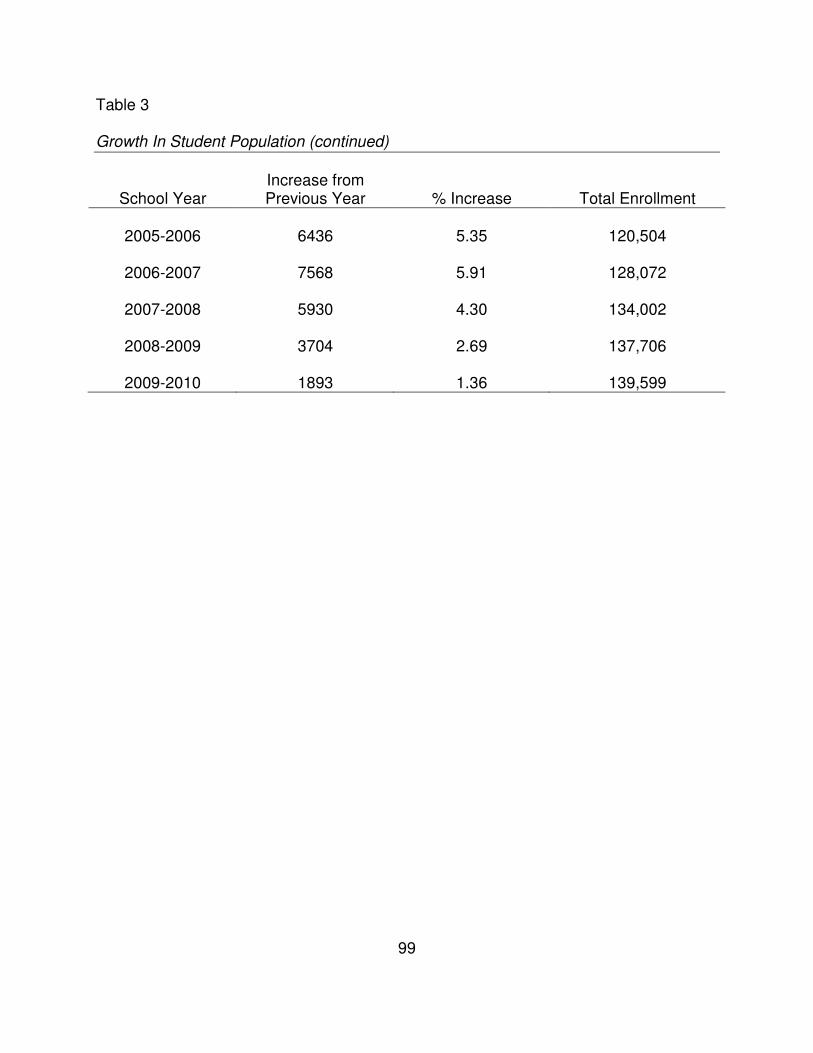
99
Table 3 Growth In Student Population (continued)
School Year Increase from Previous Year
% Increase
Total Enrollment
2005-2006 6436 5.35 120,504
2006-2007 7568 5.91 128,072
2007-2008 5930 4.30 134,002
2008-2009 3704 2.69 137,706
2009-2010 1893 1.36 139,599
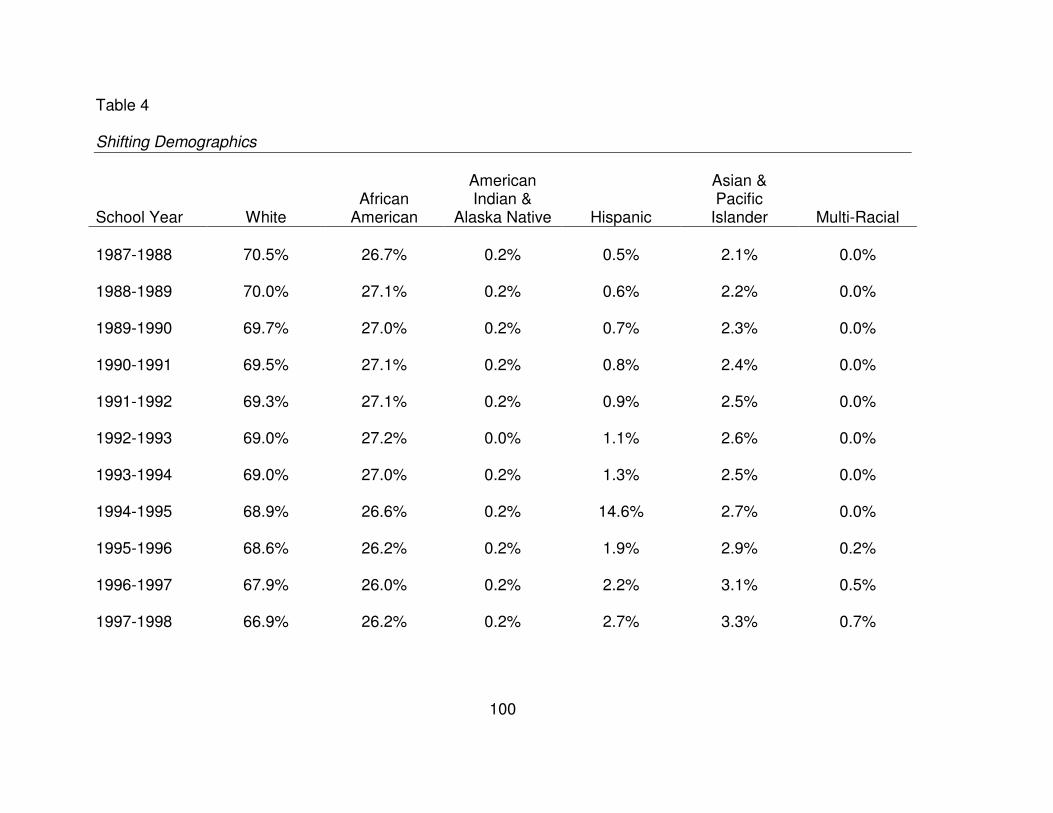
100
Table 4
Shifting Demographics
School Year
White
African
American
American Indian &
Alaska Native
Hispanic
Asian & Pacific
Islander
Multi-Racial
1987-1988 70.5% 26.7% 0.2% 0.5% 2.1% 0.0% 1988-1989 70.0% 27.1% 0.2% 0.6% 2.2% 0.0% 1989-1990 69.7% 27.0% 0.2% 0.7% 2.3% 0.0% 1990-1991 69.5% 27.1% 0.2% 0.8% 2.4% 0.0% 1991-1992 69.3% 27.1% 0.2% 0.9% 2.5% 0.0% 1992-1993 69.0% 27.2% 0.0% 1.1% 2.6% 0.0% 1993-1994 69.0% 27.0% 0.2% 1.3% 2.5% 0.0% 1994-1995 68.9% 26.6% 0.2% 14.6% 2.7% 0.0% 1995-1996 68.6% 26.2% 0.2% 1.9% 2.9% 0.2% 1996-1997 67.9% 26.0% 0.2% 2.2% 3.1% 0.5% 1997-1998 66.9% 26.2% 0.2% 2.7% 3.3% 0.7%
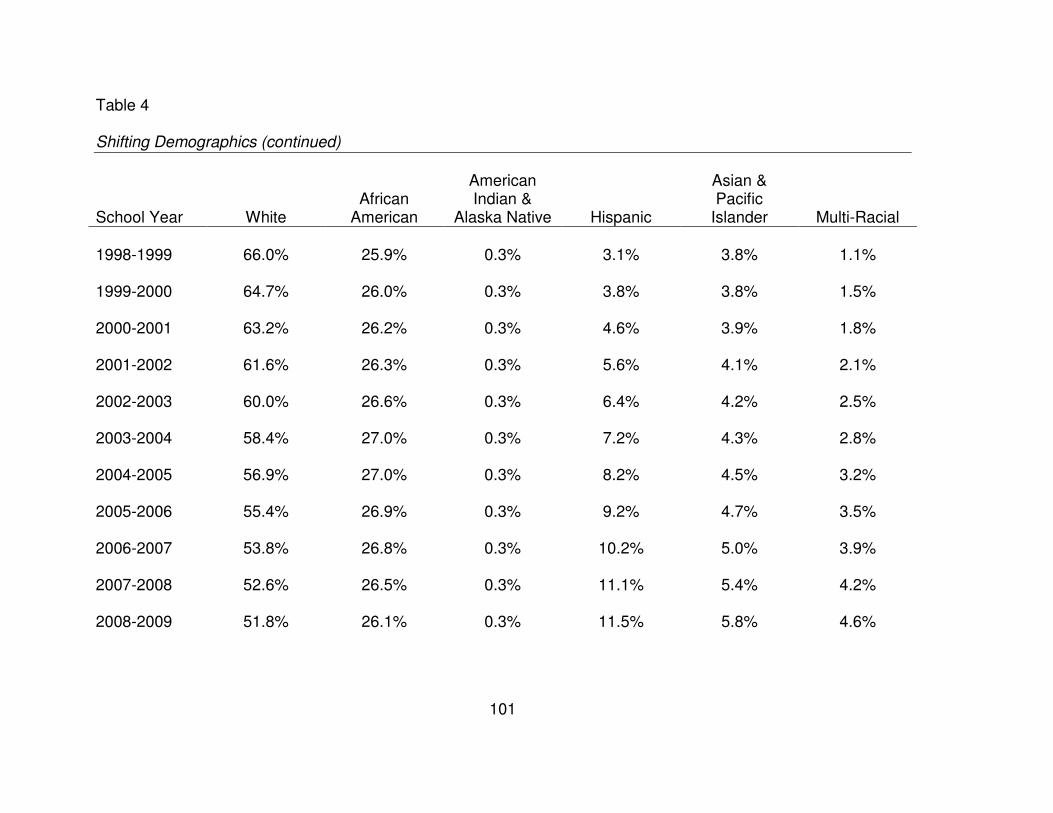
101
Table 4
Shifting Demographics (continued)
School Year
White
African
American
American Indian &
Alaska Native
Hispanic
Asian & Pacific
Islander
Multi-Racial
1998-1999 66.0% 25.9% 0.3% 3.1% 3.8% 1.1% 1999-2000 64.7% 26.0% 0.3% 3.8% 3.8% 1.5% 2000-2001 63.2% 26.2% 0.3% 4.6% 3.9% 1.8% 2001-2002 61.6% 26.3% 0.3% 5.6% 4.1% 2.1% 2002-2003 60.0% 26.6% 0.3% 6.4% 4.2% 2.5% 2003-2004 58.4% 27.0% 0.3% 7.2% 4.3% 2.8% 2004-2005 56.9% 27.0% 0.3% 8.2% 4.5% 3.2% 2005-2006 55.4% 26.9% 0.3% 9.2% 4.7% 3.5% 2006-2007 53.8% 26.8% 0.3% 10.2% 5.0% 3.9% 2007-2008 52.6% 26.5% 0.3% 11.1% 5.4% 4.2% 2008-2009 51.8% 26.1% 0.3% 11.5% 5.8% 4.6%

102
Table 4
Shifting Demographics (continued)
School Year
White
African
American
American Indian &
Alaska Native
Hispanic
Asian & Pacific
Islander
Multi-Racial
2009-2010 51.1% 25.9% 0.3% 11.8% 6.1% 4.8%

103
Qualifications of Principals
Approximately 23% of the principals have degrees beyond a master’s degree. In
addition, approximately 41% of the principals have 1-3 years of experience, 37% have
4-10 years experience, and 22% have 10 years or more experience (North Carolina
School Report Cards, 2009).
The district is divided in to seven areas. Area Superintendents, who report to the
Chief Area Superintendent, are assigned to each area. The interview process starts
with meetings between the parents, staff members, and students, when appropriate, to
gather input on the characteristics desired in principal candidates. Interviews are
conducted by area superintendents, who make recommendations to the
Superintendent. The Superintendent interviews final candidates recommended by Area
Superintendents and makes the final recommendation to the Board of Education.
During the last four years, the Board of Education has approved over 90 administrative
appointments and/or transfers.
Organization of Central Office
The Central Office is divided into six divisions under the direction of Chief
Officers. The divisions include Administrative Services, Area Superintendents, Auxiliary
Services, Communications, Instructional Services, and Organizational Development and
Support (See Central Services Organizational Chart). Administrative Services falls
under the direction of the Chief Business Officer. There are currently seven area
superintendents with one designated as the Chief Area Superintendent. Auxiliary
Services is under the direction of the Chief Facilities and Operations Officer. The Chief
Communications Officer has responsibility for the Communications Division. The Chief
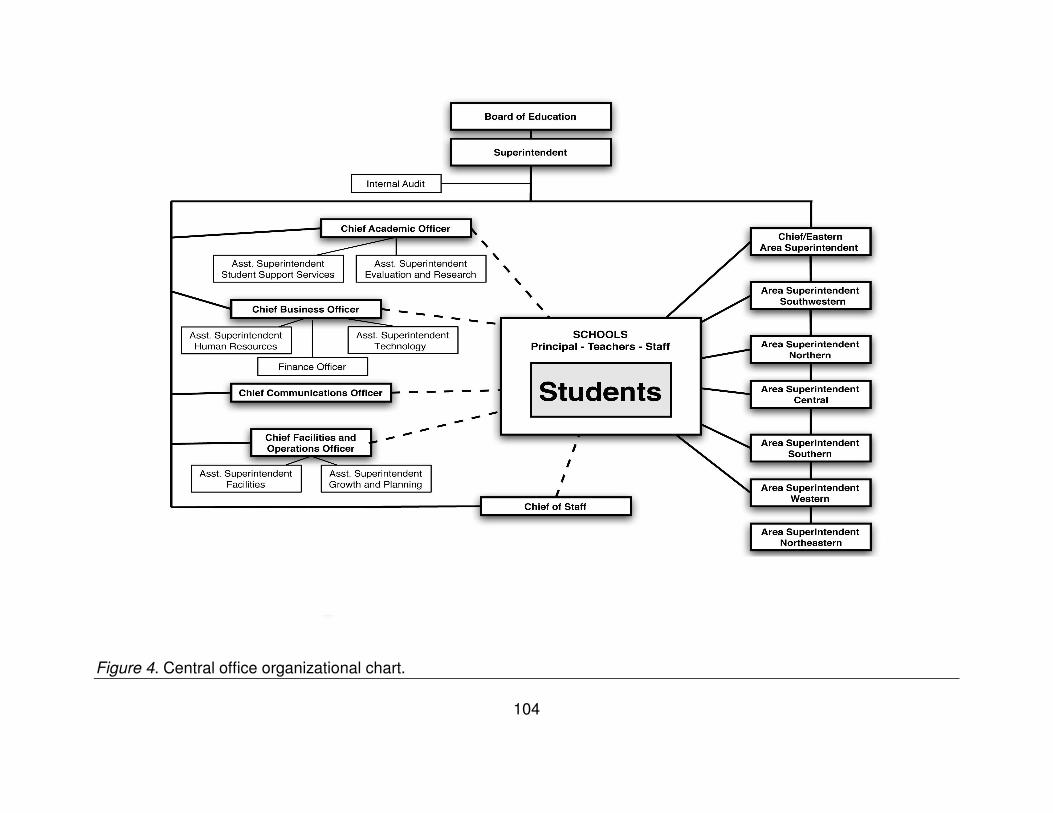
104
Figure 4. Central office organizational chart.
105
Officer for Instructional Services is responsible for instruction at all levels. The Chief of
Staff works closely with the superintendent and is responsible for Organizational
Development and Support including Board Relations, Due Process, Security,
Leadership Development, and Professional Development.
Design of Study
Development of Survey
A synthesis of the research related to the functions of the central office essential
for improving achievement for all students was used to develop the theoretical
framework for the study. In chapter 2, under each thematic domain, a list of the
functions with a detailed description was included. The descriptions were extracted
from the research and used to develop the survey.
While every effort was made to limit the number of items included on the survey
and, thus, limit the time required for participants in completing the survey (Innovation
Network), every effort was also made to adequately include descriptions from the
research. Survey questions were grouped so that all questions related to each thematic
domain were included in the same section on the survey. This grouping allowed
participants to see descriptions of each thematic domain and allowed for an analysis of
each domain.
Even though this study primarily targeted principals, the survey described seven
functions of central office for improving achievement as identified in this synthesis of the
research (see Appendix D: Survey for Principals). Thus, the survey could be used with
other groups to determine their perceptions of the role of the central office in improving
106
achievement. Even though different groups of educators would be the more likely to
complete this survey, unnecessary jargon was eliminated as recommended by Creswell
(2005).
At the top of the survey a description of the purpose and instructions were
provided. The survey consists of 55 items (see Table 5: Number of Items within
Survey). The survey was formatted with a stem statement for each thematic domain.
Questions/Statements were placed under stem statements and the related thematic
domain. In order to understand perceptions regarding the need for each function,
participants were asked whether they agreed or disagreed with each statement. At the
end of the survey, participants were given the opportunity to make comments including
suggestions for additions and/or deletions to the survey.
Reliability Coefficient
Creswell (2005) reported that, “scores on an instrument are reliable and accurate
if an individual’s scores are internally consistent across the items on the instrument” (p.
164). In order to determine internal consistency reliability on the survey, Cronbach’s
Alpha or Reliability Coefficient (Garson, 2008) was computed using SPSS for each set
of questions related to the seven thematic domains within the theoretical framework.
These tests allowed exploration as to whether the items on the test were consistent with
one another in that they represented one, and only one dimension or area of interest
(Garson, 2008; Gliem & Gliem, 2003; Salkind, 2005; Santos, 1991).
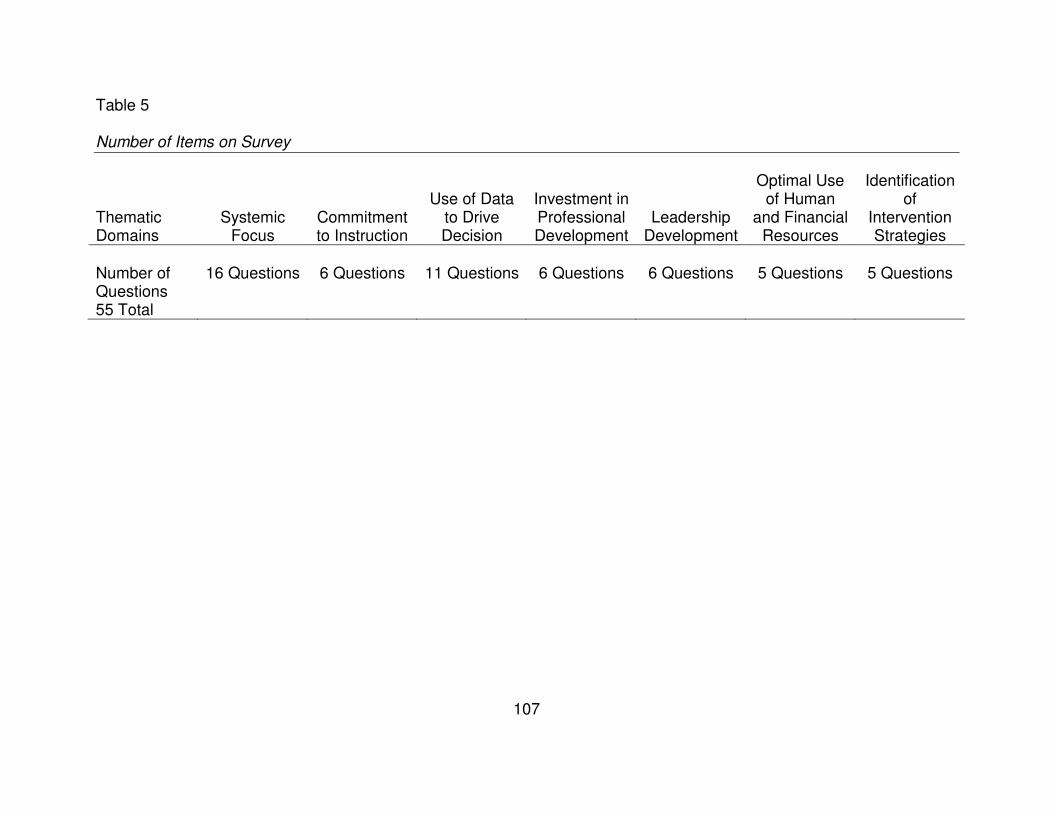
107
Table 5 Number of Items on Survey
Thematic Domains
Systemic Focus
Commitment to Instruction
Use of Data
to Drive Decision
Investment in Professional Development
Leadership Development
Optimal Use of Human
and Financial Resources
Identification of
Intervention Strategies
Number of Questions 55 Total
16 Questions 6 Questions 11 Questions 6 Questions 6 Questions 5 Questions 5 Questions
Participants
Principals within the district were invited to participate in the survey
(N=151). Surveys were mailed to each school site with an envelope for returning the
survey. Principals at three schools were excluded because the schools opened during
the 2009-2010 school year and did not have test results. Five schools had interim
principals and were also excluded from the study.
Limitations of the Study
Adequate Yearly Progress (AYP). This study relied heavily on Adequate Yearly
Progress (AYP), which continues to receive widespread debate, largely due to the
narrow focus on test scores (Cavanagh, 2009a; Hargreaves & Shirley, 2008; Lang,
2007; Guzman, 2010). All student subgroups within a school are expected to meet the
target goal for percentage of students proficient. Proficiency is measured in the areas
of mathematics and reading/language arts (North Carolina No Child Left Behind, n.d.).
Working conditions. Other factors within the district and the schools that typically
influence working conditions such as time, atmosphere, school leadership, district
leadership, facilities, resources, and teacher involvement (North Carolina State Board of
Education, 2009) were not taken into account for this study.
Participation in focus group. Convenience sampling was the method utilized for
selecting participants in the focus group.
Selection criteria for participation in the survey. Participant selection criteria did
not include distinguishing factors such as experience in teaching, previous
administrative positions held in the North Carolina Public School System or any other
state or longevity in their current position. Adequate Yearly Progress (AYP) was taken

109
from the 2008-09 school year, which at the time of the study was the latest available
data. The participants for this study were based on 2009-2010 assignments.
Testing data used. The only student achievement data that was used for this
study are End-of-Grade (EOG) tests and End-of-Course (EOC) tests, used to measure
Adequate Yearly Progress (AYP). Other testing data such as Effectiveness Indexes,
EVAAS and the State Growth Model were not used for selecting participants.
Relevance to other districts. The district within this study is a large population;
however, this study was limited to one district. Since the narrative summative was an
analysis from multiple studies, it is hoped that this study will provide insights for other
districts. However, each school district has unique characteristics and serves as a
reflection of the community it represents, which should be considered.
Analysis of Data
The survey has a total of 55 statements to which participants were asked to
respond. These statements were categorized by seven thematic domains including:
systemic focus, commitment to instruction, use of data to drive decisions, investment in
professional development, leadership development, optimal use of human and financial
resources, and identification of intervention strategies. The first research question
stated: Which district functions do principals believe are essential in improving
achievement for all students: systemic focus, commitment to instruction, use of data to
drive decisions, investment in professional development, leadership development,
optimal use of human and financial resources, and identification of intervention
strategies?

110
To address the first question, the total number of responses, frequency of responses
and percentages of responses by level of agreement were calculated for each item as
well as each thematic domain. This data is presented in separate tables for each
thematic domain.
A series of Fisher’s exact tests were used to answer the second research
question: Is there a statistical relationship between the perceptions of principals of
schools that made AYP and principals of schools that did not make AYP? The Fisher’s
exact tests were used to analyze the responses of principals (agree, disagree) for each
thematic domain with the school’s NCLB status (met AYP, did not meet AYP). Fisher’s
exact test is a statistical, nonparametric test used to analyze categorical data (Sheskin,
2007). A Fisher’s exact test computes the exact probability of outcomes in a 2x2 table,
thus comparing two variables, each with two categories (Salkind, 2005). Statistical
analyses were performed using the SPSS 17.0 quantitative software package. Seven
Fisher’s exact tests were performed to examine the relationship between principals’
perceptions in schools that met AYP and principals’ perceptions in schools that did not
meet AYP regarding the district’s role in maintaining a systemic focus, commitment to
instruction, use of data to drive decisions, investment in professional development,
focus on leadership development, optimal use of human and financial resources, and
identification of intervention strategies (see Table 1: Fisher’s Exact Tests Examining
Principals Perceptions of the District’s Role in Improving Student Achievement).
Focus Group
For this particular study, the focus group was utilized to further explore the level
of consensus (see Appendix F: Focus Group Questions). A focus group interview is an

111
interview with a small group of people on a specific topic (Patton, 2002). Focus groups
are widely used and accepted qualitative tools.
Due to conflicts in schedules, the time of the year in which the survey and focus
group were conducted, the difficulty in finding a time and location that served all
participants, and the conditions in the district at the time of the focus group,
convenience sampling was the method utilized for participation in the focus group. Prior
to the focus group, participants were asked to sign the Principal’s Consent Form to
Participate in the Focus Group (see Appendix A: INSTITUTIONAL REVIEW BOARD
APPROVAL LETTER). Responses for the focus groups were captured through written
notes and a recording. Responses were compared with survey results, used to further
explain the results, and used to identify areas in which additional research is needed.
Summary
No Child Left Behind has placed unprecedented accountability on the schools for
the achievement of all students (Danielson et al., 2007; No Child Left Behind Act of
2001, 2002). The current economic situation has further complicated the situation for
district leaders (Ramquist, 2009; Reader reactions to state budget cut, 2009; UFT press
release-reaction to budget cuts, 2009). As districts scramble to reduce operating
budgets, the search for identifying areas that have the greatest effect on student
achievement is extremely critical.
While the emerging research acknowledges the important role of the central
office in improving student achievement, convincing educators and the public based on
the image of the supervisor created throughout history will be difficult without sufficient
research (Harris & Chrispeels, 2006; Honig & Copland, 2008; MacIver & Farley-Ripple,

112
2008; Pajak, 1989). As a result, the data within this research can assist district leaders’
decision-making in determining functions of the central office that are essential for
increasing achievement for all students.
CHAPTER 4: DATA ANALYSIS
A review of the history of the central office revealed that the central office has
been overlooked as a contributor to increased student achievement (Chrispeels et al.,
2008; Cunningham, 1963; Grove, 2002; Pajak, 1989; Rorrer et al., 2008; Wimpelberg,
1987); however, the emerging research suggests that the work of the central office
should be part of the solution to increased achievement for all students (Darling-
Hammond & Friedlaender, 2008; Dufour, 2007; Fullan, 2010b; Guskey; Honig &
Copland, 2008; Johnston, 2001; Protheroe; Rorrer, Skria, & Scheurich, 2008). As
districts seek to re-examine the relationship between the school and the central office
(Darling-Hammond & Friedlaender, 2008; Dufour, 2007; Guskey, 2007; Honig &
Copland, 2008; Protheroe, 2008; Rorrer et al., 2008), additional research is needed to
inform the process (Fullan, 1991; Honig & Copland, 2008; MacIver & Farley-Ripple,
2008; Pajak et al., 1998).
This study adds to the limited research by answering the following research
questions:
1. Which district functions do principals believe are essential in improving
achievement for all students: systemic focus, commitment to instruction, use
of data to drive decisions, investment in professional development, leadership
development, optimal use of human and financial resources, and identification
of intervention strategies?
2. Is there a statistical relationship between the perceptions of principals of
schools that made AYP and principals of schools that did not make AYP?
114
This chapter will first describe the participants within the study, followed by the
results of tests for reliability related to questions/statements within each of the seven
thematic domains on the survey. The analysis of the data utilized in addressing the
research questions will then be reviewed.
For the first question, the total number of responses, percentages of responses
by agreement, and frequency distributions for responses were calculated for each of the
55 statements, as well as the 7 thematic domains. To answer the second research
question, the results from seven Fisher’s exact tests for the seven thematic domains
were described (see Table 1: Fisher’s Exact Tests Examining Principals’ Perceptions of
the District’s Role in Improving Student Achievement).
Description of Participants
The study was conducted in a large urban district in the Southeast. During the
last few years, the district has experienced rapid growth (see Table 3: Growth In
Student Population) as well as changes in demographics (see Table 4: Shifting
Demographics). The district opened the 2009-2010 school year with 159 schools.
Three of the schools (N=3) opened during the 2009-2010 school year and, as a result,
did not have test scores from the 2008-09 school year. These schools were excluded
from the study. In addition, five schools (N=5) were excluded because these schools
had interim principals. A total of 151 packets were mailed to principals with an invitation
to participate in the study (see Appendix E: Invitation to Principals to Participate in
study). Additional items included within the packet can be found in Appendix A:
Institutional Review Board Approval Letter, Appendix B: School District Review Board
115
Approval Letter, and Appendix D: Survey for Principals. Principals also received self-
addressed envelopes for returning the surveys.
During the 2008-2009 school year, 62.8% of the schools within the district in
which principals were surveyed made Adequate Yearly Progress (AYP) and 37.2% did
not make AYP (see Table 6: Comparison of AYP Status for District and AYP Status for
Study). Out of the possible participants (N=151), 67.5% returned surveys (N=102).
Forty-one surveys or 40.2% represented schools that did not make AYP. Sixty-one
returned surveys or 59.8% represented schools that made AYP (see Table 7: AYP
Status of Schools Represented by Participants).
Tests for Reliability
Prior to analyzing the data, Cronbach’s Alpha, known as the reliability coefficient
(Garson, 2008), was computed for each of the seven thematic domains. Cronbach’s
Alpha was calculated to determine whether the items on the survey within each of
thematic domains were consistent in that they represented one dimension or area of
interest (Garson, 2008; Salkind, 2005; Santos, 1991).
Alpha coefficient ranges in value from 0 to 1 (Santo, 1999). The generally
accepted cut-off is .70 or higher for a set of items to be considered a scale (Garson,
2008; Gliem & Gliem, 2003; Santos, 1991), even though some researchers are as
lenient as accepting .60 (Garson, 2008). Statistical analyses were performed using the
SPSS 17.0 quantitative software package.
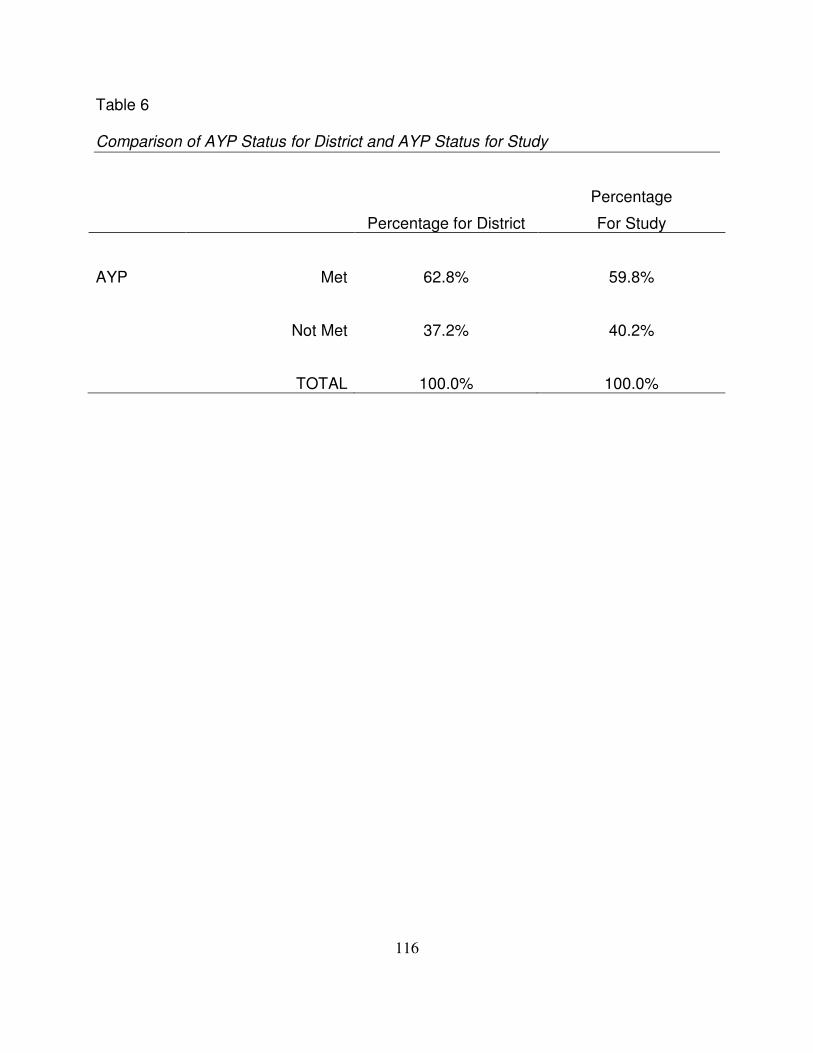
116
Table 6 Comparison of AYP Status for District and AYP Status for Study
Percentage for District
Percentage
For Study
AYP Met 62.8% 59.8%
Not Met 37.2% 40.2%
TOTAL 100.0% 100.0%
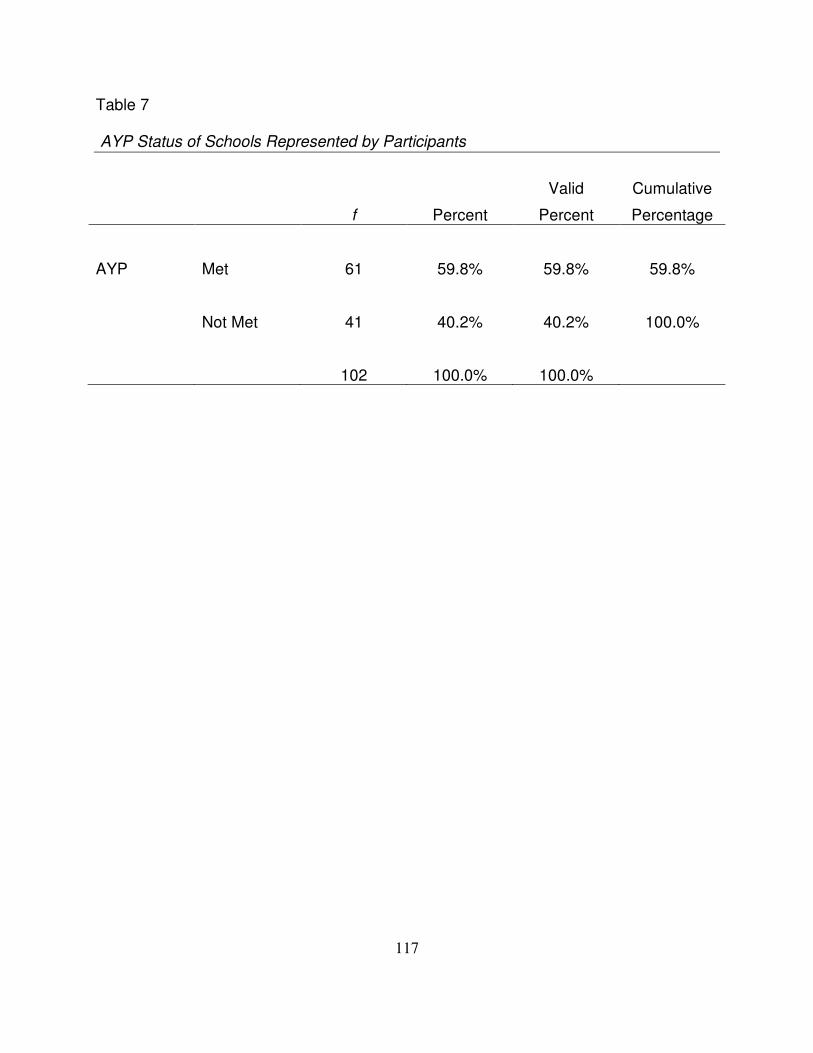
117
Table 7 AYP Status of Schools Represented by Participants
f
Percent
Valid
Percent
Cumulative
Percentage
AYP Met 61 59.8% 59.8% 59.8%
Not Met 41 40.2% 40.2% 100.0%
102 100.0% 100.0%
118
The results of Cronbach’s Alpha Test for Reliability for each of the seven
thematic domains within this study ranged from .706 to .855 (see Table 8: Reliability
Coefficient). Five of the domains ranged between .7 and .8, while two of the domains
ranged from .8 to .9. According to Gliem and Gliem (2003), these results fall within an
acceptable to good range, suggesting that items on the survey within each of the
thematic domains are consistent in that they represent one dimension.
Analysis of Data
Research Question #1
The total number of responses, percentages of responses by agreement, and
frequency distributions for responses to statements were calculated for each of the 55
statements, as well as the seven thematic domains. This information answered the first
research question: Which district functions do principals believe are essential in
improving achievement for all students: systemic focus, commitment to instruction, use
of data to drive decisions, investment in professional development, leadership
development, optimal use of human and financial resources, and identification of
intervention strategies?
More than 80% of participants agreed that each thematic domain was an
essential function for the central office in improving achievement for all students.
Agreement ranged from 82.5% in support of Identification of Intervention Strategies to
90% in support of Commitment to Instruction and Use of Data to Drive Decisions (see
Table 9: Summary for Frequencies in Seven Thematic Domains). In addition,
principals were provided with space on the survey for making suggestions for deletions
and/or additions. Eleven (N=11) of the returned surveys out of 102 (N=102) included
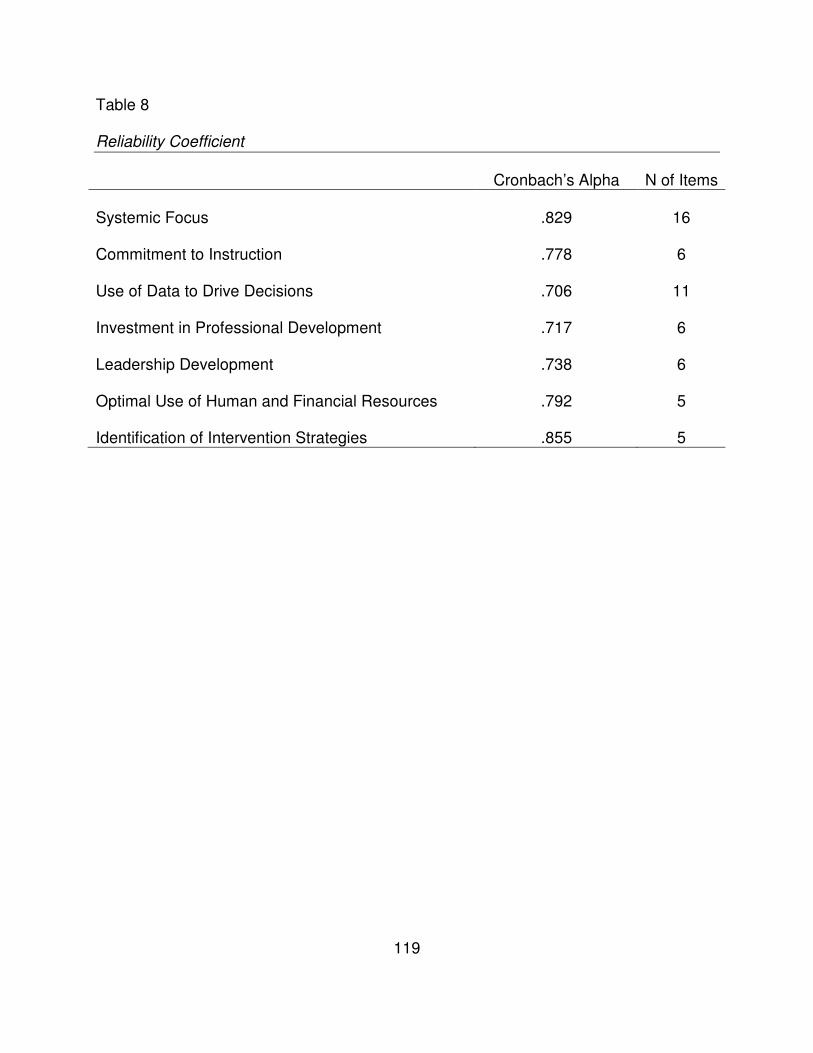
119
Table 8
Reliability Coefficient
Cronbach’s Alpha N of Items
Systemic Focus .829 16 Commitment to Instruction .778 6 Use of Data to Drive Decisions .706 11 Investment in Professional Development .717 6 Leadership Development .738 6 Optimal Use of Human and Financial Resources .792 5 Identification of Intervention Strategies .855 5
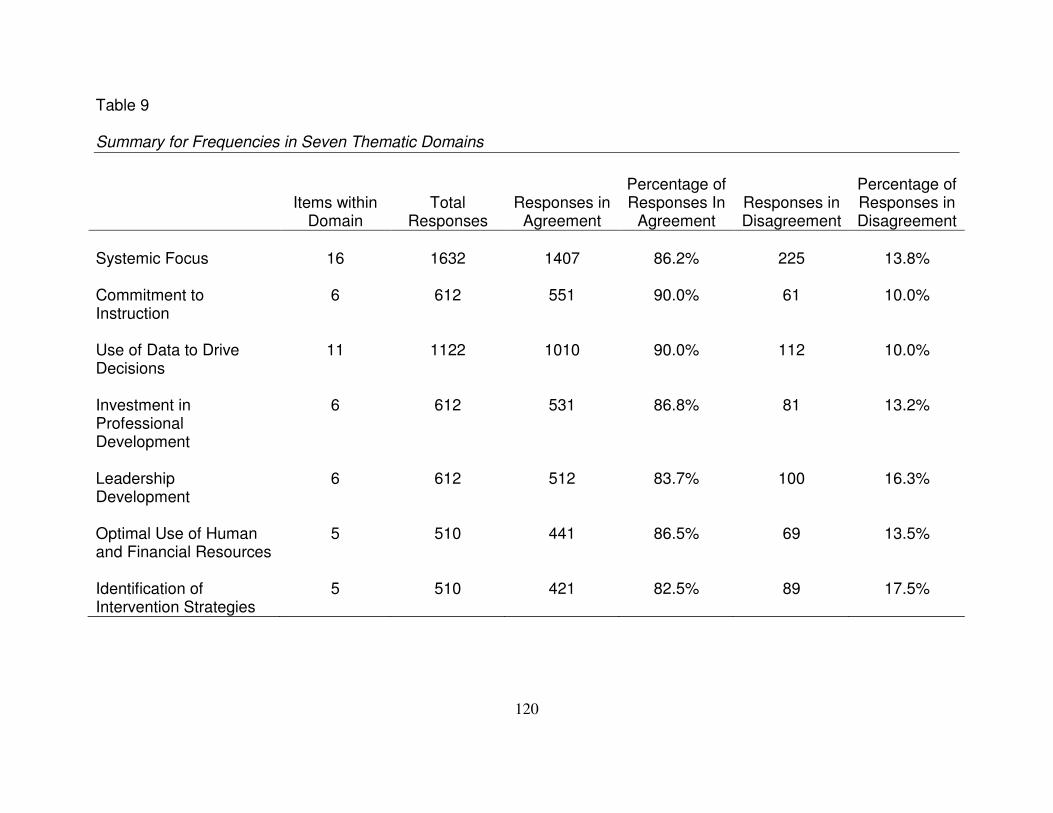
120
Table 9 Summary for Frequencies in Seven Thematic Domains
Items within
Domain
Total
Responses
Responses in
Agreement
Percentage of Responses In
Agreement
Responses in Disagreement
Percentage of Responses in Disagreement
Systemic Focus 16 1632 1407 86.2% 225 13.8% Commitment to Instruction
6 612 551 90.0% 61 10.0%
Use of Data to Drive Decisions
11 1122 1010 90.0% 112 10.0%
Investment in Professional Development
6 612 531 86.8% 81 13.2%
Leadership Development
6 612 512 83.7% 100 16.3%
Optimal Use of Human and Financial Resources
5 510 441 86.5% 69 13.5%
Identification of Intervention Strategies
5 510 421 82.5% 89 17.5%
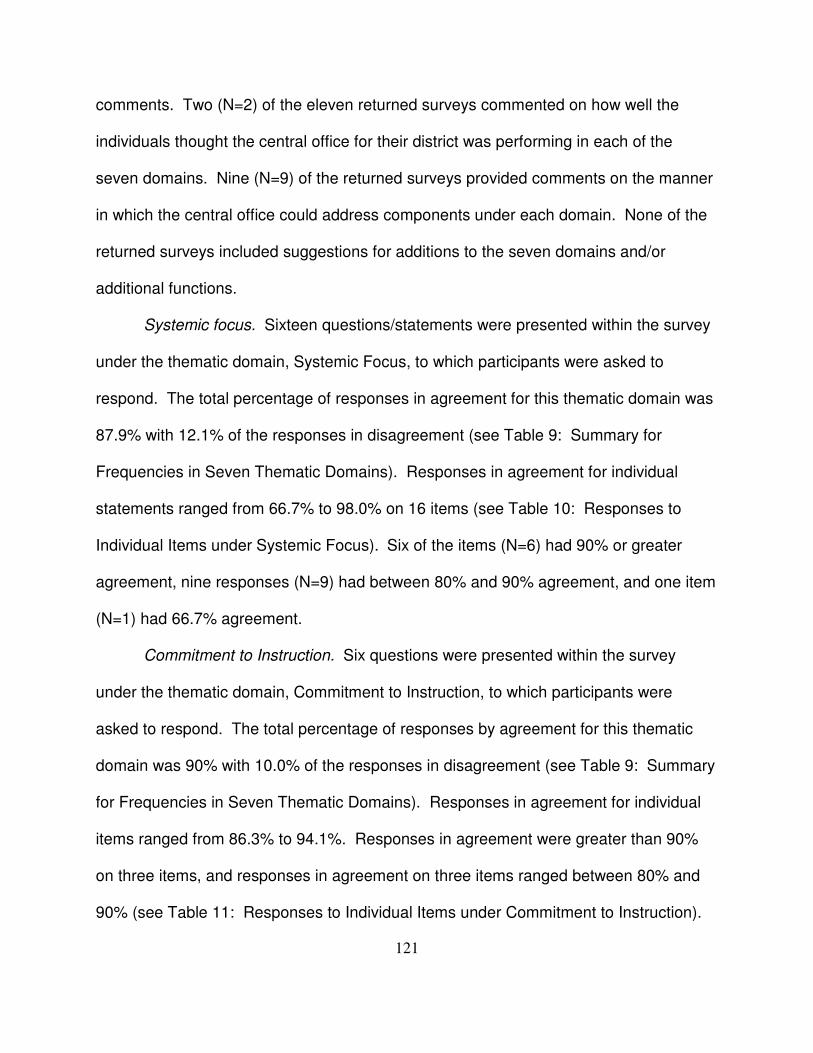
121
comments. Two (N=2) of the eleven returned surveys commented on how well the
individuals thought the central office for their district was performing in each of the
seven domains. Nine (N=9) of the returned surveys provided comments on the manner
in which the central office could address components under each domain. None of the
returned surveys included suggestions for additions to the seven domains and/or
additional functions.
Systemic focus. Sixteen questions/statements were presented within the survey
under the thematic domain, Systemic Focus, to which participants were asked to
respond. The total percentage of responses in agreement for this thematic domain was
87.9% with 12.1% of the responses in disagreement (see Table 9: Summary for
Frequencies in Seven Thematic Domains). Responses in agreement for individual
statements ranged from 66.7% to 98.0% on 16 items (see Table 10: Responses to
Individual Items under Systemic Focus). Six of the items (N=6) had 90% or greater
agreement, nine responses (N=9) had between 80% and 90% agreement, and one item
(N=1) had 66.7% agreement.
Commitment to Instruction. Six questions were presented within the survey
under the thematic domain, Commitment to Instruction, to which participants were
asked to respond. The total percentage of responses by agreement for this thematic
domain was 90% with 10.0% of the responses in disagreement (see Table 9: Summary
for Frequencies in Seven Thematic Domains). Responses in agreement for individual
items ranged from 86.3% to 94.1%. Responses in agreement were greater than 90%
on three items, and responses in agreement on three items ranged between 80% and
90% (see Table 11: Responses to Individual Items under Commitment to Instruction).
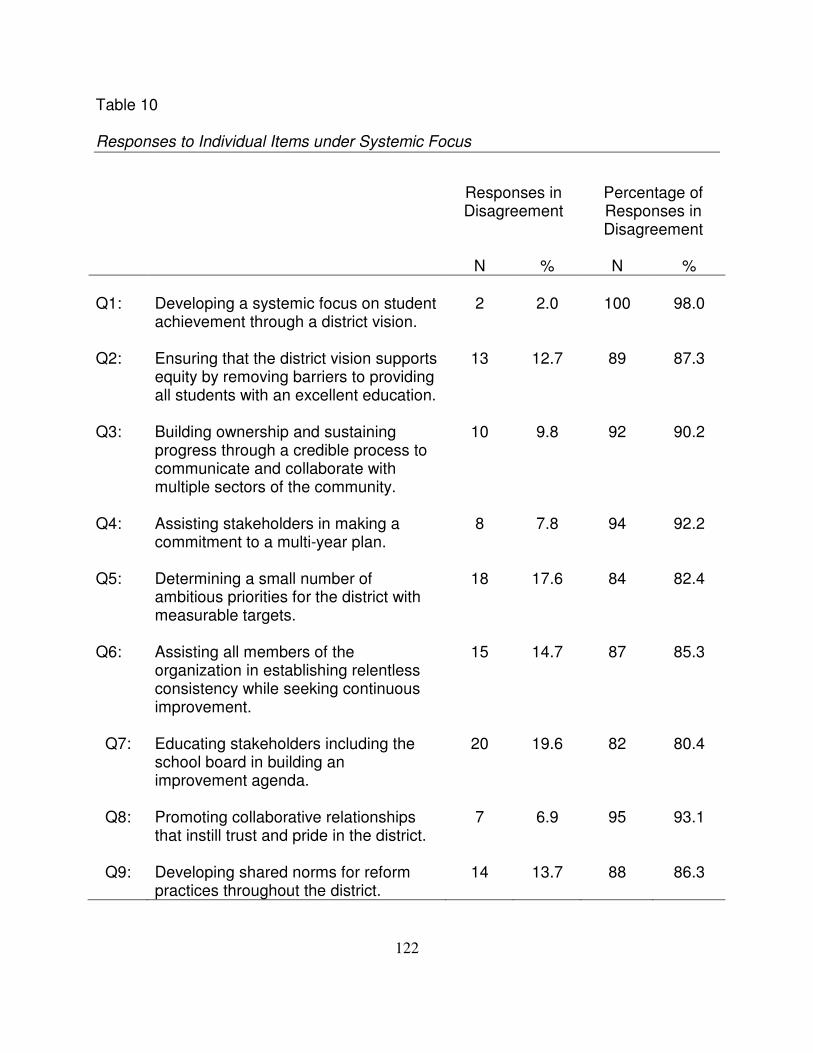
122
Table 10 Responses to Individual Items under Systemic Focus
Responses in Disagreement
Percentage of Responses in Disagreement
N % N % Q1:
Developing a systemic focus on student achievement through a district vision.
2
2.0
100
98.0
Q2: Ensuring that the district vision supports equity by removing barriers to providing all students with an excellent education.
13 12.7 89 87.3
Q3:
Building ownership and sustaining progress through a credible process to communicate and collaborate with multiple sectors of the community.
10 9.8 92 90.2
Q4: Assisting stakeholders in making a commitment to a multi-year plan.
8 7.8 94 92.2
Q5: Determining a small number of ambitious priorities for the district with measurable targets.
18 17.6 84 82.4
Q6: Assisting all members of the organization in establishing relentless consistency while seeking continuous improvement.
15 14.7 87 85.3
Q7: Educating stakeholders including the school board in building an improvement agenda.
20 19.6 82 80.4
Q8: Promoting collaborative relationships that instill trust and pride in the district.
7 6.9 95 93.1
Q9: Developing shared norms for reform practices throughout the district.
14 13.7 88 86.3
123
Table 10 Responses to Individual Items under Systemic Focus (continued)
Responses in Disagreement
Percentage of Responses in Disagreement
N % N %
Q10: Developing processes for holding all staff members accountable to the district vision and goals.
19 18.6 83 81.4
Q11: Developing a problem-solving focus in which problems are viewed as issues to be solved.
15 14.7 87 85.3
Q12: Ensuring policy and program coherence by removing competing programs and requirements.
34 33.3 68 66.7
Q13: Engaging in district-wide, research-based continuous improvement process/cycle.
5 4.9 97 95.1
Q14: Promoting service orientation toward schools and community.
16 15.7 86 84.3
Q15: Coordinating external assistance providers (i.e. technology, professional development, data collection).
19 18.6 83 81.4
Q16: Empowering schools to customize as needed within a district framework.
10 9.8 92 90.2
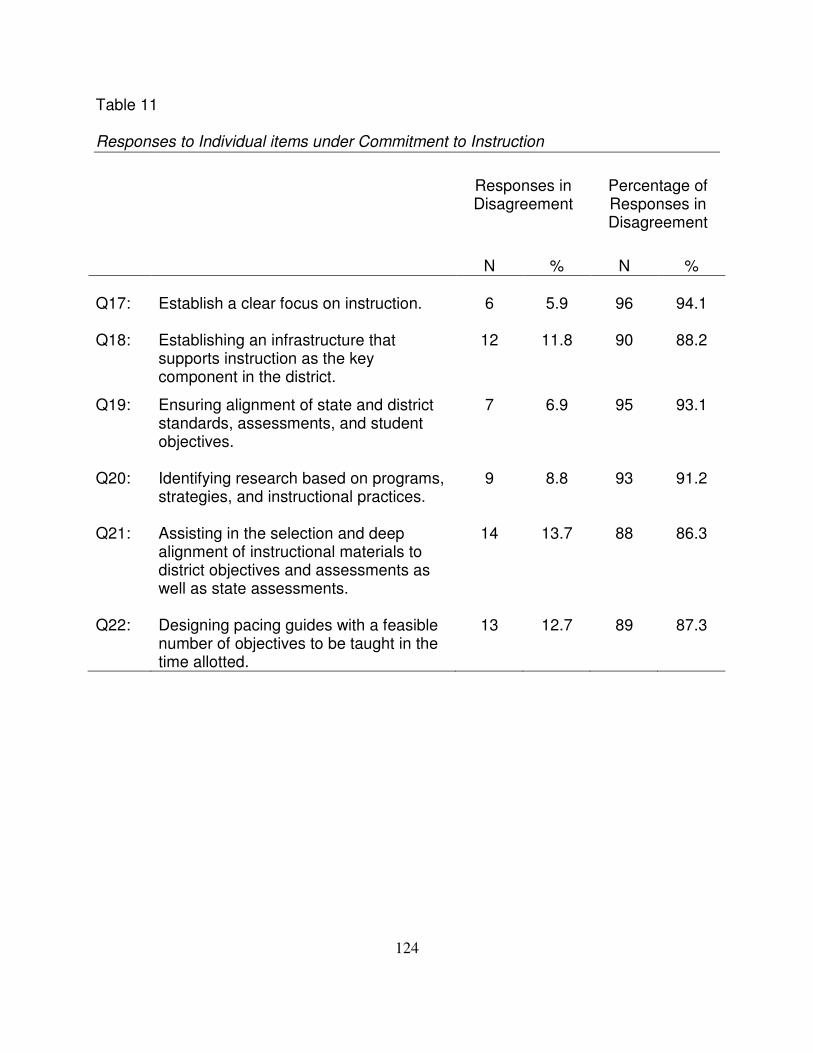
124
Table 11 Responses to Individual items under Commitment to Instruction
Responses in Disagreement
Percentage of Responses in Disagreement
N % N % Q17:
Establish a clear focus on instruction.
6 5.9 96 94.1
Q18: Establishing an infrastructure that supports instruction as the key component in the district.
12
11.8 90
88.2
Q19:
Ensuring alignment of state and district standards, assessments, and student objectives.
7 6.9 95 93.1
Q20: Identifying research based on programs, strategies, and instructional practices.
9 8.8 93 91.2
Q21: Assisting in the selection and deep alignment of instructional materials to district objectives and assessments as well as state assessments.
14 13.7 88 86.3
Q22: Designing pacing guides with a feasible number of objectives to be taught in the time allotted.
13 12.7 89 87.3
125
Use of data to drive decisions. Eleven questions/statements were presented
within the survey under the thematic domain, Use of Data to Drive Decisions, to which
participants were asked to respond. The total percentage of responses by agreement
for this thematic domain was 90% with 10.0% of the responses in disagreement (see
Table 9: Summary for Frequencies in Seven Thematic Domains). Responses in
agreement for individual items ranged from 77.5% to 99.0%. Responses in agreement
were greater than 90% on seven items, between 80% and 90% on two items, and
between 70% and 80% on two items (see Table 12: Responses to Individual Items
under Use of Data to Drive Decisions).
Investment in professional development. Six statements/questions were
presented within the survey under the thematic domain, Investment in Professional
Development, to which participants were asked to respond. The total percentage of
responses by agreement for this thematic domain was 86.8% with 13.2% of responses
in disagreement (see Table 9: Summary for Frequencies in Seven Thematic Domains).
Responses in agreement for individual items ranged from 77.5% to 94.1%. Responses
in agreement were greater than 90% for three items, between 80% and 90% for two
items, and between 70% and 80% for one item (see Table 13: Responses to Individual
Items under Investment in Professional Development).
Leadership development. Six statements/questions were presented within the
survey under the thematic domain, Leadership Development, to which participants were
asked to respond. The total percentage of responses by agreement for this thematic
domain was 83.7% with 16.3% in disagreement (see Table 9: Summary for
Frequencies in Seven Thematic Domains). Responses in agreement for individual
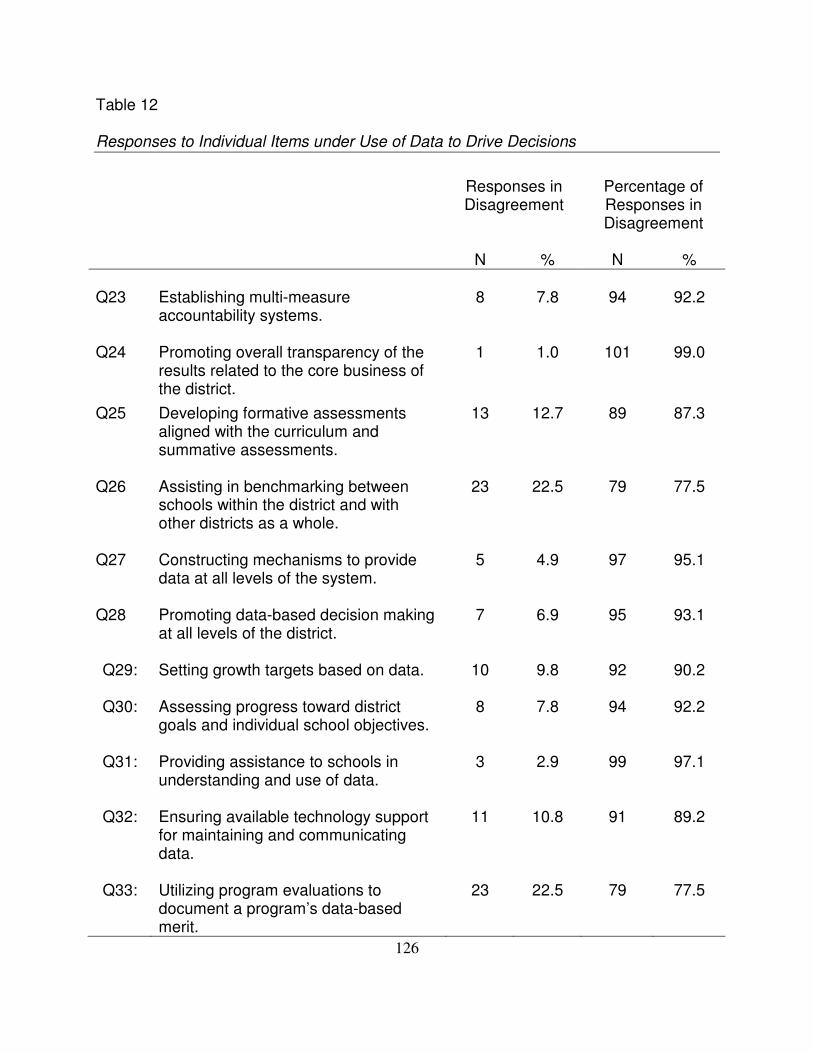
126
Table 12 Responses to Individual Items under Use of Data to Drive Decisions
Responses in Disagreement
Percentage of Responses in Disagreement
N % N % Q23
Establishing multi-measure accountability systems.
8 7.8 94 92.2
Q24 Promoting overall transparency of the results related to the core business of the district.
1
1.0 101
99.0
Q25
Developing formative assessments aligned with the curriculum and summative assessments.
13 12.7 89 87.3
Q26 Assisting in benchmarking between schools within the district and with other districts as a whole.
23 22.5 79 77.5
Q27 Constructing mechanisms to provide data at all levels of the system.
5 4.9 97 95.1
Q28 Promoting data-based decision making at all levels of the district.
7 6.9 95 93.1
Q29: Setting growth targets based on data.
10 9.8 92 90.2
Q30: Assessing progress toward district goals and individual school objectives.
8 7.8 94 92.2
Q31: Providing assistance to schools in understanding and use of data.
3 2.9 99 97.1
Q32: Ensuring available technology support for maintaining and communicating data.
11 10.8 91 89.2
Q33: Utilizing program evaluations to document a program’s data-based merit.
23 22.5 79 77.5
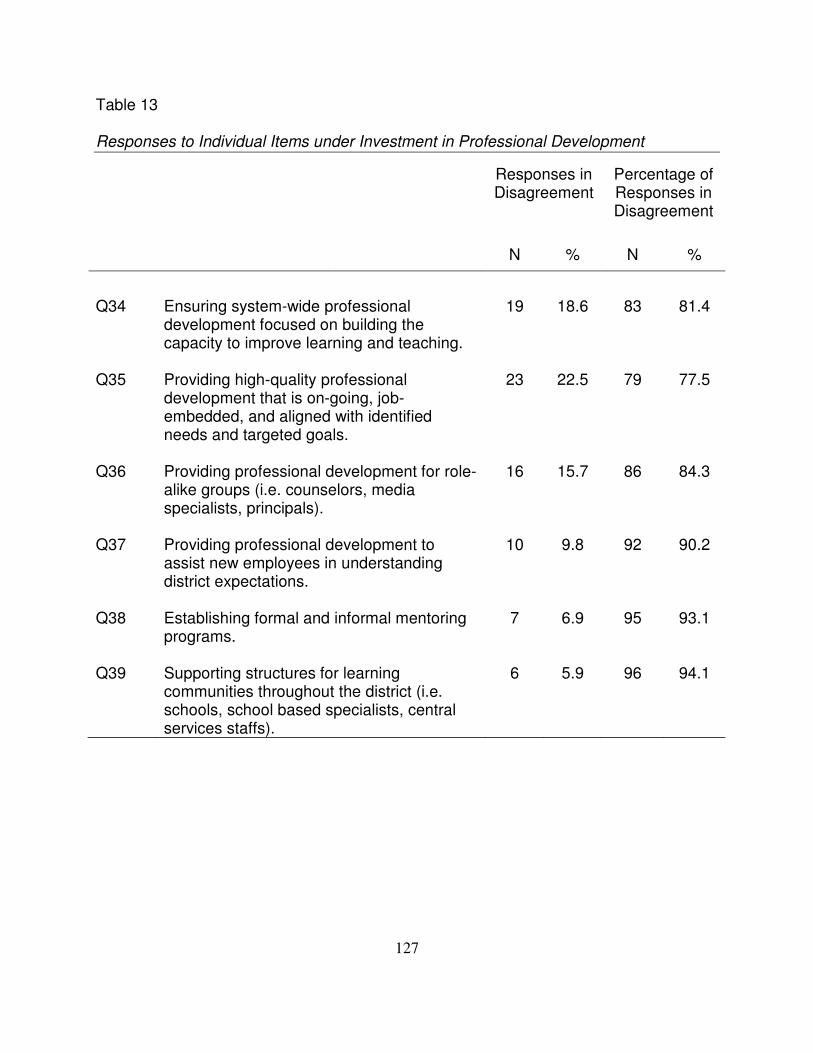
127
Table 13 Responses to Individual Items under Investment in Professional Development
Responses in Disagreement
Percentage of Responses in Disagreement
N % N %
Q34
Ensuring system-wide professional development focused on building the capacity to improve learning and teaching.
19 18.6 83 81.4
Q35 Providing high-quality professional development that is on-going, job-embedded, and aligned with identified needs and targeted goals.
23
22.5 79
77.5
Q36
Providing professional development for role-alike groups (i.e. counselors, media specialists, principals).
16 15.7 86 84.3
Q37 Providing professional development to assist new employees in understanding district expectations.
10 9.8 92 90.2
Q38 Establishing formal and informal mentoring programs.
7 6.9 95 93.1
Q39 Supporting structures for learning communities throughout the district (i.e. schools, school based specialists, central services staffs).
6 5.9 96 94.1

128
items ranged from 74.5% to 89.2%. Five of the items had responses in agreement
between 80% and 90% and one item had responses in agreement between 70% and
80% (see Table 14: Responses to Individual Items under Leadership Development).
Optimal use of human and financial resources. Five statements/questions were
presented within the survey under the thematic domain, Optimal Use of Human and
Financial Resources, to which participants were asked to respond. The percentage of
responses by agreement for this thematic domain was 86.5% with 13.5% in
disagreement (see Table 9: Summary for Frequencies in Seven Thematic Domains).
Responses in agreement for individual items ranged from 76.5% to 93.1%. Responses
in agreement were greater than 90% for two items, between 80% and 90% for two
items, and between 70% and 80% for one item (see Table 15: Responses to Individual
Items under Optimal Use of Human and Financial Resources).
Identification of intervention strategies. Five statements/questions were
presented within the survey under the thematic domain, Identification of Intervention
Strategies, to which participants were asked to respond. The total percentage of
responses by agreement for this thematic domain was 82.5% with 17.5% in
disagreement (see Table 9: Summary for Frequencies in Seven Thematic Domains).
Responses in agreement for individual items ranged from 76.5% to 88.2%. Four items
had agreement between 80% and 90% and one item had agreement between 70% and
80%. (see Table 16: Responses to individual items under Identification of Intervention
Strategies).
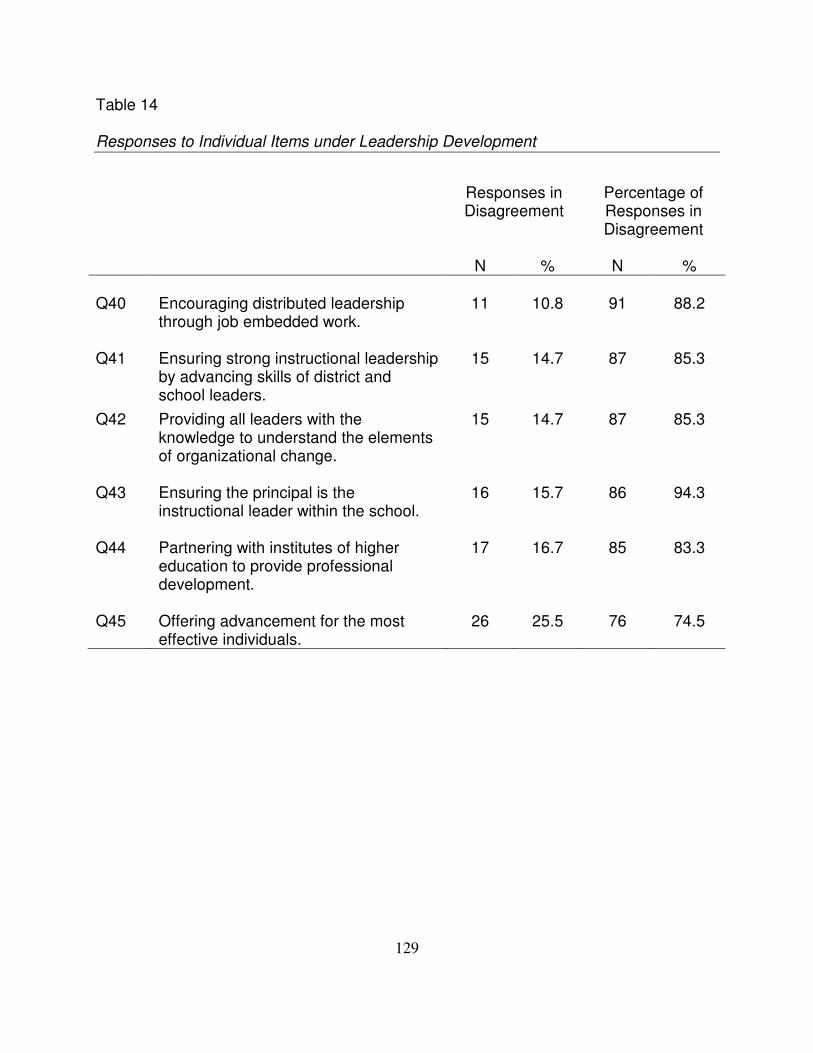
129
Table 14 Responses to Individual Items under Leadership Development
Responses in Disagreement
Percentage of Responses in Disagreement
N % N % Q40
Encouraging distributed leadership through job embedded work.
11 10.8 91 88.2
Q41 Ensuring strong instructional leadership by advancing skills of district and school leaders.
15
14.7 87
85.3
Q42
Providing all leaders with the knowledge to understand the elements of organizational change.
15 14.7 87 85.3
Q43 Ensuring the principal is the instructional leader within the school.
16 15.7 86 94.3
Q44 Partnering with institutes of higher education to provide professional development.
17 16.7 85 83.3
Q45 Offering advancement for the most
effective individuals. 26 25.5 76 74.5
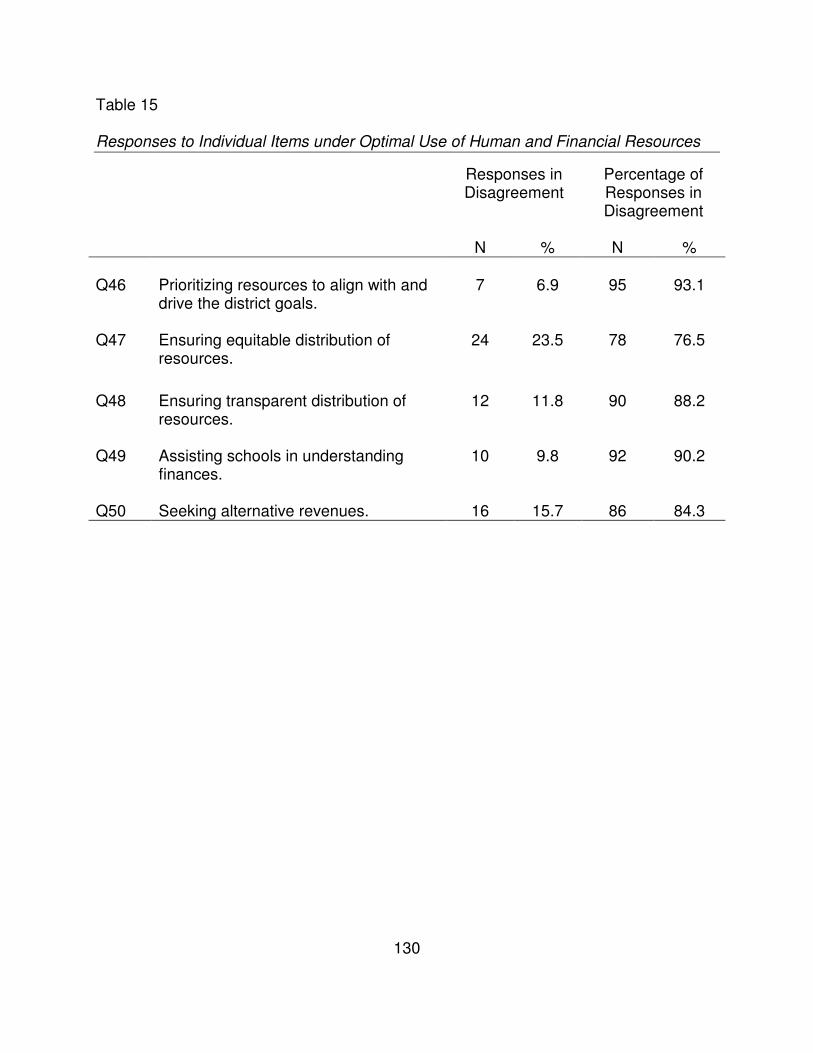
130
Table 15 Responses to Individual Items under Optimal Use of Human and Financial Resources
Responses in Disagreement
Percentage of Responses in Disagreement
N % N % Q46
Prioritizing resources to align with and drive the district goals.
7 6.9 95 93.1
Q47 Ensuring equitable distribution of
resources. 24 23.5 78 76.5
Q48
Ensuring transparent distribution of resources.
12 11.8 90 88.2
Q49 Assisting schools in understanding finances.
10 9.8 92 90.2
Q50 Seeking alternative revenues. 16 15.7 86 84.3
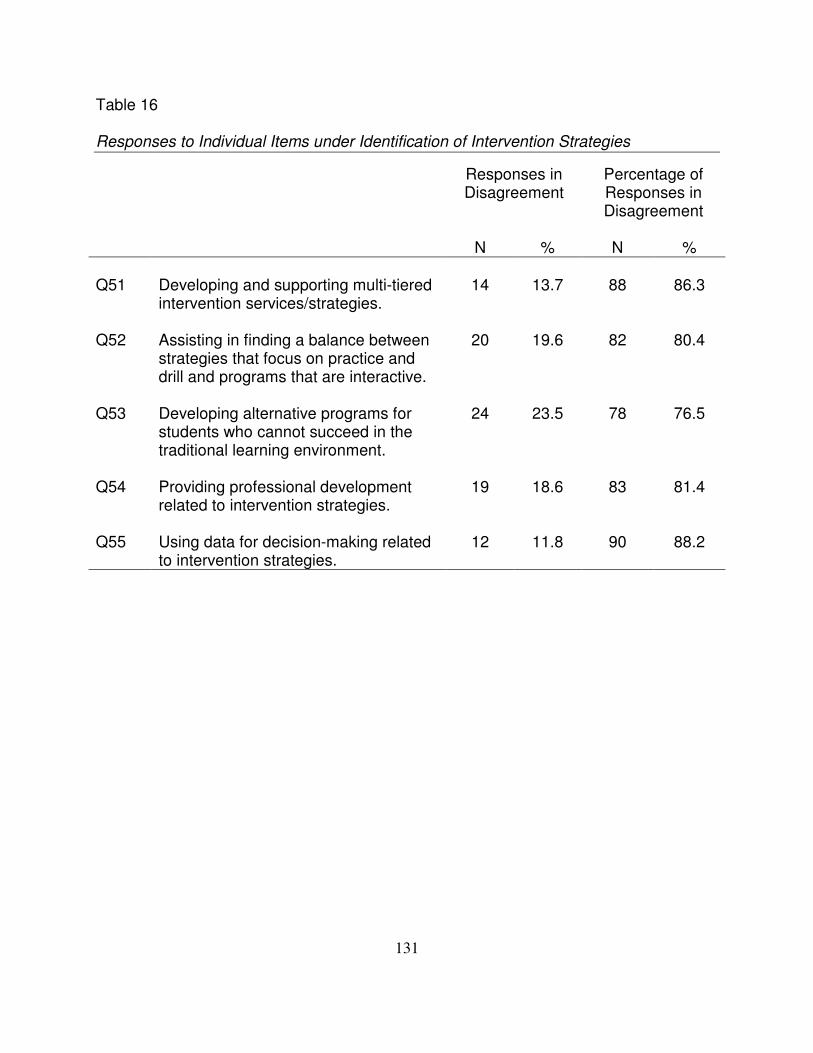
131
Table 16 Responses to Individual Items under Identification of Intervention Strategies
Responses in Disagreement
Percentage of Responses in Disagreement
N % N % Q51
Developing and supporting multi-tiered intervention services/strategies.
14 13.7 88 86.3
Q52 Assisting in finding a balance between strategies that focus on practice and drill and programs that are interactive.
20
19.6 82
80.4
Q53
Developing alternative programs for students who cannot succeed in the traditional learning environment.
24 23.5 78 76.5
Q54 Providing professional development related to intervention strategies.
19 18.6 83 81.4
Q55 Using data for decision-making related to intervention strategies.
12 11.8 90 88.2
132
Research Question #2 The second research question stated: Is there a statistical relationship between
the perceptions of principals of schools that made AYP and principals of schools that
did not make AYP? The following null hypotheses were investigated:
H01: There is no statistical relationship between perceptions of the district’s role
in maintaining a systemic focus among principals of schools that made AYP and
principals of schools that did not make AYP.
H02: There is no statistical relationship between perceptions of the district’s role
in maintaining a commitment to instruction among principals of schools that
made AYP and principals of schools that did not make AYP.
H03: There is no statistical relationship between perceptions of the district’s role
in the use of data to drive decisions among principals of schools that made AYP
and principals of schools that did not make AYP.
H04: There is no statistical relationship between perceptions of the district’s role
in the investment in professional development among principals of schools that
made AYP and principals of schools that did not make AYP.
H05: There is no statistical relationship between perceptions of the district’s role
in promoting leadership development among principals of schools that made
AYP and principals of schools that did not make AYP.
H06: There is no statistical relationship between perceptions of the district’s role
in the optimal use of human and financial resources among principals of schools
that made AYP and principals of schools that did not make AYP.
133
H07: There is no statistical relationship between perceptions of the district’s role
in the identification of intervention strategies among principals of schools that
made AYP and principals of schools that did not make AYP.
Fisher’s Exact Tests. In order to address the second research question, seven
Fisher’s exact tests were performed to examine the relationship between principals’
perceptions in schools that met AYP and principals’ perceptions in schools that did not
meet AYP regarding the district’s role in maintaining a systemic focus, commitment to
instruction, use of data to drive decisions, investment in professional development,
focus on leadership development, optimal use of human and financial resources, and
identification of intervention strategies.
Fisher’s exact test is a statistical, nonparametric test used to analyze categorical
data (Sheskin, 2007). The Fisher’s exact test computes the probability of getting a table
as strong as the observed table (Salkind, 2005). A 2x2 table is used to compute the
exact probability, thus comparing two variables, each with two categories (Salkind,
2005). For this study, the Fisher’s exact tests were used to compare the responses of
principals (agree, disagree) for each thematic domain with the NCLB status of the
school they represented (met AYP, did not meet AYP). The Fisher exact test of
significance was chosen as the statistic of analysis in place of the more commonly used
Chi-square test. An assumption of the Chi-Square Test for Independence is that the
expected frequencies in a 2x2 table are at least 5 (Salkind, 2005). Depending on the
number of principals that responded and how they responded, unequal distribution in
the 2x2 frequency table resulting in a cell size of less than 5 responses was a
possibility. Having a cell size of less than 5 would violate one of the assumptions for

134
using Chi-Square; therefore, the Fisher’s exact test was used in place of the Chi-Square
Test for Independence.
The Fisher’s exact test was used to ascertain the frequency of distribution of
principals’ perceptions regarding the functions of the central office in increasing
achievement for all students based on two categorical variables: (1) agreement or
disagreement on statements defining the role of central services; and (2) met/not met
for AYP. A total of 7 two-tailed Fisher’s exact tests were conducted at the .05
significance level, or p < .05, which is generally accepted by researchers (Creswell,
2005). The results of the Fisher’s exact tests show that a statistical relationship did not
exist between the perceptions of principals in schools that met AYP and principals in
schools that did not make AYP (see Table 17: Results of Fisher’s exact tests).
Hypotheses.
H01: A statistical relationship did not exist between perceptions of the district’s
role in maintaining a systemic focus among principals of schools that made AYP
and principals of schools that did not make AYP. The results of the Fisher’s
exact test showed no significant association between the perceptions of the
district’s role in maintaining a systemic focus among principals of schools that
made AYP and principals of schools that did not make AYP (p=1.000, two-tailed
Fisher’s exact test) (see Table 17: Result of Fisher’s Exact Tests). Therefore,
H01 was accepted.
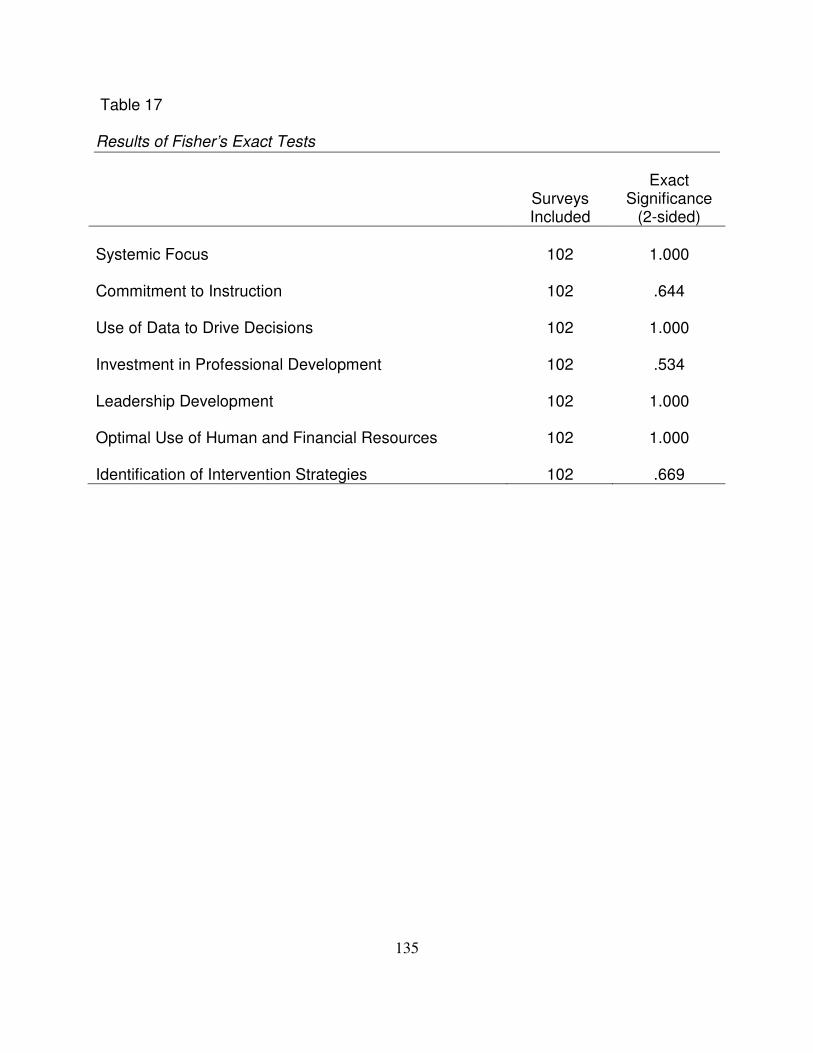
135
Table 17
Results of Fisher’s Exact Tests
Surveys Included
Exact Significance
(2-sided)
Systemic Focus
102 1.000
Commitment to Instruction
102 .644
Use of Data to Drive Decisions
102 1.000
Investment in Professional Development
102 .534
Leadership Development
102 1.000
Optimal Use of Human and Financial Resources
102 1.000
Identification of Intervention Strategies 102 .669

136
H02: A statistical relationship did not exist between perceptions of the district’s
role in maintaining a commitment to instruction among principals of schools that
made AYP and principals of schools that did not make AYP. The results of the
Fisher’s exact test showed no significant association between the perceptions of
the district’s role in maintaining a commitment to instruction among principals of
schools that made AYP and principals of schools that did not make AYP
(p=.644, two-tailed Fisher’s Exact Test) (see Table 17: Result of Fisher’s Exact
Tests). Therefore, H02 was accepted.
H03: A statistical relationship did not exist between perceptions of the district’s
role in the use of data to drive decisions among principals of schools that made
AYP and principals of schools that did not make AYP. The results of the Fisher’s
exact test showed no significant association between the perceptions of the
district’s role in the use of data to drive decisions among principals of schools
that made AYP and principals of schools that did not make AYP (p=1.000, two-
tailed Fisher’s Exact Test) (see Table 17: Result of Fisher’s Exact Tests).
Therefore, H03 was accepted.
H04: A statistical relationship did not exist between the perceptions of the
district’s role in the investment in professional development among principals of
schools that made AYP and principals of schools that did not make AYP. The
results of the Fisher’s exact test showed no significant association between the
perceptions of the district’s role in the investment in professional development
among principals of schools that made AYP and principals of schools that did not

137
make AYP (p=.534, two-tailed Fisher’s Exact Test) (see Table 17: Result of
Fisher’s Exact Tests). Therefore, H04 was accepted.
H05: A statistical relationship did not exist between perceptions of the district’s
role in promoting leadership development among principals of schools that made
AYP and principals of schools that did not make AYP. The results of the Fisher’s
exact test showed no significant association between the perceptions of the
district’s role in promoting leadership development among principals of schools
that made AYP and principals of schools that did not make AYP (p=1.000 two-
tailed Fisher’s Exact Test) (see Table 17: Result of Fisher’s Exact Tests).
Therefore, H05 was accepted.
H06: A statistical relationship did not exist between perceptions of the district’s
role in the optimal use of human and financial resources among principals of
schools that made AYP and principals of schools that did not make AYP. The
results of the Fisher’s exact test showed no significant association between the
perceptions of the district’s role in the optimal use of human and financial
resources among principals of schools that made AYP and principals of schools
that did not make AYP (p=1.000, two-tailed Fisher’s Exact Test) (see Table 17:
Result of Fisher’s Exact Tests). Therefore, H06 was accepted.
H07: A statistical relationship did not exist between perceptions of the district’s
role in the identification of intervention strategies among principals of schools that
made AYP and principals of schools that did not make AYP. The results of the
Fisher’s exact test showed no significant association between the perceptions of
the district’s role in the identification of intervention strategies among principals of
138
schools that made AYP and principals of schools that did not make AYP (p=.669,
two-tailed Fisher’s Exact Test) (see Table 17: Result of Fisher’s Exact Tests).
Therefore, H07 was accepted.
Focus Group Interview
After surveys were returned, participants were invited to participate in a focus
group. A focus group interview is an interview with a small group of people on a specific
topic (Patton, 2002). The purpose of the focus group was to further explore the level of
consensus among responses on the survey (see Appendix F: Focus Group Questions).
Convenience sampling was the method of identifying participants for the focus
group. Due to conflicts in schedules and the time of the year in which the survey and
focus group were conducted, finding a time and location that best served all participants
became difficult. After a date and time for the focus group interview had been
determined, the date was changed due to a conflict in a district meeting which required
all principals to be in attendance.
Prior to the focus group, participants were asked to sign the Principal’s Consent
Form to Participate in the Focus Group (see Appendix A: Institutional Review Board
Approval Letter). During the interview, written notes were taken and the discussion was
recorded. Even though participants signed a consent form, participants were reminded
verbally that the session would be recorded and quotations could potentially be utilized
within the study.
The focus group interview reaffirmed the findings from the survey. The
participants agreed that each of the seven thematic domains included in the survey
were critical functions of the central office. Within chapter 5, additional information

139
related to responses is included. Selected quotations are included that add further
explanation to the responses.
In addition, the focus group offered several suggestions for related studies.
While these suggestions mainly related to administering the survey to different groups
and comparing the results, there was one suggestion for further exploration of the
thematic domain, Identification of Intervention Strategies. These suggestions are
discussed under Implications and Recommendations for Further Study.
Summary
This chapter included detailed analyses of data associated with this study.
Before addressing the research questions and the null hypotheses, this study assessed
the reliability of each of the seven thematic domains by calculating the Cronbach’s
Alpha Test for Reliability. The results for each of the thematic domains ranged from .706
to .855 (see Table 8: Reliability Coefficient), which is considered an acceptable to good
range. These results suggested that items on the survey within each of the thematic
domains represent one dimension.
Responses to the items on the survey were used to answer the first research
question: Which district functions do principals believe are essential in improving
achievement for all students: systemic focus, commitment to instruction, use of data to
drive decisions, investment in professional development, leadership development,
optimal use of human and financial resources, and identification of intervention
strategies? The total percentage of responses for each thematic domain showed that
80% or more of participants completing the survey agreed that each thematic domain
was an essential function for the central office in improving achievement for all students.
140
Principals were also provided with space on the survey for making suggestions,
including deletions and/or additions. While eleven (N=11) of the total surveys (N=102)
included comments, none of the comments included suggestions for additions or
deletions to the functions for the central office as identified in chapter 2.
To answer the second research question, a total of seven two-tailed Fisher’s
exact tests were conducted at a .05 significance level: Is there a statistical relationship
between the perceptions of principals of schools that made AYP and principals of
schools that did not make AYP? As a result, all seven of the null hypotheses were
accepted. A discussion of implications, recommendations for practice and
recommendations for future studies are included in chapter 5.
CHAPTER 5: DISCUSSION AND RECOMMENDATIONS
Summary
As districts seek to re-examine the relationship between the school and the
central office (Darling-Hammond & Friedlaender, 2008; Dufour, 2007; Guskey, 2007;
Honig & Copland, 2008; Protheroe, 2008; Rorrer et al., 2008), additional research is
needed to define the role of the central office (Fullan, 1991; Honig & Copland, 2008;
MacIver & Farley-Ripple, 2008; Pajak et al., 1998). A theoretical framework outlining
the functions of the central office was included in chapter 2. The purpose of this study
was to add to the limited research by determining whether principals agreed or
disagreed with the domains identified within the framework, and then to determine if
there was a relationship between perceptions of principals in schools that met Adequate
Yearly Progress (AYP) under No Child Left Behind (NCLB) and schools that did not
meet AYP under NCLB.
The study addressed the following research questions:
1. Which district functions do principals believe are essential in improving
achievement for all students: systemic focus, commitment to instruction, use
of data to drive decisions, investment in professional development, leadership
development, optimal use of human and financial resources, and identification
of intervention strategies?
2. Is there a statistical relationship between the perceptions of principals of
schools that made AYP and principals of schools that did not make AYP?
142
In addition, this study investigated seven null hypotheses:
H01: There is no statistical relationship between perceptions of the district’s role
in maintaining a systemic focus among principals of schools that made AYP and
principals of schools that did not make AYP.
H02: There is no statistical relationship between perceptions of the district’s role
in maintaining a commitment to instruction among principals of schools that
made AYP and principals of schools that did not make AYP.
H03: There is no statistical relationship between perceptions of the district’s role
in the use of data to drive decisions among principals of schools that made AYP
and principals of schools that did not make AYP.
H04: There is no statistical relationship between perceptions of the district’s role
in the investment in professional development among principals of schools that
made AYP and principals of schools that did not make AYP.
H05: There is no statistical relationship between perceptions of the district’s role
in promoting leadership development among principals of schools that made
AYP and principals of schools that did not make AYP.
H06: There is no statistical relationship between perceptions of the district’s role
in the optimal use of human and financial resources among principals of schools
that made AYP and principals of schools that did not make AYP.
H07: There is no statistical relationship between perceptions of the district’s role
in the identification of intervention strategies among principals of schools that
made AYP and principals of schools that did not make AYP.
143
Assumptions
This study made the following assumptions:
1. It was assumed that principals participating in the study would be honest and
forthright in responding to statements on the survey.
2. It was assumed that principals participating in the study had some knowledge
of the role of the central office in improving student achievement.
Participants
A large, urban district located in the Southeast was the setting for the study. One
hundred and fifty-one principals were invited to participate in the study. Out of the
eligible participants (N=151), 67.5% returned surveys (N=102). Forty-one surveys or
40.2% represented schools that did not make Adequate Yearly Progress (AYP). Sixty-
one surveys or 59.8% represented schools that did make AYP (See Table 7: AYP
Status of Schools Represented by Participants). These percentages paralleled the
overall percentages for AYP within the district in which the study was conducted.
During the 2008-2009 school year, 62.8% of the schools within the district made
Adequate Yearly Progress (AYP) and 37.2% did not make AYP (see Table 6:
Comparison of AYP Status for District and AYP Status for Study).
Survey
A survey was developed to include a synthesis of the research related to the
functions of the central office essential for improving achievement for all students. The
survey consisted of 55 items (see Table 5: Number of Items within Survey).
Participants were asked whether they agreed or disagreed with each statement. At the
144
end of the survey, participants were given the opportunity to make comments including
additions and/or deletions to the survey.
In order to determine internal consistency reliability on the survey, Cronbach’s
Alpha or Reliability Coefficient (Garson, 2008) was computed for each of the 7 thematic
domains. These tests evaluated whether the items within one domain on the survey
were consistent with one another and if they represented one, and only one dimension
or area of interest (Garson, 2008; Gliem & Gliem, 2003; Salkind, 2005; Santos, 1991).
Alpha coefficient ranges in value from 0 to 1 (Santo, 1999). A value of .70 or higher is
generally accepted as the cut-off for a set of items to be considered a scale (Garson,
2008; Gliem & Gliem, 2003; Santos, 1991).
Results of Cronbach’s Alpha Test for Reliability for each of the seven thematic
domains within this study ranged from .706 to .855 (see Table 8: Reliability Coefficient).
These results fall within an acceptable to good range, which suggested that items within
each of the thematic domains were consistent in that they represented one dimension
Gliem and Gliem (2003).
Findings and Discussion
The study included two research questions. Each question was addressed
separately. In addition to the findings from the survey, relevant information obtained
during the focus group session was also included in the discussion.
Research Question #1 The first research question stated: Which district functions do principals believe
are essential in improving achievement for all students: systemic focus, commitment to
instruction, use of data to drive decisions, investment in professional development,
145
leadership development, optimal use of human and financial resources, and
identification of intervention strategies? The total percentage of responses in
agreement for each thematic domain was 82.5% or greater for participants completing
the survey. The thematic domains that received the highest percentage of responses in
agreement were Commitment to Instruction and Use of Data to Drive Decisions. In
each of these domains, 90% of the participants agreed that these functions were
essential to improving achievement for all students. The thematic domain that received
the lowest percentage of responses in agreement was Identification of Intervention
Strategies with 82.5% of the survey participants in agreement. Due to recent changes
within the district, principals within the focus group interview commented that the
uncertainty in student assignments and how intervention may be determined contributed
to the lower percentage.
Figure 5, Percentages of Responses, clearly reveals a pattern in which the
majority of the principals participating in the survey agreed that the seven thematic
domains are essential in improving achievement for all students. In addition, the trend
lines show that the gap between principals who agreed and principals who disagreed
remained consistent. This pattern suggests that principals are in agreement with the
emerging research, which warns that the school does not exist in seclusion and cannot
be expected to lead the charge alone (Daresh, 2004; Hargreaves, 1997; Hatch, 2009;
Honig & Copland, 2008; Le Floch, Carlson, Taylor, & Thomsen, 2006; Markward, 2008;
Protheroe, 2008; Rallis & Highsmith, 1986; Togneri & Anderson, 2003a).
On the survey, principals were provided with space for making suggestions. Out
of one hundred and two returned surveys (N=102), eleven (N=11) surveys were

146
Figure 5. Percentages of responses.
0
20
40
60
80
100
Disagree 13.8 10 10 13.2 16.3 13.5 17.5
Agree 86.2 90 90 86.8 83.7 86.5 82.5
1 2 3 4 5 6 7

147
returned with written comments. Two of the surveys (N=2) included comments praising
the central office in the district in which the principals were employed. Nine of the
surveys (N=9) included comments expanding on items included within the survey.
None of the participants offered suggestions for additions or deletions to the survey
In the focus group, participants were also asked if there were functions of the
central office that should have been added to or deleted from the survey. All of the
participants agreed that the survey was complete and did not suggest any additions or
deletions. One participant summarized the responses of the focus group participants:
All of these functions are critical. If the central office does not handle these
areas, then it falls back to the school. We really do not have the time to address
these areas. Even as an experienced principal, I feel should be provided in
most of these areas (Focus Group Participant).
Systemic focus. Under Systemic Focus, the total percentage of responses in
agreement was 86.2% with 13.8% of the responses in disagreement (see Table 9:
Summary for Frequencies in Seven Thematic Domains). Responses in agreement for
individual statements ranged from 66.7% to 98.0% (see Table 10: Responses to
Individual Items under Systemic Focus).
One item (N=1) had an agreement of 66.7%, which was the lowest for all items
within the survey. This item stated: “In your opinion, do you think the central office,
through systemic focus, helps increase student achievement by ensuring policy and
program coherence by removing competing programs and requirements.” This
response rate was explored further within the focus group. Participants were asked why
this statement may have had lower agreement than other items within this thematic
148
domain. One participant responded, “I believe that most principals understand the need
for removing competing programs; however, as they (principals) answered they were
thinking about the possibility of losing flexibility.” Participants said the current economic
situation as well as recent changes within their district influenced responses. When
asked if this item should be removed from the survey, and thus, removed from the
thematic framework, all principals within the focus group agreed that it should not be
removed, including one of the participants who admitted answering that he had marked
“Disagree” to this statement.
Commitment to instruction. Under the domain, Commitment to Instruction, the
total percentage of responses by agreement was 90% with 10.0% of the responses in
disagreement (see Table 9: Summary for Frequencies in Seven Thematic Domains).
Responses in agreement for individual items ranged from 86.3% to 94.1% (see Table
11: Responses to Individual Items under Commitment to Instruction). The general
consensus among the focus group supported the survey results. There was agreement
that this thematic domain accurately reflected the role of the central office.
Use of data to drive decisions. Under the thematic domain, Use of Data to Drive
Decisions, the total percentage of responses by agreement was 90% with 10.0% of the
responses in disagreement (see Table 9: Summary for Frequencies in Seven Thematic
Domains). Responses in agreement for individual items ranged from 77.5% to 99.0%
(see Table 12: Responses to Individual Items under Use of Data to Drive Decisions).
The general consensus among the focus groups was that this domain was critical to
improving student achievement, which was supported by the survey results.
149
Investment in professional development. Under the thematic domain, Investment
in Professional Development, the total percentage of responses by agreement was
86.8% with 13.2% of responses in disagreement (see Table 9: Summary for
Frequencies in Seven Thematic Domains). Responses in agreement for individual
items ranged from 77.5% to 94.1% (see Table 13: Responses to Individual Items under
Investment in Professional Development). The general consensus among the focus
groups was that this domain was critical to improving student achievement, which was
supported by the survey results.
Leadership development. Under the thematic domain, Leadership Development,
the total percentage of responses by agreement was 83.7% with 16.3% in disagreement
(see Table 9: Summary for Frequencies in Seven Thematic Domains). Responses in
agreement for individual items ranged from 74.5% to 89.2% (see Table 14: Responses
to Individual Items under Leadership Development). The general consensus among the
focus groups was that this domain was critical to improving student achievement, which
was supported by the survey results.
Optimal use of human and financial resources. Under the thematic domain,
Optimal Use of Human and Financial Resources, the percentage of responses by
agreement was 86.5% with 13.5% in disagreement (see Table 9: Summary for
Frequencies in Seven Thematic Domains). Responses in agreement for individual
items ranged from 76.5% to 93.1% (see Table 15: Responses to Individual Items under
Optimal Use of Human and Financial Resources). The general consensus among the
focus groups was that this domain was critical to improving student achievement, which
was supported by the survey results.
150
Identification of intervention strategies. Under the thematic domain, Identification
of Intervention Strategies, the total percentage of responses by agreement was 82.5%
with 17.5% in disagreement (see Table 9: Summary for Frequencies in Seven
Thematic Domains). Responses in agreement for individual items ranged from 76.5%
to 88.2% (see Table 16: Responses to Individual Items under Identification of
Intervention Strategies). The general consensus among the focus group was that this
domain was critical to improving student achievement, which was supported by the
survey results. However, one participant suggested an expansion of this domain. As a
principal of a magnet school, he felt that this area should include enrichment.
While the research within this study did not identify enrichment as a critical role of
the central office for improving achievement, acceleration was addressed in chapter 2,
under Support Multi-Tiered Intervention. The work of Chafin (2005) and Louis et al.
(2009) emphasized multi-tiered intervention services as critical for prevention but also
for differentiating instruction required in providing acceleration. In addition, a publication
from the Center of Comprehensive School Reform and Improvement reported at-risk
students as often being placed in programs focused on practice and drill, and
accelerated students were provided more interactive, “learning for learning’s sake”
courses. Chafin (2005) further suggested a better balance, citing accelerated students
as often the students that needed skills related to how to complete assignments and at-
risk students needed courses demonstrating that education can be fun.
Research Question #2
The second research question stated: Is there a statistical relationship between
the perceptions of principals in schools that made AYP and principals of schools that did
151
not make AYP? Fisher’s Exact Test of Significance was chosen as the statistic of
analysis for addressing this question over Chi-Square Test for Independence because
an assumption of the Chi-Square Test for Independence is that the expected
frequencies in a 2x2 table are at least 5 (Salkind, 2005). Due to the uncertainty related
to the number of principals who would respond and how they would respond, there was
the possibility of creating unequal distribution in the 2x2 frequency table, resulting in a
cell size of less than 5 responses.
The Fisher’s exact test was used to ascertain the frequency of distribution of
principals’ perceptions regarding the functions of the central office in increasing
achievement for all students based on two categorical variables: (1) agreement or
disagreement on statements defining the role of central services; and (2) met or not met
for AYP goals. A total of seven two-tailed Fisher’s exact tests were conducted at the
.05 significance level, or p < .05, which is generally accepted by researchers (Creswell,
2005). A total of seven Fisher’s exact tests were performed, each one examining one of
the null hypotheses. In each case, a statistical relationship did not exist between the
perceptions of principals regarding the district’s role with each thematic domain. As a
result each hypothesis was accepted.
H01: A statistical relationship did not exist between perceptions of principals
regarding the district’s role in maintaining a systemic focus among principals of
schools that made AYP and principals of schools that did not make AYP
(p=1.000, two-tailed Fisher’s exact test) (see Table 17: Result of Fisher’s Exact
Tests).

152
H02: A statistical relationship did not exist between perceptions of principals
regarding the district’s role in maintaining a commitment to instruction among
principals of schools that made AYP and principals of schools that did not make
AYP (p=.644, two-tailed Fisher’s exact test) (see Table 17: Result of Fisher’s
Exact Tests).
H03: A statistical relationship did not exist between perceptions of principals
regarding the district’s role in the use of data to drive decisions among principals
of schools that made AYP and principals of schools that did not make AYP
(p=1.000, two-tailed Fisher’s exact test) (see Table 17: Result of Fisher’s Exact
Tests).
H04: A statistical relationship did not exist between the perceptions of principals
regarding the district’s role in the investment in professional development among
principals of schools that made AYP and principals of schools that did not make
AYP (p=.534, two-tailed Fisher’s exact test) (see Table 17: Result of Fisher’s
Exact Tests).
H05: A statistical relationship did not exist between perceptions of principals
regarding the district’s role in promoting leadership development among
principals of schools that made AYP and principals of schools that did not make
AYP (p=.1.000, two-tailed Fisher’s exact test) (see Table 17: Result of Fisher’s
Exact Tests).
H06: A statistical relationship did not exist between perceptions of principals
regarding the district’s role in the optimal use of human and financial resources
among principals of schools that made AYP and principals of schools that did not
153
make AYP (p=1.000, two-tailed Fisher’s exact test) (see Table 17: Result of
Fisher’s Exact Tests).
H07: A statistical relationship did not exist between perceptions of principals
regarding the district’s role in the identification of intervention strategies among
principals of schools that made AYP and principals of schools that did not make
AYP (p=.669, two-tailed Fisher’s exact test) (see Table 17: Result of Fisher’s
Exact Tests).
Limitations of the Study
The following limitations of the study should be taken into account:
Adequate Yearly Progress (AYP). This study relied heavily on Adequate Yearly
Progress (AYP). AYP continues to receive debate and criticism due to the narrow focus
on test scores (Cavanagh, 2009a; Hargreaves & Shirley, 2008; Lang, 2007; Guzman,
2010).
Working conditions. Other factors within the district and the schools that typically
influence working conditions were not taken into account for this study. Examples of
these factors include time, atmosphere, school leadership, district leadership, facilities,
resources, and teacher involvement (North Carolina State Board of Education, 2009).
Selection criteria for participation in the survey. Participant selection criteria did
not include distinguishing factors such as experience in teaching, longevity in their
current position, or previous administrative positions held in the North Carolina Public
School System or any other state. The participants for this study were based on 2009-
2010 assignments.

154
Participation in focus group. Convenience sampling was the method of
identifying participants for the focus group. Due to conflicts in schedules and the time of
the year in which the survey and focus group were conducted, finding a time and
location that best served all participants became difficult. The date was rescheduled
once due to a change in a district meeting which required all principals to be in
attendance.
Testing data used. Student achievement data used for this study included End-
of-Grade (EOG) tests and End-of-Course (EOC) tests. These tests are used to
measure Adequate Yearly Progress (AYP), which is the reason for their selection. Other
testing data such as Effectiveness Indexes, EVAAS and the State Growth Model were
not used.
Relevance to other districts. Even though the study was limited to one district,
insights can be gleaned by other districts. However, each school district must also
consider its unique characteristics as well as the characteristics of the community that
the district serves.
Implications
The overall results of this bed of research and the related study show that there
is a need for district involvement in increasing achievement for all students. The
literature and research used within this study describe the behaviors of the central office
that will be required in improving student achievement. The responses of principals in
this study confirm the research. Principals agreed on the type of support that is needed
for improving student achievement and welcomed the support.

155
The findings from this study have implications for district leaders, boards of
education, and policy-making bodies as they seek solutions for increasing achievement
within reduced budgets. The findings also have implications for the roles and
relationships between school-based administrators and central office
administrators/supervisors. In addition, institutions of higher education need to consider
the implications for school and central office administrator preparation programs as well
as support that can be provided to states and districts in making this change.
Implications for District Leaders, Boards of Education, and Policy-Making Bodies
Given the findings of this study, district leaders, boards of education, and policy-
making bodies can no longer ignore the reality of the role of district staff in improving
student achievement. They must accept their moral and ethical obligation for the
education of all students, by holding themselves accountable for implementing research
findings of this and other studies which speak to the role of school districts in improving
student achievement. The current research, supported by the findings of this study,
indicates that a systemic, district approach will be required for substantive, sustainable
improvements. Structures will be required that support and develop new relationships
between the school and the central office. Within these relationships, the school should
no longer be expected to shoulder the burden of increasing achievement for all students
alone. Nor should the unique role of the central office in providing support to the school
be ignored.
Furthermore, state and district leaders must be aware of and willing to accept the
difficulties that will be faced in making this change. The lingering image of the
supervisor, well entrenched in history, combined with the current model for school

156
improvement in which the school is the sole source of change must be confronted. In
some cases this change will be applauded, while in many cases it might be viewed as
leading with an ineffective, top-down approach.
This study and the related research identified within the study should be good
news to state boards of education, superintendents, and boards of education choosing
to accept this challenge. The emerging research supported by this study unequivocally
identifies the potential positive role of the central office in improving student
achievement. No longer can the public and/or legislatures act as though the central
office is a meaningless participant in efforts to improve student achievement. However,
recognition of these findings by the public and/or legislatures will mean a new level of
accountability for district leaders in ensuring central office support for increasing
achievement. Accepting this challenge will no longer be an option but rather a
responsibility.
In addition, state boards of education, local boards of education, and district
leaders will be required to do more than just recognize and accept the need for new
roles and relationships between schools and the central office. Well-defined
frameworks including expectations, responsibilities, behaviors, and parameters of
flexibility must be identified for all members of the organization as well as measures for
ensuring accountability. The work of the district leaders cannot stop there but must
consider every facet of the organization for alignment and cohesion. Heeding the
warnings of Fullan (2010), only through alignment and cohesion will collective efficacy
be maximized to achieve results throughout the district (p. 48).

157
Implications for School and Central Office Administrators
This study has implications for school and central office administrators. School
and central office administrators must be willing to move to a new level of cooperation,
shared responsibilities, and accountability with the common vision of increasing
achievement for all students. Not only must they hold each other accountable, but they
must also hold district leaders accountable for initiating and supporting this change. No
longer should principals willingly accept more accountability without the appropriate
knowledge, resources and support, nor should supervisors work silently behind the
scenes to avoid crossing the invisible boundaries between the central office and the
school. A transparent accountability model in which school staffs, the central office
staff, the superintendent, and the boards of education hold each other responsible for
the behaviors and the quality of their performance will be required.
Furthermore, principals and central office administrators must recognize their
unique leadership roles. Through their positions, they shape opinions of teachers and
staffs. By helping others in the organization recognize the benefits of collaborative
efforts between the schools and central office, the full potential of these new roles and
relationships will be realized, thereby improving student achievement.
Implications for Institutions of Higher Education
Institutions of higher education are in the unique position to shape the attitudes of
future school and central office administrators before they enter their positions. Thus,
this study has implications for school administrator and supervision preparation
programs. Through preparation programs, institutions of higher education can promote
new levels of cooperation, increase understanding of the benefits of shared

158
responsibility and accountability, and develop the skills and knowledge that will be
required of future administrators to impact student achievement through a systemic,
collaborative approach.
Given the lack of research related to the central office supervisor, institutions of
higher education also have a responsibility to conduct/sponsor research related to
practices for redesigning the roles and relationship between the school and the central
office. Currently, practice has outpaced research and as more states and districts
accept the challenge of redefining the relationship between the school and the central
office, additional information to guide the process will be required.
Recommendations
The demands of NCLB and stagnated student achievement make this study very
timely and beneficial to education leaders in their decision-making. This section
includes recommendations for practice and identifies areas in which there is a need for
further research.
Recommendations for State-policy Makers, State Boards of Education, and Local
Boards of Education
Revise state and local policies and related regulations and procedures (R&P).
As stated in chapter 2, many states and districts across the nation are still operating
within the confines of policies that support the schools existing in isolation. Many of
these policies were developed over the last twenty years. State-policy makers, state
boards of education, and local boards of education should recognize and remove any
policies and related R&P that impede the ability of districts to increase student
achievement through a district, systemic approach. While this study identifies the power

159
of a systemic district approach, structures that support and develop these new roles and
relationships between the school and the central office will be most effective if they are
supported through the alignment of policies at the state and local levels.
Establish statewide standards of practice. State standards are often in place for
superintendents, principals, and teachers; however, standards are rarely in place for
central office administrators/supervisors. Based on the findings of this study, state
standards addressing the functions/behaviors/practices for central office
administrators/supervisors should be developed. The domains within this bed of
research could serve as the framework for these standards.
Develop statewide assessments for central office standards of practice. State-
policy makers and state boards of education choosing to develop standards of practice
should also consider assessments to hold central office administrators/supervisors
within each district accountable to behaviors that have a positive impact on student
achievement. These assessments should be clearly aligned with standards for practice.
While this information would be useful to districts as they evaluate support
provided for student achievement, this information could also be useful in addressing
turnover rates for school-based administrators. These data would allow districts to
capitalize upon strengths for recruitment and retention purposes and to identify areas in
which improvements are still needed as well. Data would give perspective
administrative candidates an awareness of the strengths at the district level, thereby,
assisting them in determining districts that match their personal strengths and
weaknesses. While assessments for central office performance could prove beneficial
to superintendents and boards of education, comparative data between districts may

160
also serve as another factor to assist in analyzing turnover rates for the state as a
whole.
Include assessment results in state accountability models. While student
achievement must remain at the center of the state accountability models, assessment
results evaluating the performance of each district central office could be a component
included in state accountability models. Rather than basing the district report card
completely on the performance of the schools, implementation of effective district
behaviors/practices could also be included as a component. Including district
assessments of how well they are implementing their role of fostering student
achievement would add a needed dimension to annual district report cards in light of
this research. It would increase transparency for the public and create a sense of
urgency in district leadership for improving the performance of central office staff in the
identified behaviors that increase student achievement.
Recommendations for Practices within Districts
Acknowledge the issues and accept the challenge. District leaders must, first
and foremost, recognize the need the change. This process begins with an open,
honest review of current student achievement as well as expectations for student
achievement.
Provide stakeholders with opportunities to increase awareness of the need for
new roles and relationships. District leaders undertaking change must be keenly aware
of the negative image of the central office, well-embedded in the minds of educators
and the public. The emerging research warns that overcoming this image will be the
major hurdle that districts will face. With this in mind, district leaders must provide

161
opportunities to assist stakeholders, including board members, in accepting and
understanding the benefits of redefining the roles and relationship between the school
and the central office.
Establish clear responsibilities for principals and central office administrators.
District leaders may find themselves in the difficult situation of approaching changes
recommended within the research without state standards. Whether the district must
establish their own standards for the central office administrators/supervisors or can
work within a state established framework, clearly defined functions, behaviors, and
expectations for the central office as well as parameters of flexibility for the schools
should exist. Districts could include functions and practices for the central office that
are aligned under each of the following thematic domains within this study: systemic
focus, commitment to instruction, use of data to drive decisions, investment in
professional development, leadership development, optimal use of human and financial
resources, and identification of intervention strategies. While district leaders will need to
consider the unique characteristics of the community served by the district, districts
must also recognize the interrelatedness of each domain, and the reduced impact of
implementing selected functions in isolation.
Review the organizational structure of the central office. Redefining roles and
relationships between the central office and the school may require changes in the
organizational structure of the district. District leaders must openly and honestly
evaluate the structure of the central office against the findings of this research and be
willing to make changes that will provide support for the schools in the areas identified
within the thematic domains. This review may require the elimination of existing

162
functions of the central office administrator/supervisor that are unnecessary or impede
gains in improving student achievement.
Provide necessary professional development for central office administrators and
principals. Professional development initiatives have traditionally targeted teachers and
building-level administrators. Overcoming well entrenched beliefs and developing new
skills will require extensive professional development for principals and central office
administrators. District leaders will be required to recognize that entire careers for many
administrators may have been characterized by a focus on site-based management.
This professional development will need to focus on assisting principals and central
office administrators in understanding their pivotal roles, methods for collaboration, as
well as the advantages of shared responsibility for student achievement. While the
need for initial training is readily recognized, district leaders must also ensure on-going,
job-embedded professional development to the greatest extent possible.
In addition, new behaviors will be required of the central office
administrators/supervisors, which may require new skills. District leaders must ensure
that these administrators/supervisors are provided with professional development that
addresses the knowledge and skills needed in these new roles.
Provide opportunities for collaboration. Even though collaboration and common
time for problem-solving are generally considered as a component of professional
development, these areas are addressed separately here for emphasis. Traditionally,
on-going collaboration has occurred within schools and the central office separately.
District leaders and local boards of education must implement and support structures
that guarantee opportunities for collaboration between the central office and the school.

163
Maintain support for schools that did and did not make AYP. As a part of a
systemic focus, districts must consider funding issues and different types of support for
schools based on equity issues. However, district leaders will want to be extremely
careful in maintaining a foundation of support for all schools. District leaders must be
aware of the increased responsibilities currently placed on all principals and teachers.
They must also recognize that certain behaviors, skills, and levels of support must be
present throughout the district in order to maintain a systemic focus. Principals within
this study consistently identified the same critical functions of the central office as
important to increased achievement for their students. Therefore, the functions for the
central office within the seven thematic domains identified within the research could
serve as the foundation of support for all schools.
Utilize functions within thematic domains to prioritize funding. The results of this
study have an impact on funding prioritizes for districts. Districts are currently involved
in determining essential support for increasing achievement within reduced operating
budgets. The thematic domains identified through current research and confirmed by
principals within the study identified essential functions of the district that could serve as
a guide in determining priorities within the budget.
Recommendations for Institutions of Higher Education
Lay the foundation for new roles and relationships between the school and the
central office. Institutions of Higher Education are in the unique position of shaping
belief systems of educators, including teachers, principals, and supervisors, through
preparation programs. Currently, districts that choose to accept the challenge of
reorganizing themselves to align with this research are in the lonely position of trying to

164
overcome the negative image of the central office supervisor while implementing
organizational change with almost no support. While these efforts are notable and
necessary, Institutions of Higher Education could assist by taking the lead. Preparation
programs that focus on eliminating the negative image of the supervisor by
disseminating the findings of this and related research, and then, developing their
students’ skill sets to support the implementation of the collaborative roles identified in
this research will be needed. Without inclusion of these elements in preparation
programs, educators will not have the necessary skills for a life-long career, and even
worse, necessary changes may fail to reach all districts, thus resulting in the continued
stagnation of student achievement and erosion of confidence in public education.
Place increased emphasis on preparation programs for supervisors. Preparation
programs for the principals and supervisors have generally focused on school
leadership. If supervisors are going to be seen as equal partners in identifying solutions
and accepting responsibility for increased achievement, equal attention should be
considered for supervision preparation programs. The unique skills and knowledge that
will be required of supervisors should be emphasized in order to prepare supervisors for
collaborating with schools and leading change.
Organize content of preparation programs around thematic domains. The
thematic domains identified within this research and supported by this study provide
possible indicators of the knowledge and skills required of central office supervisors in
supporting increased achievement. Given the results of this study, the functions
identified within the thematic domains could serve as a framework for course content in
supervision preparation programs.

165
Furthermore, preparation programs for the school administrator could also
consider the skills and knowledge within these domains. While these domains outline
the functions of the central office, they also define the parameters of flexibility for the
school leader.
Include skills for collaboration in preparation programs. School leaders and
supervisors must know how to develop collaborative relationships that result in
increased achievement for all students. While this sounds simple, the reality is that too
many attempts to collaborate end in frustration. With this in mind, courses should be
designed to influence participants’ understanding of the purpose for collaboration as
well as developing the required skills.
Support districts by providing on-going training. Institutions of Higher Education
can support programs for new administrators through preparation programs; however,
support must also be available to practicing administrators, who may have spent the
majority of their careers operating under site-based management. Institutions for
Higher Education could provide vital support to districts undergoing this change by
providing support for related professional development.
Assist states and local districts in developing tools for assessing central office
support for increased student achievement. Institutions of Higher Education can assist
state boards of education and local districts by developing assessment tools to be
utilized in evaluating the support provided to schools. Since principals within this study
confirm seven domains from the research as crucial support from the central office, the
domains could potentially be used as a framework for developing these tools.
166
Institutions of Higher Education can also provide increased support to districts by
providing external audits and removing subjectivity present in self-evaluations.
Recommendations for Further Research
As districts seek to undertake this challenge, additional research will be essential
to assist in guiding the way. Researchers, including institutions of higher education,
must accept this responsibility by adding to the extremely limited bed of research.
Perceptions of central office supervisors. As districts seek to increase
achievement for all students, researchers identified the relationship between the central
office and the school as the area in which the most significant changes may occur
(Guskey; Larson, 2007; Odland, 2007/2008; Protheroe, 2008). This study explored
principals’ perceptions of the functions of the central office; however, the study did not
include perceptions of central office administrators/supervisors. Not only would this
research provide additional information in clarifying the role of the central office
supervisor, but it would also allow a comparison with principals’ perceptions leading to a
better understanding of challenges that districts may encounter in leading this change.
Perceptions of teachers. Related studies to identify teachers’ perceptions of
central office functions would add to the information needed by district leaders. A study
involving teachers should take into account the importance of identifying participants
who have a general understanding of the central office; therefore, selecting participants
serving in formal teacher leadership roles should be considered. This research would
assist in further clarifying the functions of the central office as seen by the classroom
teacher.

167
Comparison of Title I and non-Title I schools. This study compared schools that
made AYP and schools that did not make AYP; however, it did not include other factors
such as the Title I status of the school. Title I status is based on the number of
economically disadvantaged children in a school, defined as those eligible for free or
reduced-price lunch (North Carolina No Child Left Behind, n.d.). Many of NCLB's
requirements such as Adequate Yearly Progress (AYP), Highly Qualified teacher and
teacher assistant standards, accountability, and sanctions for schools designated for
improvement are outlined in Title I. A study to compare the perceptions of principals in
Title I and non-Title I schools may provide important findings that would be beneficial to
districts in understanding the need for differentiated support among schools.
Comparison of perceptions of novice and experienced principals. Focus group
participants suggested a similar study comparing novice and experienced principals.
Focus group participants felt that the perceptions of novice and experienced principals
may be statistically different due to the learning curve for new principals. The research
of Helsing, Howell, Kegan, and Lahey (2008) supported this suggestion by finding that
novice principals often do not have the skills to meet the demands. In addition, the
research of Viadero (2009) found that only half of beginning principals are still in the
positions five years later. These data suggest that the level of support required for
novice principals is greater than the support required by experienced principals. A
study comparing perceptions of novice and experienced principals would be beneficial
to district leaders as they set up structures within the central office to support the unique
needs of novice principals.
168
Perceptions of principals by level (elementary, middle, high). Research to
explore the perceptions of principals by level (elementary, middle, high) was suggested
during the focus group interview. Even though participants did not believe that
perceptions of the overall thematic domains would change, they did suggest that it was
worth investigation and could provide additional insights into the differentiated need of
principals and schools.
Perceptions in other districts. Focus group participants strongly recommended
similar studies in other districts. Three of the focus group participants had served as
principals in other districts. They discussed the differences among districts in areas
such as flexibility, staff development, support for the use of data, and instructional
support. Even though the focus group participants felt that the district in which the study
was conducted provided a representative sample group, they questioned whether
recent events within the district, including budget reductions and a recent change in
district leadership, had caused some feelings of uncertainty, which impacted responses
on the survey. Focus group participants suggested that the percentage of responses in
agreement for each of the thematic domains may have yielded higher percentages if the
study had been conducted during a more stable timeframe. While the results from this
study validated the need for central office support in improving student achievement,
similar studies in different districts may allow for further exploration as to the level of
importance that should be given to each thematic domain.
Case studies of districts effective in implementing changes in the relationship
among schools and the central office. While the domains within this study provide a
framework for systemic reform, cases to further explore successful implementation,
169
barriers, and changes over time are needed. Research of this nature will provide
educational leaders a clearer understanding of what these functions look like in practice
and the impact on the structure of the organization.
Conclusion
This study used a framework generated from a thorough review of current
literature as well as research on the historical role for central office supervision to
develop a survey instrument regarding leadership roles of the central office
administrator in the improvement of student achievement. Survey items addressed 7
thematic domains that were supported by the review. The survey instrument was used
in a large urban district to obtain principals’ perceptions of the need for central
office/district support for efforts to increase achievement.
This research is beneficial to districts as they address the rising requirements of
NCLB. Since the enactment of NCLB in 2001, the results have provided very little
encouragement for educators and the public. However, the emerging research
identifies the position of the central office supervisor as the missing element in assisting
the schools in reaching these lofty goals.
This change will not be the first for the central office supervisor. The central
office administrator/supervisor has realigned with other positions several times in order
to survive the negative image of the position generated throughout the history of
education. As a result the supervisor realigned with the instructional specialist in the
1950s (Alfonso et al., 1975; Glanz, 1991; Karier, 1982), followed by realignment with
administrators in the 1980s (Glatthorn, 1998; Wiles & Bondi1986).

170
Given the findings of this study, now is the time for supervisors to again realign
themselves, this time with the schools in a unified effort to increase achievement for all
students. Without the cumulative knowledge of the central office and the schools,
increases in achievement will fail to reach the majority of the students, particularly
students with the greatest needs. While the risks for the position of the supervisor are
extremely high based on the history of education, the stakes for failing to do so are even
higher for the students that public education serves.
171
REFERENCES
Ackoff, R. (1994). The democratic corporation. New York: Oxford University Press.
Alfonso, R., Firth, G., & Neville, R. (1975). Instructional supervision: A behavior system. Boston: Allyn and Bacon, Inc. Amundson, K. (1988). Challenges for school leaders. Arlington, VA: American Association of School Administrators. Anderson, V., & Davies, D. (1956). Patterns of educational leadership. Englewood Cliffs, New Jersey: Prentice-Hall, Inc. Appelbaum, D. (2002). The need for district support for school reform: What the
researchers say. Research Brief from the National Clearinghouse for Comprehensive School Reform. Washington, DC: Office of Educational Research and Improvement.
Arterbury, E. (1991). Site-based decision making: It’s potential for enhancing learner outcomes. Southwest Educational Development Laboratory, 1(4), 28-35.
Ascik, T. (1984). Looking at some research on what makes an effective school.
In C. Marshner (Ed.), A blueprint for education reform (pp. 141-166). Chicago: Regnery Gateway, Inc.
Ayer, F., & Barr, A. (1928). The organization of supervision: An analysis of the
organization and administration of supervision in city school systems. New York: D. Appleton and Company.
Babcock, C. (1965). The emerging role of the curriculum leader. In R. Leeper (Ed.), Role of supervisor and curriculum director in a climate of change. Washington: Association for Supervision and Curriculum Development.
172
Bailey, W. (1992). Power to the schools: School leader’s guidebook to restructuring. Newbury Park, CA: Corwin Press, Inc. Balliet, T. M. (1893). What shall be done to increase the efficiency of teachers? Journal of Education, 37(10), 148.
Baker, H. (1935). Intelligence and its measurement. Review of Educational Research,
5(3), 187-198.
Barr, A. (1931). An introduction to the scientific study of classroom supervision. New York: D. Appleton and Company. Barr, A. (1933). Science and philosophy in supervision. Education, 53(10), 587-593.
Barr, A., & Reppen, N. (1935). The attitudes of teachers toward supervision.
The Education Digest, 1, 12-13. Barr, A. (1943). The measurement and prediction of teaching efficiency. Review of Educational Research, 13(3), 218-223. Barr, A., Burton, W., & Brueckner, L. (1947). Supervision: A social process. New
York: Appleton-Century-Crofts, Inc. Bartky, J. (1956). Administration as educational leadership. Stanford, CA: Stanford University Press. Bass, B. (1985). Leadership and performance beyond expectations. New York: The Free Press, A Division of Macmillan, Inc. Bauer, S., & Bogotch, I. (2006). Modeling site-based decision making: school
practices in the age of accountability. Journal of Educational Administration, 44(5), 446.
173
Beck, L., & Murphy, J. (1998). Site-based management and school success: Untangling the variables. School Effectiveness and School Improvement, 9(4), 358-385. Benne, K. (1949). Democratic ethics in social engineering. Progressive Education, 26, 201-207. Bennett, W. J., Finn, C. E., & Cribb, J. T. (1999). The educated child: A parent’s guide from preschool through eighth grade. New York: The Free Press.
York: Harper and Row, Publishers.
Berry, B., Darling-Hammond, L., Hirsch, E., Robinson, S., & Wise, A. (2006). No Child Left Behind and the ‘highly qualified’ teacher: The promise and the possibilities. Hillsborough, North Carolina: Center For Teaching Quality. Berube, M. (1994). American school reform: Progressive, equity, and excellence movements, 1883-1993. Westport, Connecticut: Greenwood Press. Berube, M., & Berube, C. (2007). The end of school reform. Lanham, Maryland: Rowman and Littlefield Publishers, Inc. Bjork, L. & Blasé, J. (2009). The micropolitics of school district decentralization. Educational Assessment, Evaluation & Accountability, 21(3), 195-208. Blake, R., & Mouton, J. (1975). An overview of the grid. Training and Development Journal, 29(5), 29-38. Blasé, J., & Blasé, J. (1994). Empowering teachers: What successful principals
do. Thousand Oaks, CA: Corwin Press.
Blasé, J., & Blasé, J. (1997). The fire is back!: Principals sharing school governance. Thousand Oaks, CA: Corwin Press.
174
Bobbitt, F. (1913). The twelfth yearbook of the National Society for the Study of
Education: Part 1, The supervision of city schools. Chicago: University of
Chicago Press.
Bobbitt, F. (1934). The trend of the activity curriculum. The Elementary School Journal, 35(4), 257-266. Bode, B. H. (1935). The next step in education. Education Digest, 1(2), 1-3. Bolin, F., & Panaritis, P. (1992). Searching for a common purpose: A perspective on the history of supervision. In C. Glickman (Ed.), Supervision in transition: The 1992 ASCD Yearbook (pp. 30-43). Washington, DC: The Association for Supervision and Curriculum Development. Bossi, M. (2007). Revolutionary leadership. Leadership, 36(5), 32-38. Boston, B. (1982). Reforming the American high school. Education Digest, 48(2), 8-11. Bottoms, G., & Fry, B. (2009). The district leadership challenge: Empowering principals to improve teaching and learning. Southern Regional Education Board. Retrieved from http://www.sreb.org Boyd, W., & Christman, J. (2003). A tall order for Philadelphia’s new approach to school governance: Heal the political rifts, close the budget gap, and improve the schools. In L. Cuban & M. Usdan (Eds.), Powerful reforms with shallow roots. New York: Teacher’s College Press. Bracey, G. (2008). NCLB: Achievement Robin Hood? Principal Leadership, 9, 47-49.
Bracey, G. (2009). U.S. school performance, through a glass darkly (again). Phi Delta Kappan, 90(5), 386-387.
175
Bradley, A. (1995). Report advocates more authority for urban schools. Education Week, 14(36), 1-3.
Brookover, W., Beady, C., Flood, P., Schweiter, J., & Wisenbaker, J. (1979).
School social systems and student achievement: Schools can make a difference. New York: Praeger.
Brown, C., & Spangler, D. (2006). Creating sustainable REFORM. School Administrator, 63(8), 43-48. Brown, D. (1990). Decentralization and site-based management. London: Falmer Press. Brueckner, L. (1947). Raising the level of democratic cooperation. Educational
Leadership, 4(3), 189-192. Burch, P., & Spillane, J. (2004). Leading from the middle: mid-level central office
staff and instructional improvement. Cross City Campaign for Urban School Reform. (ERIC #ED494450).
Burns, J. (1978). Leadership. New York: Harper and Row Publishers. Callahan, R. (1962). Education and the cult of efficiency: A study of the social forces that have shaped the administration of the public schools. Chicago: University of Chicago Press.
Campbell, R., Fleming, T., Newell, L., & Bennion, J. (1987). A history of thought
and practice in educational administration. New York: Teachers College
Press. Carbo, M. (2007). Best practices for achieving high, rapid reading gains. Principal, 87(2), 42-45.

176
Carlson, R. (1996). Reframing & reform: Perspectives on organization, leadership, and school change. White Plains, New York: Longman Publishers USA. Carr, A. (1988). Second-wave reforms crest at local initiative. The School Administrator, 45, 16-18. Cavanagh, S. (2009a). New standards draft offers more details. Education Week, 29(5), 1, 12. Cavanagh, S. (2009b). NAEP scores put spotlight on standards. Education Week, 29(8), 1, 12. Chafin, A. (2005). 9 hard things to do in order to sustain school reform. Newsletter from The Center for Comprehensive School Reform and Improvement. Available at www.centerforcsri.org Champlin, J. (1987). Leadership: A change agent’s view. In L. Shieve & M.
Schoenheit (Eds.) Leadership: Examining the elusive, 1987 Yearbook of the Association of Supervision and Curriculum Development. Washington, DC: The Association for Supervision and Curriculum Development.
Chapman, J. (1990). School-based decision-making and management:
Implications for school personnel. In C. Chapman (Ed.), School-based decision-making and management. London: Falmer Press.
Chhuon, V., Gilkey, E., Gonzalez, M., Daly, A., & Chrispeels, J. (2006). The little district that could: The process of building district-school trust. Paper
presented at the American Educational Research Association Annual Meeting. San Francisco: American Educational Research Association.
177
Chrispeels, J., Burke, P., Johnson, P., & Daly, A. (2008). Aligning mental models of district and school leadership teams for reform coherence. Education and Urban Society, 40, 730-750.
Chubb, J., & Moe, T. (1990). Politics, markets and America’s schools. Washington, DC: Brookings Institute. Clark, B. (Ed.). (1975). The problems of American education. New York: The
New York Times Co. Cochran, T. (1972). Business in American life: A history. New York: McGraw-Hill. Cogan, M. (1973). Clinical supervision. Boston: Houghton Mifflin. Collins, E. (1940). Teacher selection by examination. Harvard Educational Review, 10(1), 3-6. Collins, J. (2001). Good to great. New York: HarperCollins Publishers. Conley, D. (1996). Are you ready to restructure: A guidebook for educators, parents, and community members. Thousand Oaks, CA: Corwin Press, Inc. Connelly, G., & Tirozzi, G. (2008). A new leader, new school leadership support. Education Week, 28(3), 9. Conti, S., Ellsasser, C., & Griffin, G. (2000). School restructuring: A literature review. Washington, DC: Office of Educational Research and Improvement, U.S. Department of Education. Cook, D. (1967). The impact of the Hawthorne Effect in experimental designs in educational research (Report No. 1757). Washington, DC: Office of
Education (DHEW). (ERIC report contract no. OEC-3-10-041).
178
Copland, M. (2003). Leadership of Inquiry: Building and sustaining capacity for
school improvement. Educational Evaluation and Policy Analysis, 25(4), 385-395. Retrieved from http://www.jstor.org/stable/3699583
Corcoron, T., Fuhrman, S., & Belcher, C. (2001). The district role in instructional improvement. Phi Delta Kappan, 83(1), 78-85. Crabtree, J. W. (1914). The school of the people. Journal of Education, 80(6), 148-149. Crabtree, J. W. (1934). The “department” grows in service. Journal of Education,
117(4), 94-95.
Cremin, L. A. (1964). The transformation of the school; progressivism in American education, 1876-1957. New York: Alfred A. Knopf Publishing Co. Creswell. J. W. (2005). Educational research. Columbus, Ohio: Merrill Prentice Hall. Cuban, L. (2008). Frogs into princes: Writings on school reform. New York: Teachers College Press. Cuban, L., & Usdan, M. (Eds.) (2003). Powerful reforms with shallow roots. New York: Teachers College Press. Cubberly, E. P. (1927). The state the unit for education. Elementary School Journal, 27(5), 344-355. Cunningham, L. (1963). Effecting change through leadership. Educational Leadership, 21(2), 75-111.

179
Danielson, L., Doolittle, J., & Bradley, R. (2007). Professional development, capacity building, and research needs: Critical issues for response to intervention implementation. School Psychology Review, 36(4), 632-637. Daresh, J. (2004). Mentoring school leaders: Professional promise or
predictable problems? Educational Administration Quarterly, 40(4), 495-517.
Darling-Hammond, L. (1997). The right to learn: A blueprint for creating schools
that work. San Francisco: Jossey-Bass Publishers. Darling-Hammond, L., & Baratz-Snowden, J. (2005). A good teacher in every
classroom: Preparing the highly qualified teachers our children deserve. Educational Horizons, 85(2), 111-132.
Darling-Hammond, L., & Friedlaender, D. (2008). Creating excellent and equitable schools. Educational Leadership, 65(8), 14-21. David, J. (1996). The who, what, and why of site-based management. Educational Leadership, 53(4), 4-9. Deal, T. (1987). The culture of schools. In L. Shieve & M. Schoenheit (Eds.),
Leadership: Examining the elusive, 1987 Yearbook of the Association for Supervision and Curriculum Development. Washington, DC: Association for Supervision and Curriculum Development.
De Bevoise, W. (1984). Synthesis of research on the principal as instructional
leader. Educational Leadership, 41(5), 14.
Dewey, J. (1903). Democracy in education. The Elementary School Teacher, 4(4), 193-204.
180
Downey, C. (2001). District leaders: Step up to the plate. Leadership, 31(1), 18-
20.
Downey, C., Steffy, B., Poston, W., & English, F. (2009). 50 ways to close the achievement gap. Thousand Oaks, CA: Corwin Press. Drummond, H. (1964). Leadership for human change. Educational Leadership, 22(3), 147-148. Duffett, A., Farkas, S., & Loveless, T. (2008). High achieving students in the era of No Child Left Behind. Retrieved from the Thomas B. Fordham Institute website at www.edexcellence.net/detail/news.cfm?news_id732&id=17 Duffy, F. (1998). The ideology of supervision. In G. R. Firth & E. F. Pajak (Eds.)
Handbook of research on school supervision (pp. 181-199). New York: Simon and Schuster Macmillan.
Dufour, R. (2007). In praise of top-down leadership. School Administrator, 64(10), 38-42. Dufour, R., Dufour., R., Eaker, R., & Karhanek, G. (2010). Raising the bar and
closing the gap. Bloomington, IN: Solution Tree Press. Dufour, R., & Eaker, R. (1998). Professional learning communities at work. Bloomington, IN: National Education Service. Dwyer, D., Barnett, B., & Lee, G. (1987). The school principal: Scapegoat or the last great hope? In L. Shieve & M. Schoenheit (Eds.), Leadership: Examining the Elusive, 1987 ASCD Yearbook. Alexandria, VA: Association for Supervision and Curriculum Development.
181
Edmonds, R. (1979). Effective schools for the urban poor. Educational Leadership, 37(1), 15.
Edson, A. W. (1893). School supervision. Education, 13, 391. Ellis, A., & Fouts, J. (1994). Research on school restructuring. Princeton Junction: Eye on Education, Inc.
Elmore, R. (1995). Structural reform and educational practice. Educational Researcher, 24, 23-26. English, F. (2009). 50 ways to close the achievement gap. PowerPoint presented to a meeting of Wake County Public School System Superintendent’s
Leadership Team on September 28, 2009. Fine, J. (1997). School supervision for effective teaching in America 1910-1930. High School Journal, 80(4), 288-294. Fink, E., & Resnick, L. (2001). Developing principals as instructional leaders. Phi Delta Kappan, 82, 598-606. Finn, C. (1991). We must take charge: our schools and our future. New York:
The Free Press, Macmillan, Inc. Finn, C., & Walberg, H. (1994). Radical education reforms. Berkeley, CA:
McCutchan Publishing Corporation.
Fitzpatrick, F. (1900). Educational progress. Journal of Education, 51(19). Fletcher, G. T. (1888). Progress in school supervision. Journal of Education, 27(7), 100-104.

182
Foley, E., & Sigler, D. (2009). Redesigning the ‘central office. Voices in Urban Education, Annenberg Institute for School Reform. Retrieved March 24,
2009, from http://www.annenberginstitute.org/VUE/winter09/Foley.php
Frederiksen, J. (1975). School effectiveness and equality of educational
opportunity. Cambridge: Harvard University Press. Fullan, M. (1991). The new meaning of educational change. New York:
Teachers College Press. Fullan, M. (1997). Emotion and hope: Constructive concepts for complex times. In A. Hargreaves (Ed.), Rethinking educational change with heart and
mind: 1997 ASCD Yearbook (pp.216-233). Alexandria, VA: Association for Supervision and Curriculum Development.
Fullan, M. (2001). Leading in a culture of change. San Francisco: Jossey-Bass
Press. Fullan, M. (2009). Leadership development: The larger context. Educational Leadership, 67(2), 45-48. Fullan, M. (2010a). The awesome POWER OF THE PRINCIPAL. Principal, 89(4), 10-15.
Fullan, M. (2010b). Motion leadership: THE SKINNY on becoming change savvy. Thousand Oaks, CA: Corwin Press. Fullan, M. (2010c). All systems go: The change imperative for whole system
reform. Thousand Oaks, CA: Corwin Press. Fullan, M., & Levin, B. (2009). The fundamentals of whole-system reform.
Education Week, 28(35), 30-31.
183
Garrett, J. (2008). STEM: The 21st Century Sputnik. Kappa Delta Pi Record, 44(4), 152-153. Garman, N. (1982). The clinical approach to supervision. In T. Sergiovanni (Ed.), Supervision of teaching, (pp. 35-52). Alexandria, VA: Association for Supervision and Curriculum Development. Garman, N., & Hazi, H. (1988). Teachers ask: Is there life after Madeline Hunter?
The Phi Delta Kappan, 69(9), 669-672. Garson, G. (2008). Scales and standard measures. Retrieved May 23, 2010, from
North Carolina State University, Public Administration Program Web site:
http://faculty.chass.ncsu.edu/garson/765/standard.htm Gillespie, R. (1991). Manufacturing knowledge: A history of the Hawthorne experiments. London: Cambridge University Press. Glanz, J. (1977). Ahistoricism and school supervision: Notes toward a history.
Educational Leadership, 35(2), 148-154. Glanz, J. (1991). Bureaucracy and professionalism. Teaneck, New Jersey: Farleigh Dickinson University Press. Glanz, J. (1998). Histories, antecedents, and legacies of school supervision.
In G. R. Firth and E. F. Pajak (eds.) Handbook of research on school supervision (pp 34-79). New York: Simon and Schuster Macmillan.
Glatthorn, A. (1998). Roles, responsibilities and relationships. In G. R. Firth & E.
F. Pajak (Eds), Handbook on research of school supervision (pp. 374- 396). New York: Simon and Schuster MacMillan.
184
Glickman C. (1990). Supervision of instruction: A developmental approach (2nd
ed.). Boston: Allyn and Bacon. Gliem, J. & Gliem, R. (2003). Calculating, interpreting and reporting Cronbach’s Alpha Reliability Coefficient Likert-type scales. Research report presented at the Midwest Research-to-Practice Conference in Adult, Continuing, and
Community Education, The Ohio State University, Columbus, OH, October 8-10, 2003.
Goertz, M., & Duffy, M. (2003). Mapping the landscape of high-stakes testing and
accountability programs. Theory Into Practice, 42(1), 4-11. Goldhammer, R. (1969). Clinical supervision: Special methods for the supervision of teachers. New York: Holt, Rinehart, and Winston.
Good, T. (2008). In the midst of comprehensive school reform; principals
perspectives. Teachers College Record, 110(11), 2341-2360.
Goodlad, J., & Oakes, J. (1988). We must offer equal access to knowledge. Educational Leadership, 45(5), 16-23. Grant, G. (2009). Hope and despair in the American City: Why there are no bad schools in Raleigh. Cambridge, MA: Harvard University Press. Grede, W. (1956). Our role in freedom. In Education: A key to lasting peace,
Official Report of the American Association of School Administrators.
Washington: American Association of School Administrators. Greenwood, J. A. (1904). Better teachers and efficient service. Journal of Education, 60(12), 201.
185
Grogan, M., & Crow, G. (2004). Mentoring in the context of educational leadership in preparation and development-Old wine in new bottles? Educational Administration Quarterly, 40(4), 463-467.
Gross, R. & Gross, B. (1975). Let the child teach himself. In C. Burton (Ed.), The
problems of American education. New York: The New York Times Company. Grove, K. (2002). The invisible role of the central office. Educational Leadership, 59(8), 45-47. Guskey, T. (2007). Leadership in the Age of Accountability. Educational
Horizons, 86(1), 29-34. Guzman, N. (2010). Ravitch lashes teacher bashers. NEA Today. Retrieved May
21, 2010, from http://neatoday.org/2010/03/17/ravitch-lashes-teacher-bashers/ Hannay, L., Manning, M., Earl, S., & Blair, D. (2006). Leaders leading and
learning (Part 2). Management in Education, 20(3), 15-19.
Hanson, J. (1993). Is educational reform through mandated accountability an oxymoron? Measurement & Evaluation in Counseling & Development, 26(1), 748-756. Hanushek, E., Kain, J., & Rivkin, S. (2004). Why public schools lose teachers. Journal of Human Resources, 39(2), 326-354. Hargreaves, A. (1997). Rethinking educational change: going deeper and
wider in the quest for success. In A. Hargreaves (Ed.), Rethinking educational change with heart and mind: 1997 ASCD Yearbook (pp. 1-26). Alexandria, VA: Association for Supervision and Curriculum Development.
186
Hargreaves, A., & Shirley, D. (2008). Beyond standardization: Powerful new principles for improvement. Phi Delta Kappan, 90(2), 135-143. Harris, A., & Chrispeels, J. H. (Eds). (2006). Improving schools and educational systems: International perspectives. London: Routhledge. Harris, B. (1966). Strategies for instructional change-promising ideas and perplexing problems. Washington, DC: U.S. Department of Health, Education and Welfare, Office of Education. Harris, B. (1985). Supervisory behavior in education. Englewood Cliffs, New
Jersey: Prentice-Hall, Inc. Harris, B. (1998). Paradigms and parameters of supervision in education. In G. R. Firth & E. F. Pajak (Eds.), Handbook of research on school supervision (pp. 1-37). New York: Simon and Schuster Macmillan. Harris, W. T. (1881). The Concord School of Philosophy. Journal of Education, 14(7), 125-126. Hatch, T. (2009). Four flawed assumptions of school reform: And what can be
done about them. Education Week, 29(14), 32, 24. Hefferman, H., & Bishop, L. (1965). The supervisor and curriculum director at work. In R. R. Leeper (Ed.), Role of supervisor and curriculum director in a climate of change, 1965 Yearbook. Washington, DC: Association of Supervision and Curriculum Development.
187
Helsing, D., Howell, A., Kegan, R., & Lahey, L. (2008). Putting the ‘development’ in professional development: Understanding educational leaders’ immunities to change. Harvard Educational Review, 78(3), 437- 465. Helwig, C. (1968). Democratic supervision and creative supervision: Are they possible misnomers? (Report No. EA 003 661). Washington: U.S. Department of Health, Education, and Welfare, Office of Education. (ERIC Document Reproduction Service No. ED055324). Hershey, P., & Blanchard, K. (1977). Management of organizational behavior. Englewood Cliffs, New Jersey: Prentice-Hall, Inc. Hess, G. (1995). Restructuring urban schools: A Chicago perspective. New York: Teachers College Press. Hightower, A., Knapp, M., Marsh, J., & McLaughlin, M. (2002). School districts
and instructional renewal. New York: Teachers College Press. Hill, P., & Bonan, J. (1991). Decentralization and accountability in school decision
making. Santa Monica, CA: RAND Corporation. Hodgkinson, H. (1957). Action research—a critique. Journal of Educational Sociology, 31(4), 137-153. Holloway, J. (2000). The promise and pitfalls of site-based management. Educational Leadership, 57(7), 81-82. Honig, M. (2004). Where’s the ‘up’ in bottom-up reform? Educational Policy, 18, 527-561.
188
Honig, M. (2008). District central offices as learning organizations: How sociocultural and organizational learning theories elaborate district central office administrators’ participation in teaching and learning improvement efforts. American Journal of Education, 114, 627-664. Honig, M., & Copland, M. (2008). Reinventing district central offices to expand student learning. (Issue Brief, September 2008). Seattle, WA: The Center for Comprehensive Reform and Improvement. Hui, K. (2009, November 30). Schools may turn to merit pay. The News and Observer, pp. A1, A7. Hunt, J. (2008). A Nation at Risk and No Child Left Behind: Déjà vu for administrators? Phi Delta Kappan, 89(8), 580-585. Imber, M., & Duke, D. (1984). Teacher participation in school decision making: A framework for research. Journal of Educational Administration, 22(1), 24-34. Innovation Network. (n. d.). Data collection tips: Developing a survey. Retrieved January 23, 2010, from http://www.innonet.org/clients_docs/File/Survey-Dev Johnston, R. (2001). Central office is critical bridge to help schools. Educational Leadership, 20(25), 1-4. Karier, C. (1982). Supervision in historic perspective. In T. Sergiovanni (Ed.), Supervision of teaching: ASCD 1982 Yearbook Committee. Alexandria, VA: The Association of Supervision and Curriculum Development.
189
Kerr, K., Marsh, J., Ikemoto, G., Darilek, H., & Barney, H. (2006). Strategies to promote data use for instructional improvement: Actions, outcomes, and lessons from three urban districts. American Journal of Education, 112(4),
496-520.
Klohr, P. (1965). Looking ahead in a climate of change. In Robert Leeper (Ed.), Role of supervisor and curriculum director in a climate of change. Washington: Association for Supervision and Curriculum Development. Knapp, M., Copland, M., & Talbert, J. (2003). Leading for learning: Reflective tools for school and district leaders. Seattle, WA: Center for the Study of Teaching and Policy. Retrieved from www.ctpweb.org Koppich, J. (2004). Developing state policy to ensure a “highly qualified” teacher in every classroom. Policy brief issued May, 2004 by the NGA Center for Best Practices, Washington, DC. Krajewski, R. (1984). Helping principals become instructional leaders. Educational Leadership, 41(8), 88. Kyte, G. C. (1930). How to supervise. Boston: Houghton Mifflin Company. Land, D. (2002). Local school boards under review: Their role and effectiveness in relation to students’ academic achievement. Review of Educational Research, 72(2), 229-278.
190
Lang, A. (2007). As the majority of school districts spend more time on Reading and Math, many cut time in other areas: Instructional time for subjects not tested under No Child Left Behind has fallen by nearly one-third since law was passed. (News release) Washington, DC: Center for Education Policy. Larson, E. (2007). Realigning the orbits of central office and schools. Education Digest, 73(1), 36-38. Le Floch, K., Carlson, K., Taylor, J., & Thomsen, K. (2006). Implications of
NCLB accountability for comprehensive school reform. Journal of Education for Students Placed at Risk, 11(3-4), 353-366.
Leithwood, K., Louis, K., Anderson, S., & Wahlstrom, K. (2004). How leadership influences student learning. New York: Wallace Foundation. Leverett, L. (2004). Beyond the ‘Emperor’s New Clothes’: The role of the central office in systemwide instructional improvement. Benchmark, 5(3), 1-12. Levey, J., & Acker-Hocevar, M. (1998). Site-based management: Retrospective understandings and future directions. New Orleans: Mid-South Educational Research Association. (ERIC Document Reproduction Service No. ED428439). Levine, M. (1986). Business and the public schools. Educational Leadership, 43(5), 47. Lewin, K., Lippit, R., & White, R. (1939). Patterns of aggressive behavior in experimentally created ‘social climates’. Journal of School Psychology,
10(2), 271-299.
191
Lezotte, L., Edmonds, R., & Ratner, G. (1974). Remedy for school failure to equitably deliver basic school skills. Cambridge: Harvard University Press. Lieberman, A., & Wood, D. (2003). Inside the National Writing Project:
Connecting network learning and classroom teaching. New York: Teachers College Press.
Loeb, S., Darling-Hammond, L., & Luczak, J. (2005). How teaching conditions predict teacher turnover in California schools. Peabody Journal of Education, 80(3), 44-70. Louis, K., Leithwood, K., Wahlstrom, K., Michlin, M., Gordon, M., Meath, J., &
Anderson, S. (2009). Learning from districts’ efforts to improve student Achievement: Final report. New York: Wallace Foundation.
Lovell, J., & Wiles, K. (1983). Supervision for better schools. Englewood Cliffs, New Jersey: Prentice-Hall, Inc. Lucio, W., & McNeil, J. (1962). Supervision: A synthesis of thought and action. New York: McGraw-Hill.
Lyons, J., & Algozzine, B. (2006). Perceptions of the impact of accountability on the role of principals. Education Policy Analysis Archives, 14(16), 1-19. MacIver, M. (2004). Systemic supports for comprehensive school reform: The institutionalization of direct instruction in an urban school system. Journal of Education for Students Placed at Risk, 9(3), 303-321.
192
MacIver, M., & Farley-Ripple, E. (2008). Bringing the district back in: The role of
the central office in instruction and achievement. Alexandria, VA: Educational Research Service.
Madda, C., Halverson, R., & Gomez, L. (2007). Exploring coherence as an
organizational resource for carrying out reform initiatives. Teachers College Record, 109(8), 1957-1979.
Marsh, J., Kerr, K., Ikemoto, G., Darilek, H., Suttorp, M., Zimmer, R., & Barney,
H. (2005). The role of districts in fostering instructional improvement: lessons from three urban districts partnered with the Institute for Learning. Retrieved from the Rand Corporation website at http://www.rand.org
Markward, D. (2008). Boardroom to classroom: Continuous improvement in Cedar Rapids. School Administrator, 65(4), 32-36. Maxwell, L. (2009). Crisis in school leadership seen brewing in California. Education Week, 29(10), 9. Mayeske, G., Okada, T., Beaton, A., Cohen, W., & Wisler, C. (1972). A study of the achievement of our nation’s students. Washington, DC: U.S. Government Printing Office.
McBeath, A. (2006). Getting districtwide results. Keynote presentation at the Getting Districtwide Results Conference in Long Beach, California. Chicago: Cross City Campaign for Urban School Reform. McCoy, R. (1961). American school administration, public and Catholic. New York: McGraw-Hill Book Company, Inc.
193
McGregor, D. (1960). The human side of enterprise. New York: McGraw-Hill. McLaughlin, M. (1990). The Rand Change Agent Study revisited: Macro perspective and micro realities. Educational Researcher, 19(9), 11-15. McLaughlin, M., & Talbert, J. (2002). Reforming districts. In A. Hightower, M. Knapp, J. Marsh, & McLaughlin, M. (Eds.), School districts and instructional renewal (pp. 173-192). New York: Teachers College Press. McLaughlin, M., & Talbert, J. (2003). Reforming districts: How districts support school reform (research report). Seattle: Center for the Study of Teaching and Policy, University of Washington. McNeal, B., & Oxholm, T. (2009). A school district’s journey to excellence. Thousand Oaks, CA: Corwin Press. McNeil, J. (1982). A scientific approach to supervision. In T. Sergiovanni (Ed.), Supervision of teaching, (pp 18-34). Alexandria, VA: Association for Supervision and Curriculum Development. Miller, W. (1942). Democracy in educational administration. New York: Teachers College Press, Columbia University. Mohrman, S. & Wohlstetter, P. (1994). School-based management: Organizing for high performance. San Francisco: Jossey-Bass. Morris, R., & Morris, J. (Eds.). (1976). Encyclopedia of American History: Bicentennial Edition. New York: Harper and Row, Publishers. Mosler, R., & Purpel, D. (1972). Supervision: The reluctant profession. Boston: Houghton Mifflin.
194
Muirhead, M., Tyler, R., & Hamilton, M. (2001). Study of whole school reform implementation in New Jersey Abbott districts. Arlington, VA: George Washington University Center for Equity and Excellence in Education. Retrieved from http://r3cc.ceee.gwu.edu Murphy, J. (1989). The paradox of decentralizing schools: Lessons from business, government, and the Catholic Church. The Phi Delta Kappan, 70(10), 808-812. Murphy, J., & Beck, L. (1995). School-based management as school reform: Taking stock. Thousand Oaks, CA: Corwin Press, Inc. Murphy, J., & Hallinger, P. (2001). Characteristics of instructionally effective school districts. Journal of Educational Research, 81(3), 175-181. Murphy, J., & Meyers, C. (2008). Turning around failing schools. Thousand Oaks, CA: Corwin Press. Myers, K., & Goldstein, H. (1997). Failing schools or failing systems? In A.
Hargreaves (Ed.), Rethinking educational change with heart and mind: 1997 ASCD Yearbook (pp. 111-127). Alexandria, VA: Association for Supervision and Curriculum Development.
Myers, K., & Simpson, D. (1998). Re-creating schools. Thousand Oaks, CA:
Corwin Press, Inc.
National Center for Education Statistics. (2006). Progress in international reading literacy study: 2006 results. Washington, DC: Department of Education.
195
Neville, R. (1966). The supervisor we need. Educational Leadership, 23(8), 634- 640. Newmann, F., & Wehlage, G. (1995). Successful school restructuring: A report to the public and educators by the Center for Restructuring Schools. Madison, WI: University of Wisconsin. No Child Left Behind Act of 2001, Pub. Law No. 107-110, U.S. Stat. 1425. (2002). Noel, E., Slate, J., Brown, M. & Tejeda-Delgado, C. (2008). Site-based decision making: Views from secondary school personnel. Florida Journal of Educational Administration & Policy, 2(1), 50-61. North Carolina End-of-Grade Tests. (2007). Assessment brief issued by the North Carolina Department of Accountability Services, 8(1). Retrieved from the North Carolina Department of Public Instruction Testing Program web site http://www.publicshcools.org/accountability/testing/shared/abriefs/eogread math North Carolina No Child Left Behind. (2008). Adequate Yearly Progress (AYP): The basics. Retrieved from the North Carolina Department of Public Instruction web site: http://www.ncpublicschools.org/nclb/abcayp/faqs/ North Carolina No Child Left Behind. (n. d.). Words and terms to know. Retrieved from the North Carolina Department of Public Instruction web site at: http://www.ncpublicschools.org/nclb/glossary#N

196
North Carolina School Report Cards. (2009). Issued by the North Carolina Department of Public Instruction. Available online at http://www.ncreportcards.org/src/ North Carolina State Board of Education. (2009). As I see it: Teacher working conditions survey offers valuable insight. Available on line at http://www.ncpublicschools.org/stateboard/aisi/2009/20091015 Norton, J. (1952). Administrative leaders for good schools. In Leadership for American education: Official Report, 78th Annual Convention, American Association of School Administrators. Washington, DC: American Association of School Administrators. Odden, A. (1995). Transferring decision-making to local schools: Site-based management. Retrieved from the North Central Regional Educational Laboratory website at http://www.ncrel.org/sdrs/areas/issues/envrnmnt/go/go100.htm Odland, J. (2007/2008, Winter). The law in review. Childhood Education, 84(2), 94B-95. Ogawa, R., & White, P. (1994). School-based management: An overview. In S. Mohrman (Ed.), School-based management: Organizing for high performance. San Francisco: Jossey-Bass, Inc. Ogden, R. (1928). ‘Gestalt, behavior and speech’. Quarterly Journal of Speech, 14(4), 530-534. Ogletree, J. (1972). Changing supervision in a changing era. Educational Leadership, 29(6), 507-510.
197
Olson, L. (1986). Study confirms link between principal’s leadership, pupil gains. Education Week, 5(34), 5. Olson, L. (2007). More power to the schools. Education Week. 27(13), 1-9. Orr, T., Berg, B., Shore, R., & Meier, E. (2008). Putting the pieces together: Leadership for change in low-performing urban schools. Education and Urban Society, 40, 670-693. Otto, H. (1946). Supervisory organization and administration. Review of Educational Research, 16(4), 356-363. Pajak, E. (1989). The central office supervisor of curriculum and instruction. Needham Heights, MA: Allyn and Bacon, Inc. Pajak, E. (1993). Change and continuity in supervision and leadership. In G. Cowelti (Ed.), Challenges and achievements of American education: The 1993 ASCD Yearbook (pp. 158-186). Alexandria, VA: The Association for Supervision and Curriculum Development. Pajak, E., Adamson, P., & Rhoades, G. (1998). Supervision in district central
offices. In G. R. Firth & E. F. Pajak (Eds.), Handbook on research of school supervision (pp.667-687). New York: Simon and Schuster Macmillan.
Pajak, E., & Glickman, C. (1989). Dimensions of school district improvement. Educational Leadership, 46(8), 61-65. Pajak, E.. & Seyfarth, J. (1983). Authentic supervision reconciles the irreconcilables. Educational Leadership, 40(8), 20-23
198
Palmer, J. (1929). Testing achievements. Journal of Education, 109, 332. Parrish, W. (1928). Implications of Gestalt psychology. Quarterly Journal of Speech, 14(1), 8-27. Patton, M. (2002), Qualitative research and evaluation methods. Thousand Oaks, CA: Sage Publications. Perkins-Gough, D., & Snyder, D. (2003). The year ASCD became ASCD: 1943. Educational Leadership, 60(5), 94-95. Peters, A. L. (2009). No support for a new principal in an urban district: A case study. Journal of Cases in Educational Leadership, 11(1), 66-72. Peters, T., & Waterman, R. (1982). In search of excellence: Lessons from America’s best-run companies. New York: Harper and Row Publishers. Philbrick, J. (1876). The examination of graded schools. In Educational addresses and pamphlets in Teachers College Library. New York: Teachers College, Columbia University. Pounder, D., & Crow, G. (2005). Sustaining the pipeline of school administrators. Education Leadership, 62(8), 56-60. Protheroe, N. (2008). District support for school improvement. Principal, 87(3), 36-40. Purkey, S., & Smith, M. (1985). School reform: The district policy implications of the effective schools literature. The Elementary School Journal, 85(3), 352-389.

199
Rallis, S., & Highsmith, M. (1986). The myth of the ‘great principal’: Questions of school management and instructional leadership. Phi Delta Kappan, 68, 300-304. Ramquist, J. (2009, October 7). Refocus on teachers [Letter to the editor]. The News and Observer, 14A. Rankin, P. (1934). Scientific method in supervisory programs. Washington: Department of Supervisors and Directors of Instruction, National Education Association. Ravitch, D. (1983). The troubled crusade: American education, 1945-1980. New York: Basic Books Publishers, Inc. Ravitch, D. (2009). Time to kill ‘No Child Left Behind’. Education Week, 28(33), 36. Reader reactions to state budget cuts. (2009, August 28). Posted on
Richmond Times Dispatch Politics blog. Retrieved from http://m.timesdispatch.com/richmond/db_37144/contentdetail.htm;jsession id=8921D469513
Reeves, D. (2008). Reframing teacher leadership to improve your school. Alexandria, VA: ASCD. Reddin, W. (1970). Managerial effectiveness. New York: McGraw-Hill. Rederfer, F. (1985). The 1930s. The Education Digest, 51, 25-34. Robertson, P., Wohlstetter, P. & Mohrman, S. (1995). Generating curriculum and instructional changes through school-based management. Educational Administration Quarterly, 31, 375-404.

200
Rogers, V. (1952). Administrative leaders for good schools. In Leadership for American education: Official report, 78th Annual Convention, American Association of School Administrators. Washington, DC: American Association of School Administrators. Rorrer, A., Skria, L., & Scheurich, J. (2008). Districts as institutional actors in Educational Reform. Educational Administration Quarterly, 44, 307-358. Rose, G. (2007). The role of principal empowerment within a site-based management environment: empirical testing of a structural model. Journal of Educational Change, 8(3), 207-233. Rowland, A. (1940). The proposed teacher examination service. Education Digest, 6(2), 21-23. Rugg, H. O. (1920). Self-improvement of teachers through self-rating: A new scale for rating teachers’ efficiency. Elementary School Journal, 20(9), 670-684. Salkind, N. (2005). Statistics for people who (think they) hate statistics. Thousand Oaks, CA: Sage Publications, Inc. Sand, O. (1965). Bases for decisions. In Robert Leeper (Ed.), Role of supervisor and curriculum director in a climate of change. Washington: Association for Supervision and Curriculum Development. Santos, J. (1999). Cronbach’s Alpha: A tool for assessing the reliability of scales. Journal of Extension, 37(2). Retrieved from http://www.joe.org/joe/1999april/tt3.php
201
Sarason, S. (1990). The predictable failure of educational reform: Can we change course before it’s too late? San Francisco: Jossey-Bass Publishers. Sawchuk, S. (2008). Leadership gap seen in post-NCLB changes in U. S. Teachers. Education Week, 28(3), 1-16. Schlechty, P. (2001). Shaking up the school house: How to support and sustain educational innovation. San Francisco: Jossey-Bass Publishers. Schon, D. (1983). The reflective practitioner. New York: Basic Books, Inc., Publishers. Scriven, M. (1991). Evaluation Thesaurus. (4th ed.). Newbury Park, CA: Sage Publishers. Senge, P. (1990). The fifth discipline. New York: Doubleday. Sergiovanni, T. (1982). Supervision of teaching: ASCD 1982 Yearbook Committee. Alexandria, VA: The Association for Supervision and Curriculum Development. Sergiovanni, T. (1992) Moral leadership: Getting to the heart of school improvement. San Francisco, CA: Jossey-Bass Publishers. 7 actions that improve school district performance. Newsletter. (2006, November 1). Center for Comprehensive School Reform and Improvement, (ERIC Document Reproduction Service No. ED494614) Shakrani, S. (2008). Teacher turnover: Costly crisis, solvable problem. East Lansing, Mi: Education Policy Center, Michigan State University.
202
Shanker, A. (1990). The end of the traditional model of schooling and a proposal for using incentives to restructure schools. Phi Delta Kappan, 71(5), 345- 357. Shannon, G., & Bylsma, P. (2004). Characteristics of improved school districts. (Issue Brief). Washington, DC: The Center for Comprehensive School Reform and Improvement. Sharratt, L., & Fullan, M. (2009). Realization: The change imperative for deepening district-wide reform. Thousand Oaks, CA: Corwin Press. Sheskin, D. (2007). Handbook of parametric and nonparametric statistical procedures (4th ed.). Boca Raton, FL: Chapman and Hall. Silverman, F. (2004). Mid-level managers being left behind. District Administrator, 40(11), 14. Sipple, J., & Killeen, K. (2004). Context, capacity, and concern: A district-level analysis of the implementation of standards-based reform in New York State. Educational Policy, 18, 456-490. Site-based management and accountability program, North Carolina General Statute 115C-105.20, Article 8B (1996). Smylie, M. (1994). Redesigning teachers’ work: Connections to the classroom. In Review of Research in Education (pp. 129-177). Washington, DC: American Educational Research Association.
203
Snipes, J., Doolittle, F., & Herlihy, C. (2002). Foundations for success: Case studies of how urban school systems improve student achievement. Washington, DC: Council of the Great City Schools and Manpower Demonstration Research Corporation. Retrieved November 4, 2009, from http://www.mdrc.org/publications/47/execsum.html Sommerville, J. (1971). Leadership that ‘rocks the boat,’ a boat that needs rocking. Educational Leadership, 29(1), 45-49. Spillane, J. P., & Thompson, C. L. (1997). Reconstructing conceptions of local capacity. The local education agency’s capacity for ambitious instructional reform. Educational Evaluation and Policy Analysis, 19(2), 185-203. Stetson, W. (1903). Supervision. Journal of Education, 57(13), 197. Stover, D. (2008). Reform school: We say we know how to fix our problems, so why is doing it so difficult? American School Board Journal, 195(11), 14- 18. Sunderman, G., Orfield, G., & Kim, J. (2006). The principals denied by NCLB are central to visionary school reform. Principal Leadership, 6, 16-19. Supovitz, J. (2006). The case for district-based reform: Leading, building, and sustaining school improvement. Cambridge, MA: Harvard Education Press. Supovitz, J. (2008). Melding internal and external support for school improvement: How the district role changes when working closely with external instructional support providers. Peabody Journal of Education, 83, 459-478.
204
Swanson, J. C. (1956). The school board and the superintendent. In Education: A key to lasting peace: Official report, 82nd annual convention, American Association of School Administrators. Washington, DC: American Association of School Administrators. Swift, D. (1971). Ideology and change in the public schools. Columbus, Ohio: Merrill Publishing Co. Taylor, F. (1911). The principles of scientific management. New York: Harper Press. Online version retrieved May 19, 2009, from http://www.gutenberg.org/catalog/world/readfile?kfiles=12287&pageno=13.mnbv
cx12 Thornton, B., Shepperson, T., & Canavero, S. (2007). A systems approach to school improvement: Program evaluation and organizational learning. Education, 128(1), 48-55. Tirozzi, G. (2001). News and notes. Leadership, 30(5), 6. Todnem, G.R., & Warner, M. P. (1994). The QUILT program assesses teacher and student change: Demonstrating the benefits of staff development. Journal of Staff Development, 15(4), 66-67. Toepfer Jr., C. (1973). The supervisor’s responsibility for innovation. Educational Leadership, 30(8), 740-743. Togneri, W., & Anderson, S. (2003a). Beyond Islands of Excellence: What districts can do to improve instruction and achievement in all schools. Baltimore, MD: Learning First Alliance, The Association of Supervision And Curriculum Development.
205
Togneri, W., & Anderson, S. (2003b). How high poverty districts improve. Leadership, 33(1), 12-16. Toppo, G. (2008) ‘Nation at Risk’: The best thing or the worst thing for education? USA Today, April 22, 2008. Tucker, M., & Codding, J. (Eds.). (2002). The principal challenge: Leading and managing schools in an era of accountability. Hoboken, NJ: Jossey- Bass/Wiley. Tumin, M. (1963). Education and the Cult of Efficiency: A study of the social forces that have shaped the administration of public schools. American Sociological Review, 28(3), 480-481. Tyack, D. (1974). The one best system: A history of American urban education. Cambridge, MA: Harvard University Press. Tyack, D. (2002). Forgotten players: How local school districts shaped American education (pp 9-24). In A. Hightower, M. Knapp, J. Marsh & M. McLaughlin (Eds.), School Districts and Instructional Renewal. New York: Teachers College Press. Tyack, D., & Hansot, E. (1981). Conflict and consensus in American public education. Daedalus, 110(3), 1-25. UFT press release – reaction to budget cuts. (January 31, 2009) Posted to http://gchsuft.blogspot.com/2009/01/uft-press-release-reaction-to-
budget.html
206
Understanding the North Carolina End-of-Course Tests. (2007). Assessment brief
issued by the North Carolina Department of Public Instruction Division of
Accountability Services. Retrieved from the North Carolina Department of Public
Instruction Accountability Services web site at
http://www.ncpublicschools.org/accountability/testing/shcard/abriefs/ U. S. Department of Education. (1983). A nation at risk: The imperative for educational reform. Washington, DC: U.S. Government Printing Office. Vandiver, D. (2008). Keeping pace: Administrators’ professional development. Principal Leadership, 9(3), 6-7. Van Til, W. (1965). In a climate of change. In Robert Leeper (Ed.), Role of supervisor and curriculum director in a climate of change. Washington: Association for Supervision and Curriculum Development. Viadero, D. (2009). Turnover in principalship focus of research. Education Week, 29(9), 1, 14. Wake County Board of Education. (1991). Board Policy 3040: Site-Based Web site: http://www.wcpss.net/policy-files/series/policies/4040-bp.html Wake County Public Schools District Overview, 2008-09 (n.d.). Retrieved from the WCPSS web site at http://www.wcpss.net/demographics/overview/index.html Wake County Public School System Directory. (2009). Available on line at http://www.wcpss.net/school-directory/future/index.html

207
Walker, K. (2004). Site-based management. (Issue Brief). The Principal’s Partnership. Retrieved from http://www.principalspartnership.com/ Waters, J., & Marzano, R. (2006). School district leadership that works: The effect of superintendent leadership on student achievement. Denver, CO: Mid-continent Research for Education and Learning. Waterman, R. (1988). The renewal factor. Director, 41(10), 62-69. Weber, G. (1971). Inner-city children can be taught to read: Four successful schools. Council for Basic Education Occasional Papers, 18, 1-41. Weick, K. (1982). Administering education in loosely coupled schools. Education Digest, 48(4), 28-31. Wiles, J., & Bondi, J. (1986). Supervision: A guide to practice (2nd ed.). Columbus, Ohio: Charles E. Merrill Publishing Company. Wiles, K. (1980). Supervision for better schools. Englewood Cliffs, NJ: Prentice- Hall. Williams, J. (1988). Eyes on the prize. New York: Penguin Books. Wimpelberg, R. (1987). The dilemma of instructional leadership and a central role for central office. In W. Greenfield (Ed.), Instructional leadership: Concepts, issues and controversies (pp. 100-117). Boston: Allyn and
Bacon.
Wood, B. (1940). Making use of the objective examination as a phase of teacher selection. Harvard Educational Review, 10(3), 277-283. Yukl, G. (1999). An evaluation of conceptual weaknesses in transformational and
charismatic leadership theories. The Leadership Quarterly, 10(2), 285-305.

APPENDIX A: INSTITUTIONAL REVIEW BOARD APPROVAL LETTER

209

APPENDIX B: SCHOOL DISTRICT REVIEW BOARD APPROVAL LETTER
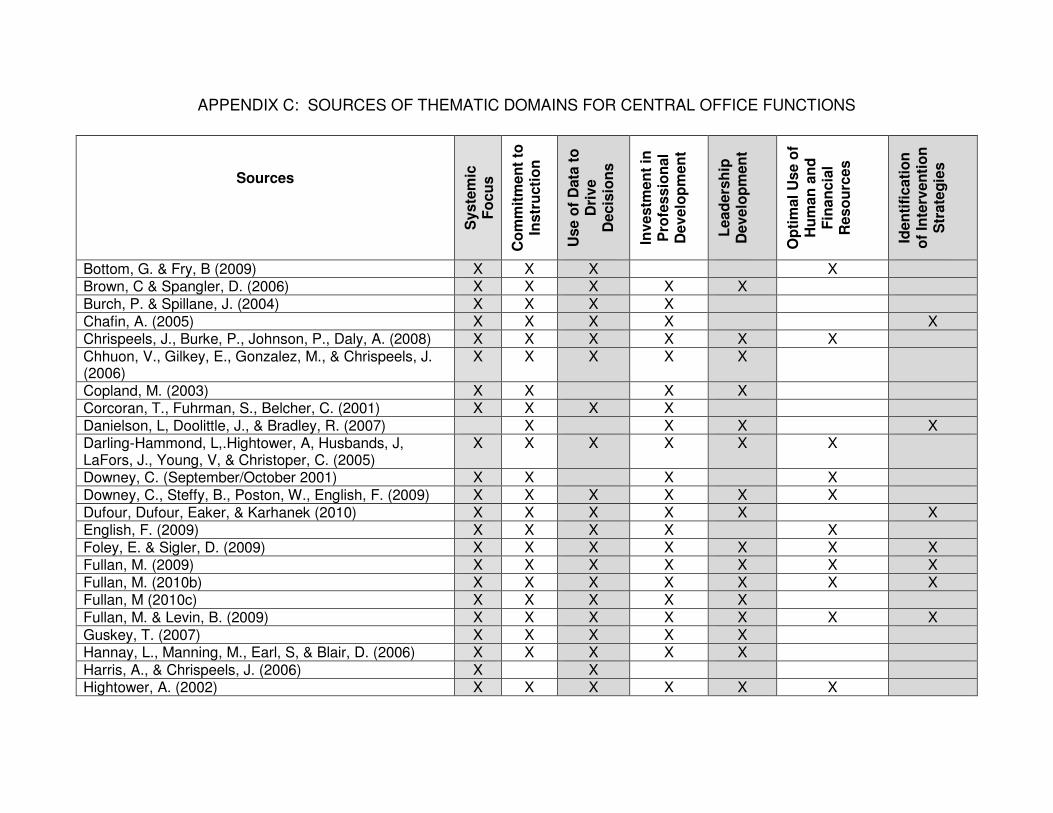
APPENDIX C: SOURCES OF THEMATIC DOMAINS FOR CENTRAL OFFICE FUNCTIONS
Sources
Syste
mic
F
ocu
s
Co
mm
itm
en
t to
In
str
ucti
on
Use o
f D
ata
to
D
rive
Decis
ion
s
Investm
en
t in
P
rofe
ssio
nal
Develo
pm
en
t
Lead
ers
hip
D
evelo
pm
en
t
Op
tim
al
Use o
f H
um
an
an
d
Fin
an
cia
l R
eso
urc
es
Iden
tifi
cati
on
o
f In
terv
en
tio
n
Str
ate
gie
s
Bottom, G. & Fry, B (2009) X X X X Brown, C & Spangler, D. (2006) X X X X X Burch, P. & Spillane, J. (2004) X X X X Chafin, A. (2005) X X X X X Chrispeels, J., Burke, P., Johnson, P., Daly, A. (2008) X X X X X X Chhuon, V., Gilkey, E., Gonzalez, M., & Chrispeels, J. (2006)
X X X X X
Copland, M. (2003) X X X X Corcoran, T., Fuhrman, S., Belcher, C. (2001) X X X X Danielson, L, Doolittle, J., & Bradley, R. (2007) X X X X Darling-Hammond, L,.Hightower, A, Husbands, J, LaFors, J., Young, V, & Christoper, C. (2005)
X X X X X X
Downey, C. (September/October 2001) X X X X Downey, C., Steffy, B., Poston, W., English, F. (2009) X X X X X X Dufour, Dufour, Eaker, & Karhanek (2010) X X X X X X English, F. (2009) X X X X X Foley, E. & Sigler, D. (2009) X X X X X X X Fullan, M. (2009) X X X X X X X Fullan, M. (2010b) X X X X X X X Fullan, M (2010c) X X X X X Fullan, M. & Levin, B. (2009) X X X X X X X Guskey, T. (2007) X X X X X Hannay, L., Manning, M., Earl, S, & Blair, D. (2006) X X X X X Harris, A., & Chrispeels, J. (2006) X X Hightower, A. (2002) X X X X X X
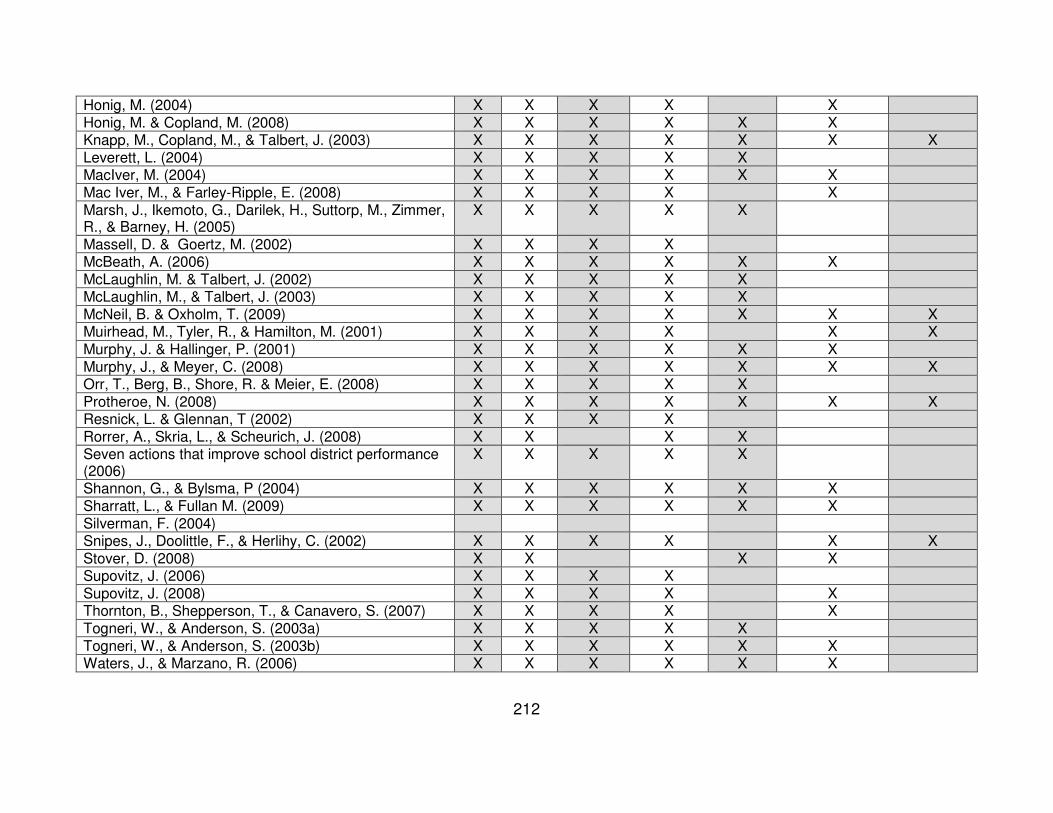
212
Honig, M. (2004) X X X X X Honig, M. & Copland, M. (2008) X X X X X X Knapp, M., Copland, M., & Talbert, J. (2003) X X X X X X X Leverett, L. (2004) X X X X X MacIver, M. (2004) X X X X X X Mac Iver, M., & Farley-Ripple, E. (2008) X X X X X Marsh, J., Ikemoto, G., Darilek, H., Suttorp, M., Zimmer, R., & Barney, H. (2005)
X X X X X
Massell, D. & Goertz, M. (2002) X X X X McBeath, A. (2006) X X X X X X McLaughlin, M. & Talbert, J. (2002) X X X X X McLaughlin, M., & Talbert, J. (2003) X X X X X McNeil, B. & Oxholm, T. (2009) X X X X X X X Muirhead, M., Tyler, R., & Hamilton, M. (2001) X X X X X X Murphy, J. & Hallinger, P. (2001) X X X X X X Murphy, J., & Meyer, C. (2008) X X X X X X X Orr, T., Berg, B., Shore, R. & Meier, E. (2008) X X X X X Protheroe, N. (2008) X X X X X X X Resnick, L. & Glennan, T (2002) X X X X Rorrer, A., Skria, L., & Scheurich, J. (2008) X X X X Seven actions that improve school district performance (2006)
X X X X X
Shannon, G., & Bylsma, P (2004) X X X X X X Sharratt, L., & Fullan M. (2009) X X X X X X Silverman, F. (2004) Snipes, J., Doolittle, F., & Herlihy, C. (2002) X X X X X X Stover, D. (2008) X X X X Supovitz, J. (2006) X X X X Supovitz, J. (2008) X X X X X Thornton, B., Shepperson, T., & Canavero, S. (2007) X X X X X Togneri, W., & Anderson, S. (2003a) X X X X X Togneri, W., & Anderson, S. (2003b) X X X X X X Waters, J., & Marzano, R. (2006) X X X X X X

APPENDIX D: SURVEY FOR PRINCIPALS
Principals Perceptions of Central Office Functions
DIRECTIONS: Please take 10-15 minutes to complete this survey by responding to the statements based on your experiences as a principal. Indicate whether each function below should be a central office responsibility in improving student achievement. While some functions may be a shared responsibility with the school and/or community, the purpose is to identify functions in which the central office has partial or complete responsibility. Responses will be compiled for overall results; however, individual responses are completely anonymous.
SECTION I: SYSTEMIC FOCUS In your opinion, do you think the central office, through a systemic focus, helps increase student achievement by:
1. Developing a systemic focus on student achievement through a district vision.
0 Disagree
0 Agree
2. Ensuring that the district vision supports equity by removing barriers to providing all students with an excellent education.
0 Disagree
0 Agree
3. Building ownership and sustaining progress through a credible process to communicate and collaborate with multiple sectors of the community.
0 Disagree
0 Agree
4. Assist stakeholders in making a commitment to a multi-year plan.
0 Disagree
0 Agree
5. Determining a small number of ambitious priorities for the district with measurable targets.
0 Disagree
0 Agree
6. Assisting all members of the organization in establishing relentless consistency while seeking continuous improvement.
0 Disagree
0 Agree
7. Educating stakeholders including the school board in building an improvement agenda.
0 Disagree
0 Agree
8. Promoting collaborative relationship that instill trust and pride in the district.
0 Disagree
0 Agree
9. Developing shared norms for reform practices throughout the district.
0 Disagree
0 Agree
10. Developing processes for holding all staff members accountable to the district vision and goals.
0 Disagree
0 Agree
11. Developing a problem-solving focus in which problems are viewed as issues to be solved.
0 Disagree
0 Agree
12. Ensuring policy and program coherence by removing competing programs and requirements.
0 Disagree
0 Agree
13. Engaging in district-wide, research-based continuous improvement process/cycle.
0 Disagree
0 Agree
14. Promoting service orientation towards schools and community.
0 Disagree
0 Agree
15. Coordinating external assistance providers (i.e. technology, professional development, data collection).
0 Disagree
0 Agree
16. Empowering schools to customize as needed within a district framework.
0 Disagree
0 Agree

214
SECTION II: COMMITMENT TO INSTRUCTION In your opinion, do you think the central office, through commitment to instruction, helps increase student achievement by:
17. Establishing a clear focus on instruction. 0 Disagree
0 Agree
18. Establishing an infrastructure that supports instruction as the key component in the district.
0 Disagree
0 Agree
19. Ensuring alignment of state and district standards, assessments, and student objectives.
0 Disagree
0 Agree
20. Identifying research based programs, strategies, and instructional practices.
0 Disagree
0 Agree
21. Assisting in the selection and deep alignment of instructional materials to district objectives and assessment as well as state assessments.
0 Disagree
0 Agree
22. Designing pacing guides with a feasible number of objectives to be taught in the time allotted.
0 Disagree
0 Agree
SECTION III: USE OF DATA TO PROMOTE DECISIONS In your opinion, do you think the central office, through data driven decisions, helps increase student achievement by:
23. Establishing multi-measure accountability systems. 0 Disagree
0 Agree
24. Promoting overall transparency of the results related to the core business of the district.
0 Disagree
0 Agree
25. Developing formative assessments aligned with the curriculum and summative assessments.
0 Disagree
0 Agree
26. Assisting in benchmarking between schools within the district and with other districts as a whole.
0 Disagree
0 Agree
27. Constructing mechanisms to provide data at all levels of the system. 0 Disagree
0 Agree
28. Promoting data-based decision making at all levels of the district.
0 Disagree
0 Agree
29. Setting growth targets based on data.
0 Disagree
0 Agree
30. Assessing progress toward district goal and individual school objectives. 0 Disagree
0 Agree
31. Providing assistance to school in the understanding and use of data.
0 Disagree
0 Agree
32. Ensuring available technology support for maintaining and communicating data.
0 Disagree
0 Agree
33. Utilizing program evaluations to document a program’s data-based merit. 0 Disagree
0 Agree

215
SECTION IV: INVESTMENT IN PROFESSIONAL DEVELOPMENT In your opinion, do you think the central office, through professional development, helps increase student achievement by:
34. Ensuring system-wide professional development focused on building the capacity to improve learning and teaching.
0 Disagree
0 Agree
35. Providing high-quality professional development that is on-going, job-embedded, and aligned with identified needs and targeted goals.
0 Disagree
0 Agree
36. Providing professional development for role-alike groups (i.e. counselors, media specialists, principals).
0 Disagree
0 Agree
37. Providing professional development to assist new employees in understanding district expectations.
0 Disagree
0 Agree
38. Establishing formal and informal mentoring programs.
0 Disagree
0 Agree
39. Supporting structures for learning communities throughout the district (i.e. schools, school based specialists, central services staff).
0 Disagree
0 Agree
SECTION V: LEADERSHIP DEVELOPMENT In your opinion, do you think the central office, through leadership development, helps increase student achievement by:
40. Encouraging distributed leadership through job-embedded work.
0 Disagree
0 Agree
41. Ensuring strong instructional leadership by advancing skills of district and school leaders.
0 Disagree
0 Agree
42. Providing all leaders with the knowledge to understand the elements of organizational change.
43. Ensuring that the principal is the instructional leader within the school.
0 Disagree
0 Agree
44. Partnering with institutes of higher education to provide professional development
0 Disagree
0 Agree
45. Offering advancement for the most effective individuals. 0 Disagree
0 Agree
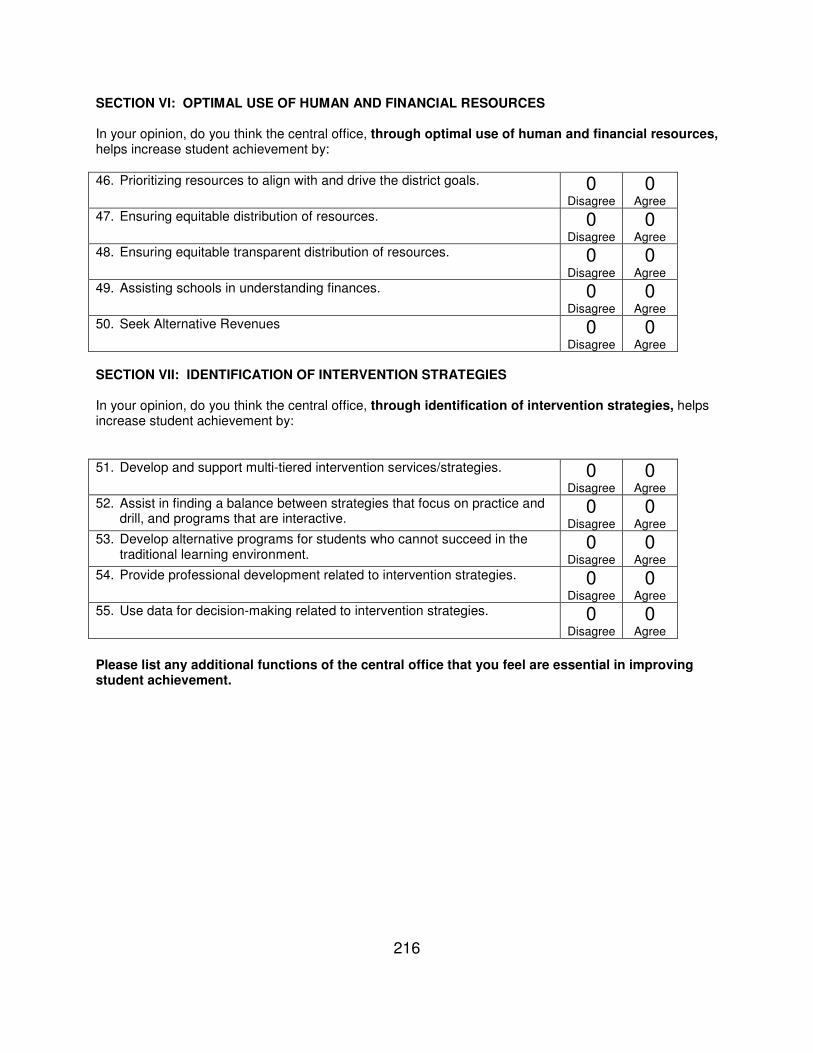
216
SECTION VI: OPTIMAL USE OF HUMAN AND FINANCIAL RESOURCES In your opinion, do you think the central office, through optimal use of human and financial resources, helps increase student achievement by:
46. Prioritizing resources to align with and drive the district goals. 0 Disagree
0 Agree
47. Ensuring equitable distribution of resources. 0 Disagree
0 Agree
48. Ensuring equitable transparent distribution of resources. 0 Disagree
0 Agree
49. Assisting schools in understanding finances. 0 Disagree
0 Agree
50. Seek Alternative Revenues 0 Disagree
0 Agree
SECTION VII: IDENTIFICATION OF INTERVENTION STRATEGIES In your opinion, do you think the central office, through identification of intervention strategies, helps increase student achievement by:
51. Develop and support multi-tiered intervention services/strategies. 0 Disagree
0 Agree
52. Assist in finding a balance between strategies that focus on practice and drill, and programs that are interactive.
0 Disagree
0 Agree
53. Develop alternative programs for students who cannot succeed in the traditional learning environment.
0 Disagree
0 Agree
54. Provide professional development related to intervention strategies. 0 Disagree
0 Agree
55. Use data for decision-making related to intervention strategies. 0 Disagree
0 Agree
Please list any additional functions of the central office that you feel are essential in improving student achievement.

APPENDIX E: INVITATION TO PRINCIPALS TO PARTICIPATE IN STUDY
March 21, 2010 Dear Principal: As a doctoral student, I am in the process of collecting data for my dissertation. The purpose of this study is to explore principals’ perceptions of central office functions that support increased achievement for all students. In addition, I will investigate whether there is a difference in perceptions of principals’ in schools that made Adequate Yearly Progress (AYP) and principals in schools that did not make AYP. Information from this study will allow districts to focus the support of central office supervisors. As a fellow educator, I understand how valuable your time is. For that reason, I have constructed a survey that can easily be completed in 10-15 minutes. Individual responses will be confidential and surveys will be destroyed following the completion of the study. Surveys have been coded to allow responses to be separated by schools that made AYP and those schools that did not. After the responses have been recorded, codes will be eradicated and, again, all surveys will be destroyed following the completion of the study. Thank you in advance for participating in this study by completing the survey. Please return the survey in the self-addressed envelope that has been provided. I look forward to sharing the results of the survey once the study is completed. If you have questions, please feel free to contact me at [email protected] or call my home at (252) 291-9486. Sincerely, Terri R. Cobb Doctoral Candidate East Carolina University UMCIRB # 10-0150 WCPSS Project No. 741

APPENDIX F: FOCUS GROUP QUESTIONS
1. (Share results of survey.) Are there any surprises? Do you feel this information is an accurate reflection of principals’ perceptions of the district’s role in increasing student achievement? Are there any results with which you disagree? Explain your answer.
2. Do you think the responses for this group would be different in another district? Why or why not?
3. From the seven domains within the theoretical framework, which areas do you think are the most essential district functions in improving achievement for all students? Why?
4. From the seven domains within the theoretical framework, which areas do you think are the least essential district functions in improving achievement for all students? Why?
5. Can you identify areas under each thematic domain that you feel should have not been included on the survey? Explain your answer.
6. Can you identify areas that you feel should have been included that were not? Explain your answers.
7. One purpose of this study was to explore the relationship between responses of principals at schools that met AYP and schools that did not meet AYP. Are there other comparisons that you feel should be explored in order to understand the different levels of support that are required by schools in increasing achievement for all students? Would the results be different?
8. How might the results from this study be beneficial to the superintendent and/or district leaders? Explain your answer.
9. The current research warns that increased achievement for all students will not occur without substantial involvement from the district. Do you agree or disagree? Why?
10. Without this support from the district, will these tasks be accomplished? Who will take responsibility? Without this support what would be the impact on the role of the principal?
11. Is there anything else that you would like to add about how central services can support your school and/or the district in improving achievement for all students?