Embed Size (px)
Citation preview

1
The Sustainability of the Trust-based Network: A Historical Analysis of the Japanese
Mobile Phone Industry 1993-2013
Yusuke Hoshino1, Takashi Hirao2
Abstract
This study explores the characteristics of the trust-based network in the Japanese
mobile phone industry for the period 1993–2013, by examining the handset
manufacturers that have traded with NTT DOCOMO, the biggest Japanese network
operator. This study divides these twenty one years by changes in mobile
communications standards and platforms, and measures the share of the handsets
models and the number of the participants in the network of each period. Based on both
primary and secondary sources, we find that a degree of inter-organizational trust is
different between the participants, and the impact of change in platform leaders is
critical for the sustainability of the trust-based network.
Keywords: mobile phone industry; inter-organizational trust; trust-based network;
platform leader; product architecture
Introduction
As technological and market changes have become more robust, competition
has become more fierce and global. Under these circumstances, the managerial
resources of a single firm are insufficient for it to win or even survive. Consequently,
many firms collaborate and form a group with other firms. There are many frameworks
that describe this phenomenon. Previous studies have shown that the various types of
inter-firm collaborations in 20th century Japan include strategic alliance or “keiretsu”,
the platform (Gawer and Cusmano, 2002), and the business ecosystem (Iansiti and
Levien, 2004).
It is said, however, that these firms may suffer from the opportunistic behavior
of their partners. As a result, firms need a safeguard to either prevent this from
occurring or to sanction an opportunistic trading counterpart (Williamson, 1985). A vast
1 Faculty of Political Science and Economics, Musashino University, Tokyo, Japan.
2 Faculty of Business Administration and Information, Tokyo University of Science
Suwa, Nagano, Japan.

2
amount of literature explores two types of safeguards: formal safeguards and informal
safeguards. One type of formal safeguards is the legal contract (Williamson, 1985).
Informal safeguards consist of relational or goodwill trust (Bradach and Eccles, 1989;
Sako, 1991), reputation (Kreps and Wilson, 1982; Weigelt and Camerer, 1988), greater
cooperation (Heide and Miner, 1992), increased expectation of continuity (Anderson and
Weitz, 1989, 1992; Heide and John, 1988), better product differentiation, and improved
operational performance (Bensaou and Anderson, 1999). The inter-organizational trust
that we focus on in this study is one such informal safeguard (Anderson and Weitz, 1989,
1992; Heide and John, 1988).
Previous studies have defined trust as a positive expectation of trustworthiness
(i.e., expectations about the trustee’s intention) and a willingness to accept vulnerability
(i.e., an intention to depend on the trustee) (Fulmer and Gelfand, 2012). Moreover, some
studies on inter-organizational trust have indicated that prior exchange history and
expectations of continuity influence trust (Poppo, Zhou, and Ryu, 2008).
However, most of these studies have focused only on the relationship between
firms, and very little focus has been out into analyzing the trust-based network itself.
Here, we define this “trust-based network” as the business group from which the nexus
of participants are derived when forming inter-organizational trust.
In the original literature of platform management (Gawer and Cusmano, 2002),
the authors focused only on the activities of the platform leaders. Iansiti and Levien
(2004) also pointed out the role of the keystone as central to business networks in
enhancing the performance of the business ecosystem. There is some room for
additional research on these network characteristics, especially on the membership
characteristics.
Additionally, we see that the inter-organizational trust begins and ends,
However, because previous studies used questionnaires at only one point in time
(Molina-Morales and Martínez-Fernández, 2009; Brattstrom, Lofsten, and Richtner,
2012; Poppo, Zhou, and Ryu, 2008; De Jong and Elfring, 2010; Connelly, Miller, and
Devers, 2012), any investigation of inter-organizational trust did not seem to analyze
the dynamics of the business network.
This study explores the characteristics of the trust-based network in the
Japanese mobile phone industry, for the period 1993–2013 by examining the handset
manufacturers that traded with NTT DOCOMO, the biggest Japanese network operator.
The study focuses on how the industry was formed and why it collapsed. , This study
measures the transition of the number of handset models and handset manufactures in
terms of each generation of mobile communications standards (i.e., 2G to 4G) and
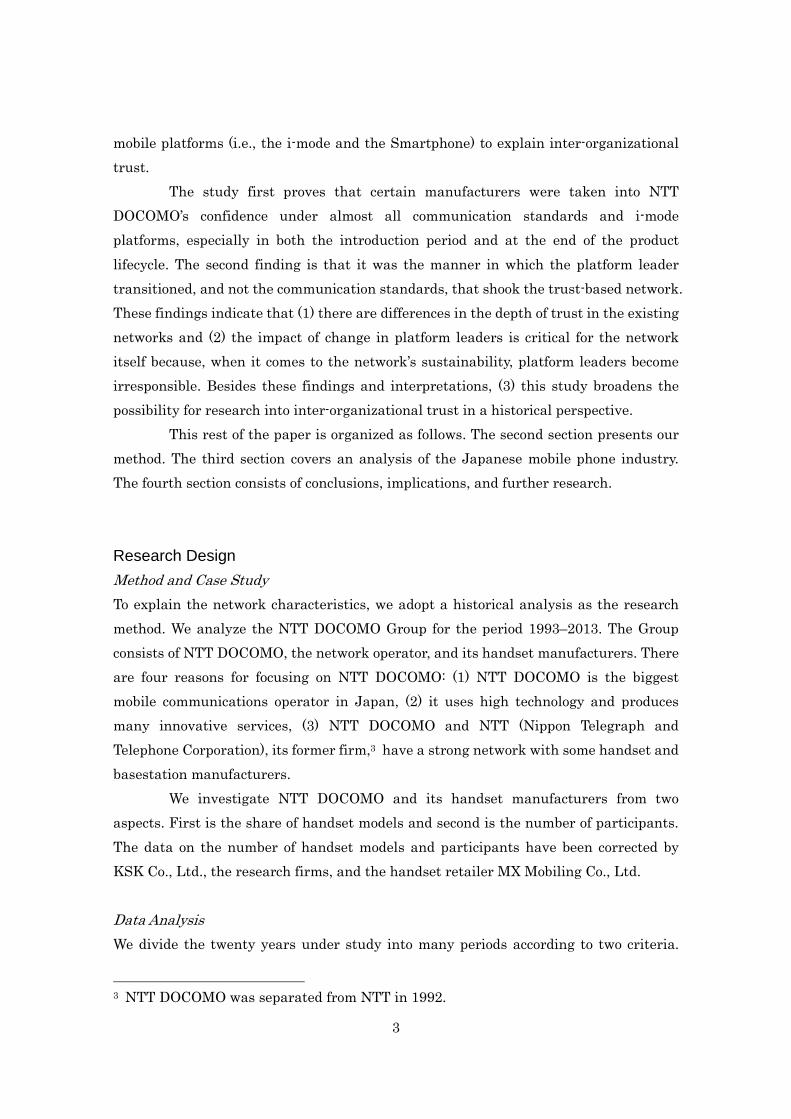
3
mobile platforms (i.e., the i-mode and the Smartphone) to explain inter-organizational
trust.
The study first proves that certain manufacturers were taken into NTT
DOCOMO’s confidence under almost all communication standards and i-mode
platforms, especially in both the introduction period and at the end of the product
lifecycle. The second finding is that it was the manner in which the platform leader
transitioned, and not the communication standards, that shook the trust-based network.
These findings indicate that (1) there are differences in the depth of trust in the existing
networks and (2) the impact of change in platform leaders is critical for the network
itself because, when it comes to the network’s sustainability, platform leaders become
irresponsible. Besides these findings and interpretations, (3) this study broadens the
possibility for research into inter-organizational trust in a historical perspective.
This rest of the paper is organized as follows. The second section presents our
method. The third section covers an analysis of the Japanese mobile phone industry.
The fourth section consists of conclusions, implications, and further research.
Research Design
Method and Case Study
To explain the network characteristics, we adopt a historical analysis as the research
method. We analyze the NTT DOCOMO Group for the period 1993–2013. The Group
consists of NTT DOCOMO, the network operator, and its handset manufacturers. There
are four reasons for focusing on NTT DOCOMO: (1) NTT DOCOMO is the biggest
mobile communications operator in Japan, (2) it uses high technology and produces
many innovative services, (3) NTT DOCOMO and NTT (Nippon Telegraph and
Telephone Corporation), its former firm,3 have a strong network with some handset and
basestation manufacturers.
We investigate NTT DOCOMO and its handset manufacturers from two
aspects. First is the share of handset models and second is the number of participants.
The data on the number of handset models and participants have been corrected by
KSK Co., Ltd., the research firms, and the handset retailer MX Mobiling Co., Ltd.
Data Analysis
We divide the twenty years under study into many periods according to two criteria.
3 NTT DOCOMO was separated from NTT in 1992.

4
First, the mobile communications standards such as 2G, 3G, 3.5G, and 4G. In 1993,
NTT DOCOMO introduced the personal digital cellular (PDC) as the digital mobile
communications standard, 2G. PDC was developed in NTT, and was not compatible
with GSM, the most popular mobile communications standard worldwide. In 2001, NTT
DOCOMO introduced wideband code division multiple access (W-CDMA) as the
third-generation mobile communications standard or 3G. This was one of the five
standards set by the International Telecommunication Union (ITU), which allowed for
the use of multimedia. This introduction of 3G was the fastest introduction of a mobile
standard in the world. In 2006, NTT DOCOMO introduced HSDPA, known as “FOMA
high speed.” This new standard allowed for faster mobile data communications, and was
categorized as 3.5G. In 2011, NTT DOCOMO introduced long term evolution (LTE) as
its fourth-generation mobile communications standard.
Note that, in Japan, 1G (Analogue) mobile communications had already been
introduced as a car phone in 1979. This standard was developed by NTT. In 1985, the
“shoulder phone” was developed. In 1987, TZ-802B, as a new generation of personal
mobile phone mobile phone, was released. This standard was used by NTT DOCOMO
until 1999, and handsets using it were produced until 1995. However, we have excluded
this standard from our study because the number of handset models, handset
manufacturers, and subscribers was too small4.
We use standards as criteria because the mobile communications standard is
often used in previous studies on the mobile phone industry. For instance, Funk (2002)
used the framework of “competition between standards” and “competition within a
standard.” Funk argued that the openness of the standardization processes and the
early commitments of committee participants were the major factors behind the rapid
and global adoption of the NMT and AMPS/TACS 1G standards, as well as the GSM 2G
standard.
In our study, we have to focus on the fact that most handsets are equipped with
some standards. For instance, iPhone 4s is equipped with GSM/GPRS/EDGE (2G and
2.5G) and UMT/HSDPA (3G and 3.5G). We categorize iPhone 4s into the 3.5G standard
because 3.5G is the most advanced standard in this handset.
The second criteria are the platforms, such as voice communication only;
i-mode; and the smartphone. The concept of “platform” is the key factor that has formed
the recent global competition, especially in the electronics industry and the information
technology industry. i-mode was introduced, in 1999, as the first mobile internet system
4 The number of subscribers was only 1712 thousands in 1992, just before the
introduction of 2G.

5
of the world. It was added as a feature to almost all NTT DOCOMO phones until 2013,
and spans 2G, 3G, and 3.5G.
NTT DOCOMO introduced its first smartphone, Motorola’s “M1000,” in 2005.
In 2009, it introduced HTC’s HC-03A as its first Android smartphone. We consider all of
these as one “smartphone,” despite the variations in their operating systems (OSs). Our
reference point in defining a smartphone is a system that allows users to install their
preferred applications.
i-mode can operate on a smartphone, but operates through an i-mode
application on the Android OS. Therefore, i-mode and the smartphone can be clearly
classified as two mobile phone categories.
Furthermore, we cross mobile communications standards and platforms to
control the effects derived from both standards and platforms. We obtain twenty
categories, as follows (Table 1):
Table 1: Targets of analysis
2G 3G 3.5G 4G All platforms
All standards Y Y Y Y N
Voice communication only Y N N N N
i-mode Y Y Y N Y
Smartphone N N Y Y Y
Source: Our elaboration.
We analyze “Y” on Table 1 in the next section. All 2G, All 3G, All 3.5G, and All
4G are noted as standards. All i-mode and smartphones are noted as platforms. In
addition, 2G without i-mode, 2G with i-mode, 3.5G of i-mode, and 3.5G for the
smartphone are considered a cross between standards and platforms. We omit 3G of
i-mode and 4G of the smartphone. The reason for the former is that almost all 3G
handsets are equipped with i-mode, and for the latter is that there are no i-mode
handsets with 4G.
Two groups
We divide all handset manufactures into two groups. The first group includes
NEC, Fujitsu, Mitsubishi Electronics, and Panasonic. These firms have been trading
with NTT and NTT DOCOMO for a long time. Poppo, Zhou, and Ryu (2008) pointed out
that the past exchange history indirectly influences trust. Therefore, we regard this

6
group as the “more trusted firms.” The second group includes all the other handset
manufactures. We regard these firms as being less trusted by NTT DOCOMO. To clarify
these groups, we use archival data and the corporate history of NTT DOCOMO.
In 1989, Motorola sold the handset called “MicroTAC,” and Akio Yamaguchi,
the CEO of NTT, formerly of NTT DOCOMO, was shocked5. In July of that year,
Yamaguchi instructed the group to develop handsets smaller than “MicroTAC.” NTT
requested four firms in the Japanese electronics industry—NEC, Fujitsu, Mitsubishi
Electronics, and Panasonic—to develop this handset. The result was a handset named
“TZ-804.” Therefore, we assume these four firms as the more trusted firms, and call
them, combined, “TZ-804 manufacturers.”
Before the development of TZ-804, these four firms each had a trading
relationship with NTT. NEC and Fujitsu were strongly related to NTT and were
considered to be some of its “family firms.” EC and Panasonic were the original
manufacturers of car phone handsets, beginning production in 1979. Mitsubishi
Electronics was one of the second oldest manufacturers of car phone handsets.
Two viewpoints
To explore the mobile phone industry, we investigated two factors: (1) the
yearly share of the handset models and (2) the number of the handset manufacturers.
We used the share of handset models, rather than the market share of handsets,
because in the previous studies on inter-organizational trust, the prior exchange history
is considered a very important variable (Poppo, Zhou, and Ryu, 2008). Therefore, we
focus on the relationship between the mobile communications operator and its handset
manufacturers, and not on the popularity of handsets in the consumer markets. In this
study, we did not analyze the handset models that were retailed in each year. Each
handset model is sold over a protracted period. Consequently, there may have been
handset models in the stores that had been developed in the previous year or the year
before that.
In relation to the share of handset models, our study includes only feature
phones and smartphones, and does not include mobile routers, photo frames, or PC
modules.
The reason we use the number of participants is to explore the industry
lifecycle, the dynamics of new entrants, the exiting firms, and the firms that survive as
important viewpoints of the study (Klepper, 1996, 1997).
5 10 Years History of NTT DoCoMo.

7

8
Results
All 2G
In March 1993, NTT DOCOMO started its 2G mobile communications service,
called PDC. This standard was developed by NTT and did not diffuse to other foreign
countries until 1997, because prior to that year, NTT’s regulations stipulated that it
could not expand its business into foreign countries. PDC production ended in March
2012. That year, NTT DOCOMO released three initial handset models, called “Digital
Movado,” developed by NEC, Fujitsu, and Panasonic.
Figure 1-(a) shows the share of handset models of the foreign manufacturers,
Japanese manufacturers, and TZ-804 manufacturers during the entire 2G period. The
share of TZ-804 manufacturers was very high in 1993, which was the 2G introduction
year. In 1999, the share of TZ-804 manufacturers increased again. In the declining
period or toward the end of the lifecycle, the share of production declined sharply.
Figure 1-(b) shows the number of participants during all of 2G. There are three
points to consider: (1) All participants in this introduction period were TZ-804
manufacturers. (2) TZ-804 manufacturers maintained part of this standard, while the
other manufacturers entered and exited. (3) The exit of TZ-804 manufacturers was slow
and two manufacturers remained even during the last year.
All 3G
While, from the mid-1990s, NTT DOCOMO tried to expand production of its
original PDC, many countries were using GSM. NTT DOCOMO wanted to take the
initiative, in 3G, and encourage subscribers to use multimedia on their mobile phones.
NTT DOCOMO, Nokia, Ericsson, etc., jointly developed W-CDMA, and this standard
was accepted by the International Telecommunication Union (ITU) as one of the five 3G
standards.
NTT DOCOMO referred to W-CDMA as “FOMA,” which is an abbreviation of
“freedom of mobile multimedia access.” NTT DOCOMO released three 3G handsets in
FOMA’s initial year and four in its second year. In the initial year, all handsets were
developed by NEC and Panasonic, and in the second year, they were developed by NEC,
Panasonic, Sharp, and Toshiba.
Figure 1-(c) shows the share of all 3G handsets in 2001–2009. The figure
indicates the following: (1) TZ-804 manufacturers’ production share was high in the
introduction period, 2001–2003, and likewise for 2G. (2) At the end of the lifecycle, the
production share of the group soared.
(3) In 2002–2003, the production share of TZ-804 manufacturers both rose and

9
fell. In these years, it was difficult to develop 3G handsets. Although multimedia
capability was expected in 3G handsets, three hurdles were pointed out: battery time,
size and weight, and difficulties in software development. The development cost of one
model, in particular, rose to 10 billion yen, and the share of software development costs
reached 70%–80%. These difficulties were not solved until the release of FOMA 900i, in
2003, which was two years after the introduction of the 3G standard.
Under these circumstances, NTT DOCOMO financially supported handset
manufacturers. In 2002–2004, NTT DOCOMO invested 42 billion yen into five
manufacturers: NEC, Panasonic, Fujitsu, Mitsubishi Electronic, and Sharp. In addition,
in 2004–2006, NTT DOCOMO assisted six firms—NEC, Fujitsu, Mitsubishi Electronic,
Panasonic, Sharp, and Motorola—with 37 billion yen.
Figure 1-(d) shows the number of participants in the entire 3G production.
After the introduction of 3G, the number of new entrants into the manufacture of
TZ-804 grew slowly; and after 2004, TZ-804 manufacturers stayed with this standard.
However, after 2006, there were both sharp increases and decreases in the number of
other manufacturers in this sector. At the end of the 3G period, two TZ-804
manufacturers remained, although there were no other manufacturers in this standard.
All 3.5G
In 2006, NTT DOCOMO introduced high-speed downlink packet access
(HSDPA), called “FOMA high speed,” which provided faster mobile data
communications on its feature phones. In its initial year, NEC only developed one
handset, and in the second year, many manufacturers including TZ-804, Sharp, Sony
Ericsson, and LG began producing products with this standard.
Figure 1-(e) shows the share of all 3.5G handsets. When the 3.5G standard was
introduced, all 3.5G handsets were developed by TZ-804 manufacturers. Their share
declined along a curvilinear slope and recovered during the maturity period of 2013.
Figure 1-(f) shows the number of the participants in all 3.5G. In this generation,
TZ-804 manufacturers entered first and stayed in production until 2013. At the end of
this lifecycle, two TZ-804 manufacturers remained. In 2008, the number of participants
among TZ-804 manufacturers declined as Mitsubishi Electronic exited the mobile
handset business.
In 2009, NTT DOCOMO again invested 10 billion yen among NEC, Panasonic,
Fujitsu, and Sharp. The share of aid to the four manufacturers was aimed heavily,
toward the production of the functions equipped with those that NTT DOCOMO wanted
to obtain. The context of this financial injection differed from that of the introduction

10
period of 3G. While in the 3G standard, NTT DOCOMO funded the diffusion of 3G
handsets in the Japanese market, this time, its financial assistance was to lower its
development costs and to encourage the domestic handset manufacturers to enter the
global market. At the 2009 IR conference, Ryuji Yamada, CEO of NTT DOCOMO at that
time, said that the Japanese handset manufacturers had to develop new software for
the global market, and the foreign manufacturers, who wished to enter the Japanese
market, had to develop i-mode-related software, because the handsets’ common parts
and the manufacturers’ original handset software were not explicitly separated.
Therefore, NTT DOCOMO developed the “Operator Pack” as the middleware. The aid of
10 billion yen was used to buy back NTT DOCOMO’s handset-manufacturing
intellectual property (IP), which it used to develop its new middleware. Subsequently,
all handset manufacturers were able to use this middleware.
4G
At the end of 2010, NTT DOCOMO introduced LTE as the 4G standard.
However, neither the feature phone nor the smartphone commercialized in its initial
year. Instead, the data module was developed that year and the 4G handset was
introduced in 2011. These included “SC-03D,” by Samsung, in November; “L-01D,” by
LG, in December; and “F-05D,” by Fujitsu, in December. The 4G feature phone has
never been introduced.
Figure 1-(g) shows the curves of the share of TZ-804 manufacturers was
different from the other standards. Although TZ-804 manufacturers produced a high
share of each standard in 2G, 3G, and 3.5G, their 4G production share was low. Only
Fujitsu released one smartphone in its initial year.
Figure 1-(h) shows the number of participants in the 4G standard. Even in its
initial year, two foreign manufacturers participated in this standard. Fujitsu was
among the first Japanese handset manufacturers to produce 4G handsets, but it seemed
“one of them” of all manufacturers.
While 4G did not experience all production lifecycles, the trend of TZ-804
manufacturers was different for each of the 2G, 3G, 3.5G, and i-mode standards.
All i-mode
NTT DOCOMO released i-mode in 1999, which allowed subscribers to use
e-mail and browse Internet on their feature phone. Additional technologies were
continuously introduced. For instance, NTT DOCOMO introduced camera (2002), ring
song (2004), Flash (2003), and GPS (2006). These sequential introductions attracted

11
many subscribers. In December 2012, the share of i-mode subscribers to all NTT
DOCOMO users reached 84.8%. Consequently, during the 2000s, the diffusion of i-mode
enhanced NTT DOCOMO’s average revenue per unit (ARPU) (Figure 2).
Figure 2: NTT DOCOMO ARPU
Source: Our elaboration from NTT DOCOMO annual reports.
Figure 3-(a) shows the share of handsets models of all i-mode. At the
introduction of i-mode in 1999, TZ-804 manufacturers developed all i-mode handsets.
The trend in the share of TZ-804 manufacturers declined and increased again in
2012–2013, the maturity period of i-mode.
Figure 3-(b) shows the trend in participants. TZ-804 manufacturers were the
first to enter this standard, followed by other manufacturers. After 2000, although
TZ-804 manufacturers remained, the number of other manufacturers fluctuated. In fact,
this figure shows two periods during which the total number of manufacturers spiked.
First is the 2G period, in 2000, and second is the 3G period, in 2006.
All Smartphones
Although there is no common definition of a smartphone, we define it as a
phone with a high information processing capability and a platform that enables users
to install their preferred applications
NTT DOCOMO introduced its first smartphone in 2005— “M1000” developed
by Motorola. M1000’s mobile communications standard was 3G and equipped with the
Symbian OS. In 2006, HTC released “hTc Z,” which used Windows Mobile as its OS. In
2008, Fujitsu released “F1100” equipped with Windows Mobile. F1100 was the first
smartphone released by TZ-804 manufacturers and all other domestic manufacturers.
In 2009, HTC released HT-03A, the first Android smartphone. Because the lifecycle of
the smartphone has not reached its maturity or even experienced a period of decline, we

12
explore only its introduction and growth period.
Figure 3-(c) shows the share of smartphone handsets manufactured during the
period. In its initial production period, the foreign manufacturers were the main
players; they remained dominant until 2010. During this period, TZ-804 manufacturers
occupied minimal or or no production share. After 2009, TZ-804 manufacturers did not
have a presence even in the Android platform.,
Figure 3-(d) shows the number of participants in the smartphone industry. The
entrance of TZ-804 manufacturers followed that of foreign manufacturers. Furthermore,
TZ-804 manufacturers had become one of the late manufacturers even in the Android
platform.
During the smartphone period, the behavior of NTT DOCOMO and the handset
manufacturers changed. In 2010, Fujitsu, one of the TZ-804 manufacturers, and
Toshiba agreed to integrate the development of both mobile handsets by establishing a
joint venture. In April 2012, Fujitsu acquired a share of this joint venture from Toshiba
and changed its corporate name to Fujitsu Mobile Communications Co. Ltd.
This integration was important for Fujitsu because it developed its handsets
mainly for NTT DOCOMO, and not for KDDI and Softbank, Japan’s other mobile
operators. In contrast, Toshiba developed its handsets mainly for KDDI and Softbank
(Figure 4).
Figure 4 : Share of operators
Source: Our elaboration
This integration means that Fujitsu acquired a connection to KDDI and
Softbank from Toshiba. One month later, in May 2012, Nobuo Otani, CEO of Fujitsu

13
Mobile Communications, reported that “the purpose (of the integration) was to develop
sales channels to KDDI and Softbank, and to enhance the development power of the
smartphone”6. This interview suggests the following: First, the sales channel through
the mobile operators is important in Japan. Second, the emergence of the smartphone,
especially the Android platform, was the trigger that changed corporate strategies.
Moreover, in 2013, NEC and Panasonic, the other two TZ-804 manufacturers, exited the
smartphone industry.
On the other hand, NTT DOCOMO also changed its strategy. As seen in Figure
3-(c), NTT DOCOMO mainly purveyed Android smartphones, not from the TZ-804
manufacturers but from the other manufacturers, including both foreign and domestic
manufacturers. Note that, in May 2013, NTT DOCOMO declared Samsung’s “Galaxy
S4” and Sony’s “Xperia A” as the two priority handsets, and called this the “Two-top
strategy.”
2G without i-mode
Next, we explore the share of handset models and the number of participants
in more detail, in order to explore the precise network characteristics influenced by the
mobile communications standards and platforms. We divide 2G into “2G without
i-mode” and “2G with i-mode,” and 3.5G into “3.5G of i-mode” and “3.5G of smartphone.”
Figure 5-(a) shows the share of handset models. Similar to 2G, it is clear that
the share of TZ-804 manufacturers was high at time 2G was introduced, in 1993–1994.
The share declined in 1995–1996 and fluctuated in 1997–1998. Even at the end of this
lifecycle, its share increased again.
Figure 5-(b) shows the transition of the number of participants. After two years
of the introduction period, TZ-804 manufacturers remained in this category until the
end of the 2G lifecycle.
2G with i-mode
Figure 5-(c) shows that, in the year i-mode was introduced, TZ-804
manufacturers developed all handsets and decreased their number of models
consistently till the end of the lifecycle. Although this trend suggests that TZ-804
manufacturers transited to 3G handsets with the i-mode standard, and will be
discussed later.
Figure 5-(d) shows the number of participants in the 2G standard with i-mode.
6 Nihon Keizai Shinbun (May 13, 2012).

14
The figure indicates the following. First, one of the TZ-804 manufacturers was the first
one to use these two technologies. Second, after the two introduction years, they kept
producing as such until the last two years of this lifecycle, while the number of all
participants was highest in the second year of the lifecycle and declined consistently.
3.5G of i-mode
Figure 5-(e) shows that the curve showing the transition of the share of TZ-804
manufacturers is the same as that for all 3.5G manufacturers (Figure 1-(e)). As for the
number of participants, one of the TZ-804 manufacturers was the sole firm in the 2006
introduction year. All TZ-804 manufacturers entered this standard in 2007. After
Mitsubishi exited in 2008, the other three TZ-804 manufacturers remained.
3.5G of the smartphone
In contrast to 3.5G of i-mode, TZ-804 manufacturers did not occupy a share of
3.5G in smartphone production (Figure 5-(g)). In its introductory period, HTC, a
Taiwanese manufacturer, supplied three handsets out of every four. Of all Japanese
manufacturers, only Fujitsu supplied “F1100.” Of all handsets released in the initial
year equipped with Windows mobile, TZ-804 manufacturers supplied none, while the
share of foreign manufacturers decreased and that of Japanese manufacturers
increased in 2009–2010. TZ-804 manufacturers began supplying Android smartphones
again from 2011.
The trend in the number of participants is shown in Figure 5-(h). While the
number of all participants increased from 2008 and decreased at end of the lifecycle in
2012, all TZ-804 manufacturers participated in the latter half of this period.
Conclusions
The trend in the share of handset models
Earlier in this paper, we formulated two research questions. First, we aimed to analyze
the characteristics of the trust-based network within the Japanese mobile phone
industry. Second, we aimed to investigate how the trust-based network in this industry
was formed and how it collapsed.
With regard to these research questions, we observed the share of handset
models and the number of participants in the industry. All periods were divided into
four mobile communications standards, two platforms, and four periods wherein
standards and platforms crossed periods each year. We summarize our analyses in

15
Table 2.
Table 2: Share of TZ-804 handset models in all periods
Source: Our elaboration.
This table shows our analyses of the share of TZ-804 handset models. “High”
indicates that the share of TZ-804 manufacturers was high, and “Low” indicates that
the share was low. There are periods with high shares of TZ-804 manufacturers and
those with low shares of the same manufacturers.
We interpret the reason for the high share in the introduction period as follows:
It is important for the platform leaders to safely introduce new standards or platforms.
Therefore, a platform leader selects trustworthy partners. The reason for the high share
at the end of the lifecycle is that platform leaders are responsible for the success of its
platform not only for its partners but also for the users and their preferred applications.
Consequently, the platform leader seeks trustworthy partners, who agree to develop the
latest products using the old standard/platform.
However, these partners are not always trusted. There are cells written “Low”
in Table 2. We interpret this difference of “High” and “Low” as follows: Platforms
provide stronger constraints than standards do. In the introduction period, while the
share of TZ-804 manufacturers was high in the “before smartphone” period (All 2G; 2G
without i-mode; 2G with i-mode; All 3G; 3.5G i-mode), the share was low in the

16
“smartphone” period (3.5G smartphone; 4G; and All smartphone). Note that not all 4G
devices consisted of feature phones, but rather consisted smartphones. Therefore, we
can categorize the results in Table 2 into “before smartphone” and “after smartphone.”
This category criterion seems to explain the difference in “End of the lifecycle”
in Table 2. The share of TZ-804 was low at the end of the lifecycle in All 2G and 2G with
i-mode, such that, for both, 2005 marked the end of their respective lifecycles. This
indicates that NTT DOCOMO wanted its subscribers to transit to 3G to increase data
earnings, as well as handset manufacturers to develop 3G handsets. In the late 1990s, it
was said that Voice ARPU declined continuously worldwide. Therefore, mobile
communications operators needed another source of revenue. NTT DOCOMO started to
commercialize the mobile internet system and i-mode, and its share of data ARPU
increased during the 2000s.
In considering the above facts, we obtain two findings: First, the trusted
partners enter first and exit last in a lifecycle. Second, platforms are stronger
constraints than standards.
Trend of the participants
Next, we summarize the trend of the participants. Except for the 3.5G standard of
smartphones, 4G, and the smartphone period, TZ-804 manufacturers show the same
pattern; that is, they enter first and remain until the end. On the other hand, the trend
of other manufacturers sometimes fluctuates (All 2G; 2G without i-mode; and All
i-mode), and sometimes there is a shake-out (2G with i-mode; 3G; All 3.5G; and 3.5G of
i-mode).
We can analyze the pattern of TZ-804 manufacturers as being the same as that
for the share of handset models. That is, the change in platform influenced the trend
toward TZ-804 manufacturers.
Other findings
There are other findings that result from describing the brief history of each period.
NTT DOCOMO played an important role in this network. For instance, it developed the
2G and 3G mobile communications standards, the mobile internet format, and financial
aid for the production of 3G handsets. These facts mean that NTT DOCOMO was
undoubtedly the center of this network, and its efforts focused on helping this network
thrive during the “before smartphone” period.
On the contrary, it is widely known that a smartphone’s OS is limited to only a
few firms such as Microsoft, Apple, Google, and Research in Motion. These firms
17
produced the original platform that attracts the production of software, books, and
magazines.
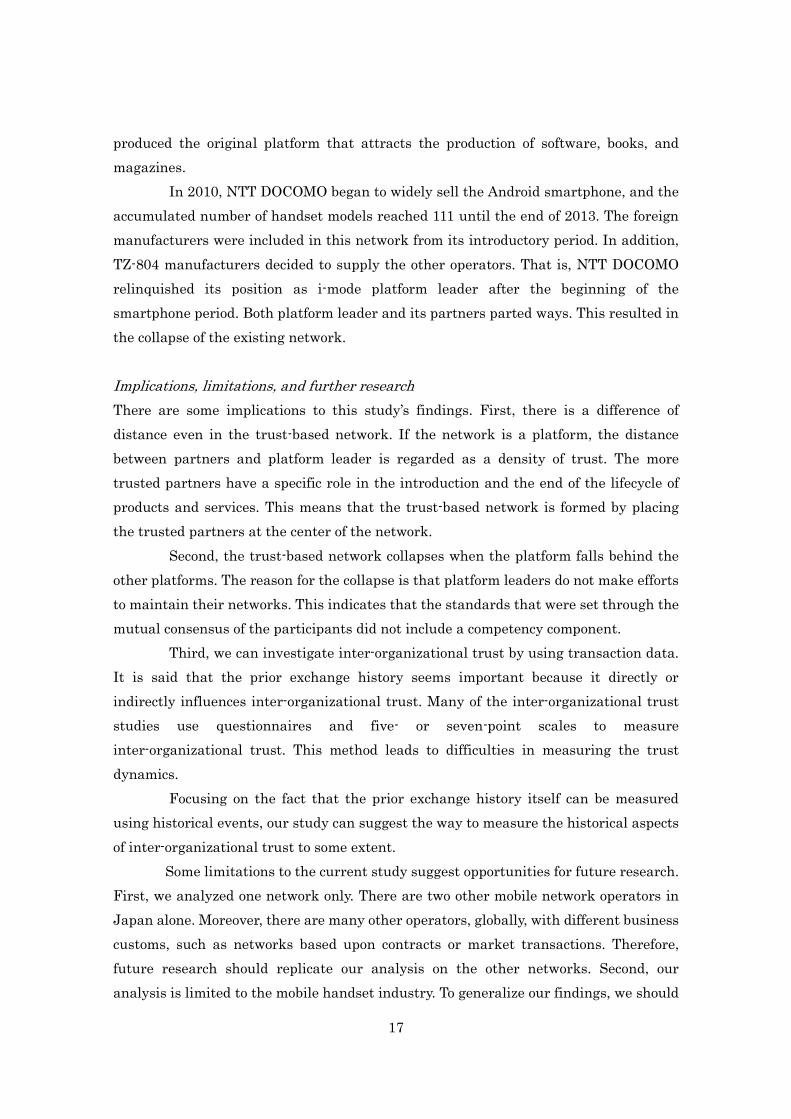
In 2010, NTT DOCOMO began to widely sell the Android smartphone, and the
accumulated number of handset models reached 111 until the end of 2013. The foreign
manufacturers were included in this network from its introductory period. In addition,
TZ-804 manufacturers decided to supply the other operators. That is, NTT DOCOMO
relinquished its position as i-mode platform leader after the beginning of the
smartphone period. Both platform leader and its partners parted ways. This resulted in
the collapse of the existing network.
Implications, limitations, and further research
There are some implications to this study’s findings. First, there is a difference of
distance even in the trust-based network. If the network is a platform, the distance
between partners and platform leader is regarded as a density of trust. The more
trusted partners have a specific role in the introduction and the end of the lifecycle of
products and services. This means that the trust-based network is formed by placing
the trusted partners at the center of the network.
Second, the trust-based network collapses when the platform falls behind the
other platforms. The reason for the collapse is that platform leaders do not make efforts
to maintain their networks. This indicates that the standards that were set through the
mutual consensus of the participants did not include a competency component.
Third, we can investigate inter-organizational trust by using transaction data.
It is said that the prior exchange history seems important because it directly or
indirectly influences inter-organizational trust. Many of the inter-organizational trust
studies use questionnaires and five- or seven-point scales to measure
inter-organizational trust. This method leads to difficulties in measuring the trust
dynamics.
Focusing on the fact that the prior exchange history itself can be measured
using historical events, our study can suggest the way to measure the historical aspects
of inter-organizational trust to some extent.
Some limitations to the current study suggest opportunities for future research.
First, we analyzed one network only. There are two other mobile network operators in
Japan alone. Moreover, there are many other operators, globally, with different business
customs, such as networks based upon contracts or market transactions. Therefore,
future research should replicate our analysis on the other networks. Second, our
analysis is limited to the mobile handset industry. To generalize our findings, we should

18
control for some specific industrial variables.
Recently, competition has become more rapid and fierce. Firms collaborate and
keep pace with other firms. The successes or failures of a network depend on the
activities of the leader and its more trusted partners. This study focuses on the findings
that were clarified through historical analysis, and results of similar investigations of
other types of networks may vary considerably.
Acknowledgements
This research was partially supported by the Japan Society for the Promotion of Science,
Grant-in-Aid for Scientific Research (A), 23243054, 2011.
References
1. Andreson, E., and B. Weitz, (1989) “Determinants of continuity in conventional
channel dyads,” Marketing Science, 8: 310-23.
2. __, and __, (1992) “The use of pledges to build and sustain commitment in
distribution channels,” Journal of Marketing Reviews, 24: 18-34.
3. Bensaou, M., and E. Anderson, (1999) “Buyer-Supplier Relations in Industrial
Markets; When Do Buyers Risk Making Idiosyncratic Investments?,” Organization
Science, 10(4): 460-81.
4. Bradach, J.L., and R. Eccles, (1989) “Markets versus hierarchies: From ideal types
to plural forms,” Annual Review of Sociology, 15: 97-118.
5. Brattstrom, A., H.Lofsten, and A.Richtner, (2012) “Creativity, trust and systematic
processes in product development,” Research Policy 41: 743– 755.
6. Connelly, B.L., T. Miller, and C.E. Devers, (2012) “Under a cloud of suspicion: Trust,
distrust, and their interactive effect in interorganizational contracting,” Strategic
Management Journal, 33:820-833.
7. De Jong, B.A., and T. Elfring (2010) “How does trust affect the performance of
ongoing teams? The mediating roke of reflexivity, monitoring, and effort,” Academy
of Management Journal, 53(3):535-549.
8. Fulmer, C.A., and M.J. Gelfand, (2012) “At What Level (and in Whom) We Trust:
Trust Across Multiple Organizational Levels,” Journal of Management, 38(4):
1167-1230.
9. Funk, J.L., (2002) Global Competition Between and Within Standards, New York:
Palgrave.

19
10. Gawer A., and M.A. Cusmano, (2002) Platform Leadership: How Intel, Microsoft,
and Cisco Drive Industry Innovation, Boston: Harvard University Press.
11. Heide, J.B., and G. John, (1988) “The role of dependence balancing in safeguarding
transaction-specific assets in conventional channels,” Journal of Marketing, 52(1):
20-35.
12. __, and A.S. Miner, (1992) “The shadow of the future: Effects of anticipated
integration and frequency of contact on buyer-seller cooperation,” Academic
Management Journal, 35(2): 265-91.
13. Iansiti, M. and R. Levien, (2004) The Keystone Advantage: What the New Dynamics
of Business Ecosystems Mean for Strategy, Innovation, and Sustainability, Boston:
Harvard University Press.
14. Klepper, S, (1996) “Entry, exit, growth, and innovation over the product life cycle,”
American Economic Review, 86(3): 562-583.
15. __, (1997) “Industry Lifecycles,” Industrial and Corporate Change, 6(1): 145-181.
16. Kreps, D., and R. Wilson, (1982) “Reputation and imperfect information,” Journal of
Economic Theory, 27: 253-79.
17. Molina-Morales, F.X., M.T. Martínez-Fernández, , (2009) “Too much love in the
neighborhood can hurt: how an excess of intensity and trust in relationships may
produce negative effects on firms,” Strategic Management Journal, 30(9):
1013–1023.
18. Nielsen, B.B., and S. Nielsen (2009) “Learning and Innovation in International
Strategic Alliances: An Empirical Test of the Role of Trust and Tacitness,” Journal of
Management Studies, 46(6):1031-1056.
19. Poppo, L., K.Z. Zhou, and S. Ryu (2008) “Alternative Origins to Interorganizational
Trust: An Interdependence Perspective on the Shadow of the Past and the Shadow
of the Future,” Organization Science, 19(1): 39-55.
20. Sako, M., (1992) Price, quality and trust: inter-firm relations in Britain and Japan,
New York: Cambridge University Press.
21. Weigelt, K., and C. Camerer, (1988) “Reputation and corporate strategy: A review of
recent theory and applications,” Strategic Management Journal, 9(5): 443-54.
22. Williamson, O.E., (1985) The Economic Institutions of Capitalism, New York: Free
Press.

20
Figure 1: The share of handsets models and the number of participants in all standards

21
Figure 3: The share of handsets models and the number of participants in two platforms

22
Figure 5: The share of handsets models and the number of participants in the other
periods