Embed Size (px)
Citation preview
AbstractThe Portland Oregon Transportation Archive Listing (PORTAL) archives high resolution traffic data including speed, volume, and occupancy collected from 500 freeway loop detectors in the Portland metropolitan area. PORTAL currently provides measures related to total congestion that occurs on the freeway network, but cannot presently distinguish between recurrent and non-recurrent congestion effects. In response to the need to make such a distinction, the objective of this paper is to describe the incorporation of freeway incident data received from the Oregon Department of Transportation (ODOT) into PORTAL. ODOT’s freeway incident database includes information about vehicle crashes and stalls, debris on the road, construction and other random events. The paper describes the incident archive architecture and demonstrates how users can view incident data associated with a particular time frame and location. For example, a user analyzing data from a particular day will be able to immediately access associated incident data so the user can determine if the traffic pattern is related to an incident. In addition, freeway incident performance metrics will be described, including tracking of incident trends over time and location and numbers of incidents by incident type. Finally, the paper will describe how comparing incidents with weather data archived in the PORTAL database can be used to determine how weather has influenced incidents. The above-described incident performance metrics are useful to traffic researchers and practitioners and may contribute to incident-reduction measures in the Portland area.
ConclusionsThis paper has described an automated data cleaning and aggregation process for incident data from the ODOT ATMS database. By automating the data cleaning, it is now possible to quickly produce incident records from ATMS database incident entries, which are stored in the PORTAL data archive. Having such incident records in PORTAL allows incident statistics to be generated with minimal effort. In addition, any PORTAL user can easily access the incidents for a particular freeway during a time interval so that traffic patterns can be compared with associated incident data. In particular, this research has demonstrated how incidents can be displayed on speed contour plots to allow users to distinguish between recurrent and non-recurrent congestion. Finally, since PORTAL archives weather data, weather conditions can be easily compared to incident records. This flexible, automatic incident cleaning and archive technology provides a new and useful tool to traffic practitioners and researchers.
AcknowledgementsThe authors thank the Jack Marchant and Dennis Mitchell at the Oregon Department of Transportation for providing the data and the National Science Foundation for funding this research.
Highwaya Length (miles)
Incidents/Mile/Day
Monitored Length (miles)
Incidents/MVMTb
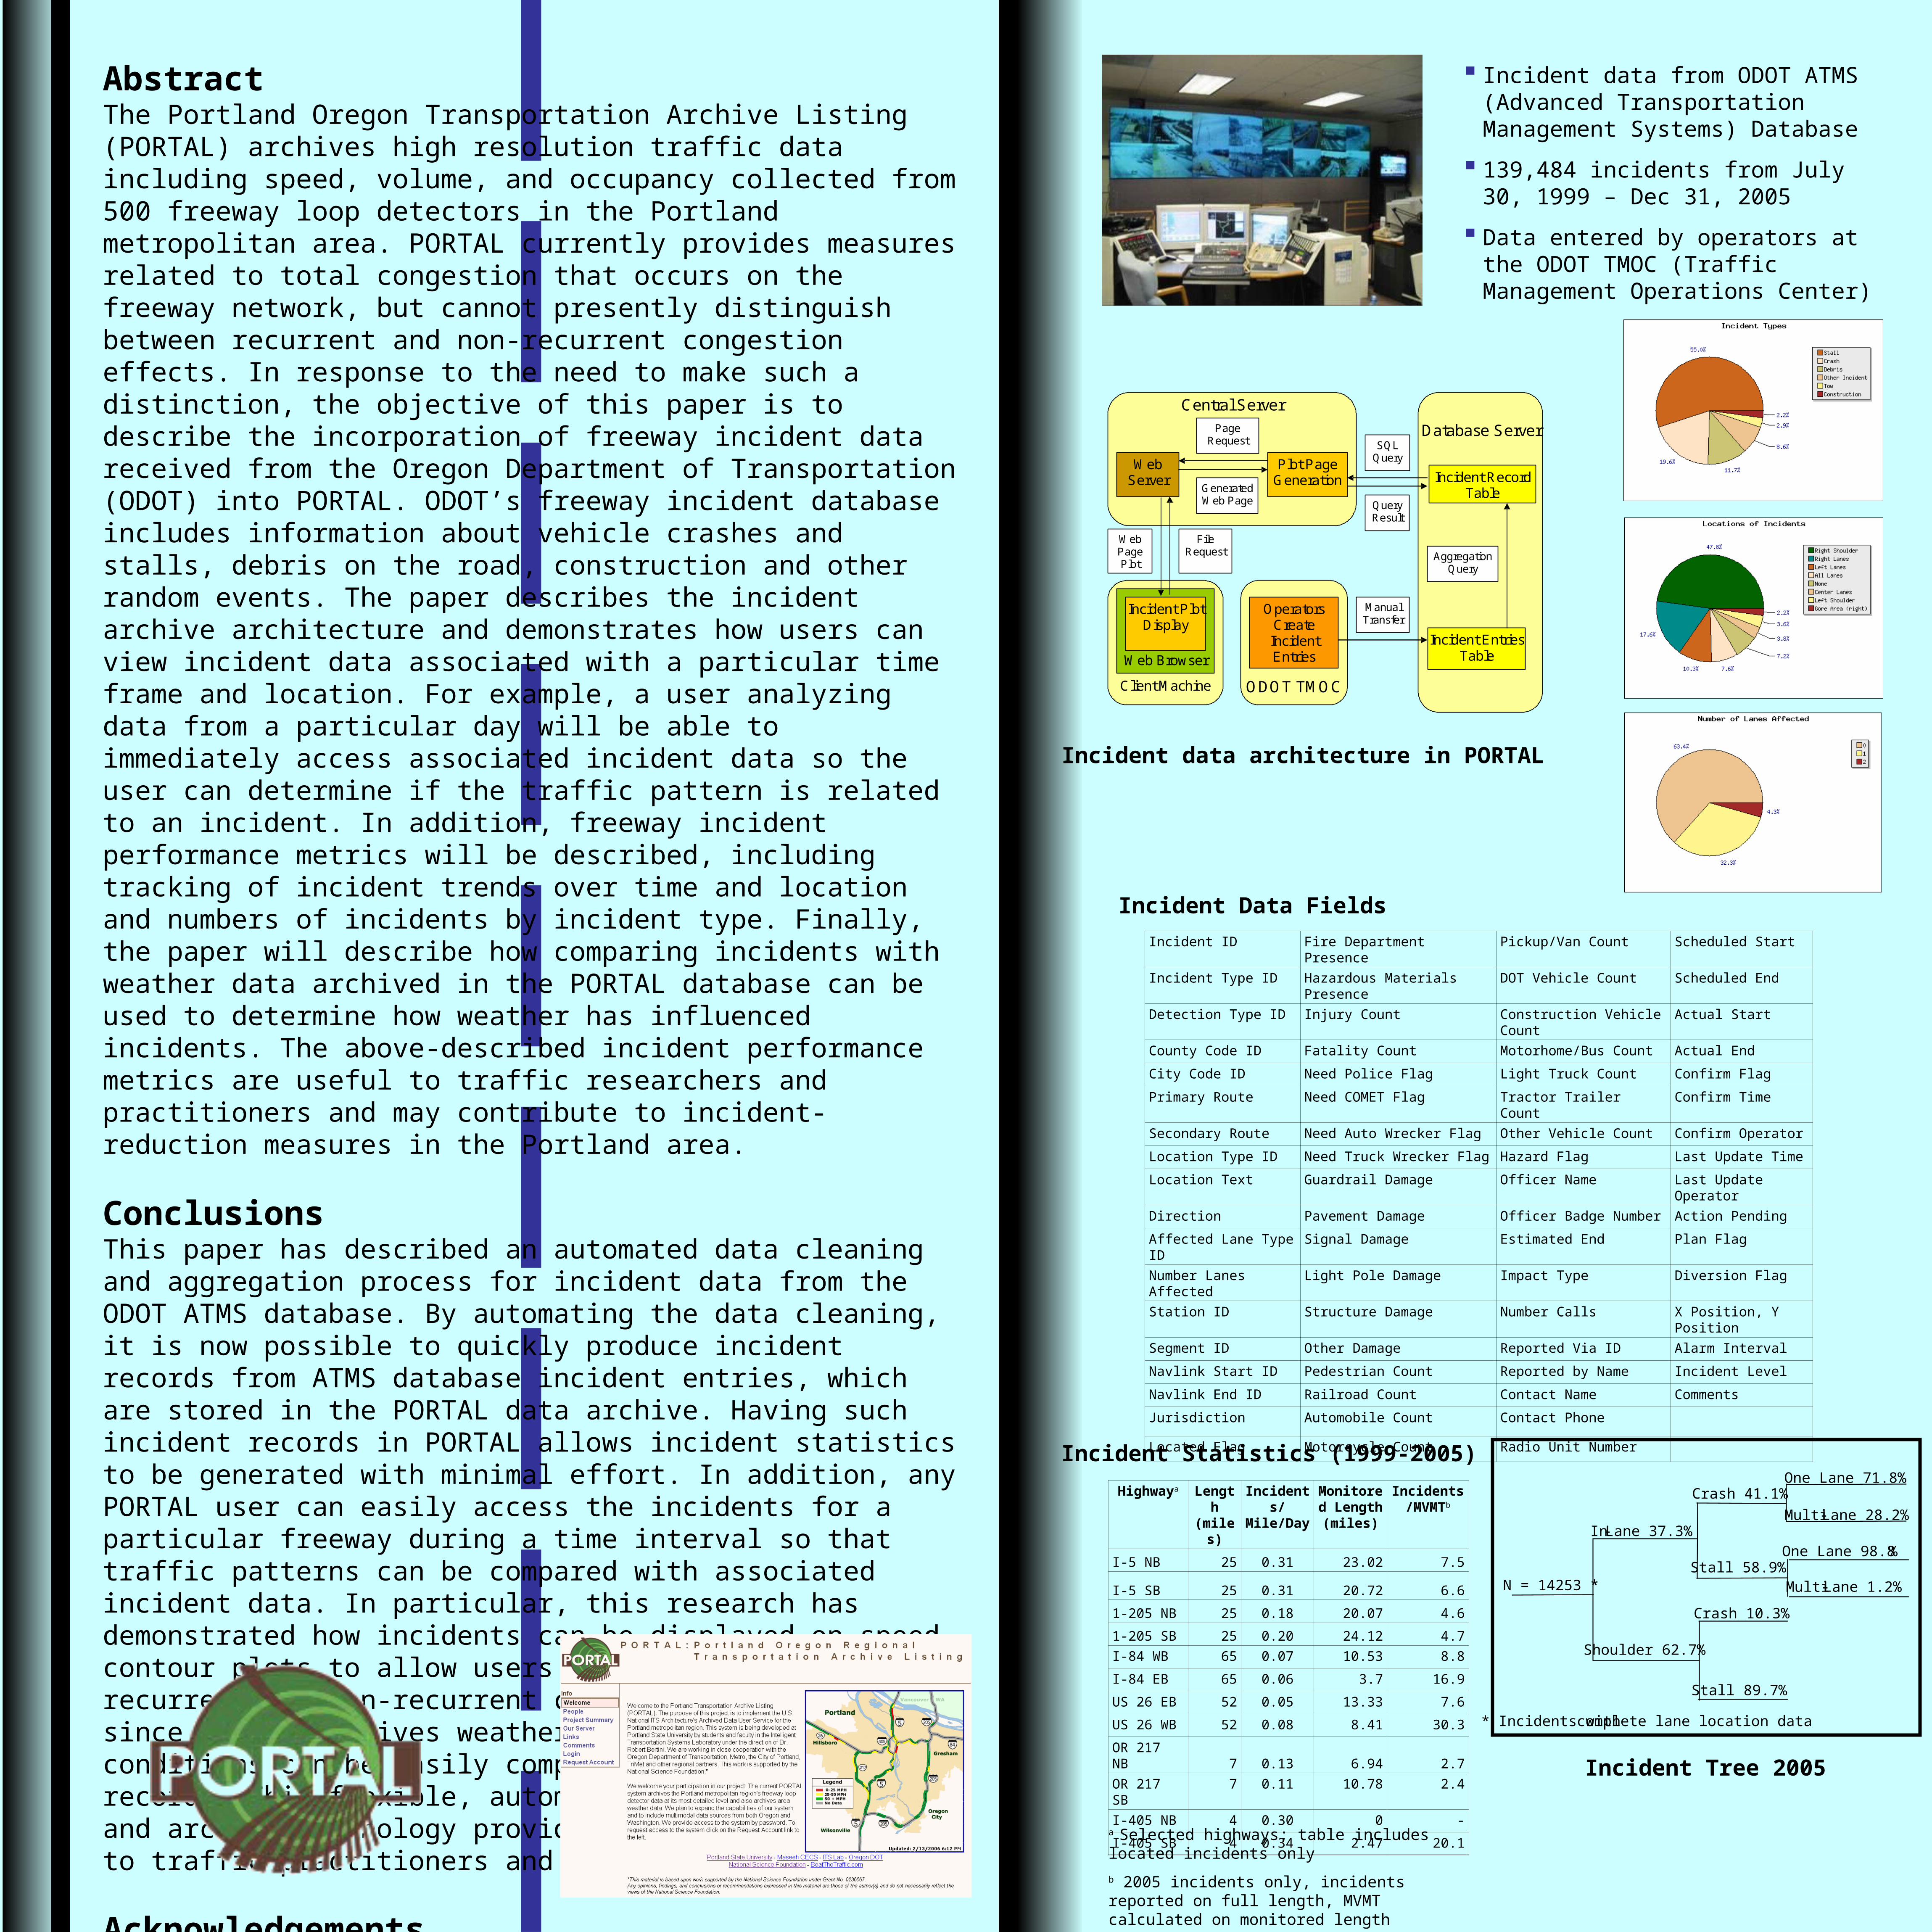
I-5 NB 25 0.31 23.02 7.5
I-5 SB 25 0.31 20.72 6.6
1-205 NB 25 0.18 20.07 4.6
1-205 SB 25 0.20 24.12 4.7
I-84 WB 65 0.07 10.53 8.8
I-84 EB 65 0.06 3.7 16.9
US 26 EB 52 0.05 13.33 7.6
US 26 WB 52 0.08 8.41 30.3
OR 217 NB 7 0.13 6.94 2.7
OR 217 SB 7 0.11 10.78 2.4
I-405 NB 4 0.30 0 -
I-405 SB 4 0.34 2.47 20.1
a Selected highways; table includes located incidents only
b 2005 incidents only, incidents reported on full length, MVMT calculated on monitored length
Incident Statistics (1999-2005)
Incident data from ODOT ATMS (Advanced Transportation Management Systems) Database
139,484 incidents from July 30, 1999 – Dec 31, 2005
Data entered by operators at the ODOT TMOC (Traffic Management Operations Center)
Web Server
Plot Page Generation Incident Record
Table
Incident Entries Table
Operators Create Incident Entries
Incident Plot Display
Database Server
Aggregation Query
ODOT TMOC
Manual Transfer
SQL Query
Query Result
Page Request
Generated Web Page
Central Server
Client Machine
Web Browser
File Request
Web Page Plot
Incident data architecture in PORTAL
Incident ID Fire Department Presence Pickup/Van Count Scheduled Start
Incident Type ID Hazardous Materials Presence DOT Vehicle Count Scheduled End
Detection Type ID Injury Count Construction Vehicle Count Actual Start
County Code ID Fatality Count Motorhome/Bus Count Actual End
City Code ID Need Police Flag Light Truck Count Confirm Flag
Primary Route Need COMET Flag Tractor Trailer Count Confirm Time
Secondary Route Need Auto Wrecker Flag Other Vehicle Count Confirm Operator
Location Type ID Need Truck Wrecker Flag Hazard Flag Last Update Time
Location Text Guardrail Damage Officer Name Last Update Operator
Direction Pavement Damage Officer Badge Number Action Pending
Affected Lane Type ID Signal Damage Estimated End Plan Flag
Number Lanes Affected Light Pole Damage Impact Type Diversion Flag
Station ID Structure Damage Number Calls X Position, Y Position
Segment ID Other Damage Reported Via ID Alarm Interval
Navlink Start ID Pedestrian Count Reported by Name Incident Level
Navlink End ID Railroad Count Contact Name Comments
Jurisdiction Automobile Count Contact Phone
Located Flag Motorcycle Count Radio Unit Number
Incident Data Fields
Incident Tree 2005
N = 14253 *
In-Lane 37.3%
Shoulder 62.7%
Crash 41.1%
Stall 58.9%
Crash 10.3%
Stall 89.7%
One Lane 71.8%
Multi-Lane 28.2%
One Lane 98.8%
Multi-Lane 1.2%
* Incidents with complete lane location data
Incorporating Incident Data into a Freeway Data Archive for Improved Performance Measurement
Jessica Potter, Suman Tasnim, Dr. Kristin Tufte and Dr. Robert Bertini, Portland State University
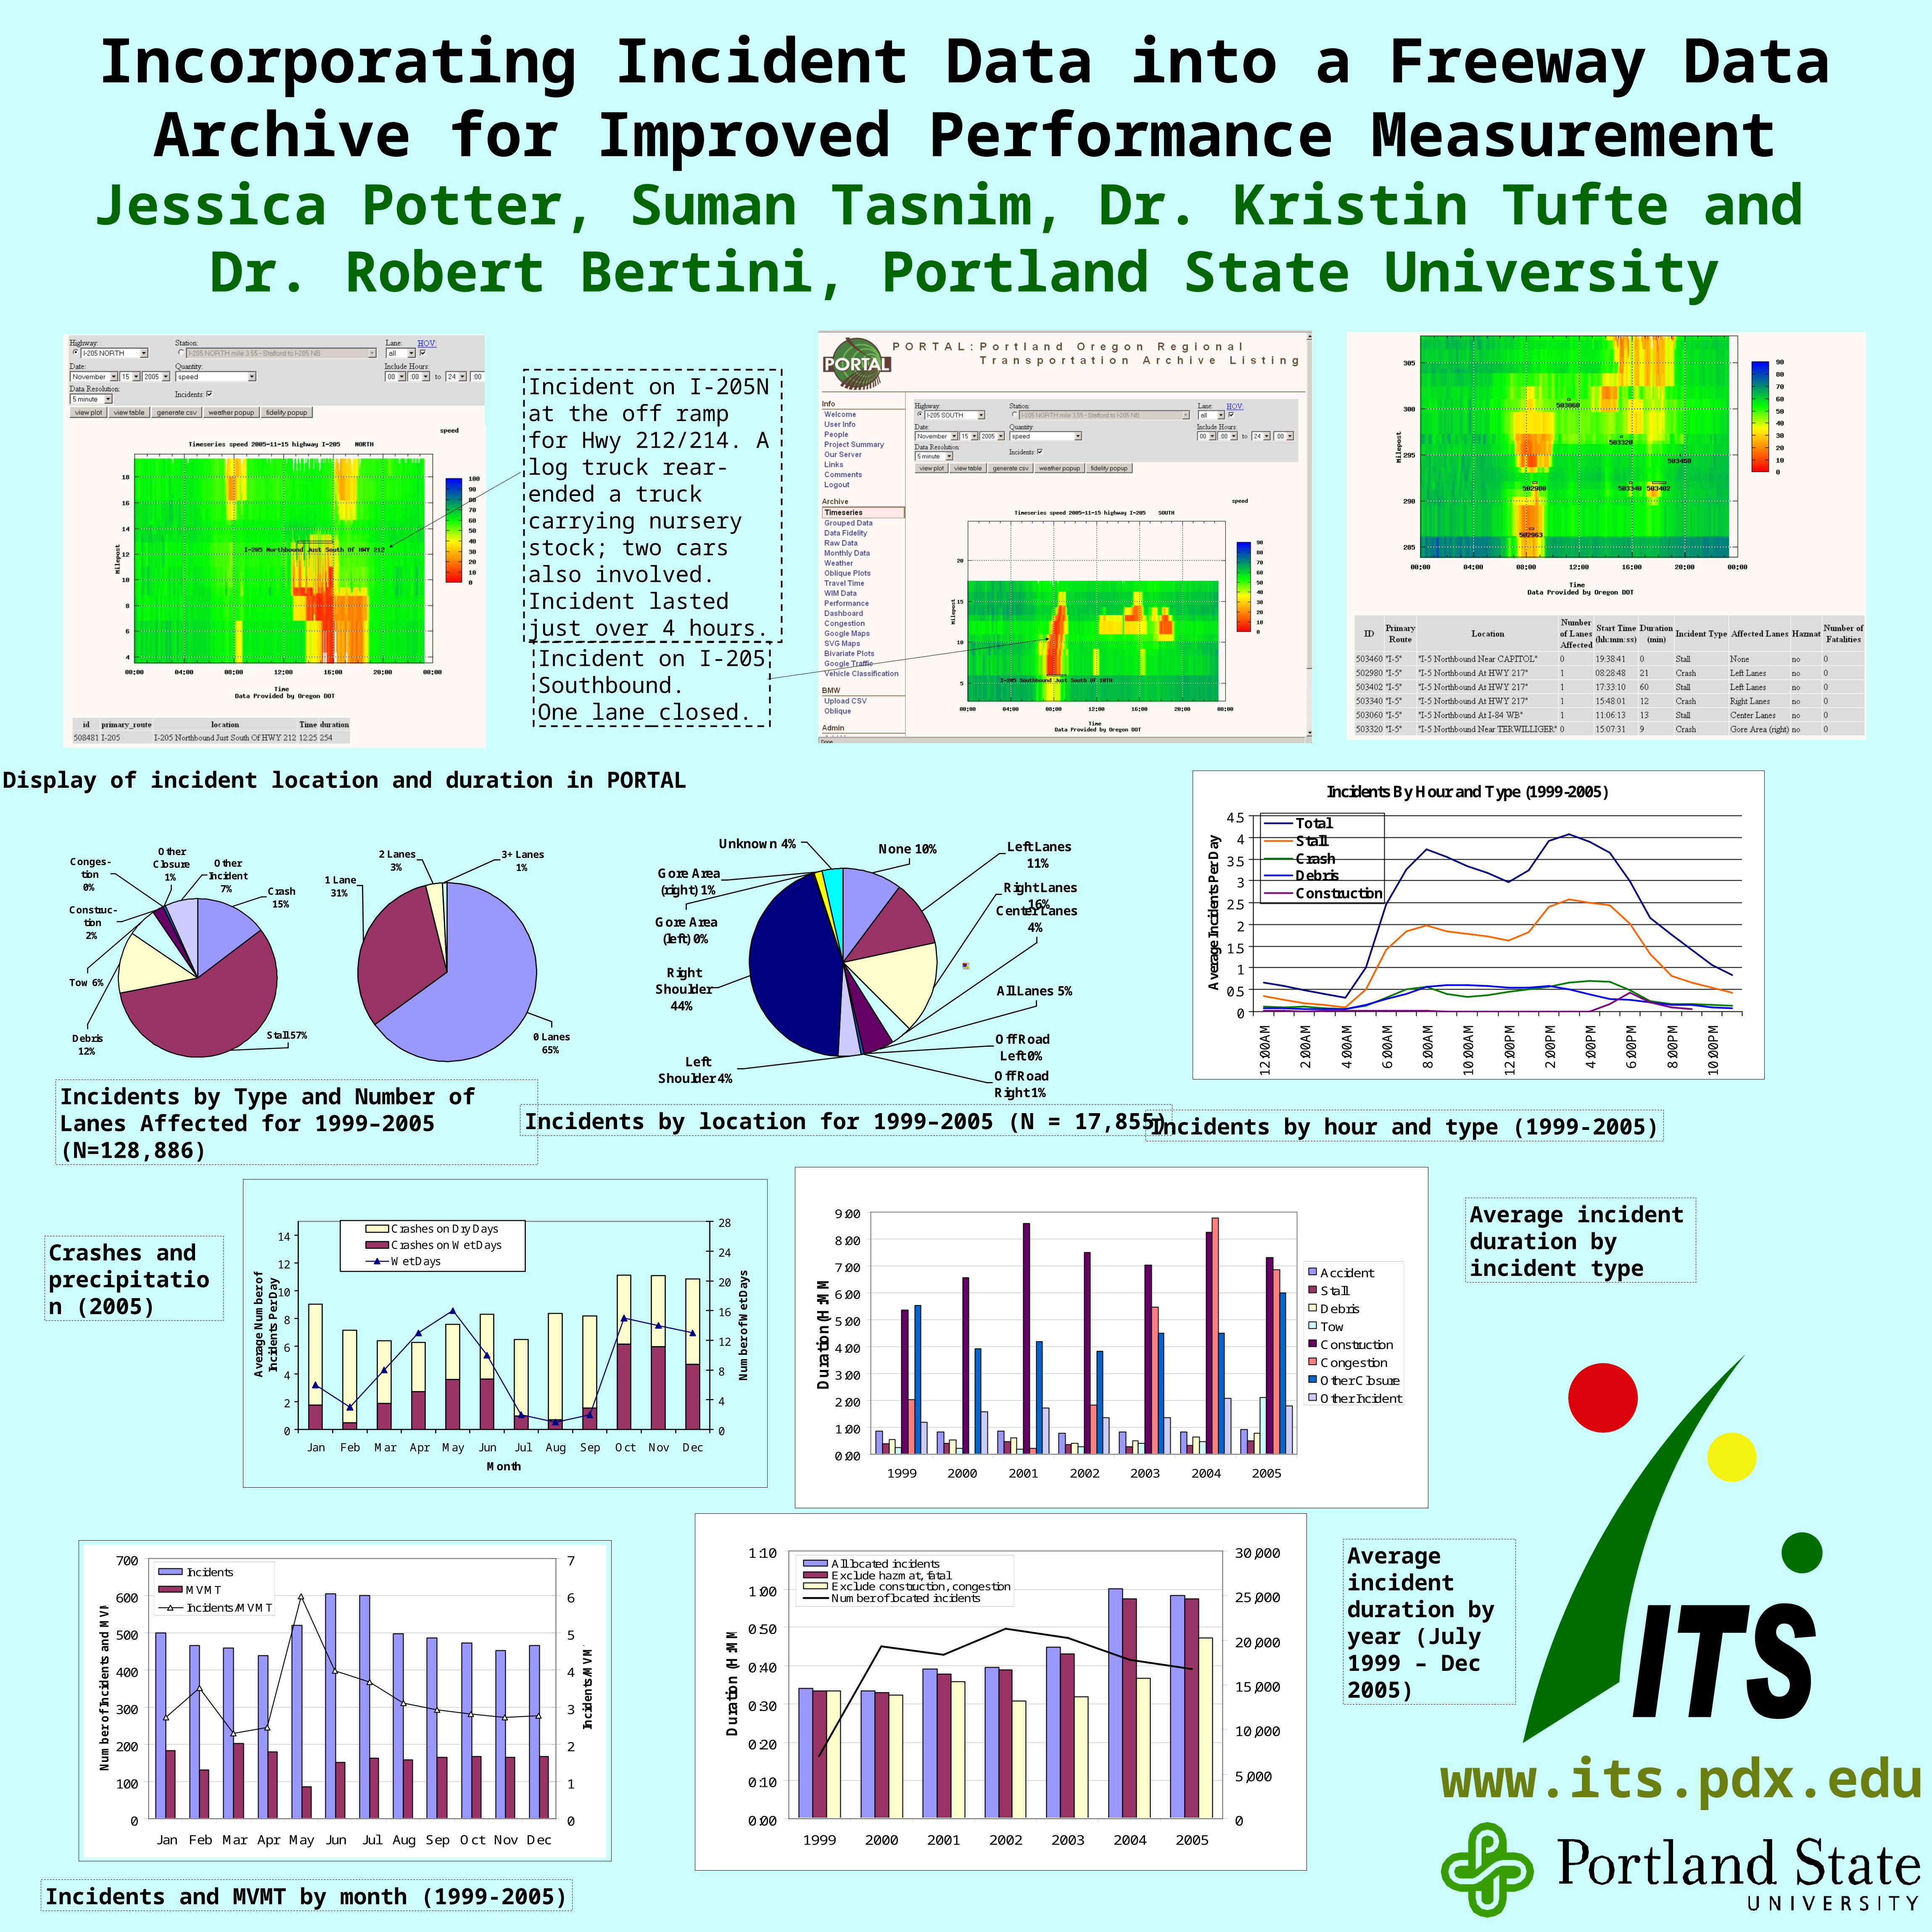
Display of incident location and duration in PORTAL
Construc-tion2%
Conges-tion0%
Other Closure
1%
Tow 6%
Debris 12%
Other Incident
7% Crash 15%
Stall 57%
2 Lanes3%
3+ Lanes1%
1 Lane31%
0 Lanes65%
Incidents by Type and Number of Lanes Affected for 1999–2005 (N=128,886)
Right Lanes16%
All Lanes 5%
Center Lanes 4%
Left Lanes11%
Off Road Right 1%
Gore Area (right) 1%
Unknown 4% None 10%
Gore Area (left) 0%
Right Shoulder
44%
Left Shoulder 4%
Off Road Left 0%
Incidents by location for 1999–2005 (N = 17,855)
0
2
4
6
8
10
12
14
Jan Feb Mar Apr May Jun Jul Aug Sep Oct Nov Dec
Month
Ave
rag
e N
um
ber
of
Inci
den
ts P
er D
ay
0
4
8
12
16
20
24
28
Nu
mb
er o
f W
et D
ays
Crashes on Dry Days
Crashes on Wet Days
Wet DaysCrashes and precipitation (2005)
Incidents By Hour and Type (1999-2005)
0
0.5
1
1.5
2
2.5
3
3.5
4
4.5
12
:00
AM
2:0
0A
M
4:0
0A
M
6:0
0A
M
8:0
0A
M
10
:00
AM
12
:00
PM
2:0
0P
M
4:0
0P
M
6:0
0P
M
8:0
0P
M
10
:00
PM
Ave
rage
In
cid
ents
Per
Day
TotalStallCrashDebrisConstruction
Incidents by hour and type (1999-2005)
0
100
200
300
400
500
600
700
Jan Feb Mar Apr May Jun Jul Aug Sep Oct Nov Dec
Nu
mb
er
of
Incid
en
ts a
nd
MV
MT
0
1
2
3
4
5
6
7
Incid
en
ts/M
VM
T
Incidents
MVMT
Incidents/MVMT
Incidents and MVMT by month (1999-2005)
0:00
0:10
0:20
0:30
0:40
0:50
1:00
1:10
1999 2000 2001 2002 2003 2004 2005
Du
rati
on
(H
:MM
)
0
5,000
10,000
15,000
20,000
25,000
30,000All located incidentsExclude hazmat, fatalExclude construction, congestionNumber of located incidents
Average incident duration by year (July 1999 – Dec 2005)
Incident on I-205N at the off ramp for Hwy 212/214. A log truck rear-ended a truck carrying nursery stock; two cars also involved. Incident lasted just over 4 hours.
0:00
1:00
2:00
3:00
4:00
5:00
6:00
7:00
8:00
9:00
1999 2000 2001 2002 2003 2004 2005
Du
rati
on
(H:M
M) Accident
Stall
Debris
Tow
Construction
Congestion
Other Closure
Other Incident
Average incident duration by incident type
Incident on I-205 Southbound. One lane closed.
www.its.pdx.edu