Embed Size (px)
Citation preview

ABSTRACT
Title of dissertation: CHARACTERIZATION OF THE BEHAVIOR OF
ULTRA-HIGH PERFORMANCE CONCRETE
Benjamin A. Graybeal, Doctor of Philosophy, 2005
Dissertation directed by: Professor Pedro A. Albrecht Department of Civil and Environmental Engineering
In the past decade significant advances have been made in the field of high performance
concretes. The next generation of concrete, Ultra-High Performance Concrete (UHPC),
exhibits exceptional strength and durability characteristics that make it well suited for use
in highway bridge structures. This material can exhibit compressive strength of 28 ksi,
tensile strength of 1.3 ksi, significant tensile toughness, elastic modulus of 7600 ksi, and
minimal long-term creep or shrinkage. It can also resist freeze-thaw and scaling
conditions with virtually no damage and is nearly impermeable to chloride ions.
Prestressed highway bridge girders were cast from this material and tested under flexure
and shear loadings. The testing of these AASHTO Type II girders containing no mild
steel reinforcement indicated that UHPC, with its internal passive fiber reinforcement,
could effectively be used in highway bridge girders. A large suite of material
characterization tests was also completed. Based on this research, a basic structural
design philosophy for bridge girder design is proposed.

CHARACTERIZATION OF THE BEHAVIOR OF ULTRA-HIGH PERFORMANCE CONCRETE
by
Benjamin A. Graybeal
Dissertation submitted to the Faculty of the Graduate School of the University of Maryland, College Park in partial fulfillment
of the requirements for the degree of Doctor of Philosophy
2005
Advisory Committee: Professor Pedro A. Albrecht, Chair Professor Amde M. Amde
Professor William Fourney Professor Chung C. Fu Professor Ricardo A. Medina

©Copyright by
Benjamin Allen Graybeal
2005

ii
ACKNOWLEDGEMENTS This investigation was funded by the Federal Highway Administration through the Turner-Fairbank Highway Research Center. Prestress Services of Kentucky, Inc. and Lafarge, Inc. also provided noteworthy contributions to the research. The author would like to thank Dr. Pedro Albrecht at the University of Maryland as well as Joseph Hartmann and Dr. William Wright at the Federal Highway Administration for their guidance throughout this research. He would also like to acknowledge his colleagues at the Turner-Fairbank Highway Research Center, who provided invaluable insight and assistance throughout the planning and experimental testing phases of this work. Finally, the author wishes to express his gratitude to his wife, Christy, and to his entire family for their love, guidance, support, and encouragement.

iii
TABLE OF CONTENTS List of Tables .......................................................................................................................v List of Figures ................................................................................................................... vii CHAPTER 1 INTRODUCTION ......................................................................................1 1.1 Introduction .................................................................................................................1 1.2 Objective......................................................................................................................2 1.3 Summary of Approach ................................................................................................2 1.4 Outline of Report .........................................................................................................3 CHAPTER 2 BACKGROUND AND PREVIOUS WORK.............................................5 2.1 UHPC Constituent Materials.......................................................................................5 2.2 Manufacturer Supplied UHPC Material Properties.....................................................6 2.3 Steel Fiber Material Properties ....................................................................................7 2.4 Relevant Material Property Characterization Studies .................................................9 2.4.1 Fiber Orientation Effect on Mechanical Properties by Stiel et al...................9 2.4.2 Prestressing Strand Development Length by Steinberg and Lubbers ..........10 2.4.3 Permeability of Cracked Concrete by Rapoport et al...................................10 2.4.4 Creep and Shrinkage of UHPC by Acker.....................................................11 2.4.5 Abrasion Resistance of HSC via ASTM C944 by Horszczaruk ..................12 2.5 Relevant Girder Testing ............................................................................................13 2.5.1 Shear Capacity of AASHTO Type II Girders by Tawfig.............................13 2.5.2 Shear Capacity of Small UHPC Beams by Hegger et al. ............................14 2.5.3 Flexural Capacity of High Strength Concrete Girders by Russell and Burns .......................................................................................15 CHAPTER 3 UHPC MATERIAL CHARACTERIZATION.........................................16 3.1 Research Plan ............................................................................................................16
3.1.1 Batch and Specimen Nomenclature .............................................................17 3.1.2 Test Matrix ...................................................................................................19
3.2 Batching, Casting, and Curing of UHPC...................................................................24 3.3 Compression Testing .................................................................................................36 3.3.1 Strength ........................................................................................................40 3.3.2 Strength, Modulus of Elasticity, and Strain Capacity with Time.................44 3.3.3 Linearity of UHPC Compressive Response .................................................54 3.3.4 Compression Specimen Geometry ...............................................................61 3.3.5 Demolding Age Effect on Compressive Strength ........................................64
3.3.6 Long-term Delayed Steam Effect on Compressive Strength .......................65 3.3.7 Fiber Effect on Compression Failure ...........................................................67
3.3.8 Load Rate Effect on Compression Testing Results......................................70 3.4 Tension Testing .........................................................................................................71 3.4.1 Flexural Prism ..............................................................................................72
3.4.1.1 Strength ..........................................................................................84 3.4.1.2 Toughness ......................................................................................90

iv
3.4.2 Split Cylinder ...............................................................................................96 3.4.3 Mortar Briquette .........................................................................................105
3.4.3.1 Strength ........................................................................................112 3.4.3.2 Toughness ....................................................................................113
3.4.4 Direct Tension ............................................................................................119 3.5 Fracture Testing.......................................................................................................125 3.6 Penetration Resistance Testing................................................................................140 3.7 Shrinkage Testing....................................................................................................141
3.7.1 Long-term Shrinkage Testing.....................................................................141 3.7.2 Early Age Shrinkage Testing .....................................................................144
3.8 Creep Testing...........................................................................................................146 3.8.1 Long-term Creep Testing ...........................................................................146 3.8.2 Early Age High Stress Creep Testing ........................................................151
3.9 Coefficient of Thermal Expansion ..........................................................................154 3.10 Heat of Hydration ....................................................................................................156 3.11 Air Void Testing......................................................................................................159 3.12 Steel Fiber Dispersion Testing ................................................................................163 3.13 Durability Testing....................................................................................................164 3.13.1 Rapid Chloride Ion Penetrability Testing...................................................165 3.13.2 Chloride Penetration...................................................................................167 3.13.3 Scaling Resistance......................................................................................170 3.13.4 Abrasion Resistance ...................................................................................174 3.13.5 Freeze-Thaw Resistance.............................................................................180
3.13.6 Alkali-Silica Reaction ................................................................................189 3.14 Split Cylinder Tension Testing on Cracked Cylinders............................................192 CHAPTER 4 GIRDER MATERIAL PROPERTIES ...................................................198 4.1 Test Specimen Casting, Harvesting, and Preparation .............................................198 4.2 UHPC Compression Testing ...................................................................................199 4.3 UHPC Flexural Prism Testing.................................................................................202 CHAPTER 5 GIRDER FABRICATION AND EXPERIMENTAL METHODS........206 5.1 Girder Fabrication ...................................................................................................206 5.2 Test Matrix ..............................................................................................................207 5.3 Test Setup and Specimen Details ............................................................................208 5.4 Instrumentation........................................................................................................212 5.4.1 Girder 80F ..................................................................................................212 5.4.2 Girder 28S ..................................................................................................213 5.4.3 Girder 24S ..................................................................................................216 5.4.4 Girder 14S ..................................................................................................217 5.5 Loading Procedure...................................................................................................220 CHAPTER 6 UHPC GIRDER TESTING RESULTS..................................................222 6.1 Static Flexural Testing.............................................................................................222 6.2 Static Shear Testing.................................................................................................233 6.2.1 Girder 28S ..................................................................................................233

v
6.2.2 Girder 24S ..................................................................................................243 6.2.3 Girder 14S ..................................................................................................249 CHAPTER 7 DISCUSSION OF RESULTS ................................................................261 7.1 Tensile Behavior of UHPC......................................................................................261 7.1.1 Summary of Experimental Results.............................................................261 7.1.2 Summary of Experimental Test Methods...................................................266 7.2 Local and Global Mechanical Failure Modes of UHPC .........................................269 7.3 Effect of Curing Procedure on UHPC Properties....................................................274 7.4 Early Age Strength Gain of UHPC .........................................................................276 7.5 Comparison of Cylinder and Cube Compression Strength Results.........................279 7.7 Shrinkage Behavior of UHPC .................................................................................281 7.8 Long-term Stability of UHPC .................................................................................282 7.9 Modulus of Elasticity of UHPC ..............................................................................284 7.10 Compressive Stress-Strain Behavior of UHPC .......................................................289 7.11 Development Length of Prestressing Strand in UHPC ...........................................295 7.12 Estimation of Prestress Losses in UHPC Girders....................................................298 7.13 Flexural Behavior of Prestressed UHPC Girders ....................................................302
7.13.1 Analytical Predictions of Global Behavior ................................................302 7.13.2 Cracking Behavior......................................................................................305 7.13.3 Effective Moment of Inertia .......................................................................310 7.13.4 Flexural Stiffness Under Flexural Loading................................................313 7.13.5 Uniaxial Stress-Strain Model of Girder Flexural Behavior .......................319
7.14 Shear Behavior of Prestressed UHPC Girders Containing No Mild Steel ..............328 7.14.1 Predicted vs. Actual Global Behavior ........................................................328 7.14.2 Cracking Behavior......................................................................................331 7.14.3 Simplified Model of UHPC Girder Shear Failure......................................333 7.14.4 Strut-and-Tie Model of Girder 28S Failure................................................336 CHAPTER 8 DESIGN PHILOSOPHY FOR UHPC BRIDGE GIRDERS .................339 8.1 Introduction .............................................................................................................339 8.2 Flexure ....................................................................................................................339 8.3 Shear ....................................................................................................................341 CHAPTER 9 CONCLUSIONS AND FUTURE RESEARCH ....................................344 9.1 Introduction .............................................................................................................344 9.2 Conclusions .............................................................................................................345 9.2.1 General .......................................................................................................345 9.2.2 Highway Bridge Girders ............................................................................346 9.2.3 Material Property Characterization ............................................................348 9.3 Ongoing and Future Research .................................................................................354 REFERENCES ................................................................................................................355

vi
LIST OF TABLES Table 2.1-A: Typical UHPC composition...................................................................6 Table 2.2-A: Manufacturer supplied material characteristics .....................................6 Table 2.3-A: Chemical composition of steel fibers.....................................................7 Table 3.1.2-A: Batching descriptions with associated specimens and curing regimes...........................................................................................20 Table 3.1.2-B: Batching descriptions with associated specimens and curing regimes for non-standardized batches............................................23 Table 3.2-A: Batching and casting properties of Steam and Air treated UHPC. Batching and casting properties of Tempered Steam and Delayed Steam treated UHPC........................................................32 Table 3.2-B: Batching and casting properties of batches cast to complete the study by addressing special issues ...........................................34 Table 3.3.1-A: Control cylinder compressive strength results.....................................41 Table 3.3.1-B: More control cylinder compressive strength results ............................42 Table 3.3.2-A: Strength, modulus of elasticity, and strain at peak stress results at various ages after casting (Part I) ...................................52 Table 3.3.2-A: Strength, modulus of elasticity, and strain at peak stress results at various ages after casting (Part II)..................................53 Table 3.3.3-A: Compressive stress-strain response linearity at various ages after casting (Part I) .......................................................................57 Table 3.3.3-A: Compressive stress-strain response linearity at various ages after casting (Part II) ......................................................................58 Table 3.3.4-A: Cylinder and cube compressive strength results..................................63 Table 3.3.5-A: Demolding age effect on 28-day compressive strength results ...........65 Table 3.3.6-A: Long-term delayed steam effect on compressive strength...................66 Table 3.3.8-A: Load rate effect on compression testing results...................................71 Table 3.4.1.1-A: ASTM C1018 strength results .............................................................89 Table 3.4.1.2-A: Definition of Toughness Indices (From ASTM C1018 FIG. X1.1) ....91 Table 3.4.1.2-B: ASTM C1018 toughness results ..........................................................93 Table 3.4.2-A: Split tensile strength normalized by 28 day compressive strength ....104 Table 3.4.2-B: First crack parameters determined by instantaneous lateral expansion of cylinder and aural observations..............................104 Table 3.4.3.2-A: Fiber influence on post-cracking behavior ........................................118 Table 3.4.4-A: Direct tension test results ...................................................................124 Table 3.6-A: Penetration resistance results .............................................................141 Table 3.7.1-A: Long-term shrinkage..........................................................................142 Table 3.7.2-A: Early age shrinkage rate.....................................................................147 Table 3.8.1-A: Long-term creep results .....................................................................149 Table 3.8.2-A: Early age creep results .......................................................................153 Table 3.9-A: Coefficient of thermal expansion results ...........................................156 Table 3.11-A: Air void analysis results.....................................................................162 Table 3.13.1-A: Rapid chloride ion penetrability results .............................................167 Table 3.13.5-A: Effect of a water bath on the compressive strength of Steam and Air treated UHPC..................................................................188

vii
Table 3.13.6-A: Timetable for ASTM C1260 specimens ............................................191 Table 3.13.6-B: ASTM C1260 alkali-silica reactivity expansion results ....................192 Table 3.14-A: Crack width and split cylinder peak strength results for ponded cylinders.......................................................................................196 Table 4.2-A: Compression test results ....................................................................201 Table 4.3-A: Prism flexure test results....................................................................205 Table 5.2-A: Test matrix................................................................................................... 208 Table 7.1.1-A: UHPC material characterization results for average tensile properties of UHPC......................................................................262 Table 7.3-A: Average UHPC material properties presented according to curing treatment ...........................................................................277 Table 7.9-A: Compressive strength and modulus of elasticity results ....................284 Table 7.10-A: Constants for Equation 7.10-A ..........................................................294

viii
LIST OF FIGURES Figure 2.3-A: Three tensile stress-strain responses for steel fiber reinforcement ........8 Figure 3.2-A: Mixing of UHPC including (clockwise from left) water addition, HRWA addition, pre-paste consistency, fiber addition, and finished mix ...................................................................................27 Figure 3.2-B: Mix time as affected by premix age.....................................................35 Figure 3.2-C: Final flow diameter as affected by premix age....................................35 Figure 3.3-A: (a) Grinding and (b) measuring of 3-in. diameter cylinders ................38 Figure 3.3-B: 3-in. diameter cylinders (a) before and (b) after compression testing.............................................................................................39 Figure 3.3.1-A: Compressive strength and density of control cylinders .......................43 Figure 3.3.1-B: Compressive strength and cylinder end planeness of control cylinders.........................................................................................43 Figure 3.3.2-A: Modulus ring attachment (a) before and (b) during testing .................48 Figure 3.3.2-B: Selected stress-strain responses for Steam treated UHPC (N1A) .............................................................................................48 Figure 3.3.2-C: Selected stress-strain responses for Steam treated UHPC (N1AxxA) ......................................................................................49 Figure 3.3.2-D: Selected stress-strain responses for Air treated UHPC........................49 Figure 3.3.2-E: Selected stress-strain responses for Tempered Steam treated UHPC.............................................................................................50 Figure 3.3.2-F: Selected stress-strain responses for Delayed Steam treated UHPC.............................................................................................50 Figure 3.3.2-G: Compressive strength gain from casting up to 8 weeks of age............51 Figure 3.3.2-H: Modulus of elasticity gain from casting up to 8 weeks of age.............51 Figure 3.3.2-I: Strain at peak compressive stress from casting up to 8 weeks of age..............................................................................................51 Figure 3.3.3-A: Sample Air treated stress-strain curve with linearity descriptors ........55 Figure 3.3.3-B: Secant modulus from casting up to 8 weeks of age .............................59 Figure 3.3.3-C: Ratio of elastic to secant modulus from casting up to 8 weeks of age..............................................................................................59 Figure 3.3.3-D: Compressive stress to strength ratio at 1% stress drop from linear elastic ...................................................................................60 Figure 3.3.3-E: Compressive stress to strength ratio at 5% stress drop from linear elastic ...................................................................................60 Figure 3.3.4-A: Compression cubes and cylinders including (clockwise from upper left) 4-in., 3-in. overlength, 3-in., and 2-in. diameter
cylinders and 2 in. and 4 in. cubes .................................................62 Figure 3.3.4-B: (a) Cylinder and (b) cube compression testing ....................................62 Figure 3.3.7-A: Compression failure of a Steam treated UHPC cylinder containing no fiber reinforcement. (a) 1/6th of a second before failure. (b) 1/30th of a second before failure. (c) At failure. (d) 1/10th of a second after failure...........................69 Figure 3.4.1-A: Prism flexural test setup for a (a) 9 in. span and a (b) 12 in. span.......73

ix
Figure 3.4.1-B: Examples of first crack shown on load-deflection response curves .............................................................................................78 Figure 3.4.1-C: ASTM C1018 load-deflection response results for 2x2 prisms over a 6 in. span with third point loading ......................................79 Figure 3.4.1-D: ASTM C1018 load-deflection response results for 3x4 prisms over a 12 in. span with third point loading ....................................80 Figure 3.4.1-E: ASTM C1018 load-deflection response results for 2x2 prisms over a 9 in. span with third point loading ......................................81 Figure 3.4.1-F: ASTM C1018 load-deflection response results for 2x2 prisms over a 12 in. span with third point loading ....................................82 Figure 3.4.1-G: ASTM C1018 load-deflection response results for 2x2 prisms over a 15 in. span with 3 in. between loads ...................................83 Figure 3.4.1.1-A: Ratio of shear to flexural deflection for a third-point loaded prism ..............................................................................................88 Figure 3.4.1.2-A: ASTM C1018 toughness results ..........................................................94 Figure 3.4.1.2-B: ASTM C1018 residual strength results................................................95 Figure 3.4.2-A: Split cylinder tensile test including (a) standard test setup, (b) lateral expansion measuring apparatus, and (c) UHPC cylinder during test ........................................................................98 Figure 3.4.3-B: Typical response for a UHPC cylinder during the ASTM C496 test ........................................................................................99 Figure 3.4.3-C: Average tensile cracking results from the ASTM C496 test .............101 Figure 3.4.2-D: Average split cylinder peak strength from the ASTM C496 test.......103 Figure 3.4.3-A: AASHTO T132 setup including (a) test grips and (b) specimen.......106 Figure 3.4.3-B: Load-displacement response for Steam treated briquette tests ..........108 Figure 3.4.3-C: Load-displacement response for Air treated briquette tests...............109 Figure 3.4.3-D: Load-displacement response for Tempered Steam treated briquette tests ...............................................................................110 Figure 3.4.3-E: Load-displacement response for Delayed Steam treated briquette tests ...............................................................................111 Figure 3.4.3.1-A: Tensile cracking strength of UHPC briquettes ..................................112 Figure 3.4.3.1-B: Post-cracking peak strength of UHPC briquettes ..............................114 Figure 3.4.3.2-A: Area under the load-displacement response curve after cracking........................................................................................116 Figure 3.4.3.2-B: Ratio of post-cracking to pre-cracking areas under the load-
displacement curve.......................................................................117 Figure 3.4.4-A: (a) Notched cylinder and (b) testing of an unnotched cylinder .........121 Figure 3.5-A: Test setup for 4 in. by 2 in. notched prisms loaded on a 16 in. span ..............................................................................................127 Figure 3.5-B: Resistance foil gage to monitor crack propagation............................128 Figure 3.5-C: Prism M1P00 after (a) 3.4 in. and (b) 3.85 in. of crack extension.....129 Figure 3.5-D: Prism M2P03 after 3.65 in. of crack extension..................................130 Figure 3.5-E: Load-CMOD response for Steam treated prism M1P00
(a.) Overall response including periodic unloadings. (b.) Initial response including elastic stiffness and 95% of elastic stiffness curves. ............................................................132

x
Figure 3.5-F: Load-CMOD response for Steam treated prism M1P01 (a.) Overall response including periodic unloadings. (b.)Initial response including elastic stiffness and 95% of elastic stiffness curves. ............................................................133
Figure 3.5-G: Load-CMOD response for Steam treated prism M1P02 (a.) Overall response including periodic unloadings and crack length from tension flange. (b.) Initial response including elastic stiffness and 95% of elastic stiffness curves. ...134
Figure 3.5-H: Load-CMOD response for Steam treated prism M1P03 (a.) Overall response including periodic unloadings and crack length from tension flange. (b.) Initial response including elastic stiffness and 95% of elastic stiffness curves. ...135
Figure 3.5-I: Load-CMOD response for Steam treated prism M2P00 (a.) Overall response including periodic unloadings. (b.) Initial response including elastic stiffness and 95% of elastic stiffness curves. ............................................................136
Figure 3.5-J: Load-CMOD response for Steam treated prism M2P01 (a.) Overall response including periodic unloadings. (b.) Initial response including elastic stiffness and 95% of elastic stiffness curves. ............................................................137
Figure 3.5-K: Load-CMOD response for Steam treated prism M2P02 (a.) Overall response including periodic unloadings and crack length from tension flange. (b.) Initial response including elastic stiffness and 95% of elastic stiffness curves.....................138
Figure 3.5-L: Load-CMOD response for Steam treated prism M2P03 (a.) Overall response including periodic unloadings and crack length from tension flange. (b.) Initial response including elastic stiffness and 95% of elastic stiffness curves.....................139
Figure 3.7.1-A: Long-term shrinkage results ..............................................................143 Figure 3.7.2-A: Embeddable vibrating wire gage .......................................................145 Figure 3.7.2-B: Early age shrinkage............................................................................146 Figure 3.8.1-A: (a) Creep cylinders in load frame and (b) measurement of creep......148 Figure 3.8.1-B: Long-term creep results .....................................................................151 Figure 3.8.2-A: Short-term creep test setup.................................................................152 Figure 3.8.2-B: Early age creep behavior of 8 ksi to 9.5 ksi UHPC ...........................154 Figure 3.8.2-C: Early age creep behavior of 12.5 ksi UHPC......................................155 Figure 3.10-A: Heat generated in 6-in. diameter cylinders during initial curing .......157 Figure 3.10-B: Heat generated in 6-in. diameter cylinders from casting through steaming .......................................................................................158 Figure 3.10-C: Heat signature for 6-in. diameter cylinders in a well insulated calorimeter ...................................................................................159 Figure 3.12-A: Fiber dispersion analysis results for cylinders impacted on an ASTM C230 flow table................................................................164 Figure 3.12-B: Fiber dispersion analysis photographs for a 1 in.2 area in the
(a) bottom, (b) lower middle, (c) upper middle, and (d) top of a cast cylinder ..........................................................................164

xi
Figure 3.13.1-A: (a) Cylinder and (b) setup for rapid chloride ion penetrability test ................................................................................................166 Table 3.13.1-A: Rapid chloride ion penetrability results ................................................... Figure 3.13.1-B: Average current passed versus time results for three sets of cylinders.......................................................................................167 Figure 3.13.2-A: Chloride ion content results after 90 days of ponding .......................170 Figure 3.13.2-B: (a) Cylinder prior to and (b) after 90 days of chloride ponding.........170 Figure 3.13.3-A: Scaling slab prior to the initiation of ASTM C672 testing ................172 Figure 3.13.3-B: Scaling slab after ASTM C672 testing ..............................................173 Figure 3.13.3-C: Surface deterioration of a vertical surface after 70 plus 145 cycles of wetting/drying with a chloride solution in a freezing/thawing environment .....................................................174 Figure 3.13.4-A: ASTM C944 abrasion test setup ........................................................175 Figure 3.13.4-B: Steel cast surface Air and Steam Treated abrasion specimens after 8 and 10 minutes of abrading, respectively .........................177 Figure 3.13.4-C: ASTM C944 weight loss (grams) per abrading .................................178 Figure 3.13.4-D: Average weight loss (grams) per abrading ........................................178 Figure 3.13.4-D: Linear best-fit weight loss (grams) per abrading ...............................179 Figure 3.13.5-A: Resonant frequency testing of a freeze/thaw prism ...........................182 Figure 3.13.5-B: Freeze-thaw prism (a) before testing and (b) after 564 cycles...........182 Figure 3.13.5-C: Resonant frequency of freeze/thaw prisms ........................................183 Figure 3.13.5-D: Relative dynamic modulus of elasticity of freeze/thaw prisms .........184 Figure 3.13.5-E: Mass change of prisms during freeze-thaw testing............................185 Figure 3.13.5-F: Resonant frequency of prisms maintained at room temperature in a laboratory environment or in a water bath ............................186 Figure 3.13.5-G: Relative dynamic modulus of elasticity of prisms maintained at room temperature in a laboratory environment or in a water bath.....................................................................................187 Figure 3.13.5-H: Mass change of prisms maintained at room temperature in a laboratory environment or in a water bath...................................187 Figure 3.13.6-A: Length comparator for ASR measurements.......................................190 Figure 3.13.6-B: ASTM C1260 alkali-silica reactivity expansion results ....................192 Figure 3.14-A: Crack in a split cylinder tensile specimen..........................................195 Figure 3.14-B: Crack in a split cylinder tensile specimen under 350x magnification ...............................................................................196 Figure 3.14-C: Split cylinder peak strength results ....................................................197 Figure 4.3-A: Third-point loading response of a 2 in. by 2 in. prism on a 9 in. span ......................................................................................204 Figure 5.3-A: Origin of the four girder specimens, with the south elevation of the tested configuration shown ................................................209 Figure 5.3-B: AASHTO Type II cross-section and strand pattern...........................211 Figure 5.4.1-A: Instrumentation plan for Girder 80F..................................................214 Figure 5.4.2-A: Instrumentation plan for Girder 28 ....................................................215 Figure 5.4.3-A: Instrumentation plan for Girder 24S..................................................218 Figure 5.4.4-A: Instrumentation plan for Girder 14S..................................................219

xii
Figure 6.1-A: Load-deflection response of Girder 80F. (a.) Deflection measured at midspan. (b.) Average deflections measured at load and quarter points. ............................................................223 Figure 6.1-B: Load-rotation response of Girder 80F................................................224 Figure 6.1-C: Deflected shape of Girder 80F at selected load levels.......................224 Figure 6.1-D: Moment-curvature response of Girder 80F........................................225 Figure 6.1-E: Midspan neutral axis depth from the top of Girder 80F ....................226 Figure 6.1-F: Principal strains in the web near the west support of Girder 80F......227 Figure 6.1-G: Principal strain angles in the web near the west support of Girder 80F....................................................................................227 Figure 6.1-H: Crack spacing on the bottom flange of Girder 80F at 12 in. midspan overall girder deflection...................................229 Figure 6.1-I: Girder 80F after approximately 17 in. of deflection ..........................231 Figure 6.1-J: Girder 80F immediately after failure .................................................231 Figure 6.1-K: Failure surface of Girder 80F including (a) overall west failure surface and (b) close-up of west failure surface showing pulled-out fibers and necked strands............................................232 Figure 6.2.1-A: Load-deflection response of Girder 28S ............................................234 Figure 6.2.1-B: Bearing rotation response of Girder 28S ...........................................235 Figure 6.2.1-C: Deflected shape of Girder 28S...........................................................235 Figure 6.2.1-D: Strand slip in Girder 28S....................................................................236 Figure 6.2.1-E: Principal tensile strain in the web of Girder 28S ...............................237 Figure 6.2.1-F: Principal tensile strain angle in the web of Girder 28S .....................237 Figure 6.2.1-G: Principal compressive strain in the web of Girder 28S......................238 Figure 6.2.1-H: Principal compressive strain angle in the web of Girder 28S............238 Figure 6.2.1-I: Crack at south base of Girder 28S web at a load of 450 kips ............239 Figure 6.2.1-J: Tension failure of top flange and crushing of web at conclusion of test .........................................................................241 Figure 6.2.1-K: Crack pattern at failure in Girder 28S................................................242 Figure 6.2.2-A: Load-deflection response of Girder 24S ............................................244 Figure 6.2.2-B: Bearing rotation of Girder 24S ..........................................................244 Figure 6.2.2-C: Deflected shape of Girder 24S...........................................................245 Figure 6.2.2-D: Principal tensile strain in the web of Girder 24S ...............................247 Figure 6.2.2-E: Principal tensile strain angle in the web of Girder 24S .....................247 Figure 6.2.2-F: Principal compressive strain in the web of Girder 24S......................248 Figure 6.2.2-G: Principal compressive strain angle in the web of Girder 24S............248 Figure 6.2.2-H: Failure of Girder 24S. (a) 1/15th second before failure. (b) 1/30th second before failure. (c) At failure. (d) 1/30th second after failure.......................................................................250 Figure 6.2.2-I: Failed Girder 24S (a) south elevation and (b) bottom flange near bearing..................................................................................251 Figure 6.2.2-J: Crack pattern at failure in Girder 24S................................................252

xiii
Figure 6.2.3-A: Load-deflection response for Girder 14S...........................................253 Figure 6.2.3-B: Bearing rotation for Girder 14S .........................................................253 Figure 6.2.3-C: Deflected shape for Girder 14S..........................................................254 Figure 6.2.3-D: Strand slip in Girder 14S....................................................................255 Figure 6.2.3-E: Principal tensile strain in the web of Girder 14S ...............................256 Figure 6.2.3-F: Principal tensile strain angle in the web of Girder 14S .....................256 Figure 6.2.3-G: Principal compressive strain in the web of Girder 14S......................257 Figure 6.2.3-H: Principal compressive strain angle in the web of Girder 14S............257 Figure 6.2.3-I: Girder 14S at (a) peak load and (b) post-peak load of 595 kips ........259 Figure 6.2.3-J: Crack pattern at failure in Girder 14S................................................260 Figure 7.4-A: Compressive strength gain as a function of time after casting ..........278 Figure 7.9-A: Modulus of elasticity as a function of 28-day compressive strength.........................................................................................288 Figure 7.9-B: Modulus of elasticity as a function of compressive strength.............289 Figure 7.10-A: Compressive stress-strain behavior compared with linear elastic response........................................................................................292 Figure 7.10-B: Normalized compressive stress-strain results for Steam treated UHPC...........................................................................................293 Figure 7.10-C: Deviation from linear elastic compressive behavior for Steam treated UHPC...............................................................................293 Table 7.10-A: Constants for Equation 7.10-A ..........................................................294 Figure 7.10-D: Compressive stress-strain response approximations..........................295 Figure 7.13.1-A: Predicted behavior of girders tested in the configuration of Girder 80F....................................................................................306 Figure 7.13.2-A: Girder 80F midspan bottom flange strain throughout testing............308 Figure 7.13.2-B: Flexural crack spacing observed on the bottom flange of Girder 80F at a total applied load of 155 kips .............................308 Figure 7.13.2-C: Flexural crack spacing related to tensile strain ..................................309 Figure 7.13.2-D: Tensile strain related to flexural crack spacing..................................310 Figure 7.13.3-A: Effective moment of inertia of Girder 80F ........................................312 Figure 7.13.4-A: Flexural stiffness of an AASHTO Type II girder ..............................316 Figure 7.13.4-B: Ratio of predicted deflections and rotations to experimental results ...........................................................................................317 Figure 7.13.4-C: Predicted and observed midspan deflection results ...........................317 Figure 7.13.4-D: Predicted and observed load point deflection results.........................318 Figure 7.13.4-E: Predicted and observed quarter point deflection results ....................318 Figure 7.13.4-F: Predicted and observed end rotation results.......................................318 Figure 7.13.5-A: Experimental strain profile results for midspan of Girder 80F..........320 Figure 7.13.5-B: Analytically derived uniaxial stress-strain behavior of UHPC .........324 Figure 7.13.5-C: Summation of forces on cross-section during loading steps..............325 Figure 7.13.5-D: External and internal moments on midspan cross-section.................327 Figure 7.13.5-E: Internally and externally determined moment of inertia....................327 Figure 7.14.4-A: Truss model for failure of Girder 28S................................................337 Figure 8.2-A: Sample uniaxial stress-strain behavior for I-girder flexural design...341

1
CHAPTER 1
INTRODUCTION
1.1 Introduction
Ultra-High Performance Concrete (UHPC) is a new class of concrete that has been
developed in recent decades. When compared with High Performance Concrete (HPC),
UHPC tends to exhibit superior properties such as advanced strength, durability, and
long-term stability.
Many researchers around the world have developed concretes that could be classified as
UHPC. Although there are differences among types of UHPC, there are also many
overall similarities. The Association Française de Génie Civil (AFGC) Interim
Recommendations for Ultra High Performance Fibre-Reinforced Concretes (2002)
indicates that UHPC tends to have the following properties: compressive strength that is
greater than 21.7 ksi, internal fiber reinforcement to ensure non-brittle behavior, and a
high binder content with special aggregates. Furthermore, UHPC tends to have a very
low water content and can achieve sufficient rheological properties through a
combination of optimized granular packing and the addition of high-range water reducing
admixtures.
Characterization of the material behaviors of UHPC has progressed to such an extent that
the full-scale structural use of this concrete is on the horizon. To date, UHPC has been
used in the construction of two public highway bridges (Hajar et al. 2003, Cavill and

2
Chirgwin 2004), numerous pedestrian bridges (Blais and Couture 1999, Behloul et al.
2004), and a wide variety of other projects (Semioli 2001, Acker and Behloul 2004,
Buitelaar 2004). Research and observations to date indicate that UHPC has the potential
to expand the use of concrete into new forms that have heretofore been impossible.
This research program focused on determining the behaviors of UHPC because this
information is relevant to the highway bridge industry in the United States. Currently, the
only UHPC that is commercially available in the United States is Ductal®, which is a
product of Lafarge, Inc. Therefore, Ductal® was the UHPC product used in this research
program.
1.2 Objective
The objective of this research is to evaluate the potential use of UHPC in highway bridge
girders by characterizing material behaviors through small-scale specimen testing and by
characterizing structural behaviors through full-scale girder testing.
1.3 Summary of Approach
The research included two experimental phases and one analytical phase. The
experimental phases focused on determining the material behavior from small-scale
testing and the structural behavior from full-scale prestressed bridge girder tests. The
material characterization of UHPC included the testing of over 1000 individual
specimens, with an emphasis toward determining the compressive and tensile behaviors,
the long-term stability, and the durability of UHPC. Many of the material characterization

3
tests were completed according to ASTM and AASHTO standard test procedures;
however, in some instances these tests were modified or new tests were devised to
accurately capture the relevant behaviors of the concrete.
The full-scale bridge girder testing was conducted on AASHTO Type II prestressed
girders. The tests that were conducted include one flexure test on an 80-foot span girder
and three shear tests on shorter span girders. These girders did not contain any mild steel
reinforcement, thus the UHPC was required to carry all secondary (i.e., shear,
temperature, shrinkage) tensile forces.
The analytical phase of this research combined, analyzed, and elaborated upon the results
from the experimental phases. This phase included developing predictor equations for
basic properties of UHPC and developing a rational philosophy for the flexure and shear
design of prestressed UHPC I-girders.
1.4 Outline of Report
This report is divided into nine chapters. Chapters 1 and 2 provide an introduction and
relevant background information. Chapter 3 presents the results of the material
characterization study. Chapter 4 presents the results of the material tests performed on
the specimens from the full-scale UHPC girders. Information regarding the fabrication of
and experimental method associated with those girders is presented in Chapter 5. The
full-scale girder test results are presented in Chapter 6. Chapter 7 analyzes and discusses
the experimental results presented in Chapters 3 through 6. A design philosophy for the

4
flexural and shear design of prestressed UHPC I-girders is presented in Chapter 8.
Finally, Chapter 9 presents the conclusions of this research program.

5
CHAPTER 2
BACKGROUND AND PREVIOUS WORK
2.1 UHPC Constituent Materials
The UHPC used in this study is a patented product of a major worldwide concrete
manufacturer. The product is a reactive powder concrete that is marketed under the name
Ductal®. This product has a number of different material compositions depending on the
particular application. A typical composition is provided in Table 2.1-A.
The constituent material proportions were determined, in part, based on an optimization
of the granular mixture. This method allows for a finely graded and highly homogeneous
concrete matrix. Fine sand, generally between 150 and 600 µm, is dimensionally the
largest granular material. The next largest particle is cement with an average diameter of
approximately 15 µm. Of similar size is the crushed quartz with an average diameter of
10 µm. The smallest particle, the silica fume, has a diameter small enough to fill the
interstitial voids between the cement and the crushed quartz particles.
Dimensionally, the largest constituent in the mix is the steel fibers. In this study, the
fibers in the mix had a diameter of 0.008 in. and a length of 0.5 in. Given the relative
sizes of the sand and the fibers, the steel fibers are able to reinforce the concrete matrix
on the micro level. A further discussion of the properties of the steel fibers is provided in
Section 2.4.

6
Table 2.1-A: Typical UHPC composition
Material Amount (lb/yd3) Percent by Weight Portland Cement 1200 28.5
Fine Sand 1720 40.8 Silica Fume 390 9.3
Ground Quartz 355 8.4 Superplasticizer 51.8 1.2
Accelerator 50.5 1.2 Steel Fibers 263 6.2
Water 184 4.4
2.2 Manufacturer Supplied UHPC Material Properties
As previously discussed, the UHPC used in this study is a proprietary product. The
manufacturer has performed significant material property testing and has reported typical
characteristics. Table 2.2-A provides some of the material properties relevant to using
this material in bridge applications. In general, these properties have not been verified
and are provided here solely for completeness.
Table 2.2-A: Manufacturer supplied material characteristics
Material Characteristic Range Compressive Strength (ksi) 26 – 33 Modulus of Elasticity (ksi) 8000 – 8500
Flexural Strength (ksi) 5.8 – 7.2 Chloride Ion Diffusion (ft2/s) 0.02 x 10⁻¹¹
Carbonation Penetration Depth (in) <0.02 Freeze-Thaw Resistance (RDM) 100% Salt-Scaling Resistance (lb/ft2) <0.0025
Entrapped Air Content 2 – 4% Post-Cure Shrinkage (microstrain) 0Creep Coefficient (x10-6 in/in/ºC) 0.2 – 0.5
Density (lb/ft3) 152 - 159

7
2.3 Steel Fiber Material Properties
The steel fibers used in this test program were straight steel wire fibers manufactured by
Bekaert Corporation. The fibers have a nominal diameter of 0.008 in. (0.20 mm) and a
nominal length of 0.5 in. (13 mm). The chemical composition of the fibers is shown in
Table 2.3-A. Note that a thin brass coating is applied to the fibers during the drawing
process; therefore, virgin fibers may be gold-colored. This coating disappears during the
mixing process and is no longer clearly visible during the casting of the UHPC.
The intended function of these fibers within UHPC requires that the fibers have a very
high tensile strength. The manufacturer’s specified minimum tensile strength is 377 ksi
(2600 MPa), and tension tests are performed as a means of quality control on the fiber
production. The results from three of these tests are presented in Figure 2.3-A. The
average yield strength of these fibers as calculated by the 0.2% offset method is 457.7
ksi. The modulus of elasticity is 29790 ksi, and the ultimate strength is 474.0 ksi. These
results clearly show that these high strength steel wires have little reserve strength or
ductility capacity beyond yield.
Table 2.3-A: Chemical composition of steel fibers
Element Composition (percent) Carbon 0.69 – 0.76 Silicon 0.15 – 0.30
Manganese 0.40 – 0.60 Phosphorus ≤ 0.025
Sulfur ≤ 0.025 Chromium ≤ 0.08 Aluminum ≤ 0.003

8
Figure 2.3-A: Three tensile stress-strain responses for steel fiber reinforcement
0
100
200
300
400
500
0.000 0.005 0.010 0.015 0.020Strain
Stre
ss (k
si)
Yield = 457.0 ksiMax = 470.8 ksiModulus = 30500 ksi
0
100
200
300
400
500
0.000 0.005 0.010 0.015 0.020Strain
Stre
ss (k
si)
Yield = 454.9 ksiMax = 470.8 ksiModulus = 29480 ksi
0
100
200
300
400
500
0.000 0.005 0.010 0.015 0.020Strain
Stre
ss (k
si)
Yield = 461.1 ksiMax = 480.5 ksiModulus = 29400 ksi

9
2.4 Relevant Material Property Characterization Studies
2.4.1 Fiber Orientation Effect on Mechanical Properties by Stiel et al.
Stiel, Kariloo, and Fehling (2004) have conducted a research program investigating the
effect of fiber orientation on the mechanical properties of UHPC. These researchers
focused on a patented UHPC marketed under the name CARDIFRC®. This UHPC is
composed of similar constituent materials and in similar proportions to the UHPC
investigated in the present study. One primary difference is that CARDIFRC® contains
two lengths of steel fibers and a total fiber volumetric percentage of 6 percent.
This research program focused on the effect of UHPC flow direction during casting on
the compressive and flexural tensile behaviors of the concrete. Fiber reinforcement tends
to align with the direction of flow during casting. This research program investigated the
tensile and compressive behaviors of UHPC when loaded parallel to and perpendicular to
the direction of flow during casting. The compression tests were performed on 100 mm
cubes. The three-point bending flexure tests were performed on 100 mm by 100 mm
prisms with a 500 mm length.
The cube compression tests indicated that preferential fiber alignment has no significant
effect on either the compressive strength or the modulus of elasticity of UHPC. However,
the three-point flexure tests showed that the peak equivalent flexural strength of the
UHPC prisms was decreased by a factor of more than three when the fibers were
preferentially aligned perpendicular to the principal flexural tensile forces. This
preferential fiber alignment was clearly apparent on failure surfaces of the prisms. These

10
prisms also did not exhibit the traditional post-cracking toughness behaviors normally
associated with UHPC and frequently exhibited an abrupt load decrease immediately
after first cracking. All of these findings point to the importance of understanding the
structural loadings that will be carried by a UHPC member and following correct
placement techniques when casting UHPC members.
2.4.2 Prestressing Strand Development Length by Steinberg and Lubbers
Researchers at Ohio University (Steinberg and Lubbers 2003) recently completed a study
of the force transfer behavior of prestressing strand in UHPC. This research program
focused on determining the development length of 0.5-in. 270-ksi low relaxation
prestressing strands in UHPC similar to that studied in the present research program.
Predefined lengths of strands were cast into blocks of UHPC, then the strands were
pulled until slip or strand rupture occurred. Embedment lengths of 12, 18, and 24 in. were
investigated. In all tests, fracture of the strand occurred before significant slip of the
strand could occur. These results indicate that the development length of this type of
strand in UHPC is less than 12 in.
2.4.3 Permeability of Cracked Concrete by Rapoport et at.
Rapoport et al. (2002) investigated the permeability of steel fiber reinforced concrete as
compared to normal concrete. The research focused on creating small cracks in 0.5
percent and 1.0 percent steel fiber reinforced concrete, then determining the permeability
of the concrete. The two primary findings of interest from this study are as follows. First,
this study confirmed the findings of other researchers (Aldea et al. 1999) that cracks less

11
than 0.004 in. wide have little impact on the permeability of normal concrete. Second,
this study confirmed that steel fiber reinforcement reduces the total permeability of a
strained section of concrete by changing the cracking mechanism from a few large width
cracks to many small width cracks. As would be expected, the concrete with the higher
volume percentage of fiber reinforcement displayed more distributed cracking and had a
lower permeability.
2.4.4 Creep and Shrinkage of UHPC by Acker
Recall the very low post-steam treatment creep and shrinkage values presented in Table
2.2-A. Lafarge, the manufacturer and distributor of the UHPC discussed in this report,
has performed significant research focusing on the creep and shrinkage behaviors of this
concrete. Some results of this research were presented in Acker (2004), wherein the
microstructural behaviors leading to creep and shrinkage of UHPC, HPC, and normal
concrete are discussed. Additional discussion with further experimental results are
presented in Acker (2001).
Acker argues that creep and shrinkage are closely related behaviors that cannot generally
be uncoupled and studied separately. He indicates that shrinkage is primarily caused by
self-desiccation of the concrete binder resulting in the irreversible collapse of calcium-
silicate-hydrate (CSH) sheets. As UHPC contains a very low water-to-cementitious ratio,
this concrete completely self-desiccates between casting and the conclusion of Steam
treatment. Thus, UHPC exhibits no post-treatment shrinkage.

12
In regard to creep, Acker restates previous research indicating that the CSH phase is the
only constituent in UHPC that exhibits creep. Also, he points out that concrete creep
tends to be much more pronounced when it occurs as the concrete is desiccating. Thus,
the collapsed CSH microstructure and the lack of internal water both work to reduce the
creep of UHPC.
2.4.5 Abrasion Resistance of HSC via ASTM C944 by Horszczaruk
Horszczaruk (2004) studied the abrasion resistance of high strength fiber reinforced
concrete using the ASTM C944 standard procedure. This is the same procedure that the
abrasion tests discussed in Section 3.13.4 of the present report followed. Horszczaruk’s
study focused on 12 ksi to 14.5 ksi compressive strength concretes containing basalt
aggregates (0.1 in. to 0.5 in. diameter) and natural river sands (less than 0.1 in. diameter).
The testing followed ASTM C944, except that the duration of test was increased from 2
minutes to 40 minutes to allow for differentiation between concretes.
The relevant results from this study include the following. The linear best-fit
approximation of the concrete mass loss per 2 minute abrading cycle ranged from 0.14
grams to 0.78 grams. Of the ten concretes tested, six of them ranged from 0.14 grams to
0.25 grams. Horszczaruk also indicates that the rate of mass loss was relatively
consistent throughout the abrading, with no clear increased abrasion resistance during the
abrading of the smooth exterior face of the concrete.

13
2.5 Relevant Girder Testing
2.5.1 Shear Capacity of AASHTO Type II Girders by Tawfig
In the early 1990’s the Florida Department of Transportation sponsored a research
program focused on determining the shear capacity of high strength concrete bridge
girders. This research, performed by Tawfig (1995, 1996), experimentally determined the
shear capacity of AASHTO Type II girders composed of 8, 10, and 12 ksi concrete. The
AASHTO Type II girder cross-section tested included 16 strands in the bottom flange, 2
in the top flange, and an 8-in. by 42-in. composite deck cast onto the top of the girder.
Six tests were completed, with two at each compressive strength level. The loading
arrangement for the test included offset three-point loading with a shear span-to-depth
ratio of approximately 2.5. The shear reinforcement in these girders was designed
according the AASHTO Standard Specifications for Highway Bridges (1992). Two #4
stirrups were spaced every 6 in. for the first 4 feet from the bearing, then two #4 stirrups
for spaced every 8 in. for the next four feet. The remainder of the span had single #4
stirrups spaced at 8 and 12 in. spacings.
The overall shear capacity of these girders is the primary result from these tests that is
applicable to the UHPC girder tests performed as part of the current research program.
On average, the shear capacity exhibited in each of the six tests was approximately 270
kips. The shear capacity was not significantly influenced by the compressive strength of
the concrete.

14
2.5.2 Shear Capacity of Small UHPC Beams by Hegger et al.
Researchers at the Institute of Structural Concrete at RWTH Aachen University have
recently completed several tests investigating the shear capacity of UHPC beams. This
research (Hegger et al. 2004) focused on determining the shear capacity of a 12 in. deep
prestressed concrete beam containing no mild steel shear reinforcement. The UHPC used
in this research program was similar to the UHPC discussed throughout this report,
although it did contain a slightly larger percentage of steel fiber reinforcement (2.5
percent).
The cross-section of the I-beams tested in this research program contained eight 7-wire
0.6-in. prestressing strands in the bottom flange. The bottom flange of the beam was 11.5
in. wide and the top flange was 8.7 in. wide. The web of the beam was 5.9 in. tall and 2.8
in. thick. The overall beam length was 11.5 ft. and each beam was loaded in four-point
bending.
The average ultimate shear capacity of these UHPC beams was 61.4 kips. Given the size
of these beams, this result is very similar to the shear capacities that were observed in the
full-scale AASHTO Type II shear tests that are presented in Chapters 6 and 7. The
analytical procedure presented in Section 7.14.3 indicates that the average tensile stress
carried by the UHPC across the shear failure plane was approximately 2 ksi.

15
2.5.3 Flexural Capacity of High-Strength Concrete Girders by Russell and Burns
Russell and Burns (1993) investigated the behavior of prestressed concrete girders
composed of high-strength concrete. In particular, this study focused on the static and
fatigue behavior of composite bridge girders under flexure and shear loadings. The girder
flexural test completed in this research is of most interest to the present study.
This research was completed on Texas Type C girders, which are of similar shape but
slightly shallower than AASHTO Type III girders. The tested girder was 40 in. deep,
with an 8 in. deep composite deck cast on top. The deck was 72 in. wide and composed
of 6 ksi concrete. The girder was composed of 10 ksi concrete and spanned 48 ft. The
flexural test girder contained twenty-eight 0.5-in. 270-ksi low-relaxation prestressing
strands, each stressed to 31 kips. Twelve of the strands were draped.
The flexural testing of this girder included both static and fatigue loadings. Initially,
sufficient load was applied to crack the girder in flexure and shear. Flexural loading was
then repeated for 225,000 cycles, after which the girder was loaded to flexural failure.
The flexural capacity of this 48 in. deep composite girder was 38300 k-in. of applied
load. Russell and Burns note that “[t]he girder failed in pure flexure with yielding of the
strands and large plastic rotations. Cracking extended into the deck slab.” The load-
deflection response of the girder indicates that the midspan deflection at failure was
approximately 7 in.

16
CHAPTER 3
UHPC MATERIAL CHARACTERIZATION
3.1 Research Plan
The stated goal of the UHPC material characterization study is to determine the basic
behaviors of UHPC with the intent of using UHPC in highway bridges. Many material
behaviors are critical to the successful use of concrete in a highway bridge. These
behaviors include strength, durability, and long-term stability. Each of these behaviors
will be discussed in depth in this chapter.
The curing treatment applied to concrete—which is always important—is even more
important in the case of UHPC. The UHPC studied in this research program is normally
steam treated once it has reached sufficient strength to undergo the process. However,
steam treatment of UHPC in a controlled environment may not always be feasible or even
desirable. For this reason, the focus of the research, which is discussed in this chapter, is
on characterizing UHPC that had been treated to one of four curing conditions. The four
curing conditions included the standard steam treatment, a delayed version, a lower
temperature version of the same steam treatment, and an air treatment wherein no
steaming was conducted. These curing regimes will be described in more detail later in
this chapter.
This chapter describes the results of the material characterization study. The chapter
starts by introducing specimen nomenclature and test matrix information. Next, the

17
batching, casting, and curing procedures and results are presented. Results from
individual tests that focused on specific aspects of UHPC behavior are discussed in the
remainder of this chapter.
3.1.1 Batch and Specimen Nomenclature
The material characterization study detailed in this chapter included over well 1000
individual UHPC specimens. A naming scheme was created to allow for easy, unique
identification of each specimen. The large majority of specimens cast for this study were
part of the standardized set of batches designed to investigate the behavior of UHPC
cured under various curing conditions. The other specimens were cast in extraneous
batches that focused on specific behaviors of UHPC, primarily as related to compression
testing.
For clarity, the nomenclature discussed here will not be mentioned throughout most of
this chapter. In most instances, the presentation and discussion of results can be
completed without naming individual specimens. However, in some instances, the
naming system has to be used because of the large amount of similar specimens and
testing procedures.
The nomenclature used to describe the specimens in the standardized batches is based on
a five-digit alphanumeric identifier. A letter that identifies the premix delivery fills the
first digit in the identifier. This letter is ‘L,’ ‘M,’ or ‘N’ for the first, second, or third
delivery, respectively. The second digit in the identifier is filled by an integer that

18
identifies the curing treatment applied to the specimen. This number ranges from one to
four for the Steam, Air, Tempered Steam, and Delayed Steam treatments, respectively.
The third digit in the identifier is reserved for a letter that identifies the tests performed
on that batch of specimens. These letters and the associated tests will be discussed further
in the following section. A two-digit number indicating the particular specimen within
the batch occupies the fourth and fifth digits. In the few cases in which a batch was
repeated, the second batch was named identically to the first batch, except that an ‘A’
was placed at the end of the identifier for each specimen.
An example of this alphanumeric identification scheme is as follows. The first three
digits in the name M1F01 indicate that this specimen was from the second premix
delivery that was first Steam treated and then subjected to testing within the general
durability batches. The ‘01’ in the fourth and fifth digits indicates that this specimen was
a prism subjected to freeze-thaw testing.
A simpler naming scheme was used for the extraneous batches. These batches were
named sequentially based on the premix delivery. For example, the 10th batch cast from
the ‘L’ delivery focused on the effect of varying the load rate on compression test results.
Thus, the specimens from this batch are identified as L10-xx, with the ‘xx’ being an
integer identifier for each of the cylinders cast. In general, 30 or more cylinders populated
these batches, and the associated testing was designed to indicate the effect of some
external action on compressive behavior. The primary exception to this rule is batch N06,
which focused on the early age shrinkage behavior of UHPC.

19
3.1.2 Test Matrix
The test matrix devised for the material characterization study was intended to cover a
wide range of the basic behaviors of UHPC. The types of tests performed can generally
be grouped into three classes. First, strength tests focused on the compressive and tensile
behaviors of UHPC at various ages and under various curing conditions. Second,
durability tests focused on the durability of UHPC under conditions with standardized
aggressors. Finally, stability tests focused on the long-term ability of UHPC to maintain
dimensional stability under various loading and environmental conditions.
Table 3.1.2-A lists the standardized batches that were used throughout this study. The
batch letter listed in the first column is the same letter that would reside in the third digit
of the alphanumeric identifier in a specimen’s name. A simplified description of the batch
along with the associated testing is included in the next column. The specimens cast for
each particular batch are included in the third column. Finally, the last two columns
include the volume of material that was in an individual batch as well as the curing
regimes for which each batch was cast. A batch of the size indicated was cast for each
curing regime listed. Note that this large table continues over three pages.
Table 3.1.2-B provides similar information for the extraneous batches that were cast. The
only difference between this table and Table 3.1.2-A is that the batches were not cast for
each curing regime listed. Because the first column lists individual batches of concrete,
the curing regimes listed were applied to some of the specimens in each batch.

20
Table 3.1.2-A: Batching descriptions with associated specimens and curing regimes
Batch Batch Description Batch Size Curing Test Completed Specimens Cast † (ft3) Regimes ‡
A Compressive Strength 1.15 1,2,3,4 Compressive Strength, Stress-Strain 36 3x6 cylinders Penetration Resistance 1 6x6 cylinder
B Cubes/Cylinders Compression 0.9 1,2 28 day Compressive Strength 6 3x6 cylinders 28 day Compressive Strength 3 3x6.5 cylinders 28 day Compressive Strength 6 2x4 cylinders 28 day Compressive Strength 5 4x8 cylinders 28 day Compressive Strength 6 2” cubes 28 day Compressive Strength 5 4” cubes
C Split Tensile 0.95 1,2,3,4 Split Tensile 12 4x8 cylinders 28 day Compressive Strength 6 3x6 cylinders
D Direct Tension 1.0 1,2,3,4 Direct Tension 12 4x8 cylinders Mortar Briquette 18 briquettes 28 day Compressive Strength 6 3x6 cylinders
E Prism Flexure 1.1 1,2,3,4 Prism Flexure 3 3x4x16 prisms Prism Flexure 8 2x2x11 prisms Prism Flexure 8 2x2x17 prisms 28 day Compressive Strength 6 3x6 prism
P Fracture/Fatigue of Prisms 1.05 1,2 Notched Prism Fracture 4 2x4x18 prisms Flexural Toughness 5 2x2x17 prisms Flexural Fatigue 7 2x2x17 prisms 28 day Compressive Strength 6 3x6 cylinders

21
Table 3.1.2-A (continued): Batching descriptions with associated specimens and curing regimes
Batch Batch Description Batch Size Curing Test Completed Specimens Cast † (ft3) Regimes ‡
F Durability (Cl- Pen, FT, etc.) 1.0 1,2,3,4 Rapid Chloride Penetrability 3 4x3 cylinders Chloride Penetration 3 4x3 cylinders Freeze-Thaw 3 3x4x16 prisms Abrasion 3 6x3 cylinders ASR 6 1x1x11 prisms 28 day Compressive Strength 6 3x6 cylinders
Q Freeze-Thaw Supplemental 1.1 1,2,3,4 Frequency Response 4 3x4x16 prisms 28 day Compressive Strength 6 3x6 cylinders
G Scaling Slabs 0.9 1,2,3,4 Scaling 2 3x14x14 slabs 28 day Compressive Strength 6 3x6 cylinders
R Split Tensile Crack Corrosion 1.05 1,2 Split Tensile 9 4x8 cylinders Split Tensile w/ Ponding 6 4x8 cylinders 28 day Compressive Strength 6 3x6 cylinders
H Creep, Shrinkage, Thermal Expansion 1.05 1,2,3,4 Creep 5 4x8 cylinders Shrinkage 3 3x3x11 prisms Thermal Expansion 3 4x8 cylinders 28 day Compressive Strength 6 3x6 cylinders
S Early-Age Sustained Compressive Stress 0.95 1,2 Compressive Strength 25 3x6 cylinders 28 day Compressive Strength 8 3x6 cylinders

22
Table 3.1.2-A (continued): Batching descriptions with associated specimens and curing regimes
Batch Batch Description Batch Size Curing Test Completed Specimens Cast † (ft3) Regimes ‡ J Air Content, Fiber Dispersion 0.7 1 Air Content, Fiber Dispersion 8 4x8 cylinders 28 day Compressive Strength 6 3x6 cylinders
K * Air Content, Fiber Dispersion 0.7 1 Air Content, Fiber Dispersion 8 4x8 cylinders 28 day Compressive Strength 6 3x6 cylinders
M Heat of Hydration 0.9 1,2 Heat of Hydration 3 6x12 cylinders Heat of Hydration 2 3x6 cylinders 28 day Compressive Strength 6 3x6 cylinders
N * Heat of Hydration 0.9 1,2 Heat of Hydration 3 6x12 cylinders Heat of Hydration 2 3x6 cylinders 28 day Compressive Strength 6 3x6 cylinders
† Cylinders listed as diameter x height. Prisms listed as depth x width x length in tested configuration. ‡ 1 = Steam, 2 = Air, 3 = Tempered Steam, 4 = Delayed Steam * Batch mix design did not contain any accelerator.

23
Table 3.1.2-B: Batching descriptions with associated specimens and curing regimes for non-standardized batches
Batch Batch Description Batch Size Curing Test Completed Specimens Cast † (ft3) Regimes ‡
L10 Load Rate Effect 1.0 1 Compressive Strength 24 3x6 cylinders
L12 Fiber Effect on Compression 0.15 1 Compressive Strength 3 3x6 cylinders
L21 Long-Term Delayed Steam 1.0 1,2 Compressive Strength 36 3x6 cylinders
L22 Long-Term Delayed Steam 1.0 1,2 Compressive Strength 36 3x6 cylinders
L23 Demolding Time Effect 1.05 1,2 Compressive Strength 36 3x6 cylinders
N06 Early Age Shrinkage 0.17 1,2 Shrinkage 2 3x3x11 prisms Compressive Strength 2 3x6 cylinders
† Cylinders listed as diameter x height. Prisms listed as depth x width x length. ‡ 1 = Steam, 2 = Air

24
3.2 Batching, Casting, and Curing of UHPC
The first phase of the material characterization study described in this chapter is to
determine the properties of fresh UHPC. To achieve consistent results throughout the
entire study, a series of specific, standardized procedures were implemented for the
creation of the specimens described in the previous section. The casting of these
specimens allowed for the mixing, associated testing, and observation of over 50 batches
of UHPC.
The UHPC used in this study can be divided into three parts—premix, fibers, and liquids.
The premix consists of all of the cementitious, aggregate, and filler materials (described
in Chapter 2). The premix was batched and blended by the manufacturer and delivered in
bulk to the researchers. All of the UHPC testing described in this chapter consists of
specimens created from one of the three premix deliveries made to the researchers over
the course of 18 months. As described in the previous section, these deliveries were
designated as the ‘L,’ ‘M,’ and ‘N’ premixes. For the purpose of this study, all of the
premixes are assumed to be identical; however, it is realized that manufacturing
processes can vary with time and the final premix product could show slight variations.
The liquids that were mixed with the UHPC included water, accelerator, and a high-range
water-reducing admixture (HRWA). The accelerator used in this study was Rheocrete
CNI. The HRWA was Glenium 3000NS.

25
The fibers included in the UHPC were always undeformed cylindrical steel fibers that
were 0.5 in. long and had a 0.008-in. diameter. These fibers were included in the mix at a
concentration of 2% by volume.
The mix proportions used throughout this study included the following:
• Premix 137.0 lb/ft3 of concrete
• Water 6.81 lb/ft3 of concrete
• HRWA 1.92 lb/ft3 of concrete
• Accelerator 1.87 lb/ft3 of concrete
• Steel Fibers 9.74 lb/ft3 of concrete
These mix proportions were followed for all except three batches. Those three batches
followed a slightly different mix design as required by the material property being
investigated. In two batches, namely M1K and M1N, the accelerator was replaced by an
additional 1.80 lb/ft3 of water. In the remaining batch, L12, the fibers were not included
in the mix so that compression test behavior in unreinforced UHPC could be studied.
A 2.0 ft3 capacity pan mixer was used for nearly all of the UHPC mixing. This 1934
vintage mixer was somewhat underpowered for this application, resulting in extended
mix times as compared to mixing UHPC in modern mixers. Regardless, this mixer was
able to impart enough energy into the mix to obtain sufficient rheology for the casting of
laboratory specimens. A 0.3 ft3 mixer was used for the two batches that only required a
small volume of material.

26
Key points in the mixing procedure are graphically shown in Figure 3.2-A. The mixing
procedure for UHPC included the following steps:
• Weigh all constituent materials. Add ½ of HRWA to water.
• Place premix in mixer pan, and mix for 2 minutes.
• Add water (with ½ of HRWA) to premix slowly over the course of 2 minutes.
• Wait 1 minute then add remaining HRWA to premix over the course of 30
seconds.
• Wait 1 minute then add accelerator over the span of 1 minute.
• Continue mixing as the UHPC changes from a dry powder to a thick paste.
The time for this process will vary.
• Add fibers to the mix slowly over the course of 2 minutes.
• After the fibers have been added, continue running mixer for 1 minute to
ensure that the fibers are well dispersed.

27
Figure 3.2-A: Mixing of UHPC including (clockwise from left) water addition, HRWA addition, pre-paste consistency, fiber addition, and finished mix

28
As soon as mixing was completed, the casting of specimens and the measurement of the
rheological properties of the UHPC commenced. The rheology of the UHPC was
measured via a flow table test similar to that described in ASTM C1437. In the test that
was implemented in this study, the mini slump cone is filled then removed to allow the
concrete to flow outward. Once the concrete reaches a steady state, the average diameter
is determined by measuring the concrete at three locations. Next, the flow table is
dropped 20 times in approximately 20 seconds. Again, the concrete is allowed to settle
then its average diameter is recorded.
The casting of all UHPC specimens used in this material characterization study was
completed within 20 minutes after the completion of mixing. All specimens were cast on
a vibrating table and were allowed to remain on the table for approximately 30 seconds
after filling. The filling of molds was completed via scoops used to move the UHPC from
the mixing pan into the mold. In prisms specimens for flexure tests, the UHPC was
always placed in one end of the mold and allowed to flow to the other end in order to
complete the filling. As was discussed in Section 2.4.1, the tensile properties of UHPC
are dependent on fiber reinforcement orientation, which is a direct result of casting
procedure.
After filling, specimens were removed from the vibrating table and were screeded.
Although screeding is not normally recommended for UHPC and is very difficult to
complete on a large-scale cast, it was implemented here to make the later preparation of
cured specimens easier. After screeding, each specimen had its exposed surface covered

29
in plastic to prevent moisture loss. The specimens then sat undisturbed until final set had
occurred.
The demolding of the specimens occurred approximately 24 hours after casting. As will
be discussed later in this chapter, this timetable sometimes resulted in the demolding of
specimens that were marginally ready and had only very recently achieved set.
Demolding of larger specimens that would have needed sufficient strength to support
their greater self-weight would not have been possible in all cases on this timetable.
As previously mentioned, four curing regimes were implemented in order to study UHPC
characteristics under different curing conditions. The standard, manufacturer
recommended curing treatment included steaming the UHPC at 90ºC and 95% relative
humidity (RH) for 48 hours. In practice, this procedure included 2 hours of increasing
steam and 2 hours of decreasing steam, leaving 44 total hours of constant steaming at
90ºC and 95% RH. This treatment was initiated within 4 hours after demolding. This
curing condition will henceforth be referred to as Steam treatment.
The remaining three regimes include Air treatment, Tempered Steam treatment, and
Delayed Steam treatment. The Air treatment allowed the specimens to remain in a
standard laboratory environment from demolding until testing. The Tempered Steam
treatment is very similar to the Steam treatment, except that the temperature inside the
steam chamber was limited to 60ºC. Finally, the Delayed Steam treatment is a curing
regime wherein the Steam treatment described above is followed, but it is not initiated

30
until the 15th day after casting. Until the 15th day, Delayed Steam specimens are
equivalent to Air treated specimens.
Tables 3.2-A and 3.2-B provide information relating to the casting and curing of each of
the batches included in this material characterization study. Table 3.2-A focuses on the
primary sets of specimens that were implemented across most curing regimes. These
batches were all cast with premix from the ‘M’ or ‘N’ deliveries. Table 3.2-B provides
the results from other batches cast and primarily focuses on material cast from the ‘L’
premix delivery.
The tables include a listing of the age of the UHPC premix at the time of casting along
with the total mixing time for each batch. Observation of the mixing and casting
procedure throughout all the mixes completed in this study indicated that the behavior of
the mix changed as the premix aged. This qualitative observation is confirmed by the
results as shown in Figure 3.2-B. The total mixing time for each mix in the ‘M’ and ‘N’
premixes is plotted against the premix age at casting. This figure shows a clear trend in
which younger premixes could mix within 15 minutes while older mixes could take twice
as long. Although not verified, it is likely that these increased times result from the
agglomeration of fine particles within the premix as it ages. It must be noted that these
mix times are relative and are only specifically applicable to the pan mixer used in this
study.

31
The rheology measures are also listed in Tables 3.2-A and 3.2-B. The final values ranged
from 6.5 to 8.25 in. This wide range is indicative of large differences in rheology. The
UHPC exhibiting the stiffer results was much more difficult to cast and would definitely
have been problematic outside of a laboratory setting. Alternatively, a flow measure that
was near or above 8 in. was consistent with UHPC that was easy to place.
Figure 3.2-C shows the final rheology values for the ‘M’ and ‘N’ premixes. The first
castings of the ‘M’ premix were completed during a time period when the laboratory
conditions included very low humidity. For this reason, the results are shown in two
series that indicate whether the humidity was low or normal during casting. Very stiff
rheology results were obtained for a few mixes just before the rectification of the
humidity situation. It is expected that the large diameter of the pan in the pan mixer
combined with the low air moisture content worked to sap a small amount of moisture
from the UHPC. This moisture loss was sufficient to adversely affect the rheological
properties.

32
Table 3.2-A: Batching and casting properties of Steam and Air treated UHPC
Flow (in.) Batch Batch Description
Age at Casting
Batch Size (ft3)
Mixing Time (min) Initial Final
Demolded (hours)
Curing Regime
N1A Compressive Strength 4 months 1.15 24 6.75 7.75 22.5 SteamN1AxxA Compressive Strength 5 months 0.95 28 6.75 7.5 28 Steam
M1B Cubes/Cylinders Compression 6 weeks 0.9 20 6 6.75 26 SteamN1C Split Tensile 2 weeks 0.95 20 6.5 7.5 22 SteamM1D Direct Tension 9 weeks 1 22 6.5 7.5 28 SteamN1E Prism Flexure 4 weeks 1.1 21 6.75 7.75 23 SteamM1F Durability (Cl- Pen, FT, etc.) 4 weeks 1 15 6.5 7.5 26 SteamM1G Scaling Slabs 4 weeks 0.9 14 7 7.5 26 SteamN1H Creep and Shrinkage 15 weeks 1.05 23 6.75 7.75 22.5 SteamM1J Air Content, Fiber Dispersion 6 weeks 0.7 21.5 5.5 6.5 26 Steam
M1JxxA Air Content, Fiber Dispersion 8 weeks 0.7 23 6.25 7.5 26 SteamM1K † Air Content, Fiber Dispersion 7 weeks 0.7 20 6.5 7.5 72 SteamM1M Heat of Hydration 6 weeks 0.9 21.5 5.5 6.75 26 Steam
M1MxxA Heat of Hydration 7 weeks 0.5 23.5 5.75 6.75 26 SteamM1MxxB Heat of Hydration 8 weeks 0.9 20 6.25 7.25 26 Steam
M1N † Heat of Hydration 7 weeks 0.9 16.5 7.25 8.25 72 SteamM1P Fracture/Fatigue of Prisms 7 weeks 1.05 20 6.25 7.5 26 SteamM1Q Freeze-Thaw Supplemental 12 weeks 1.1 20 6 7 29 SteamN2A Compressive Strength 8 weeks 1.15 22 6.75 8 20 AirN2C Split Tensile 3 weeks 0.95 21 7 8.25 24 AirM2D Direct Tension 9 weeks 1 21 6 7 26 AirN2E Prism Flexure 3 weeks 1.1 20 6.75 7.75 24 AirM2F Durability (Cl- Pen, FT, etc.) 5 weeks 1.05 17.5 6 7 26 AirM2G Scaling Slabs 5 weeks 0.9 17 6.25 7.25 26 AirN2H Creep and Shrinkage 8 weeks 1.05 21.5 6.5 7.5 22 AirM2P Fracture/Fatigue of Prisms 12 weeks 1.05 20 6 7.25 29 AirM2Q Freeze-Thaw Supplemental 12 weeks 1.1 19.5 6.25 7.5 29 Air
† Batch mix design did not contain any accelerator.

33
Table 3.2-A (continued): Batching and casting properties of Tempered Steam and Delayed Steam treated UHPC
Flow (in.) Batch Batch Description
Age at Casting
Batch Size (ft3)
Mixing Time (min) Initial Final
Demolded (hours)
Curing Regime
N3A Compressive Strength 8 weeks 1.15 20 6.5 7.5 21 T. Steam N3C Split Tensile 3 weeks 0.95 21 7 8 23 T. Steam M3D Direct Tension 8 weeks 1 20 6.5 7.5 26 T. Steam N3E Prism Flexure 5 weeks 1.1 21 6.75 7.75 25 T. Steam M3F Durability (Cl- Pen, FT, etc.) 5 weeks 1.05 15 6.25 7.25 26 T. Steam M3G Scaling Slabs 5 weeks 0.9 14 6.5 7.25 26 T. Steam N3H Creep and Shrinkage 7 weeks 1.05 20 6.5 7.75 22 T. Steam M3Q Freeze-Thaw Supplemental 12 weeks 1.1 19.5 6.25 7.5 29 T. Steam N4A Compressive Strength 2 weeks 1.15 16 6.5 7.75 24 D. Steam N4C Split Tensile 2 weeks 0.95 20 6.75 8 23 D. Steam M4D Direct Tension 7 weeks 1 20 6.25 7.5 26 D. Steam N4E Prism Flexure 2 weeks 1.1 20 6.75 8 22 D. Steam M4F Durability (Cl- Pen, FT, etc.) 4 weeks 1 16 6.75 7.75 26 D. Steam M4G Scaling Slabs 4 weeks 0.9 15 6.5 7.25 26 D. Steam N4H Creep and Shrinkage 7 weeks 1.05 21 7.25 8.25 23 D. Steam M4Q Freeze-Thaw Supplemental 12 weeks 1.1 20 6 7 29 D. Steam

34
Table 3.2-B: Batching and casting properties of batches cast to complete the study by addressing special issues
Flow (in.) Batch Batch Description
Age at Casting
Batch Size (ft3)
Mixing Time (min) Initial Final
Demolded (hours)
Curing Regime
L1B Cubes/Cylinders Compression 16 months 0.9 26 6 7 48 Steam L1F Durability (Cl- Pen, FT, etc.) 11 months 0.9 20 6.25 7 41 Steam L1G Scaling Slabs 11 months 1.0 23 6.25 7.25 44 Steam L1R Split Tensile Cracked Corrosion 16 months 1.1 22 6.5 7.5 48 Steam L2B Cubes/Cylinders Compression 8 months 0.9 34 6 7 114 Air L2F Durability (Cl- Pen, FT, etc.) 11 months 1.0 17 5.75 6.75 50 Air L2G Scaling Slabs 11 months 0.9 20 5.75 6.75 43 Air L2R Split Tensile Cracked Corrosion 16 months 1.1 24 6.75 7.75 47 Air
L2S Early-Age Sustained Compressive Stress 26 months 1.0 23 6.75 7.75 – Steam & Air
L03 † Fiber Dispersion 8 months 1.0 19 8.25 9.25 139 Air L10 Load Rate Effect 10 months 1.0 27 6.5 7.25 47 Steam L12 Fiber Effect on Compression 11 months 0.15 18 7.25 8.0 42 Steam L21 Long-Term Delayed Steam 25 months 1.0 22 7.25 8.25 44 Steam & AirL22 Long-Term Delayed Steam 25 months 1.0 22 7.25 8 43 Steam & AirL23 Demolding Time Effect 25 months 1.0 22 6.5 7.5 various Steam & AirN06 Early Age Shrinkage 5 months 0.17 23 N/A N/A – Steam & Air
† Batch mix design did not contain any accelerator.

35
Figure 3.2-B: Mix time as affected by premix age
Figure 3.2-C: Final flow diameter as affected by premix age
6.0
6.5
7.0
7.5
8.0
8.5
0 20 40 60 80 100 120 140 160Premix Age at Casting (days)
Fina
l Flo
w D
iam
eter
(in.
)
'M' premix, low humidity'M' premix, normal humidity'N' premix
0
5
10
15
20
25
30
0 20 40 60 80 100 120 140 160Premix Age at Casting (days)
Mix
ing
Tim
e (m
inut
es)
'M' premix, low humidity'M' premix, normal humidity'N' premix

36
3.3 Compression Testing
A significant portion of this study focused on the behaviors of molded UHPC cylinders
under compressive loading. The compressive tests discussed in this section were all
completed nominally according to the ASTM C39 standard test method for cylinders and
the ASTM C109 standard test method for cubes. Throughout the entire material
characterization study, nearly 1000 compression specimens were tested. Although the
load configuration and basic test setup remained constant, various properties were
investigated through the use of different data collection techniques and different
specimen geometries.
The basic compression test on UHPC was the ASTM C39 test on a 3-in. diameter
cylinder. This test was used as a control test throughout the material characterization
study to ensure that consistent batching, mixing, and curing of the UHPC had occurred.
The 3 in. cylinders were cast on a vibrating table in 6 in. tall plastic molds. The concrete
was scooped into the molds and was not rodded due to the presence of the fibers. Once
full, the molds were held on the vibrating table for a few extra seconds before being
removed and having their top surfaces screeded. After the molds were set, curing
treatments were applied according to each of the four curing regimes.
The preparation of the cylinders for testing was somewhat more involved than that
normally used for cylinder testing. The largest difference is that the end planeness of the
cylinders was ensured through the use of an end grinder. Figure 3.3-A shows a picture of
the end grinding procedure. All cylinders that were projected to have strengths above 12

37
ksi were subjected to grinding. UHPC cylinders with strengths under this level were
sulfur capped as grinding tends to pull out the fibers and create a non-uniform end
surface at these lower strengths.
After grinding, the cylinders were measured to verify end planeness and to determine
length, diameter, and density. The end planeness was verified through the use of a flat
steel plate and a dial gage as shown in Figure 3.3-A. Sliding the cylinder under the dial
gage allowed for determination of the longest and shortest lengths of the cylinder to an
accuracy of 0.001 in. The out-of-planeness of the cylinder ends could be determined from
this information. Each cylinder had to exhibit under 1 degree of out-of-planeness or the
ends were reground. Next, the length was measured at four points around the
circumference of the cylinder, and the average was calculated. The diameter was then
measured at six locations—at the top, middle, and bottom of the cylinder on two
perpendicular diameters. The average value was then used to calculate the area of the
cylinder. Finally, the mass of the cylinder was determined, and the density was
calculated. The entire grinding and measuring procedure was completed after any steam-
based treatment was applied to the cylinder or at least 2 weeks after casting for the Air
treated specimens, unless the testing timetable required otherwise. In this case, a cylinder
was prepared for testing within 1 day of performing the test.

38
Figure 3.3-A: (a) Grinding and (b) measuring of 3-in. diameter cylinders
The testing of all cylinders was completed in a Forney 1000 kip capacity compression
testing machine. The operator of this hydraulically operated machine uses a needle valve
to set and control the loading rate. Aside from some preliminary testing that will be
discussed later, the load rate for all cylinder and cube compression tests was set at 150
psi/sec. This load rate is higher than the load rates recommended in ASTM C39 and
C109. The increased load rate was necessary, as the high strengths of UHPC would mean
that a UHPC cylinder tested at the ASTM C39 load rate might take 15 to 20 minutes to
reach failure. A small study, completed to determine if the higher load rate would have
any adverse effect on results, indicated that the higher load rate was acceptable. A further
discussion of this set of tests is presented subsequently in this chapter.
A 6.5-in. diameter spherical bearing was used as the upper loading platen for all cylinder
and cube tests. Although this bearing would normally only be used for 4-in. diameter
cylinders, it was used for all of the tests because of the high stress levels placed on the
(a) (b)

39
bearing by this high strength concrete. The lower test platen was always either the
machine’s lower platen or a machined steel plate resting on the machine’s platen.
Figure 3.3-B shows a cylinder that is prepared for testing. All specimens were loaded via
the hydraulically controlled constant load rate from approximately 5 kips through failure.
The cylinders and cubes exhibited very little decrease in stiffness throughout testing, thus
the load rate remained relatively constant. Figure 3.3-B also shows a picture of a cylinder
after testing. Notice that the cylinder remains intact. This is due to the presence of the
fibers as will be discussed more fully later in this chapter.
Figure 3.3-B: 3-in. diameter cylinders (a) before and (b) after compression testing
(a) (b)

40
3.3.1 Strength
The compressive strength results from 44 batches of UHPC are presented in Table 3.3.1-
A. These results are from the control cylinders cast with each batch from the ‘M’ and ‘N’
deliveries of UHPC premix. Control cylinder results from the ‘L’ delivery are shown in
Figure 3.3.1-B. All tests were performed on the corresponding day that is listed in the
table. In general, six cylinders were tested for each batch, and the results were averaged
to obtain the result shown in the table.
Based on these tests, the average 28-day compressive strength of UHPC has been
determined. Steam treated UHPC was found to have a compressive strength of 28.0 ksi
with a 95% confidence interval of 27.7 to 28.3 ksi. Air treated UHPC has a compressive
strength of 18.3 ksi with a 95% confidence interval of 17.9 to 18.7 ksi. Tempered Steam
treated UHPC has a compressive strength of 24.8 ksi with a 95% confidence interval of
24.3 to 25.3 ksi. Finally, Delayed Steam treated UHPC has a compressive strength of
24.8 ksi with a 95% confidence interval of 24.3 to 25.3 ksi.

41
Table 3.3.1-A: Control cylinder compressive strength results
Compressive Strength (ksi) Batch Curing Batch Description Day No. Average St. Dev. N1A Steam Compressive Strength 28 6 26.2 1.02
N1AxxA Steam Compressive Strength 30 6 28.4 2.08M1B Steam Cubes/Cylinders Compression 29 6 29.4 0.61N1C Steam Split Tensile 28 6 26.3 1.76M1D Steam Direct Tension 28 6 24.3 0.95N1E Steam Prism Flexure 28 6 27.4 1.25M1F Steam Durability (Cl- Pen, FT, etc.) 28 6 29.3 1.59M1G Steam Scaling Slabs 28 6 29.2 1.53N1H Steam Creep and Shrinkage 28 6 27.3 1.33M1J Steam Air Content, Fiber Dispersion 28 6 27.7 1.24
M1JxxA Steam Air Content, Fiber Dispersion 28 6 25.6 1.07M1K Steam Air Content, Fiber Dispersion 28 6 27.3 1.34M1M Steam Heat of Hydration 28 6 28.2 1.00
M1MxxA Steam Heat of Hydration 28 6 27.7 2.18M1MxxB Steam Heat of Hydration 28 6 28.5 1.09
M1N Steam Heat of Hydration 28 6 28.3 1.37M1P Steam Fracture/Fatigue of Prisms 28 6 25.7 2.53M1Q Steam Freeze-Thaw Supplemental 28 4 20.8 0.72N2A Air Compressive Strength 28 6 16.2 0.72N2C Air Split Tensile 28 6 17.5 0.65M2D Air Direct Tension 28 6 15.4 0.50N2E Air Prism Flexure 28 6 17.6 0.69M2F Air Durability (Cl- Pen, FT, etc.) 28 6 19.0 0.76M2G Air Scaling Slabs 28 6 16.9 0.48N2H Air Creep and Shrinkage 28 6 16.5 0.50M2P Air Fracture/Fatigue of Prisms 28 6 15.5 0.62M2Q Air Freeze-Thaw Supplemental 28 4 15.3 0.20N3A T.Steam Compressive Strength 28 6 22.3 0.91N3C T.Steam Split Tensile 28 6 24.4 0.66M3D T.Steam Direct Tension 28 6 25.2 0.72N3E T.Steam Prism Flexure 28 6 25.1 0.61M3F T.Steam Durability (Cl- Pen, FT, etc.) 28 6 26.5 1.21M3G T.Steam Scaling Slabs 28 6 24.6 1.37N3H T.Steam Creep and Shrinkage 28 5 25.7 0.31M3Q T.Steam Freeze-Thaw Supplemental 28 5 21.6 0.73N4A D.Steam Compressive Strength 30 6 25.1 1.05N4C D.Steam Split Tensile 28 6 24.6 0.89M4D D.Steam Direct Tension 28 6 22.9 1.72N4E D.Steam Prism Flexure 28 5 25.0 0.62M4F D.Steam Durability (Cl- Pen, FT, etc.) 28 6 25.9 1.08M4G D.Steam Scaling Slabs 28 6 25.9 1.04N4H D.Steam Creep and Shrinkage 28 5 24.4 1.20M4Q D.Steam Freeze-Thaw Supplemental 28 5 17.8 0.93

42
Table 3.3.1-B: More control cylinder compressive strength results
Compressive Strength (ksi) Batch Curing Batch Description Day No. Average St. Dev. L1B Steam Cubes/Cylinders Compression 28 6 30.5 1.02 L2B Air Cubes/Cylinders Compression 28 8 21.6 0.55 L1R Steam Split Tensile Ponding 28 6 29.9 0.75 L2R Air Split Tensile Ponding 28 6 20.6 0.59
These results, although quite high for concrete, are likely lower than would normally be
observed with this UHPC. Two factors that have been found to clearly influence the
compressive strength are the environment that UHPC is kept in prior to any steam-based
treatment and the steaming environmental conditions. In this study, the UHPC was
demolded as soon as it had sufficient strength to maintain its geometric integrity. At this
age, the UHPC is still rather permeable and is susceptible to moisture loss and resulting
lower strength values. This factor will be discussed in more depth later in this chapter.
Second, the UHPC manufacturer recommends 48 hours of steam treatment, whereas in
this study the UHPC only actually received 44 hours at the steam treatment level with 2
hours of ramping up and down from room temperature.
The results from the individual compression tests listed in Table 3.3.1-A are shown in
Figures 3.3.1-A and 3.3.1-B relative to density and cylinder end planeness, respectively.
The density results show that this concrete ranges from around 150 to 156 lb/ft3. An
estimate of 155 lb/ft3 is reasonable regardless of the type of curing treatment applied.
Also, within each curing regime there seems to be a slight increase in compressive
strength as the density increases. The cylinder end planeness results show that the out-of-
planeness of the cylinders had little impact on the compressive strength. The spherical

43
bearing used in these tests clearly was able to accommodate for these differences in
planeness.
Figure 3.3.1-A: Compressive strength and density of control cylinders
Figure 3.3.1-B: Compressive strength and cylinder end planeness of control cylinders
05
1015
20253035
0.0 0.2 0.4 0.6 0.8 1.0Degrees Out of Parallel
Com
pres
sive
Stre
ngth
(ksi
)
Steam Cured Air CureTempered Steam Cure Delayed Steam Cure
0
5
10
15
20
25
30
35
147 149 151 153 155 157Density (lb/ft3)
Com
pres
sive
Stre
ngth
(ksi
)
Steam Cured Air CureTempered Steam Cure Delayed Steam Cure
Density (lb/ft3)

44
3.3.2 Strength, Modulus of Elasticity, and Strain Capacity With Time
The age dependent compressive behavior of UHPC was investigated through a series of
compression tests completed from 1 day to 8 weeks after casting. This testing provided
results related to strength, modulus of elasticity, and compressive strain capacity both
before and after the application of any curing treatment.
These tests were also completed in the 1000 kip Forney test machine following the same
procedures discussed previously. However, in these tests, a deformation measuring
device was attached to each cylinder to capture the axial movement. These tests were
completed nominally in accordance with ASTM C469 with one exception: A number of
the allowances made by this test method for the collection of data via simplified systems
were bypassed in favor of more robust methodologies.
The test setup included the specially designed axial deformation measuring device shown
in Figure 3.3.2-A. The two parallel rings are both rigidly attached to the cylinder with a 2
in. gage length between attachment points. The upper ring holds three LVDTs whose
ends bear on the lower ring. Thus, the axial deformation of the cylinder can be accurately
measured from initiation of loading through failure. The load and the output from the
three LVDTs were digitally recorded at approximately 4 Hz throughout the test.
The testing of each cylinder was completed in a single constant load application from
start to failure. This procedure runs counter to the standard procedure presented in ASTM
C469 but is consistent with both ASTM C39 and the alternate loading procedure

45
presented in ASTM C469. It is expected that the normal ASTM C469 procedure was
designed to allow for assurance of seating by repeatedly loading and unloading the
cylinder and to allow for removal of the deformation measuring apparatus by stopping
the test well before reaching failure. In this test program, proper seating of the cylinder
could be assured by monitoring the load-deformation response during the test. Removal
of the deformation measuring device was not necessary as a loose-fitting plastic sleeve
was sufficient to stop any UHPC chips from damaging the LVDTs during cylinder
failure.
As previously mentioned, the preparation of specimens for tests at early ages was
completed within 1 day prior to the test. Also, cylinders with projected strengths below
12 ksi were sulfur capped instead of ground.
Selected results from these tests are compiled in Figures 3.3.2-B through 3.3.2-F. These
figures show one stress-strain curve for each of the ages at which compression responses
were collected. Note that a replicate (N1AxxA) was completed for the Steam treated
portion of the testing as the compressive strength results from the initial set (N1A) were
somewhat below the anticipated value. Unfortunately, the replicate compressive strength
results were also somewhat lower than anticipated.
The stress-strain responses obtained from these tests will be the focus of the remainder of
this section as well as the next section. In a qualitative sense, note the change in the
overall shape of the curves in Figures 3.3.2-B through 3.3.2-F. At 1, 2, or even 3 days

46
after casting if no steam-based curing is applied, the UHPC exhibits a ductile stress-strain
response. The rounded curve and the steady decrease after peak stress illustrate that the
UHPC can sustain some load-carrying capacity through large deformations without brittle
failure. The overall behavior changed dramatically after the steam-based treatment or
after 2 weeks of Air treatment. In this case, the UHPC exhibits more of a brittle response
wherein the attainment of the peak compressive load results in a rapid, uncontrolled
decrease in load-carrying capacity. As time progresses or as the steam-based treatment
becomes more acute, the brittle nature of the compressive failure response also becomes
more acute.
Figure 3.3.2-G shows the strength results for five sets of specimens. The results presented
in the figure are also shown in Table 3.3.2-B along with standard deviation values and the
numbers of cylinders tested. In a similar fashion, Figure 3.3.2-H shows the modulus of
elasticity results for the five sets of specimens. The modulus of elasticity was calculated
based on the average LVDT-based deformation measurements and the load reading. A
best-fit linear approximation of the stress-strain results from 10% to 30% of the
compressive strength of each individual cylinder was used. Again, Table 3.3.2-B presents
further information relating to these results.
Additional modulus of elasticity tests were also completed on spare cylinders from
various batches of UHPC cast for this research program. These tests were completed
following the same procedures discussed above and were all completed at 1 month of
age. In general, between 20 and 30 cylinders were tested at this age for each curing

47
regime. The overall modulus of elasticity results include a stiffness of 7650 ksi for Steam
treated, 6200 ksi for Air treated, 7400 ksi for Tempered Steam treated, and 7300 for
Delayed Steam treated UHPC.
Finally, the axial strain carried by each cylinder at peak compressive loading was also
determined based on the load-deformation results from each cylinder. This strain value
was calculated as the average deformation exhibited by the cylinder over the 2 in. gage
length of the deformation measuring system. These results are presented in Figure 3.3.2-I
and Table 3.3.2-B. The additional modulus of elasticity tests discussed above also
provided extra information related to strain at peak stress. The overall strain at peak stress
results include 0.0041 for Steam, 0.0035 for Air, 0.0035 for Tempered Steam, and 0.0039
for Delayed Steam treated UHPC.
The results presented thus far in this section illustrate three primary findings. First, after
Steam or Delayed Steam treatment, the UHPC is stabilized. In terms of strength,
stiffness, and strain at peak load, the UHPC shows very little change after a steam-based
treatment has been applied. Second, Air treated UHPC continues to gain strength for at
least 8 weeks after casting, but its increase in stiffness and decrease in strain at peak load
seem to be curtailed at 1 month. Finally, UHPC gains strength and stiffness very quickly
at early ages, while also becoming much less ductile with a large decrease in strain at
peak load. Specifically, the compressive strength and stiffness after 24 hours are around
1.5 and 1500 ksi, respectively. After 3 days, however, these values have increased to over
10 and 5000 ksi, respectively, without any curing treatment.

48
Figure 3.3.2-A: Modulus ring attachment (a) before and (b) during testing
Figure 3.3.2-B: Selected stress-strain responses for Steam treated UHPC (N1A)
(a) (b)
0
5
10
15
20
25
30
0.000 0.003 0.006 0.009 0.012Axial Strain
Axi
al S
tress
(ksi
)
24 hrs
3 days
Steam(N1A)15 days
28 days56 days

49
Figure 3.3.2-C: Selected stress-strain responses for Steam treated UHPC (N1AxxA)
Figure 3.3.2-D: Selected stress-strain responses for Air treated UHPC
0
5
10
15
20
25
30
0.000 0.003 0.006 0.009 0.012Axial Strain
Axi
al S
tress
(ksi
)
30 hrs
5 days
Steam(N1AxxA)
15 days30 days55 days
0
5
10
15
20
25
30
0.000 0.003 0.006 0.009 0.012Axial Strain
Axi
al S
tress
(ksi
)
48 hrs
24 hrs
71 hrs7 days
9 days
18 hrs
14 days
Air(N2A)
21 hrs
28 days56 days

50
Figure 3.3.2-E: Selected stress-strain responses for Tempered Steam treated UHPC
Figure 3.3.2-F: Selected stress-strain responses for Delayed Steam treated UHPC
0
5
10
15
20
25
30
0.000 0.003 0.006 0.009 0.012Axial Strain
Axi
al S
tress
(ksi
)
24 hrs
4 days14 days
Tempered Steam(N3A)
28 days56 days
0
5
10
15
20
25
30
0.000 0.003 0.006 0.009 0.012Axial Strain
Axi
al S
tress
(ksi
)
25 hrs42 hrs
72 hrs6 days9 days
14 days
Delayed Steam(N4A)21, 28, and 56 days

51
Figure 3.3.2-G: Compressive strength gain from casting up to 8 weeks of age
Figure 3.3.2-H: Modulus of elasticity gain from casting up to 8 weeks of age
Figure 3.3.2-I: Strain at peak compressive stress from casting up to 8 weeks of age
05
101520253035
0 10 20 30 40 50 60
Days After Casting
Com
pres
sive
Stre
ngth
(ksi
)
N1A N1AxxA N2A N3A N4A
0
2000
4000
6000
8000
10000
0 10 20 30 40 50 60
Days After Casting
Mod
ulus
of E
last
icity
(ksi
)
N1A N1AxxA N2A N3A N4A
0.000000
0.002000
0.004000
0.006000
0.008000
0.010000
0 10 20 30 40 50 60Days After Casting
Stra
in a
t Pea
k St
ress N1A N1AxxA N2A N3A N4A

52
Table 3.3.2-A: Strength, modulus of elasticity, and strain at peak stress results at various ages after casting (Part I)
Compressive Strength (ksi) Modulus of Elasticity (ksi) Strain at Peak Stress
Test Age (Days) No. Ave. St. Dev. No. Ave. St. Dev. No. Ave. St. Dev.
Steam (N1A) 1.0 6 1.1 0.09 6 670 151 6 0.009020 0.001740 3 6 24.5 0.58 6 7470 220 1 0.003580 – 15 6 26.0 0.69 6 7570 196 1 0.003970 – 28 6 26.1 0.50 6 7580 147 2 0.003740 0.000080 56 6 27.0 0.83 5 7620 182 2 0.003900 0.000080 Steam (N1AxxA) 1.3 5 3.9 0.36 5 2820 278 5 0.006830 0.000840 5 5 26.8 0.92 5 7600 109 4 0.004080 0.000470 15 6 28.0 0.75 6 7620 162 4 0.004020 0.000250 30 6 28.9 0.97 6 7460 167 4 0.004580 0.000300 55 6 28.1 1.20 6 7610 99 4 0.003920 0.000300 Air (N2A) 1.0 3 2.2 0.20 3 1520 312 3 0.009360 0.001930 2.0 2 9.4 0.10 2 4100 76 3 0.005020 0.000530 3 2 10.6 0.08 2 5220 43 3 0.003850 0.000340 7 3 12.9 0.09 3 5660 111 3 0.003620 0.000800 9 2 14.7 0.59 2 5450 112 3 0.003400 0.001640 14 6 16.0 0.61 6 5970 172 6 0.003710 0.000590 28 6 17.2 0.53 6 6070 164 4 0.003430 0.000130 57 6 18.1 0.69 6 6090 146 3 0.003570 0.000240

53
Table 3.3.2-A: Strength, modulus of elasticity, and strain at peak stress results at various ages after casting (Part II)
Compressive Strength (ksi) Modulus of Elasticity (ksi) Strain at Peak Stress
Test Age (Days) No. Ave. St. Dev. No. Ave. St. Dev. No. Ave. St. Dev.
Tempered Steam (N3A) 1.0 6 2.1 0.17 6 1350 262 6 0.008380 0.001430 4 6 20.2 0.58 4 7240 133 2 0.003100 0.000200 14 6 21.2 0.99 6 7210 107 3 0.003260 0.000080 28 6 21.3 0.78 6 7240 165 1 0.003150 – 58 6 22.8 0.75 6 7310 127 3 0.003550 0.000220 Delayed Steam (N4A) 0.8 2 1.4 0.06 2 1140 521 3 0.007120 0.003600 14 4 16.7 0.41 4 6220 253 3 0.003810 0.000280 21 6 25.2 0.64 5 7300 146 0 – – 30 6 24.6 0.70 6 7350 105 1 0.003760 – 56 6 25.0 0.65 6 7120 214 3 0.003890 0.000150

54
3.3.3 Linearity of UHPC Compressive Response
It is normally assumed that concrete begins to develop internal microcracking and exhibit
an associated reduction in stiffness at high stresses. The stress level varies depending on
the composition of the concrete. The linearity of the compressive stress-strain response of
UHPC was investigated through the elastic modulus testing results that were described in
the previous section.
Two methods are used to describe the linearity of the compressive stress-strain response
of concrete. The first is the secant modulus. The secant modulus, E0, is defined as the
compressive strength of the concrete divided by the strain at the peak strength. The
second method involves determining the proportion of the strength at which the observed
stress is some percentage below the elastic modulus predicted stress. Figure 3.3.3-A
shows an example of both of these linearity descriptors in conjunction with an Air treated
UHPC cylinder tested at 57 days after casting. Both of these linearity descriptors relate to
the elastic modulus, also known as the tangent modulus, that was defined previously as
being the linear best-fit approximation of the stress-strain response between 10% and
30% of the compressive strength.
The linearity to peak strength results, as defined by the secant modulus, are presented in
Table 3.3.3-A and Figures 3.3.3-B and 3.3.3-C. The secant modulus shows very similar
qualitative behaviors compared with the elastic modulus behaviors described in the
previous section. More importantly, the ratio of the tangent to secant modulus values
illustrates how the UHPC behavior changes as curing progresses. At 1 day after casting

55
this ratio ranges from 5 to 7, but by 3 days it is under 2 even without any supplemental
curing. The ratio tends to stabilize around 1.1 for the steam-based specimens and around
1.2 for the Air treated specimens. For reference, this value is normally approximately 4
for normal weight 1000 psi compressive strength concrete and approximately 1.3 for 10
ksi compressive strength concrete (Popovics 1998).
Figure 3.3.3-A: Sample Air treated stress-strain curve with linearity descriptors
The linearity results—in terms of the stress at which the stress will have dropped some
percentage from the linear elastic expected value—are presented in Table 3.3.3-A and
Figures 3.3.3-D and 3.3.3-E. The research program focused on stress drops of 1%, 3%,
and 5%. The results from the 1% drop are highly dependent on the predefined range for
calculation of the elastic modulus and as such are of less interest. The results from the 5%
0
2
4
6
8
10
12
14
16
18
20
0.000 0.001 0.002 0.003 0.004Axial Strain
Axi
al S
tress
(ksi
)
1
E0
E
1
5% Stress Decrease

56
drop clearly show that UHPC exhibits nearly linear behavior up to high stress levels.
Figure 3.3.3-E shows that the cylinders that underwent steam-based treatment reach
between 80% and 90% of their compressive strength before diverging 5% from linear
elastic behavior. The Air treated cylinders seem to be asymptotically approaching the
same type of response by 8 weeks after casting, having reached 70% of their compressive
strength before diverging 5% from the linear elastic behavior.

57
Table 3.3.3-A: Compressive stress-strain response linearity at various ages after casting (Part I)
Linearity (1%) Linearity (3%) Linearity (5%)
Test Age
(days)
Compressive Strength
(ksi)
Strain at Peak Stress E / E0 No. Strain Stress (ksi) Strain Stress (ksi) Strain Stress (ksi)
Steam (N1A) 1.0 1.1 0.009020 5.53 6 0.000440 0.28 0.000490 0.31 0.000530 0.32 3 24.5 0.003580 1.09 6 0.001540 11.4 0.002520 18.3 0.003070 21.7 15 26.0 0.003970 1.16 6 0.001470 11.0 0.002620 19.2 0.003380 24.1 28 26.1 0.003740 1.08 6 0.001570 11.8 0.002570 18.9 0.003290 23.8 56 27.0 0.003900 1.10 5 0.001610 12.1 0.002670 19.8 0.003360 24.4 Steam (N1AxxA) 1.3 3.9 0.006830 4.90 5 0.000340 0.94 0.000420 1.1 0.000470 1.2 5 26.8 0.004080 1.16 5 0.001730 13.0 0.002790 20.5 0.003400 24.5 15 28.0 0.004020 1.09 6 0.001830 13.8 0.002890 21.3 0.003440 24.9 30 28.9 0.004580 1.18 5 0.001930 14.4 0.002960 21.6 0.003620 25.7 55 28.1 0.003920 1.06 6 0.001870 14.1 0.002960 21.9 0.003700 26.7 Air (N2A) 1.0 2.2 0.009360 6.49 2 0.000330 0.43 0.000380 0.55 0.000410 0.59 2.0 9.4 0.005020 2.20 0 – – – – – – 3 10.6 0.003850 1.90 2 0.000590 3.0 0.000740 3.7 0.000870 4.3 7 12.9 0.003620 1.59 3 0.000680 3.8 0.000930 5.1 0.001140 6.1 9 14.7 0.003400 1.26 2 0.000920 5.0 0.001250 6.6 0.001520 7.9 14 16.0 0.003710 1.39 6 0.000860 5.0 0.001200 6.9 0.001490 8.4 28 17.2 0.003430 1.21 6 0.001040 6.2 0.001530 9.0 0.001930 11.1 57 18.1 0.003570 1.20 6 0.001180 7.1 0.001760 10.4 0.002220 12.8

58
Table 3.3.3-A: Compressive stress-strain response linearity at various ages after casting (Part II)
Linearity (1%) Linearity (3%) Linearity (5%)
Test Age
(days)
Compressive Strength
(ksi)
Strain at Peak Stress E / E0 No. Strain Stress (ksi) Strain Stress (ksi) Strain Stress (ksi)
Tempered Steam (N3A) 1.0 2.1 0.008380 5.34 6 0.000390 0.51 0.000460 0.59 0.000520 0.66 4 20.2 0.003100 1.11 4 0.001310 9.4 0.001940 13.6 0.002400 16.5 14 21.2 0.003260 1.11 6 0.001380 9.9 0.002110 14.8 0.002630 18.0 28 21.3 0.003150 1.07 6 0.001180 8.4 0.002070 14.5 0.002580 17.8 58 22.8 0.003550 1.14 6 0.001360 9.8 0.002150 15.2 0.002710 18.8 Delayed Steam (N4A) 0.8 1.4 0.007120 5.61 1 0.000480 0.36 0.000550 0.41 0.000380 0.34 14 16.7 0.003810 1.42 4 0.000870 5.3 0.001190 7.1 0.001480 8.7 21 25.2 5 0.001490 10.8 0.002250 15.9 0.002900 20.1 30 24.6 0.003760 1.13 6 0.001630 11.9 0.002420 17.3 0.003000 21.0 56 25.0 0.003890 1.11 6 0.001700 12.0 0.002630 18.2 0.003280 22.2

59
Figure 3.3.3-B: Secant modulus from casting up to 8 weeks of age
Figure 3.3.3-C: Ratio of elastic to secant modulus from casting up to 8 weeks of age
010002000300040005000600070008000
0 10 20 30 40 50 60 70
Days Since Casting
E0 (
ksi)
N1A N1AxxA N2A N3A N4A
0
1
2
3
4
5
6
7
0 10 20 30 40 50 60 70Days Since Casting
E / E
0
N1A N1AxxA N2A N3A N4A

60
Figure 3.3.3-D: Compressive stress to strength ratio at 1% stress drop from linear elastic
Figure 3.3.3-E: Compressive stress to strength ratio at 5% stress drop from linear elastic
0.0
0.2
0.4
0.6
0.8
1.0
0 10 20 30 40 50 60 70Days After Casting
Stre
ss/S
treng
th a
t 1%
stre
ss
drop
from
line
ar
N1A N1AxxA N2A N3A N4A
0.0
0.2
0.4
0.6
0.8
1.0
0 10 20 30 40 50 60 70
Days After Casting
Stre
ss/S
treng
th a
t 5%
stre
ss
drop
from
line
ar
N1A N1AxxA N2A N3A N4A

61
3.3.4 Compression Specimen Geometry
In the United States, the cylinder is the standard concrete compression test specimen.
Conversely, the cube is the standard specimen in parts of Europe. It is generally accepted
that with normal strength concrete the cube will result in a higher compressive strength
due to its shorter aspect ratio and the proportionally larger lateral confinement provided
by the machine platens.
A series of tests were completed to determine the effect of various specimen geometries
on the compressive strength of UHPC. Compression tests were completed according to
ASTM C39 on 2-in., 3-in., and 4-in. diameter cylinders with cast lengths of twice their
diameters. ASTM C39 compression tests were also performed on overlength 3 in.
diameter cylinders that had a cast length of 6.5 in. Cube compression tests were
completed according to ASTM C109 on 2 in. and 4 in. cubes. Figure 3.3.4-A shows the
range of sizes and geometries of the specimens tested. Figure 3.3.4-B shows the cylinder
and cube specimens in the compression testing machine. Note that all specimens were
tested in a hydraulically actuated 1000 kip Forney test machine with a load rate
equivalent to 150 psi/sec.
The test program described above was repeated three times. Each time, the set of cylinder
and cube specimens was cast from a single batch. Two of the batches were Steam treated
while the third batch was Air treated. Table 3.3.4-A provides the results from the
compression tests. The 3-in. diameter cylinder—used as the control specimen throughout
the entire study—was also the control specimen for this series of tests.

62
Figure 3.3.4-A: Compression cubes and cylinders including (clockwise from upper left) 4-in., 3-in. overlength, 3-in., and 2-in. diameter cylinders and 2 in. and 4 in. cubes
Figure 3.3.4-B: (a) Cylinder and (b) cube compression testing
The combined results from the three sets of tests indicate that the compressive strength of
UHPC can be measured, relatively accurately, through various sizes of cubes and
cylinders. Results were never more than 8% removed from the control cylinder result.
(a) (b)

63
The cubes tended to exhibit slightly higher strengths on the order of 5%. In addition, the
2-in. diameter cylinders tended to exhibit slightly lower strengths. The smaller cubes and
cylinders tended to exhibit larger standard deviations. Conversely, the large specimens
tended to exhibit smaller standard deviations. These results were expected because
heterogeneities in the concrete would likely remain in a uniform size range but would be
proportionally larger in smaller specimens.
Table 3.3.4-A: Cylinder and cube compressive strength results
Compressive Strength
(ksi) Specimen No. Average St. Dev.
% Difference From Control
Steam (M1B) 3 in. Cylinder † 6 29.4 0.61 – 4 in. Cylinder 5 29.3 0.91 -0.3 Overlength 3 in. Cylinder 3 27.2 1.29 -7.5 2 in. Cylinder 6 29.5 1.00 0.3 100 mm Cube 5 29.1 1.75 -1.2 2 in. Cube 6 31.1 1.70 5.8
Steam (L1B) 3 in. Cylinder † 6 30.5 1.02 – 4 in. Cylinder 5 31.2 0.78 2.2 Overlength 3 in. Cylinder 3 28.2 1.19 -7.5 2 in. Cylinder 6 29.0 1.79 -5.0 100 mm Cube 5 31.9 0.73 4.6 2 in. Cube 6 31.9 1.56 4.6
Air (L2B) 3 in. Cylinder † 8 21.6 0.55 – 4 in. Cylinder 5 22.4 0.30 3.7 Overlength 3 in. Cylinder 3 21.8 0.22 1.1 2 in. Cylinder 6 20.3 2.15 -5.9 100 mm Cube 3 23.3 0.42 8.0 2 in. Cube 6 22.9 1.28 6.1
† Considered to be the control specimen.

64
3.3.5 Demolding Age Effect on Compressive Strength
Throughout this test program, control cylinder compressive strengths were sometimes
below the anticipated value. As previously mentioned, the mix design, constituent
materials, and mixing procedure were always the same. For this reason, the deviations in
strength were troubling. Two observations were made during the early stages of the test
program: (1) the set time of the UHPC sometimes varied and (2) in general, the older the
premix, the longer the set time. Regardless of these observations, the cylinders were
nearly always demolded at approximately 24 hours after casting. This delayed setting
sometimes resulted in the cylinders barely having enough strength to remain intact
throughout the demolding process.
After the bulk of the test program was complete, an additional batch was added to the test
program. This batch included two sets of 3-in. diameter cylinders that were demolded at
various ages after casting. One of the sets was then Steam treated while the other was Air
treated. The earliest that any cylinders could be stripped was determined to be 28 hours
after casting because of the advanced age of the premix by this point in the test program.
The other cylinders were stripped at 47 and 55 hours after casting. Otherwise, the
cylinders in each set were treated identically up through compression testing at 28 days.
Table 3.3.5-A presents the results from this set of compression tests. These results clearly
indicate that the age of the UHPC at stripping has a major impact on the compressive
strength. The cylinders that were stripped as soon as their integrity allowed had a 25% to
30% lower compressive strength at 28 days compared with the cylinders that were

65
stripped approximately 20 hours later. Once the cylinder has gained sufficient integrity to
support itself, the primary role of the cylinder mold is to retain moisture within the
cylinder. The loss of that moisture barrier clearly resulted in a decrease in the moisture
that was available for hydration and a resulting decrease in compressive strength.
Table 3.3.5-A: Demolding age effect on 28-day compressive strength results
Compressive Strength (ksi) Specimen Group No. Average St. Dev. Steam Stripped at 28 hours after casting 6 20.8 1.25 Stripped at 47 hours after casting 6 29.4 0.85 Stripped at 55 hours after casting 6 30.2 1.89 Air Stripped at 28 hours after casting 6 14.4 0.49 Stripped at 47 hours after casting 6 18.7 0.51 Stripped at 55 hours after casting 6 19.7 0.75
3.3.6 Long-Term Delayed Steam Effect on Compressive Strength
Although the Delayed Steam curing regime was designed to mimic the postponed steam
curing of UHPC, it is anticipated that longer delays prior to steam treatment could occur.
For this reason, two batches of UHPC were cast to focus on the compressive strength
level that UHPC can attain if the steam treatment is significantly delayed. Each of these
batches included 36 cylinders, half of which were air treated and half of which had a
steam treatment applied at a time distant from casting. The steam treatment was the same
as the standard Steam treatment except for the start date. The steam treatment always
started 6 days prior to the date of the compression testing.

66
Table 3.3.6-A presents the results of these tests. The first batch, L21, was tested at 8, 12,
and 16 weeks after casting. The second batch, L22, was tested at 8, 20, and 32 weeks
after casting. In both cases, the Air treated cylinders and the cylinders that underwent the
long-term delayed steam treatment showed consistent compressive strengths over the
months of testing. The diminishing impact of the steam treatment, delayed from 1 day to
2 weeks after casting, does not seem to continue indefinitely. By 2 months, the impact
seems to have leveled off such that steaming at this time is as effective as steaming at up
to 32 weeks after casting. Additionally, it is important to note that the application of the
steam treatment increased the compressive strength by 30%, regardless of when it was
applied.
Table 3.3.6-A: Long-term delayed steam effect on compressive strength
Compressive Strength (ksi)Batch Curing Steam Days Test Day No. Average St. Dev. L21 Air 56 days 6 20.6 0.56
Air 84 days 6 20.0 0.67 Air 112 days 6 19.5 0.33 Steam 50 to 52 56 days 6 26.2 1.04 Steam 78 to 80 84 days 6 25.2 0.59 Steam 106 to 108 112 days 6 25.8 0.74
L22 Air 56 days 6 18.9 0.35 Air 140 days 6 18.6 0.82 Air 224 days 6 19.0 0.89 Steam 50 to 52 56 days 6 25.1 0.91 Steam 134 to 136 140 days 6 24.2 1.25 Steam 218 to 220 224 days 7 24.8 0.69

67
3.3.7 Fiber Effect on Compression Failure
The steel fiber reinforcement included in UHPC provides a number of advantages, most
notably in terms of tensile structural behavior. Normally, a compression test on high
strength concrete would result in a very brittle, dramatic failure. As noted earlier in the
discussion of UHPC compression behavior, the UHPC that is reinforced with steel fibers
does not exhibit explosive failures during compression tests. Recalling Figure 3.3-B, a
compression test on Steam treated UHPC would likely result in a rapid load drop, but the
cylinder would remain intact.
A few UHPC cylinders were cast according to the normal mix design and procedures
except that the steel fiber reinforcement was not added. Thus, the high compressive
strength abilities of the UHPC matrix are present, but the restraining and confining
effects of the fibers are absent. The test results from these cylinders indicated a dramatic
change in the compression failure behavior.
Figure 3.3.7-A shows four still pictures of the failure of one of these cylinders. These
pictures were captured from a digital video recording. The video was captured at a frame
rate of 30 per second, thus the smallest increment of time over which to observe changes
in behavior is 1/30th of a second. The failure of this cylinder began when small chips of
UHPC began to fly off the top and bottom of the cylinder at its intersection with the
platens. This chipping continued for a few seconds until a larger chip exited the top of the
cylinder just 1/6th of a second before failure. The cylinder then rapidly and dramatically

68
failed: Over the course of 1/30th of a second, the intact cylinder shattered into many small
pieces of UHPC.
Although this experiment was not controlled with fiber reinforced and unreinforced
UHPC tested in parallel, the compressive strength results are still of interest. The
cylinders tested averaged 29 ksi, with the cylinder shown in the video reaching 31 ksi.
Note that these strengths correspond to loads of approximately 200 kips; therefore, the
Forney 1000 kip capacity testing machine was only at 20% of its capacity and would not
have held an inordinately high level of strain energy prior to failure.

69
Figure 3.3.7-A: Compression failure of a Steam treated UHPC cylinder containing no fiber reinforcement. (a) 1/6th of a second before
failure. (b) 1/30th of a second before failure. (c) At failure. (d) 1/10th of a second after failure.
(a) (b)
(c) (d)

70
3.3.8 Load Rate Effect on Compression Testing Results
The compression testing discussed so far in Section 3.3 was all completed with a load
rate of 150 psi/sec during the initial elastic portion of the stress-strain response. As
previously mentioned, this load rate is outside the bounds recommended by the ASTM
C39 test method. Prior to the initiation of the compression testing portion of the UHPC
material characterization work, a set of UHPC cylinders was cast with the focus being on
the effect of various load rates on standard compression testing results.
It is normally accepted that higher load rates will result in higher compression strength
and modulus of elasticity results. For this reason, using the ASTM C39 load rate of 35 +/-
15 psi/sec is recommended for any standardized compression testing of concrete.
However, the high strength results expected from UHPC mean that a single compression
test on a concrete cylinder could take 15 to 20 minutes or more. This objectionably long
time for a single data point led to the testing discussed below.
Twenty-four cylinders with a 3-in. diameter were cast within a single batch of UHPC for
this testing. The cylinders were all cast and Steam treated according to normal
procedures. The cylinders were then divided into four groups, each of which was tested at
a different load rate ranging from 35 psi/sec to 250 psi/sec. Within each group of six
cylinders, three were tested in compression according to ASTM C39. The remaining
three were tested according to ASTM C469, including multiple unloads/reloads, before
being tested according to ASTM C39. This testing differed from the previously discussed
modulus testing because the axial deformations were measured via a standard

71
compressometer as described in the test method, and data on Poisson’s ratio was also
collected.
Table 3.3.8-A presents the results of these tests. The results do not clearly indicate a
change in behavior caused by the increasing load rate. For this particular batch, the
compressive strength remained around 29 ksi, the modulus of elasticity remained around
8200 ksi, and Poisson’s ratio was quite consistent at 0.19. These results indicate that an
increase in the load rate would not be detrimental. From a practical standpoint, a
compression test run at 150 psi/sec can be completed within 5 minutes on a Steam treated
cylinder and more quickly on lower strengths of UHPC. For these reasons, a load rate of
150 psi/sec was chosen for all of the UHPC compression testing.
Table 3.3.8-A: Load rate effect on compression testing results
Compressive Strength (ksi)
Modulus of Elasticity (ksi) Poisson’s Ratio Load Rate
(psi/sec) No. Ave. St. Dev. No. Ave. St. Dev. No. Ave. St. Dev.35 6 28.2 1.62 3 8090 303 3 0.195 0.018 50 6 29.1 1.00 3 8401 212 3 0.193 0.011 150 6 29.2 0.99 3 8256 262 3 0.199 0.007 250 6 29.2 0.48 3 8011 149 3 0.184 0.011
3.4 Tension Testing
Four types of tension tests were implemented in this research program to experimentally
determine the tensile properties of UHPC. These tests included flexural testing of
prismatic sections, split tensile testing of cylinders, axial tensile testing of mortar

72
briquettes, and axial tensile testing of cylinders. The following sections discuss the test
procedures and the test results.
3.4.1 Flexural Prism
The ASTM C1018 Standard Test Method for Flexural Toughness and First-Crack
Strength of Fiber-Reinforced Concrete (Using a Beam With Third-Point Loading) was
one test used to determine the tensile properties of UHPC. This test involves the four-
point flexural loading of small-scale concrete prisms. During the test, the load on and the
deflection of the prism are monitored. These data are then used to determine the cracking
strength and post-cracking toughness response of the concrete.
This test method requires specialized equipment in order to correctly load the specimen
and accurately monitor the response. First, the test setup requires that the deflection
measuring system must measure “net values exclusive of any extraneous effects due to
seating or twisting of the specimen on its supports or deformation of the support system.”
Second, the loading of the prism must be completed through a “testing arrangement
where specimen net mid-span deflection is used to control the rate of increase of
deflection using a closed-loop, servo-controlled testing system.”
To meet these requirements, a specialized test setup was devised. In this setup, a yoke
similar to that shown in Figure 2 of ASTM C1018 was used to measure the midspan
deflections. LVDTs were attached to the yoke on each side of the specimen at midspan,
and the yoke was attached to the specimen at mid-depth over the support points. The

73
LVDTs bore on a plate that was epoxied to the compression face and extended to hang
over the sides of the prism. Figure 3.4.1-A shows two examples of the deflection
measurement setup for this four-point bending test.
Figure 3.4.1-A: Prism flexural test setup for a (a) 9 in. span and a (b) 12 in. span
(a)
(b)

74
The loading control of the test was accomplished by completing the test in an MTS load
frame. The control signal for the MTS was the midspan net deflection of the specimen as
captured by the LVDTs. The signals from the two LVDTs were electronically averaged
then submitted to the MTS control panel. In this way, the deflection rate of the prism was
accurately and consistently maintained at the correct level. This loading technique also
limited the amount of potential energy stored in the load frame that could be transmitted
into the concrete prism during the temporary stiffness loss associated with cracking.
The loading apparatus used to test the prisms was reconfigurable to allow for testing of
multiple sizes of prisms. The rollers and their support blocks are movable to allow for
lower support spans from 6 in. to 16 in. and upper loading spans from 2 in. to 6 in. As
shown in Figure 3.4.1-A, the two upper load points and the two lower support points are
steel rollers that impart no axial restraint on the prism. Torsional effects caused by
misalignment between the planes of the prism faces and the rollers were overcome by
placing individual shims between each roller and its bearing block. The bearing blocks
under the rollers are supported by 6 in. deep solid steel beams that are connected to the
heads of the MTS machine. These deep steel beams reduce flexibility in the loading
apparatus thus allowing for easier and more refined control of the test during cracking of
the prism.
The ASTM C1018 test was performed on prisms from all four curing regimes. The
casting and curing of the prisms was completed following normal procedures. During

75
casting of each prism, special care was taken to ensure that the UHPC flowed from one
end of the prism to the other, thus ensuring a fiber distribution and alignment system that
was similar to that which would occur in the large-scale casting of a beam or plate type
flexural member.
The test specification recommends a preferred standard size of molded specimen of 14 in.
by 4 in. by 4 in., resulting in a third-point loading configuration with a 12 in. lower span.
This specimen size was not used for a number of reasons. First, this depth of prism is on
the high end of the likely thickness of UHPC plate members subject to flexural forces.
Second, a shear span to prism depth ratio equal to one, as recommended by the
specification, will create a stress field and deflection response in the prism that is
substantially both flexural and shear. A larger shear span to prism depth ratio would
much more accurately represent the flexural response of UHPC. Finally, the specification
indicates that the prism cross-sectional dimensions must only be at least three times the
length of a fiber. This requirement can easily be met by smaller cross-sectional sizes.
The test program included two prism cross-sections and a total of four loading
configurations. The cross-sections investigated were 2 in. by 2 in. prisms and 3 in. deep
by 4 in. wide prisms. The 2 in. by 2 in. prisms were cast in lengths of 11 in. and 17 in.
The 3 in. by 4 in. prisms were cast 16 in. long. Four loading configurations were used to
test the 2 in. by 2 in. prisms. These included third-point loading on 6 in., 9 in., and 12 in.
lower spans, as well as loading on a 15 in. lower span with 3 in. between the upper load
points. The third-point loading with a 12 in. lower span was also used for the 3 in. by 4

76
in. cross-section prisms. These various cross-sections and loading configurations allow
for the comparison of observed tensile behaviors because the 2 in. by 2 in. prism on a 6
in. span is a scaled model of the ASTM C1018 recommended prism. Other test setups
provide more realistic representations of flexural tensile material behaviors.
The following procedure was used to complete the test:
1. The prism was centered in the load frame with the screeded face of the prism
oriented toward the front and the vertical molded faces placed as the compression
and tension faces.
2. The load was manually increased to approximately 50 lbs.
3. The setup was checked to ensure that all rollers were bearing on the prism.
4. The LVDTs were then set in place, and control of the machine was transferred to
the averaging circuit attached to the LVDTs.
5. The MTS Microprofiler was then used to apply a constant deflection rate to the
prism.
6. The deflection rate was set so that the expected first crack deflection would occur
approximately 1 minute into the test. This rate varied depending on the prism
cross-section and loading configuration.
7. The test was stopped after a deflection of at least 16 times the cracking deflection
was reached.
8. The collection of the data for the test was completed through an analog data
acquisition system. It was set to record data at 10 Hz until well after first cracking
of the prism had clearly occurred.

77
9. The record rate was then manually decreased to 4 Hz for the remainder of the test.
The time, load, deflection from both LVDTs, and electronic circuit averaged
deflection values were all recorded.
The strength and toughness results and analysis presented in the next two sections are
highly dependent on the correct identification of first cracking in each prism test. Plain
concrete and fiber reinforced concrete may begin to behave nonlinearly due primarily to
internal microcracking prior to the first overall cracking of the prism; therefore,
determining first cracking can be somewhat subjective. The behavior of UHPC is such
that the first cracking is tensile stress cracking on the bottom flange of the prism. Thus,
first cracking—recorded by the data acquisition system and physically observed on the
specimen—is usually quite clear. Figure 3.4.1-B shows the early parts of load-deflection
response curves for both a Steam and an Air treated prism. This figure shows that the
prism response is linear until first cracking when a clearly defined decrease in load
carrying capacity occurs. Soon thereafter the load again begins to increase. The sawtooth
pattern visible in the response is indicative of additional individual cracks forming
throughout the highly stressed tension face of the prism.

78
Figure 3.4.1-B: Examples of first crack shown on load-deflection response curves
A total of 76 prisms were tested over the five loading/cross-section configurations.
Seventy-one prisms were tested successfully out of this group. The load-deflection results
are presented in Figures 3.4.1-C through 3.4.1-G. Figure 3.4.1-C presents the results from
the scaled standard ASTM C1018 test on 2 in. by 2 in. prisms with third-point loading
over a 6 in. span. Figure 3.4.1-D presents the results from the 3 in. by 4 in. prisms tested
with third-point loading over a 12 in. span. Figures 3.4.1-E and 3.4.1-F present the results
from 2 in. by 2 in. prisms tested with third-point loading on 9 in. and 12 in. spans,
respectively. Finally, Figure 3.4.1-G presents the results from the 2 in. by 2 in. prisms
tested over a 15 in. span with 3 in. between the load points. Sequential results in each set
have been offset by 0.005 in. to allow for clear presentation. The curing regime applied to
each set of prisms is listed in the lower right corner of each set of results.
0
500
1000
1500
2000
2500
3000
3500
0.000 0.005 0.010 0.015 0.020 0.025 0.030
Deflection (in.)
Load
(lbs
.)First Crack
Steam Treated
Air TreatedFirst Crack

79
Figure 3.4.1-C: ASTM C1018 load-deflection response results for 2x2 prisms over a 6 in. span with third point loading
010002000300040005000600070008000
0.00 0.02 0.04 0.06Deflection (in.)
Load
(lbs
.)
Steam0
10002000300040005000600070008000
0.00 0.02 0.04 0.06Deflection (in.)
Load
(lbs
.)
Air
010002000300040005000600070008000
0.00 0.02 0.04 0.06Deflection (in.)
Load
(lbs
.)
Tempered Steam0
10002000300040005000600070008000
0.00 0.02 0.04 0.06Deflection (in.)
Load
(lbs
.)
Delayed Steam

80
Figure 3.4.1-D: ASTM C1018 load-deflection response results for 3x4 prisms over a 12 in. span with third point loading
0
2000
4000
6000
8000
10000
12000
14000
0.00 0.02 0.04 0.06 0.08 0.10Deflection (in.)
Load
(lbs
.)
Steam0
2000
4000
6000
8000
10000
12000
14000
0.00 0.02 0.04 0.06 0.08 0.10Deflection (in.)
Load
(lbs
.)
Air
0
2000
4000
6000
8000
10000
12000
14000
0.00 0.02 0.04 0.06 0.08 0.10Deflection (in.)
Load
(lbs
.)
Tempered Steam0
2000
4000
6000
8000
10000
12000
14000
0.00 0.02 0.04 0.06 0.08 0.10Deflection (in.)
Load
(lbs
.)
Delayed Steam

81
Figure 3.4.1-E: ASTM C1018 load-deflection response results for 2x2 prisms over a 9 in. span with third point loading
010002000300040005000600070008000
0.00 0.05 0.10 0.15Deflection (in.)
Load
(lbs
.)
Steam0
10002000300040005000600070008000
0.00 0.05 0.10 0.15Deflection (in.)
Load
(lbs
.)
Air
010002000300040005000600070008000
0.00 0.05 0.10 0.15Deflection (in.)
Load
(lbs
.)
Tempered Steam0
10002000300040005000600070008000
0.00 0.05 0.10 0.15Deflection (in.)
Load
(lbs
.)
Delayed Steam

82
Figure 3.4.1-F: ASTM C1018 load-deflection response results for 2x2 prisms over a 12 in. span with third point loading
0500
1000150020002500300035004000
0.00 0.05 0.10 0.15Deflection (in.)
Load
(lbs
.)
Steam0
5001000150020002500300035004000
0.00 0.05 0.10 0.15Deflection (in.)
Load
(lbs
.)
Air
0500
1000150020002500300035004000
0.00 0.05 0.10 0.15Deflection (in.)
Load
(lbs
.)
Tempered Steam0
5001000150020002500300035004000
0.00 0.05 0.10 0.15Deflection (in.)
Load
(lbs
.)
Delayed Steam

83
Figure 3.4.1-G: ASTM C1018 load-deflection response results for 2x2 prisms over a 15 in. span with 3 in. between loads
0500
1000150020002500300035004000
0.00 0.05 0.10 0.15Deflection (in.)
Load
(lbs
.)
Steam0
5001000150020002500300035004000
0.00 0.05 0.10 0.15Deflection (in.)
Load
(lbs
.)
Air
0500
1000150020002500300035004000
0.00 0.05 0.10 0.15Deflection (in.)
Load
(lbs
.)
Tempered Steam0
5001000150020002500300035004000
0.00 0.05 0.10 0.15Deflection (in.)
Load
(lbs
.)
Delayed Steam

84
3.4.1.1 Strength
The procedure implemented for the ASTM C1018 prism flexure tests allowed for
accurate recording of the flexural behavior of UHPC from initial elastic behavior through
tensile cracking to tensile fiber pullout. The strength-based results from these tests are
presented in Table 3.4.1.1-A. The table provides the averaged results from the prisms in
each set. The first and most important result from these tests is behavior at first cracking
of the UHPC matrix. As previously discussed, the first crack is an indication of the
tensile cracking strength of UHPC. The load, strength, and deflection at first cracking are
all listed in the table. The first crack strength is based on Equation 3.4.1.1-A, which is
referenced in ASTM C1018, provided in ASTM C78, and based on mechanics of
materials principles assuming pure bending. In Equation 3.4.1.1-A , fct,flexure is the flexural
tensile cracking strength, P is the total load applied to the prism, l is the span, b is the
width of the prism, and d is the depth. The variable η equals 1.0 for third point loading
and 1.2 for the loading configuration with a 15 in. span and 3 in. between load points.
This factor accounts for the difference in the bending moment at midspan on the prism
under the differing loading configurations.
2, bdPlf flexurect η= (3.4.1.1-A)
It has been widely observed that the actual tensile cracking strength of concrete, fct, is
overestimated by the tensile cracking strength results of a small-scale flexural test,
fct,flexure. Carpinteri and Chiaia (2002) summarized extensive amounts of previous research
on this topic. They indicated that the overestimation is usually caused by depth and strain

85
gradient effects on the flexural cross-section. Chanvillard and Rigaud (2003) indicate that
the concrete ahead of the crack front tends to microcrack, thus reducing stress
concentrations. They performed research on the UHPC that is the subject of this report.
Their results indicated that the overestimation of the tensile strength is caused by the fiber
reinforcement.
Various correction factors have been suggested to account for this overestimation. The
Association Française de Génie Civil (AFGC) Interim Recommendations for Ultra High
Performance Fibre-Reinforced Concretes (2002) recommends Equation 3.4.1.1-B, which
varies depending on the depth of the cross-section in millimeters, d, as compared to a
reference depth, d0, of 100 mm. Note that this empirical equation is based on
experimental data, but it has been verified for UHPC by Chanvillard and Rigaud (2003).
The first crack tensile strength results as modified by this correction factor are provided
in Table 3.4.1.1-A.
⎟⎟⎟⎟⎟
⎠
⎞
⎜⎜⎜⎜⎜
⎝
⎛
⎟⎟⎠
⎞⎜⎜⎝
⎛+
⎟⎟⎠
⎞⎜⎜⎝
⎛
= 7.0
0
7.0
0,
0.21
0.2
dd
dd
ff flexurectct (3.4.1.1-B)
Table 3.4.1.1-A also includes results related to the average peak load carried by each set
of prisms. The peak load values tended to be between 170 and 200 percent of the
cracking load values. The equivalent flexural strength corresponding with the peak load
is listed. This strength is based on Equation 3.4.1.1-A and substitutes the peak load for

86
the cracking load. This calculation is presented purely for comparative purposes, as this
equivalent flexural strength has no physical meaning. At peak loading, the UHPC prism
is exhibiting extensive cracking, and its midspan neutral axis no longer resides at mid-
depth. Thus, the assumptions of pure bending on a uniform, elastic cross-section, which
are inherent in this equation, are not met.
Finally, this table includes the average effective modulus of elasticity of each set of
prisms. Equation 3.4.1.1-C provides the relationship between the centerline deflection of
a simply-supported beam with two point loads and the cross-sectional and material
properties of the beam. This equation accounts for both the flexural and shear responses
in the beam. In Equation 3.4.1.1-C, ∆cl is the centerline deflection, P is the total load
applied to the prism, L is the span, a is the shear span, E is the modulus of elasticity, and I
is the moment of inertia. In the shear term, A’ is the effective shear area (i.e., 80% of the
cross-sectional area for a prism) and G is the shear modulus. To calculate the shear
modulus, it is assumed that the Poisson’s ratio of UHPC is 0.18. Manipulation of this
equation shows that the modulus of elasticity can be calculated based on the elastic slope
of the load-deflection curve and a constant term representing the load configuration and
beam cross-section.
'2
)43(48
22
GAPaaL
EIPa
cl +−=∆ (3.4.1.1-C)
The load-deflection responses presented previously were analyzed to determine the
average elastic response between 20% and 50% of the load at first cracking. These

87
stiffness values, which are dependent on the test setup, were then used in conjunction
with Equation 3.4.1.1-C to determine the effective modulus of elasticity. The effective
modulus results tend to be higher than those based on the compression tests presented
earlier in this chapter. The exception to this tendency is in the prisms where lower
modulus values were observed with a span to depth ratio of 3.
The lower modulus value in the smaller span to depth ratio prisms is likely due to the
effects of local disturbed regions near the load application points. With this short span
and these close load points, nearly the entire prism could be considered to be locally
disturbed, including deformations that could add to the flexure and shear deformations.
Any additional deformation would result in a lower calculated effective modulus of
elasticity.
Prism flexure testing of five different loading configurations for each curing regime was
intended to identify the benefits and detriments of varying the prism span and cross-
section. From a qualitative standpoint, the easiest completion was of the 9 in. and 12 in.
span tests on the 2 in. x 2 in. cross-section. The behavior of the prisms in these loading
configurations was observed to be more consistent than in other configurations. Also in
these configurations, the moderate elastic load-displacement response decreased the
difficulty encountered with the stiffer and more flexible configurations in the test setups.
Quantitatively, the results from the 9 in., 12 in., and 15 in. spans for the 2 in. x 2 in.
cross-section prisms were most consistent.

88
Also, it must be mentioned that the basic intent of the ASTM C1018 test seems to be to
create a state of pure bending in a concrete prism to allow for quantification of the tensile
properties. As the span to depth ratio of the beam decreases, the proportion of the
behavior that is shear based increases. Figure 3.4.1.1-A shows the ratio of the shear to
flexural deflection of a 2 in. deep prism. This prism was assumed to be loaded at its third-
points, and it has a shear modulus equal to 61% of its elastic modulus based on a
Poisson’s ratio of 0.18. With a span to depth ratio of 3, the shear deflections are 17.1%
of the flexural deflections, thus the assumption of flexural behavior is questionable. As
the span increases toward 12 in., the assumption of flexural behavior becomes much
more reasonable. In the longer spans, the state of stress on the cross-section in the
constant moment region is primarily composed of stresses normal to the face of the cross-
section. However, the same does not hold true for the shorter spans and the more
influential shear forces.
Figure 3.4.1.1-A: Ratio of shear to flexural deflection for a third-point loaded prism
0.00
0.04
0.08
0.12
0.16
0.20
0.24
0.28
4 6 8 10 12 14 16Prism Span (in.)
Rat
io o
f She
ar to
Fle
xura
l D
efle
ctio
n
2 in. Deep PrismThird-Point Loading6 in. span
17.1%
9 in. span7.6% 12 in. span
4.3%

89
Table 3.4.1.1-A: ASTM C1018 strength results
Prism Cross-Section
and Setup* No.
First Crack Deflection
(in.)
First Crack Strength†
(ksi)
Corrected First Crack Strength‡
(ksi)
Modulus of Elasticity§
(ksi)
Peak Load Deflection
(in.)
Peak Load Equivalent Strength†
(ksi) 2x2, 6, 2 3 0.00172 2.70 1.50 7410 0.01979 4.68 3x4, 12, 4 3 0.00325 2.54 1.58 8780 0.04154 3.85 2x2, 9, 3 3 0.00273 2.57 1.43 8670 0.02997 4.60 2x2, 12, 4 4 0.00460 2.42 1.34 8540 0.07315 5.14 St
eam
2x2, 15, 3 4 0.00614 2.31 1.28 8560 0.12498 5.21 2x2, 6, 2 4 0.00153 2.35 1.30 6920 0.02093 4.27 3x4, 12, 4 3 0.00362 2.26 1.41 7220 0.04265 4.08 2x2, 9, 3 3 0.00290 2.31 1.28 7590 0.04284 4.40 2x2, 12, 4 4 0.00527 2.31 1.28 7150 0.06014 4.33
Air
2x2, 15, 3 4 0.00760 2.43 1.35 7350 0.08726 4.39 2x2, 6, 2 4 0.00163 2.84 1.57 7830 0.01913 4.93 3x4, 12, 4 3 0.00296 2.12 1.32 8180 0.03366 4.17 2x2, 9, 3 4 0.00298 2.57 1.43 8050 0.03898 5.01 2x2, 12, 4 4 0.00515 2.64 1.46 8160 0.04982 4.43 Te
mpe
red
Stea
m
2x2, 15, 3 2 0.00730 2.64 1.46 8130 0.07611 4.88 2x2, 6, 2 4 0.00157 2.50 1.39 8140 0.01914 4.64 3x4, 12, 4 3 0.00420 2.57 1.60 8470 0.03615 4.58 2x2, 9, 3 4 0.00270 2.34 1.30 8060 0.03068 4.45 2x2, 12, 4 4 0.00544 2.45 1.36 8100 0.06774 4.98 D
elay
ed
Stea
m
2x2, 15, 3 4 0.00659 2.33 1.29 8140 0.08818 4.73
* Prism depth x width, span length, distance between upper load points † Calculated using Eqn 3.4.1.1-A, which assumes pure bending on a uniform, elastic, uncracked cross-section ‡ Calculated using Eqn 3.4.1.1-B § Calculated using Eqn 3.4.1.1-C, which allows for bending and shear on a uniform, elastic, uncracked cross-section

90
3.4.1.2 Toughness
Within concrete materials characterization testing, toughness is a term that provides some
indication of the concrete’s energy absorption capability. Usually, toughness is quantified
in terms of the area under a load-deflection response curve. Toughness values are specific
to the testing procedure implemented.
The ASTM C1018 test method presents one means of determining the toughness of fiber-
reinforced concrete. The test results are analyzed in terms of the area under the load-
deflection curve up to specific deflection levels. The toughness results are then
normalized by dividing the total area under the curve up to the specified deflection by the
area under the curve up to the deflection at first cracking.
ASTM C1018 defines a set of toughness indices in terms of the behavior that might be
expected from a material that exhibits an elastic-plastic flexural load-deflection response.
(Although not clearly stated in the test method, note that this reference response does not
correspond to the response that would be observed for a material that exhibits elastic-
plastic uniaxial stress-strain behavior.) Table 3.4.1.2-A is reproduced from the appendix
of the test method. The table provides basic information relating to the calculation of
toughness indices and the expected results from various materials. Additional indices can
be created in a similar fashion. Results for I30 and I40 are also presented in the following
discussion.

91
Table 3.4.1.2-A: Definition of Toughness Indices (From ASTM C1018 FIG. X1.1)
Values of Toughness Indices Index
Designation Deflection Criterion*
Plain Concrete
Elastic-Plastic Material†
Observed Range for Fibrous Concrete
I5 3δ 1.0 5.0 1 to 6 I10 5.5δ 1.0 10.0 1 to 12 I20 10.5δ 1.0 20.0 1 to 25
* δ is the deflection at first cracking.† This refers to a material that exhibits an elastic-plastic flexural response.
Table 3.4.1.2-B presents the toughness results for the sets of prismatic flexural tests. The
information layout in the table is similar to Table 3.4.1.1-A. Note that some results are
missing for I40. In addition, some other results for I40 are from fewer than the total
number of prisms listed. This is due to some prisms exhibiting fiber pullout and
subsequent failure prior to reaching 20.5 times the cracking deflection.
Residual strength factors are also presented in the table. These values are calculated by
subtracting one toughness index from a subsequent index then multiplying the result by a
normalizing factor related to the idealized elastic-plastic flexural response. Regardless of
the toughness indices chosen, the residual strength factor for the idealized elastic-plastic
flexural material will equal 100. For example, the residual strength factor, R10,20, equals
10(I20-I10).
The toughness exhibited by the UHPC is quite impressive, regardless of the curing
regime or test configuration. The results all tend to be at the upper end or above the
ASTM C1018 predicted range for toughness of fiber-reinforced concrete. The UHPC also
exhibits residual strength values that tend to increase at least through I30, and these values

92
through this deflection level are all above the 100 reference level for elastic-plastic
flexural behavior. The poorest results, although still quite good, are shown by the 3 in. by
4 in. prisms from each curing regime.

93
Table 3.4.1.2-B: ASTM C1018 toughness results
Toughness Index Residual Strength Index
Prism Cross-Section
and Setup* No.
First Crack Deflection
(in.)
First Crack Strength†
(ksi) I5 I10 I20 I30 I40 R5,10 R10,20 R20,30 R30,40
2x2, 6, 2 3 0.00172 1.50 5.6 12.5 28.3 44.2 62.8 138 158 159 172 3x4, 12, 4 3 0.00325 1.58 5.3 11.8 25.9 40.6 54.4 129 141 147 138 2x2, 9, 3 3 0.00273 1.43 5.6 12.7 28.7 45.3 60.6 143 160 166 153 2x2, 12, 4 4 0.00460 1.34 6.2 14.4 32.8 53.0 77.4 165 183 202 218 St
eam
2x2, 15, 3 4 0.00614 1.28 5.8 13.9 32.0 51.6 72.6 162 180 197 210
2x2, 6, 2 4 0.00153 1.30 5.7 12.9 29.0 46.3 63.0 144 161 173 167 3x4, 12, 4 3 0.00362 1.41 5.7 12.8 28.5 45.0 59.9 142 158 165 148 2x2, 9, 3 3 0.00290 1.28 5.7 13.1 29.5 46.8 64.2 147 165 173 174 2x2, 12, 4 4 0.00527 1.28 5.6 12.8 28.8 48.3 65.5 143 160 179 171
Air
2x2, 15, 3 4 0.00760 1.35 5.8 13.1 28.7 50.1 67.6 147 156 189 186
2x2, 6, 2 4 0.00163 1.57 5.8 12.9 28.2 44.2 65.5 141 153 160 176 3x4, 12, 4 3 0.00296 1.32 6.1 14.1 31.9 53.7 73.0 161 178 134 128 2x2, 9, 3 4 0.00298 1.43 6.0 13.8 31.1 50.8 69.6 155 173 194 188 2x2, 12, 4 4 0.00515 1.46 5.8 13.0 28.0 43.1 – 144 150 151 – Te
mpe
red
Stea
m
2x2, 15, 3 2 0.00730 1.46 6.1 13.9 31.1 47.6 – 156 172 165 –
2x2, 6, 2 4 0.00157 1.39 5.5 12.6 28.5 43.2 63.7 143 159 157 169 3x4, 12, 4 3 0.00420 1.60 5.5 12.4 27.6 31.1 40.7 138 151 111 95 2x2, 9, 3 4 0.00270 1.30 5.8 13.5 30.9 48.9 65.6 153 175 180 167 2x2, 12, 4 4 0.00544 1.36 5.8 13.4 30.3 48.3 61.7 152 169 180 146 D
elay
ed
Stea
m
2x2, 15, 3 4 0.00659 1.29 6.0 14.1 32.2 50.8 74.6 162 181 186 193
* Prism depth x width, span length, distance between upper load points † Corrected tensile cracking strength based on Eqn. 3.4.1.1-B

94
Figure 3.4.1.2-A: ASTM C1018 toughness results
0
20
40
60
80
I5 I10 I20 I30 I40
Toug
hnes
s Val
ue
2x2,6,23x4,12,42x2,9,32x2,12,42x2,15,3
Steam
I5 I10 I20 I30 I40
0
20
40
60
80
I5 I10 I20 I30 I40
Toug
hnes
s Val
ue
2x2,6,23x4,12,42x2,9,32x2,12,42x2,15,3
Air
I5 I10 I20 I30 I40
0
20
40
60
80
I5 I10 I20 I30 I40
Toug
hnes
s Val
ue
2x2,6,23x4,12,42x2,9,32x2,12,42x2,15,3
Tempered Steam
I5 I10 I20 I30 I40
0
20
40
60
80
I5 I10 I20 I30 I40
Toug
hnes
s Val
ue
2x2,6,23x4,12,42x2,9,32x2,12,42x2,15,3
Delayed Steam
I5 I10 I20 I30 I40

95
Figure 3.4.1.2-B: ASTM C1018 residual strength results
0
50
100
150
200
250
R5,10 R10,20 R20,30 R30,40
Resi
dual
Stre
ngth
Val
ue
2x2,6,2 3x4,12,42x2,9,3 2x2,12,42x2,15,3 Steam
R5,10 R10,20 R20,30 R30,40
0
50
100
150
200
250
R5,10 R10,20 R20,30 R30,40
Resi
dual
Stre
ngth
Val
ue
2x2,6,2 3x4,12,42x2,9,3 2x2,12,42x2,15,3 Air
R5,10 R10,20 R20,30 R30,40
0
50
100
150
200
250
R5,10 R10,20 R20,30 R30,40
Resi
dual
Stre
ngth
Val
ue
2x2,6,2 3x4,12,42x2,9,3 2x2,12,42x2,15,3
Tempered Steam
R5,10 R10,20 R20,30 R30,40
0
50
100
150
200
250
R5,10 R10,20 R20,30 R30,40
Resi
dual
Stre
ngth
Val
ue2x2,6,2 3x4,12,42x2,9,3 2x2,12,42x2,15,3
Delayed Steam
R5,10 R10,20 R20,30 R30,40

96
3.4.2 Split Cylinder
The tensile strength of UHPC was also measured through the ASTM C496 Standard Test
Method for Splitting Tensile Strength of Cylindrical Concrete Specimens. This test, often
referred to as the split cylinder test, indirectly measures the tensile strength of concrete by
compressing a cylinder through a line load applied along its length. This test can be
completed in a standard concrete compression testing machine, with only one special
requirement: the hinged bearing that loads the specimen.
This load configuration creates a lateral tensile stress in the cylinder across the vertical
plane of loading. A relatively uniform tensile stress field is created over the middle 75%
of the cylinder’s diameter along the plane of loading, and the maximum tensile stress
occurs at the center of the cylinder. ASTM C496 indicates that the maximum tensile
stress can be calculated based on Equation 3.4.2-A. In this equation, P is the load applied
to the cylinder, l and d are the length and diameter, and fθ is the tensile stress.
ldPf
πθ2
= (3.4.2-A)
The split cylinder test does not determine the uniaxial tensile cracking strength of
concrete. The loading configuration used in this test actually creates a biaxial stress state
inside the cylinder that has been described many times (Timoshenko and Goodier 1951,
Petroski and Ojdrovic 1987). For the purposes of this report, it is sufficient to indicate
that the vertical compressive stress in the center of the cylinder is approximately three
times the lateral tensile stress.

97
This test is normally completed on standard concrete that does not contain fiber
reinforcement. As such, the tensile strength results are normally clear. The cylinder will
fail when its tensile strength is reached; therefore, the peak load carried by the cylinder
can be used to determine the splitting tensile strength through Equation 3.4.2-A. Fiber
reinforced concrete, and in particular UHPC, tends to behave differently. In these
concretes, the initiation of cracking signifies the beginning of a new phase in the
material’s behavior, but does not signify failure of the material. With UHPC in particular,
the load will continue to increase after cracking, and the cracks that form during cracking
will be so small that identification without microscopic investigation may not be possible.
An additional feature was added to the ASTM 496 test because the cracking strength is
the material property of interest. As the UHPC cylinder cracks, the measured length of
the lateral diameter of the cylinder will show a marked increase. A lateral expansion
measuring apparatus was devised and is shown in Figure 3.4.2-A. This spring-loaded
device clamps across the cylinder and measures the lateral expansion of the cylinder from
load initiation through failure. The small lateral compressive force exerted by the
apparatus on the specimen (less than 2 psi) is considered negligible. Two LVDTs located
near the front and back of the cylinder electronically capture the displacements, which are
sent to a data acquisition system along with the load. This lateral expansion measuring
apparatus is similar to a device used by Nanni in work that he completed on fiber
reinforced concrete (1988).

98
Figure 3.4.2-A: Split cylinder tensile test including (a) standard test setup, (b) lateral expansion measuring apparatus, and (c) UHPC cylinder during test
The typical load versus lateral displacement response for a UHPC cylinder is presented in
Figure 3.4.2-B. The curve shown is the average of the results from the two LVDTs. The
lateral deflection behavior is basically linear until the UHPC cracks. At cracking, a
discontinuity occurs in the displacement response while the load level remains relatively
(a) (b)
(c)

99
constant. The total jump in displacement is usually less than 0.001 in. and could be
nonexistent in a specimen that has not undergone a steam-based treatment. After
cracking, a clear change occurs in the slope of the response curve. The load then
continues to increase at a decreasing rate until the peak load is reached.
Figure 3.4.3-B: Typical response for a UHPC cylinder during the ASTM C496 test
Normal UHPC mix design and casting procedures were used for this series of tests.
Twelve 4 in. diameter cylinders were cast for each curing regime. The screeded end of
the cylinder was ground prior to testing, and the length of each cylinder was
approximately 7.9 in. The cylinders were tested in groups of four at three different ages
for each curing regime. The Steam, Air, and Tempered Steam regimes were tested at 5,
14, and 28 days after casting. The Delayed Steam regime was tested at 14, 21, and 28
days after casting. Note that at 14 days, the Delayed Steam specimen results are more
comparable to the Air treated specimens than to the other Delayed Steam treated
specimens because the steam treatment did not occur until days 15 through 17.
0
50
100
150
200
0.000 0.005 0.010 0.015 0.020 0.025Lateral Displacement (in.)
Load
(kip
s)
Cracking
Peak

100
The initial load rate for these tests was set at 500 psi/min of tensile stress according to
Equation 3.4.2-A. The rate was set above the ASTM specified rate of 100 to 200 psi/min
because of three reasons: (1) the higher tensile cracking strength of the UHPC, (2) the
significant displacement that must be traversed before the peak load is reached, and (3)
the reluctance to change the load rate after test initiation. Preliminary testing on UHPC
prior to the initiation of these tests indicated that this increased load rate should not cause
significant changes in material behaviors.
Figure 3.4.2-C presents the average tensile cracking results from the split cylinder tests.
As previously mentioned, cracking is defined to occur when an abrupt or semi-abrupt
change in specimen lateral stiffness occurs. The number of days after casting is indicated
in parentheses after the curing regime’s name. The figure shows both the average stress
and the plus/minus one standard deviation from the average.
All of the groups that underwent a steam-based curing regime exhibited a split cylinder
tensile cracking strength of between 1.6 ksi and 1.8 ksi. The Air treated group exhibited
decidedly lower strength values, along with a clear increase in strength over time. At 5
days, the Air treated group had a tensile cracking strength of 1.0 ksi and by 28 days this
strength had increased to over 1.3 ksi.

101
Figure 3.4.3-C: Average tensile cracking results from the ASTM C496 test
The split cylinder loading configuration causes vertical compressive stress and lateral
tensile stress in the cylinder. This biaxial stress state has a definite effect on the post-
cracking behavior. The vertical compressive stresses that are parallel to any cracks cause
the fiber reinforcement bridging the cracks to carry higher loads prior to pulling out of
the UHPC matrix. For this reason, results derived from the peak load carried by a
cylinder and passed through Equation 3.4.2-A are not accurate general representations of
the tensile strength of UHPC.
1.80
1.68
1.59
0.96
1.27
1.34
1.60
1.66
1.71
1.25
1.65
1.72
0.0 0.5 1.0 1.5 2.0
Steam (5)
Steam (14)
Steam (28)
Air (5)
Air (14)
Air (28)
Tempered Steam (5)
Tempered Steam (14)
Tempered Steam (28)
Delayed Steam (14)
Delayed Steam (21)
Delayed Steam (28)
Tensile Cracking Strength (ksi)

102
However, these peak load results may be useful for comparing fiber pullout behavior
following different curing treatments. These variations in peak load results may be useful
in determining whether curing was properly applied to a UHPC specimen. The average
peak stress carried by these groups of specimens is presented in Figure 3.4.2-D. This
stress is calculated based on both the peak load reached and Equation 3.4.2-A. The results
show that fibers in Air treated cylinders pull out earlier under this stress state, and the
cylinder as a whole can only carry an equivalent stress of around 2.8 ksi. The steam
treatment in the Tempered Steam regime enhances the behavior such that 3.1 ksi of
equivalent stress can be carried. The Steam and Delayed Steam regimes carried the
largest peak loads with average equivalent stresses of around 3.5 ksi.
Frequently, the tensile strength of concrete is discussed as a percentage of the
compressive strength. The results from the split cylinder tests have been normalized by
the 28 day compressive strength of their control cylinders and are presented in Table
3.4.2-A. Only the post-curing treatment results are presented because only the 28 day
compressive strengths are known for these particular batches of UHPC. The cracking
stress tends to be between 5% and 7% of the compressive strength. The equivalent peak
stress carried by the cylinders is higher, with values ranging from 12% to 16%.
The cracking behavior must be monitored for the ASTM C496 test to provide useful
results in terms of tensile cracking strength. The lateral expansion measuring apparatus
(described above) allowed for quantification of this cracking behavior. Monitoring of the
cracking behavior may also be possible in certain instances via audible observations.

103
Table 3.4.2-B presents the first crack parameters for each group of specimens. Aural
monitoring throughout the test allowed the load at first cracking to be estimated in nearly
all of the cylinders that had undergone a steam-based curing treatment. As discussed
previously, the data collection during the test allowed for a specific determination of the
load at first crack. The size of the first crack was also estimated based on the
instantaneous lateral expansion of the cylinder at first cracking. The values presented in
the table are the crack size (measured by the front or back LVDT, whichever displayed a
larger instantaneous increase). These results provide a clear sense of the width of UHPC
tensile stress cracks when they first occur as well as the type of instrumentation that is
required to monitor or capture this behavior.
Figure 3.4.2-D: Average split cylinder peak strength from the ASTM C496 test
3.85
3.49
3.51
2.19
2.81
2.75
3.07
3.13
3.19
2.66
3.65
3.32
0.0 1.0 2.0 3.0 4.0
Steam (5)
Steam (14)
Steam (28)
Air (5)
Air (14)
Air (28)
Tempered Steam (5)
Tempered Steam (14)
Tempered Steam (28)
Delayed Steam (14)
Delayed Steam (21)
Delayed Steam (28)
Split Cylinder Peak Strength (ksi)

104
Table 3.4.2-A: Split tensile strength normalized by 28 day compressive strength
Normalized by 28 day
Compressive Strength
Group
28 day Compression
Strength (ksi)
ASTM C496 Cracking Stress
ASTM C496 Peak Stress
Steam (5) 26.3 0.051 0.148 Steam (14) 26.3 0.064 0.132 Steam (28) 26.3 0.060 0.134
Air (28) 17.5 0.076 0.161 Tempered Steam (5) 24.4 0.066 0.125 Tempered Steam (14) 24.4 0.068 0.127 Tempered Steam (28) 24.4 0.070 0.133 Delayed Steam (21) 24.6 0.067 0.147 Delayed Steam (28) 24.6 0.070 0.133
C
Table 3.4.2-B: First crack parameters determined by instantaneous lateral expansion of cylinder and aural observations
Sound First Crack Size (in.)
Group (Audible/Inaudible) Average Minimum Maximum Steam (5) Audible 0.00083 0.00067 0.00098 Steam (14) Audible 0.00087 0.00050 0.00114 Steam (28) Audible 0.00093 0.00062 0.00154
Air (5) Inaudible 0.00031 0.00015 0.00048 Air (14) Inaudible 0.00036 0.00000 0.00085 Air (28) Inaudible 0.00071 0.00028 0.00109
Tempered Steam (5) Audible 0.00081 0.00064 0.00101 Tempered Steam (14) Audible 0.00070 0.00033 0.00146 Tempered Steam (28) Audible 0.00076 0.00059 0.00110 Delayed Steam (14) Inaudible 0.00058 0.00026 0.00085 Delayed Steam (21) Audible 0.00071 0.00034 0.00093 Delayed Steam (28) Audible 0.00033 0.00003 0.00073
C

105
3.4.3 Mortar Briquette
Another means of concrete tensile strength determination is the briquette tension test.
This test method, described in AASHTO T132, normally involves the direct tension
testing of a small briquette cast from cement mortar. The dogbone-shaped briquette is 3
in. long, 1 in. thick, and has a 1 in.2 cross-section at midlength. Special self-aligning grips
allow for passive gripping of the specimen in the test machine and ensure uniform
loading.
The standard UHPC mix was used, including the steel fibers, in this test program. The
casting of the briquettes is assumed to have caused some preferential alignment of the
fibers because the minimum cross-section of the briquette is only 1 in.2. This preferential
alignment would be expected to be parallel to the walls of the mold; therefore, the fiber
percentage aligned across the anticipated failure plane would be higher than normal.
The normal UHPC mix design and casting procedures were used. Eighteen briquettes
were cast for each of the four curing regimes: three sets of six briquettes that were tested
at 28, 56, and 84 days after casting. Figure 3.4.3-A shows both the grips that were used to
test the briquettes as well as a briquette in the grips.
The testing was completed in a 22 kip capacity MTS testing machine. The tests were
controlled based on the displacement of the crosshead of the testing machine to enable
the observation of the post-peak load-displacement response. AASHTO T132
recommends loading the briquettes at 600 lb/min. This portion of the test method was

106
modified, and the tests were conducted at a displacement rate of 0.001 in./sec. Given the
stiffness of the load carrying apparatus between the crossheads, this displacement rate
equates to approximately 900 lb/min throughout the initial elastic loading portion of each
briquette’s response.
Figure 3.4.3-A: AASHTO T132 setup including (a) test grips and (b) specimen
Figure 3.4.3-B through 3.4.3-E present the results from the eighteen tests for each curing
regime. Six replicates are included in each plot, with the results shifted by 0.05 in. to
allow for clarity. The curing regime and age (in days) at testing are included in the upper
right corner of each plot. These results show that the UHPC behaved linear-elastically up
to first cracking. After cracking, a slight decrease in load usually occurred followed by a
load increase to a level near or above the cracking load. All of the results show a
significant amount of post-cracking load carrying capacity. A more detailed discussion of
(a) (b)

107
these test results that focuses on strength and toughness is included in the following two
sections.
Similar to all batches of UHPC cast for this research program, compression tests on 3-in.
diameter control cylinders were completed. The results from the control cylinders for the
four batches associated with the briquette testing indicate that three of these batches
exhibited strengths below the average values. The Steam treated and Air treated batches
showed compressive strengths 15% below the overall test program average, and the
Delayed Steam treated batch was 8% below the average. These results should be kept in
mind as the results in the remainder of this section are discussed.

108
Figure 3.4.3-B: Load-displacement response for Steam treated briquette tests
0
400
800
1200
1600
2000
0.0 0.1 0.2 0.3 0.4 0.5 0.6 0.7Cross-Head Displacement (in.)
Load
(lbs
)
Steam (56)
0
400
800
1200
1600
2000
0.0 0.1 0.2 0.3 0.4 0.5 0.6 0.7Cross-Head Displacement (in.)
Load
(lbs
)
Steam (28)
0
400
800
1200
1600
2000
0.0 0.1 0.2 0.3 0.4 0.5 0.6 0.7Cross-Head Displacement (in.)
Load
(lbs
)
Steam (84)

109
Figure 3.4.3-C: Load-displacement response for Air treated briquette tests
0
400
800
1200
1600
2000
0.0 0.1 0.2 0.3 0.4 0.5 0.6 0.7Cross-Head Displacement (in.)
Load
(lbs
)
Air (28)
0
400
800
1200
1600
2000
0.0 0.1 0.2 0.3 0.4 0.5 0.6 0.7Cross-Head Displacement (in.)
Load
(lbs
)
Air (56)
0
400
800
1200
1600
2000
0.0 0.1 0.2 0.3 0.4 0.5 0.6 0.7Cross-Head Displacement (in.)
Load
(lbs
)
Air (84)

110
Figure 3.4.3-D: Load-displacement response for Tempered Steam treated briquette tests
0
400
800
1200
1600
2000
0.0 0.1 0.2 0.3 0.4 0.5 0.6 0.7Cross-Head Displacement (in.)
Load
(lbs
)
Tempered Steam (28)
0
400
800
1200
1600
2000
0.0 0.1 0.2 0.3 0.4 0.5 0.6 0.7Cross-Head Displacement (in.)
Load
(lbs
)
Tempered Steam (56)
0
400
800
1200
1600
2000
0.0 0.1 0.2 0.3 0.4 0.5 0.6 0.7Cross-Head Displacement (in.)
Load
(lbs
)
Tempered Steam (84)

111
Figure 3.4.3-E: Load-displacement response for Delayed Steam treated briquette tests
0
400
800
1200
1600
2000
0.0 0.1 0.2 0.3 0.4 0.5 0.6 0.7Cross-Head Displacement (in.)
Load
(lbs
)
Delayed Steam (28)
0
400
800
1200
1600
2000
0.0 0.1 0.2 0.3 0.4 0.5 0.6 0.7Cross-Head Displacement (in.)
Load
(lbs
)
Delayed Steam (56)
0
400
800
1200
1600
2000
0.0 0.1 0.2 0.3 0.4 0.5 0.6Cross-Head Displacement (in.)
Load
(lbs
)
Delayed Steam (84)

112
3.4.3.1 Strength
The tensile cracking strength results are presented in Figure 3.4.3.1-A. First cracking was
defined as a discontinuity in the load-displacement curve caused by an instantaneous
decrease in load. The results from the six replicates in each group have been averaged,
and the average value is shown on the bar in the chart. The standard deviation within the
results for each group is provided by the error bar, which indicates a plus or minus one
standard deviation.
Figure 3.4.3.1-A: Tensile cracking strength of UHPC briquettes
The UHPC that underwent the steam-based curing treatment showed consistent strength
levels from 1 to 3 months after casting. The Steam treated UHPC tensile cracking
strength is approximately 1.2 ksi while the Tempered Steam treated UHPC is 1.4 ksi. The
1.22
1.18
1.29
0.91
0.96
1.11
1.47
1.45
1.43
0.97
0.98
1.08
0.0 0.5 1.0 1.5 2.0
Steam (28)
Steam (56)
Steam (84)
Air (28)
Air (56)
Air (84)
Tempered Steam (28)
Tempered Steam (56)
Tempered Steam (84)
Delayed Steam (28)
Delayed Steam (56)
Delayed Steam (84)
Tensile Cracking Strength (ksi)

113
Delayed Steam treated UHPC shows a lower value of around 1.0 ksi. The Air treated
UHPC shows a steady increase in strength between the first and third months, with the
cracking tensile strength increasing 20% to 1.1 ksi by 3 months. Again, recall that the
compressive strength results for three of these curing regimes were lower than
anticipated, thus the tensile strength results were likely affected as well.
The post-cracking strength results are presented in Figure 3.4.3.1-B, which has the same
format as Figure 3.4.3.1-A. The post-cracking peak strength was defined as the highest
load level reached after the tensile cracking load decreased. These results show
significantly more scatter than the tensile cracking results. Of most importance, these
results show that the post-cracking load-carrying capacity is very similar to the pre-
cracking capacity. The fiber-reinforced nature of the UHPC matrix allows the fibers
bridging a crack to carry a similar load level after cracking as the cement-based matrix
did prior to cracking.
3.4.3.2 Toughness
The toughness exhibited by UHPC after cracking is of utmost importance if the UHPC
will carry tensile forces after cracking. The UHPC needs to maintain load carrying
capacity as multiple cracking occurs and as individual cracks widen. As discussed in
Section 3.4.3.1, one means of measuring toughness is to calculate the area under the load-
displacement curve. Frequently, the area under the curve after cracking is compared with
the pre-cracking area. Using this means of comparison, normal concrete would have a
toughness of nearly zero with no post-cracking load carrying capacity. On the other hand,

114
an elastic-plastic material such as mild steel would exhibit a high post-yield toughness
result.
Figure 3.4.3.1-B: Post-cracking peak strength of UHPC briquettes
To compare toughness results from one test program to another, the means of measuring
the displacement must accurately measure the actual displacement of the concrete in
question. Given the nature of the AASHTO T132 test, measuring only the displacement
of the UHPC briquette is not possible. Thus, the results presented here include the overall
displacement of the loading system. A quantitative comparison of the areas contained
under the load-displacement curves from this test program to other test programs is not
1.35
1.17
1.36
1.01
0.85
1.15
1.35
1.37
1.37
0.81
0.98
0.83
0.0 0.5 1.0 1.5 2.0
Steam (28)
Steam (56)
Steam (84)
Air (28)
Air (56)
Air (84)
Tempered Steam (28)
Tempered Steam (56)
Tempered Steam (84)
Delayed Steam (28)
Delayed Steam (56)
Delayed Steam (84)
Post Cracking Peak Strength (ksi)

115
possible. However, a quantitative comparison within this test program and qualitative
external comparisons are definitely warranted.
Figure 3.4.3.2-A presents the average calculated areas under the load-displacement
curves after cracking for the twelve groups of briquettes tested. The area calculation
includes the entire area under the curve from cracking until the load level dropped to 200
lbs, which is equivalent to a stress of 200 psi on the original minimum cross-section.
These results show a much larger scatter, but the average results are relatively consistent
within each curing regime. The larger area results in the Steam treated regime as
compared with the Tempered Steam treated regime are quite instructive. Recall that the
Tempered Steam briquettes in Figure 3.4.3-D show higher tensile strengths but that the
shape of the post-cracking portion of the curve exhibits a more rapid decrease in load
capacity. The Steam treated regime clearly exhibits the best post-cracking behavior, with
almost twice the area as compared with the Air treated briquettes. The Tempered Steam
and Delayed Steam treated regimes both show approximately 75% of the post-crack area
as compared with the Steam treated regime.
For completeness, Figure 3.4.3.2-B presents the results for the ratio of the post-cracking
area to the pre-cracking area under the load-deflection curve. As previously mentioned,
this ratio is the standard means of measuring the toughness of a semi-brittle material like
fiber reinforced concrete. The area under the curve before cracking is based on the linear
elastic portion of the load-displacement response, thus eliminating the seating behaviors
that occur early in each test. These results seem to indicate that the Tempered Steam

116
briquettes displayed the poorest toughness results while the Delayed Steam and Steam
treated briquettes had the best results. However, these results are an artifact of the higher
cracking strength exhibited by the Tempered Steam briquettes and not by their low post-
cracking toughness.
Figure 3.4.3.2-A: Area under the load-displacement response curve after cracking
The post-cracking behavior of UHPC is primarily dependent on the steel fibers and their
attachment to the UHPC matrix. Clearly, a reduction in the number of fibers in the UHPC
mix must eventually lead to a decrease in the sustained tensile load capacity after
cracking. The curing treatment applied to the UHPC could likely have affected the bond
between the fibers and the matrix.
105
112
101
54
54
56
86
74
78
75
98
73
0 50 100 150
Steam (28)
Steam (56)
Steam (84)
Air (28)
Air (56)
Air (84)
Tempered Steam (28)
Tempered Steam (56)
Tempered Steam (84)
Delayed Steam (28)
Delayed Steam (56)
Delayed Steam (84)
Post-Crack Area (lb-in)

117
Figure 3.4.3.2-B: Ratio of post-cracking to pre-cracking areas under the load-displacement curve
Considering these two points, the failed specimens from the briquette tension tests were
evaluated. A significant portion of the briquettes in 9 of the 12 briquette test groups were
studied to determine the number of fibers that intersected the failure plane. The fibers
extending from each of the failure surfaces in each briquette were counted. The totals are
shown in Table 3.4.3.2-A. These results are then compared with the post-crack area under
the load-displacement curve to determine what portion of the area could be attributed to
each fiber. Obviously, this calculation glosses over many qualifying factors that would
cause different fibers to carry different loads (i.e., fiber orientation relative to crack,
3.77
4.36
3.40
3.54
3.13
2.41
2.08
1.97
2.18
4.33
5.53
3.60
0.0 2.0 4.0 6.0 8.0
Steam (28)
Steam (56)
Steam (84)
Air (28)
Air (56)
Air (84)
Tempered Steam (28)
Tempered Steam (56)
Tempered Steam (84)
Delayed Steam (28)
Delayed Steam (56)
Delayed Steam (84)
Ratio of Areas Under Post- to Pre-Cracking Load-Disp. Curves

118
fibers extension on either side of crack). However, this calculation is instructive in
providing some results related to the effect of curing and fiber percentages.
Aside from the Delayed Steam regime, these results indicate that the curing treatment
seems to affect the ability of fibers to bond to the UHPC matrix. All of these groups
contained similar numbers of fibers crossing the failure plane, but show three distinct
levels of post-crack area per fiber. The Steam treated regime exhibits over twice the
toughness as the Air treated regime on a per fiber basis. Additionally, the Delayed Steam
treatment results show that these briquettes had distinctly fewer fibers crossing the failure
plane. Although this result probably could not explain the lower pre-cracking tensile
strength of these specimens, it definitely could explain the lower than expected post-
cracking peak strength.
Table 3.4.3.2-A: Fiber influence on post-cracking behavior
Fibers Crossing Failure Plane
Post-Crack Area per Fiber (lb-in/fiber)
Group No.
Samples AverageStandard Deviation Average
Standard Deviation
Steam (56) 6 337 47 0.34 0.13 Steam (84) 5 276 46 0.35 0.10
Air (28) 5 370 45 0.15 0.03 Air (56) 6 356 42 0.15 0.04 Air (84) 6 329 77 0.17 0.03
Tempered Steam (56) 3 384 30 0.21 0.03 Tempered Steam (84) 6 321 35 0.25 0.08 Delayed Steam (56) 6 179 63 0.57 0.16 Delayed Steam (84) 6 149 19 0.48 0.12
C

119
3.4.4 Direct Tension
The fourth tension test used to quantify the material behaviors of UHPC was a direct
tension test. Unlike the flexural or split cylinder tests, a direct tension test applies a
uniaxial tensile stress onto the concrete and monitors tensile behaviors as tensile strains
are increased. In this test program, 4-in. diameter concrete cylinders were subjected to a
uniaxial tensile load applied through the flat end surfaces of each cylinder.
Direct tension tests are rarely performed on concrete due to the difficulties inherent in
this test method. Among other things, direct tension tests generally require complicated
test setups because of the tensile gripping of the concrete and the custom equipment
required for the loading and data collection. However, many researchers have
investigated this topic and have attempted to develop reliable and repeatable means of
testing the tensile stress-strain properties of concrete (Boulay and Colson 1981, Boulay et
al. 2004, V. Li 1997, V. Li et al. 1996, Z. Li et al. 1993, Z. Li et al. 1998, Lim et al. 1997,
Morris and Garrett 1981, Phillips and Zhang 1993, RILEM TC 162-TDF 2001, Rossi
1997, Saito and Imai 1983, USBR 4914-92, Wang et al. 1990, J. Zhang et al. 2000,
Zheng et al. 2001). The direct tension test setup and procedures used in this research
program are an agglomeration of these testing techniques and rely most heavily on USBR
4914 Procedure for Direct Tensile Strength, Static Modulus of Elasticity, and Poisson’s
Ratio of Cylindrical Concrete Specimens in Tension and RILEM TC 162-TDF Uniaxial
Tension Test for Steel Fibre Reinforced Concrete.

120
Concrete cylinders that had a 4-in. diameter and an 8-in. length were cast for the direct
tension tests. These cylinders were cast following the normal casting and curing
procedures detailed in Section 3.2. Six cylinders were prepared for each curing regime.
Note that no special attention was given toward achieving the proper distribution and
orientation of the fiber reinforcement within the cylinder, thus it is expected that the
fibers were not necessarily randomly distributed and oriented within the cylinder. This
topic will be discussed in further detail later in this section. The direct tension tests were
completed between 2 and 4 months after casting. Finally, these cylinders were cast from
the same four batches of UHPC as the mortar briquettes discussed in Section 3.4.3. To
reiterate the discussion presented in this section, three of these four batches of cylinders
exhibited somewhat low compressive strengths, which indicates that the tensile behaviors
could be diminished as well.
Two loading configurations were used in this test program, each for half of the cylinders
from each curing regime. In the first configuration, the cylinders were tested as cast. In
the second configuration, the cylinders were circumferentially notched to create a plane
of reduced cross-sectional area and thus higher stresses per applied load. The notch was
created by milling a parabolic-shaped groove into the surface of the cylinder. This groove
was 0.25 in. deep, thus resulting in a reduced cylinder diameter of 3.5 in. The total height
of the groove was 0.5 in. Figure 3.4.4-A(a) shows a notched cylinder while Figure 3.4.4-
A(b) shows an unnotched cylinder ready for testing.

121
Figure 3.4.4-A: (a) Notched cylinder and (b) testing of an unnotched cylinder
These tests were completed in a 100-kip capacity MTS testing machine. The axial
displacement rate of a portion of the cylinder was used as the control signal. This
displacement rate was captured through three LVDTs mounted on a testing apparatus
similar to the one that was discussed in Section 3.3.2 and shown in Figure 3.4.4-A(b).
The signal from these LVDTs was electronically averaged and then was sent to the MTS
controller. The unnotched cylinders used a 4 in. gage length centered on the specimen,
and the notched cylinders used a 1.5 in. gage length centered over the notch. All cylinders
were tested with a displacement rate of approximately 0.0002 in./min., which is the rate
recommended in the RILEM test procedure.

122
Prior to testing, the cylinders had their ends ground and checked for planeness. The
testing machine heads and the ends of the specimen were then lightly sandblasted. A
high-strength, high-modulus, rapid setting epoxy was then applied to the testing machine
heads as the cylinder was placed in the machine. A compressive load of approximately
5000 lbs. was then applied to the specimen until the epoxy had cured. Note that the epoxy
required at least 8 hours of cure time; thus, testing was completed on a daily cycle.
The test setup and procedures discussed above were implemented in order to capture the
full tensile stress-strain behavior of UHPC. Unfortunately, no behaviors after initial
tensile cracking could be reliably observed and monitored. The MTS controller
temporarily lost control of the cylinder during the brittle initiation of the first tensile
crack. When control was regained, the cylinder had undergone some tensile fiber pullout
across the crack, and the critical portion of the UHPC tensile behavior just after tensile
cracking had been bypassed. This uncontrolled behavior was probably caused by a lack
of sensitivity of the MTS control system due to its larger then necessary load capacity.
However, accurate post-cracking results could probably not have been obtained anyway,
because failure surfaces have indicated that the fiber distribution and orientation within
the cylinders was not sufficiently random.
For these reasons, the test results presented in this section focus only on the tensile
cracking strength and on the modulus of elasticity of the UHPC. Table 3.4.4-A provides
the results from the six cylinders in each curing regime. The table indicates which
specimens were notched, the location of the first tensile crack, the tensile cracking

123
strength, and the modulus of elasticity. The modulus of elasticity was determined based
on the displacement readings across the 4 in. gage length between the applied stresses of
360 psi compressive and 360 psi tensile. Recall that the cylinders were initially
compressed as the epoxy cured; thus, continuous data were recorded during the test over
this transition from compressive to tensile behavior.
The table indicates that eleven of the twelve notched specimens failed within the notch.
Aside from possible local stress concentrations caused by the notch, it is anticipated that
these results accurately represent the tensile cracking strength of the UHPC. For the
purposes of this research, local stress concentration effects are ignored, and these tensile
cracking strengths are viewed to be accurate representations of pure tensile behavior.
Only half of the unnotched cylinders failed remotely from the bearings; therefore, the
unnotched specimen results are more limited. It is expected that the specimens that failed
within 1 in. of the bearing had their strengths reduced by local bearing effects.
The limited total data set available from the direct tension tests precludes the presentation
of definitive conclusions. However, the results do provide a range in which tensile
cracking of UHPC can be anticipated. For Steam treated UHPC, tensile cracking likely
occurs between 1.4 ksi and 1.6 ksi. For Air treated UHPC, the range is from 0.8 ksi to 1.0
ksi. For Tempered Steam specimens, the range was from 1.1 ksi to 1.3 ksi. And for
Delayed Steam specimens, the range was from 1.3 ksi to 1.6 ksi.

124
Table 3.4.4-A: Direct tension test results
Specimen Notched Cracking Location
Cracking Strength
Modulus of Elasticity
(ksi) (ksi) Steam
M1D00 Yes Notch 1.56 N/A M1D01 Yes Notch 1.50 N/A M1D02 Yes Notch 1.75 N/A M1D10 No Within 1 in. of bearing 1.51 † 7525 M1D11 No Center of specimen 1.44 7329 M1D12 No Within 1 in. of bearing 1.36 † 7736
Air M2D00 Yes Notch 0.82 N/A M2D01 Yes Notch 0.86 ‡ N/A M2D02 Yes Notch 0.94 ‡ N/A M2D10 No Within 1 in. of bearing 0.92 † 6723 M2D11 No Within 1 in. of bearing 0.98 † 6946 M2D12 No Within 1 in. of bearing 1.01 † 6942
Tempered Steam M3D00 Yes Notch 1.05 N/A M3D01 Yes Notch 1.29 N/A M3D02 Yes Notch 1.09 N/A M3D10 No Center of specimen 1.13 7558 M3D11 No Center of specimen 1.36 7674 M3D12 No Center of specimen 1.39 7423
Delayed Steam M4D00 Yes Unnotched section 1.19 * N/A M4D01 Yes Notch 1.67 N/A M4D02 Yes Notch 1.58 N/A M4D10 No Within 1 in. of bearing 0.51 † 7383 M4D11 No Center of specimen 1.32 † 7821 M4D12 No Center of specimen 1.51 7460
† Cracking strength results may have been influenced by crack location. ‡ Minimum cracking strength value due to difficulty with test apparatus leading to poor data resolution. * Cracking did not occur in the notch that had a peak tensile stress of 1.55 ksi.
The modulus of elasticity results are not affected by cracking or other localized
behaviors. For this reason, three results are available for each curing regime. The Steam

125
treated UHPC modulus of elasticity averaged 7500 ksi. The Air treated UHPC averaged
6900 ksi. The Tempered Steam and the Delayed Steam treated UHPC specimens both
averaged 7550 ksi. Note that aside from the Steam treated results, these results are
somewhat higher than those presented in Section 3.3 that were obtained from purely
compressive testing of cylinders.
Finally, the linearity of the tensile stress-strain response from minimal compressive load
through tensile cracking was studied. The same stress-strain responses recorded from the
testing of the unnotched cylinders that were used for the modulus of elasticity
determination were also used to determine the nonlinearity of the response as cracking
was approached. Overall, the results indicate that UHPC, regardless of the curing regime,
exhibits very linear behavior up through tensile cracking. The theoretical linear elastic
stress-strain response based on the calculated modulus of elasticity was used to determine
the actual stress deviation (reduction) at any level of tensile strain. The decrease from the
linear elastic predicted level was less than 20 psi for ten of the cylinders and was less
than 30 psi for the remaining two specimens.
3.5 Fracture Testing
Understanding the cracking processes that occur when UHPC is stressed beyond its
tensile strength is of great importance. Experience with UHPC structures has indicated
that individual cracks tend to grow rapidly to a significant length, but that the width of
any such crack is very small. However, it must be stated that this experience is based on

126
structural testing of UHPC members with loading configurations that were not intended
to create and to propagate stable cracks.
A series of tests were completed on UHPC prisms to determine some of the basic
behaviors of individual cracks. These tests focused on loading a prenotched prism in 3-
point bending, with the load being incremented based on the opening at the mouth of the
crack. The tests were loosely based on a portion of ASTM E1820 Standard Test Method
for Measurement of Fracture Toughness.
The prisms and test setup conformed to the ASTM test method for the single edge beam
test discussed in Annex A1 of the specification. The prism had a height of 4 in., a width
of 2 in., and a span of 16 in. The only deviation from the ASTM test method was in the
size and shape of the notch cut into the prism to act as the crack initiation point. In these
tests, the crack was cut into the tension flange to a distance of approximately 1 in. The
crack was cut with a 3/16th in. thick diamond tipped saw blade. The crack’s tip had a
rounded profile and was not sharpened through fatigue cycling or by any other means.
Four prisms were cast for both the Steam and Air treated curing regimes. These prisms
were part of the M1P and M2P batches discussed in Section 3.1. The casting of these
prisms followed normal procedures except that they were cast upside-down from the
orientation in which they would be tested. These prisms were cast in special steel molds
that allowed for partial enclosure of the top of the prism at the ends. Therefore, the only

127
non-molded surface on the finished prism was the center of the bottom or tension flange
in the finished specimen.
These tests were completed in a 22-kip capacity MTS controlled load frame. The tests
were controlled based on the crack mouth opening displacement (CMOD). The CMOD
was measured via a 0.5 in. full range capacity clip gage that was attached to knife edges
epoxied to the bottom flange on either side of the starter notch. The entire test loading
protocol was preprogrammed into the MTS Microprofiler. The testing included an initial
CMOD rate of approximately 0.0005 in./min, as well as a post-cracking rate 2.5 and 5.0
times larger. The protocol included periodic unloadings set to occur at predefined CMOD
values. Unfortunately, for unknown reasons these unloadings frequently did not occur as
planned. Tests were stopped after 0.1 in. of CMOD. Figure 3.5-A shows one of the
prisms undergoing this fracture test.
Figure 3.5-A: Test setup for 4 in. by 2 in. notched prisms loaded on a 16 in. span

128
Two methods were used to monitor the crack extension during the test. The primary
method involved using an optical microscope to view the fracture process zone just ahead
of the tip of the crack. This microscope had a field of view of 0.1 in., which allowed the
crack tip to be located with relative ease. As the test progressed, alcohol was used as a
volatile penetrant to help indicate the extent of cracking. The crack extension
measurements were all taken from the bottom of the prism.
The second method used to monitor crack extension involved a crack propagation
resistance gage. Figure 3.5-B shows one of these gages during a test as a crack is
traversing the grid. The resistance across the gage changes as more of the lines are broken
due to crack extension. This method of crack monitoring was used on two prisms from
each of the Steam and Air treatment curing regimes.
Figure 3.5-B: Resistance foil gage to monitor crack propagation

129
Figures 3.5-C and 3.5-D show photographs of crack propagation on two prisms. Alcohol
was used to help indicate the locations of the cracks in both figures. Some important
findings observed throughout these tests are illustrated in the figures. First, a single crack
formed initially in each prism because the starter notch had sufficient depth. The crack
then extended up through the prism as shown in Figure 3.5-C(a). However, the fibers
binding the initial crack together soon allowed for a redistribution of stresses resulting in
the formation of other cracks that ran parallel to the first crack. Second, the cracks tended
to extend very close to the compression flange. Figure 3.5-C(b) shows a crack extending
to within 0.15 in. of the compression flange.
Figure 3.5-C: Prism M1P00 after (a) 3.4 in. and (b) 3.85 in. of crack extension
The load and crack extension results in terms of the CMOD for each specimen are
presented in Figures 3.5-E through 3.5-L. In each figure, (a) shows the overall response
of the prism with the load versus CMOD behavior plotted with regard to the left y-axis
and the crack extension versus CMOD behavior plotted with regard to the right y-axis. In
each figure, (b) shows the initial behavior and first cracking of the UHPC prisms.

130
Additionally, this plot shows the geometric construction used to determine when first
cracking occurred.
Figure 3.5-D: Prism M2P03 after 3.65 in. of crack extension
The ASTM E1820 specification defines cracking for materials that exhibit both stable
and unstable first cracking. The data collected from these eight prisms indicate stable
cracking behavior occurred with no clear evidence of a pop-in in any specimen. Thus,
first cracking is defined by creating a linear best-fit line to the initial elastic portion of the
load-CMOD response then decreasing the slope of this line by 5%. The intersection of
the new line with the original data is defined as the load and CMOD at first cracking.
Part (b) of the referenced figures shows the required construction and the values at first
cracking. Note that the initial load-CMOD response between 300 and 600 pounds was
used to define the elastic portion of the behavior because it was beyond any initial

131
seating-based nonlinearities and was before the initiation of cracking-based
nonlinearities.
The original intent of these tests had been to determine the fracture toughness, KIc, of
Steam and Air treated UHPC according to ASTM E1820. Unfortunately, the calculations
associated with this specification indicate that the test as performed did not meet the
standards of a qualified and size-independent KIc test.

132
(a.) Overall response including periodic unloadings.
(b.) Initial response including elastic stiffness and 95% of elastic stiffness curves.
Figure 3.5-E: Load-CMOD response for Steam treated prism M1P00
0
500
1000
1500
2000
2500
3000
3500
0.00 0.02 0.04 0.06 0.08Crack Mouth Opening Displacement (in.)
Load
(lbs
.)
0.00.51.01.52.02.53.03.54.0
Crac
k Ex
tens
ion
(in.)
Load - CMODOptical Crack Length
0
200
400
600
800
1000
1200
0.0000 0.0003 0.0006 0.0009 0.0012 0.0015Crack Mouth Opening Displacement (in.)
Load
(lbs
.)

133
(a.) Overall response including periodic unloadings.
(b.) Initial response including elastic stiffness and 95% of elastic stiffness curves.
Figure 3.5-F: Load-CMOD response for Steam treated prism M1P01
0
200
400
600
800
1000
1200
0.0000 0.0003 0.0006 0.0009 0.0012 0.0015Crack Mouth Opening Displacement (in.)
Load
(lbs
.)
0
500
1000
1500
2000
2500
3000
3500
0.00 0.02 0.04 0.06 0.08Crack Mouth Opening Displacement (in.)
Load
(lbs
.)
0.00.51.01.52.02.53.03.54.0
Crac
k Ex
tens
ion
(in.)
Load - CMODOptical Crack Length
Multiple Cracks

134
(a.) Overall response including periodic unloadings and crack length from tension flange.
(b.) Initial response including elastic stiffness and 95% of elastic stiffness curves.
Figure 3.5-G: Load-CMOD response for Steam treated prism M1P02
0
200
400
600
800
1000
1200
0.0000 0.0003 0.0006 0.0009 0.0012 0.0015Crack Mouth Opening Displacement (in.)
Load
(lbs
.)
0
500
1000
1500
2000
2500
3000
3500
0.00 0.02 0.04 0.06 0.08Crack Mouth Opening Displacement (in.)
Load
(lbs
.)
0.00.51.01.52.02.53.03.54.0
Crac
k Ex
tens
ion
(in.)
Load - CMODFoil Gage Crack LengthOptical Crack Length
Multiple Cracks

135
(a.) Overall response including periodic unloadings and crack length from tension flange.
(b.) Initial response including elastic stiffness and 95% of elastic stiffness curves.
Figure 3.5-H: Load-CMOD response for Steam treated prism M1P03
0
500
1000
1500
2000
2500
3000
3500
0.00 0.02 0.04 0.06 0.08Crack Mouth Opening Displacement (in.)
Load
(lbs
.)
0.00.51.01.52.02.53.03.54.0
Crac
k Ex
tens
ion
(in.)
Load - CMODOptical Crack LengthFoil Gage Crack Length
0
200
400
600
800
1000
1200
0.0000 0.0003 0.0006 0.0009 0.0012 0.0015Crack Mouth Opening Displacement (in.)
Load
(lbs
.)

136
(a.) Overall response including periodic unloadings.
(b.) Initial response including elastic stiffness and 95% of elastic stiffness curves.
Figure 3.5-I: Load-CMOD response for Steam treated prism M2P00
0
200
400
600
800
1000
1200
0.0000 0.0003 0.0006 0.0009 0.0012 0.0015Crack Mouth Opening Displacement (in.)
Load
(lbs
.)
0
500
1000
1500
2000
2500
3000
3500
0.00 0.02 0.04 0.06 0.08Crack Mouth Opening Displacement (in.)
Load
(lbs
.)
0.00.51.01.52.02.53.03.54.0
Crac
k Ex
tens
ion
(in.)Load - CMOD
Optical Crack LengthMultiple Cracks

137
(a.) Overall response including periodic unloadings.
(b.) Initial response including elastic stiffness and 95% of elastic stiffness curves.
Figure 3.5-J: Load-CMOD response for Steam treated prism M2P01
0
200
400
600
800
1000
1200
0.0000 0.0003 0.0006 0.0009 0.0012 0.0015Crack Mouth Opening Displacement (in.)
Load
(lbs
.)
0
500
1000
1500
2000
2500
3000
3500
0.00 0.02 0.04 0.06 0.08Crack Mouth Opening Displacement (in.)
Load
(lbs
.)
0.00.51.01.52.02.53.03.54.0
Crac
k Ex
tens
ion
(in.)Load - CMOD
Optical Crack LengthMultiple Cracks

138
(a.) Overall response including periodic unloadings and crack length from tension flange.
(b.) Initial response including elastic stiffness and 95% of elastic stiffness curves.
Figure 3.5-K: Load-CMOD response for Steam treated prism M2P02
0
200
400
600
800
1000
1200
0.0000 0.0003 0.0006 0.0009 0.0012 0.0015Crack Mouth Opening Displacement (in.)
Load
(lbs
.)
0
500
1000
1500
2000
2500
3000
3500
0.00 0.02 0.04 0.06 0.08Crack Mouth Opening Displacement (in.)
Load
(lbs
.)
0.00.51.01.52.02.53.03.54.0
Crac
k Ex
tens
ion
(in.)
Load - CMODOptical Crack LengthFoil Gage Crack Length
Multiple Cracks

139
(a.) Overall response including periodic unloadings and crack length from tension flange.
(b.) Initial response including elastic stiffness and 95% of elastic stiffness curves.
Figure 3.5-L: Load-CMOD response for Steam treated prism M2P03
0
200
400
600
800
1000
1200
0.0000 0.0003 0.0006 0.0009 0.0012 0.0015Crack Mouth Opening Displacement (in.)
Load
(lbs
.)
0
500
1000
1500
2000
2500
3000
3500
0.00 0.02 0.04 0.06 0.08Crack Mouth Opening Displacement (in.)
Load
(lbs
.)
0.00.51.01.52.02.53.03.54.0
Crac
k Ex
tens
ion
(in.)
Load - CMODFoil Gage Crack LengthOptical Crack Length
Multiple Cracks

140
3.6 Penetration Resistance Testing
Penetration resistance testing was completed on early age UHPC to determine the times
of initial and final setting. The testing was completed nominally in accordance with the
AASHTO T197 standard test method. The primary difference between the T197 test
procedure and the one undertaken was that the UHPC was used as cast and was not
sieved to obtain a mortar sample. The lack of coarse aggregate and the ease with which a
penetration probe could be inserted into fresh UHPC allowed for this change in test
procedure.
The T197 penetration resistance test is performed by forcing a flat-headed probe into a
sample of fresh concrete. The surface area of the probe and the force required to insert it
are used to determine the penetration resistance in psi. Initial setting is defined as when
the concrete reaches a penetration resistance of 500 psi. Final setting is defined as when
the concrete reaches a penetration resistance of 4000 psi. The probe sizes range from 1
in.2 down to 0.025 in.2. Preliminary testing indicated that the smallest probe could be
used to provide consistent results in both the initial and final setting ranges. Additionally,
the use of a single probe size eliminates one source of error within the results. For these
reasons, the smallest probe was used exclusively in this study.
The penetration testing was performed in conjunction with the compression stress-strain
response testing described in Section 3.3.2. The requirements of these test along with the
delayed set times inherent in UHPC made the collection of penetration resistance data
troublesome. In general, UHPC tends to exhibit virtually no setting for at least 12 hours.

141
Sometime thereafter, the concrete will begin to set and will then quickly reach both initial
and final set. This timetable led to the collection of partial penetration resistance results
from four different batches of concrete.
Table 3.6-A provides the penetration resistance results. The table indicates the batch from
which the penetration resistance specimens came and the subsequent curing action which
was applied to all other specimens in that batch. However, it must be reiterated that no
curing actions were performed on any of the penetration resistance specimens. These
results show that the initial set for this particular UHPC mix design, cast and maintained
under laboratory conditions, occurred around 15 hours. The final set occurred a few hours
later at approximately 17 hours after casting.
Table 3.6-A: Penetration resistance results
Initial Set Final Set Subsequent Curing Regime
Batch Name (hours) (hours)
Steam N1A 15.25 18 to 20 Air N2A less than 14.5 16
Tempered Steam N3A less than 15 15.75 Delayed Steam N4A between 9.5 and 17.5 between 9.5 and 17.5
3.7 Shrinkage Testing
3.7.1 Long-term Shrinkage Testing
Long-term shrinkage testing of the unrestrained, hardened UHPC was completed
according to ASTM C157. Three prisms, 3-in. by 3-in. by 11-in., were cast for each
curing regime. Gage studs were cast into the end of each prism so that the length change

142
could be measured according to ASTM C490. After casting, the prisms were kept in a
laboratory environment until demolding, which occurred at approximately 22.5 hours.
Table 3.7.1-A shows the demolding time for each curing regime.
Table 3.7.1-A: Long-term shrinkage
Curing Regime Premix Age at
Casting Demolding
Time Ultimate
Shrinkage (days) (hours) (microstrain)
Steam 105 22.5 766 Air 55 22 555
Tempered Steam 50 22 620 Delayed Steam 47 23 657
Each prism had its initial length reading recorded within 30 minutes after demolding. The
time of this initial reading was set by the demolding time as shown in Table 3.7.1-A and
was not precisely 24 hours as recommend by the specification. The reading also did not
capture some of the early age shrinkage of the UHPC, which will be discussed in the
following section. All prisms were stored and measured in a temperature and humidity
controlled room per the specification except for the duration of any steam-based
treatment.
Measurements of the changes in length were recorded on a daily, then weekly, then
monthly basis for 1 year. A special emphasis was placed on recording a measurement
both before and after any curing treatment was applied to any prism. Figure 3.7.1-A
shows the results of these tests up to 250 days after demolding. After that time, very little
change was observed in the recorded values.

143
Figure 3.7.1-A: Long-term shrinkage results
Figure 3.7.1-A also provides best-fit approximations of the shrinkage behavior. The
approximating equation, Equation 3.7.1-A (shown below), is a modification of the
equation recommended in ACI 209R-92 wherein it is recommended that ‘A’ equal 35. In
the research, st is the shrinkage at a given time, t is the time in days, sult is the ultimate
shrinkage that the concrete will undergo, and A is a variable defining the shape of the
curve.
ultt stA
ts+
= (3.7.1-A)
The figure shows that the prisms that underwent Steam or Delayed Steam treatment
exhibited no discernible post-treatment shrinkage. This result corroborates Acker’s
(2004) shrinkage behavior theory presented in Chapter 2. In comparison, the Air and
0
200
400
600
800
0 50 100 150 200 250Elapsed Days After Demolding
Shrin
kage
(mic
rost
rain
)
Delayed SteamTempered Steam
Air
Steam

144
Tempered Steam treated prisms show continued shrinkage past 4 months of age. Even so,
all the prisms reached at least 95% of their ultimate shrinkage by 2 months after
demolding. For comparison, the ACI 209R-92 recommended equation indicated that a
normal concrete might have reached 60% of its ultimate shrinkage at this age.
3.7.2 Early Age Shrinkage Testing
The results presented in Section 3.7.1 show that this concrete can exhibit large
unrestrained shrinkage strains regardless of the curing applied. More importantly, the
shrinkage exhibited tends to occur much earlier in the overall behavior than would
normally be expected. For these reasons, the ASTM C157 specification and its
requirement that the concrete needs to have set prior to the recording of the initial
measurement seems ill suited for determining the full unrestrained shrinkage behavior of
this concrete.
To quantify this early age shrinkage behavior, a test was devised to measure the
unrestrained shrinkage of a prism starting at casting. An embedded strain measuring
device (Geokon 4202 Vibrating Wire Strain Gage) was cast into the center of a prism.
This type of gage, shown in Figure 3.7.2-A, measures strain by monitoring the resonant
frequency of a wire tensioned between two end blocks that are embedded in the concrete.
Aside from the gage embedment, the mixing, casting, and demolding procedures were the
same as the ones followed for the long-term shrinkage prisms discussed above. Vibrating
wire gages were embedded into one prism that was receiving the Steam treatment and
into another prism that was receiving the Air treatment. The gages monitored the

145
shrinkage for the first 17 days after casting. After demolding, standard ASTM C490
length change measurements were also recorded for verification purposes.
Figure 3.7.2-A: Embeddable vibrating wire gage
Figure 3.7.2-B shows the unrestrained shrinkage results from these embedded strain
gages. The premix for this particular batch was over 150 days old, thus the initial setting
was slower and the prisms were demolded at 28 hours. The Steam treated prism was
steamed from hours 29 to 77 as shown in the figure, while the Air treated prism was
maintained in a laboratory environment.
The figure shows that this concrete exhibits rapidly occurring, large-value early age
shrinkage. The Steam treated prism reached a total of 850 microstrain, and the air treated
prism was continuing to exhibit some shrinkage beyond the 790 microstrain recorded at
40 days after casting. Of greater interest is the rate at which the shrinkage occurs. Table
3.7.2-A provides shrinkage rates in microstrain per hour that were obtained at discrete
times during the early age of these two prisms. In particular, note that the shrinkage rate
is over 60 microstrain per hour at 1.18 days, which is just after the prisms are demolded.

146
This high rate of shrinkage soon drops off, but in total over 400 microstrain of shrinkage
occurred in the Air treated prism in the 24 hours following the 20-hour mark when
shrinkage started to occur. For reference, concrete usually has a tensile cracking strain of
between 150 and 250 microstrain.
Figure 3.7.2-B: Early age shrinkage
3.8 Creep Testing
3.8.1 Long-Term Creep Testing
The long-term compressive creep testing of the UHPC was conducted according to
ASTM C512. Four cylinders, 4-in. diameter by 8-in. long, were cast for each curing
regime for these tests. Two additional half-height cylinders were cast for each curing
regime to act as loading blocks. All cylinders had their ends ground to within 0.5 degree
of parallel. The testing was completed using hydraulically actuated load frames in a room
that was controlled for temperature and humidity. No attempt was made to retard
moisture gain or loss from the cylinders either prior to or during the test.
0
200
400
600
800
1000
0 2 4 6 8 10 12 14 16Elapsed Days After Casting
Shrin
kage
(mic
rost
rain
)
Steam
Air

147
Table 3.7.2-A: Early age shrinkage rate
Elapsed Time Since Casting
Steam Treated Shrinkage Rate
Air Treated Shrinkage Rate
(days) (microstrain per hour) (microstrain per hour) 0.0 0 0 0.75 0 0 0.95 20 20 1.10 36 36 1.18 64 64 1.3 – * 18 1.5 34 * 3.5 1.7 11 * 3.5 2.0 6.5 * 2.9 2.5 2.8 * 2.4 3.0 1.2 * 0.8 3.5 0.0 0.7 4.5 0.2 1.9 6.0 0.1 1.3 8.0 0.0 0.8 10.0 0.0 0.5
* Prism was undergoing Steam treatment
The four cylinders for each curing regime were instrumented with Whittemore points
prior to being stacked into a load frame. The Whittemore points were attached to each
cylinder at three locations around the circumference with a 6 in. nominal gage length.
Measurement of the points was completed prior to loading, immediately after loading,
and periodically for 1 year. Figure 3.8.1-A shows creep cylinders in the load frame as
well as the method used to measure the Whittemore points.
The creep testing was initiated for each curing regime after the curing treatment was
applied. For the Steam and Tempered Steam cylinders, the creep loading was initiated 4
days after casting. Loading was initiated 21 days after casting for the Delayed Steam
cylinders and 28 days after casting for the Air treated cylinders. The load level applied to

148
each set of cylinders was 11.2 ksi, which is 40% of 28 ksi, the anticipated compressive
strength of a Steam treated cylinder.
Figure 3.8.1-A: (a) Creep cylinders in load frame and (b) measurement of creep
Table 3.8.1-A provides the creep testing results for the four curing regimes. The 28-day
average compressive strength is also shown. Note that in all cases the load applied was in
excess of the ASTM recommended load. The initial elastic strain was mechanically
measured on the cylinders. The final creep strain is the estimated long-term value that the
strain in the cylinders asymptotically approached. Intermediate creep strain values were
calculated by subtracting the long-term shrinkage and the initial elastic strain from the
overall measured strain. A best-fit approximation, discussed below, allowed for the
determination of the final asymptotic value.
Note that the subtraction of the long-term shrinkage from the recorded creep strain
assumes that creep and shrinkage are uncoupled behaviors. However, research has

149
indicated that these behaviors are dependent on one another in UHPC (Acker 2004). In
this research, the shrinkage strain was subtracted from the creep strain for two reasons.
First, some of the measured creep strain was necessarily due to shrinkage. Second, the
overall shrinkage strains were small or nonexistent, thus the total error introduced was
minimal. If the shrinkage strain were not subtracted from the creep strain for the Air and
Tempered Steam treated specimens, the creep coefficients would have been less than
10% higher.
The creep coefficient, Ccu, is defined as the final asymptotic amount of additional creep
strain that occurs over time divided by the initial elastic strain that occurs when load is
first applied. The specific creep, δcu, is defined as the creep coefficient divided by the
elastic modulus of the concrete. For reference, creep coefficients for concrete are
normally in the range of 1.5 to 3.0, and specific creep values normally range from 250 to
1000 microstrain per ksi.
Table 3.8.1-A: Long-term creep results
Curing Regime Control Strength
Stress / Strength
Initial Elastic Strain
Final Creep Strain Ccu δcu
(ksi) (µε) (µε) (µε/ksi)Steam 27.27 0.41 1500 440 0.29 39
Air 16.53 0.67 2057 1600 0.78 146 Tempered Steam 25.65 0.43 1670 1100 0.66 98 Delayed Steam 24.42 0.46 1580 485 0.31 44
C

150
Recall the discussion in Section 2.4.4 regarding the creep and shrinkage of UHPC. The
results presented here correlate well with that discussion in that Steam and Delayed
Steam treated UHPC exhibit extremely low creep coefficients, while the Tempered Steam
and Air treated UHPC exhibits higher creep coefficients. Specifically, note that the
Delayed and Tempered Steam specimens had similar compressive strengths and load
levels, but that the Tempered Steam exhibited more than twice as much creep strain. The
more severe steam treatments should cause more rapid and more complete self-
desiccation of the UHPC, thus leading to less creep of the concrete.
A plot of the creep data acquired during the year of testing is shown in Figure 3.8.1-B.
The creep strain shown is the additional strain observed after the initial loading of the
cylinders. The data presented are the average results from the four cylinders in each
curing regime. The figure also includes best-fit approximations for each dataset. The
best-fit curves are based on Equation 3.8.1-A wherein t is the time in days since load
initiation, εct is the creep strain at that time, and A and B are variables that define the
shape of the curve. This equation is loosely based on a creep equation suggested by
Branson [1977].
BtA
tct 6.0
6.0
+=ε (3.8.1-A)

151
Figure 3.8.1-B: Long-term creep results
3.8.2 Early Age High Stress Creep Testing
A test program was initiated to investigate the dimensional stability of UHPC that was
subjected to compression loading early in its strength gain. This test program was
designed to answer questions related to the delay required prior to stressing a prestressed
UHPC girder. Although the rapid strength gain of UHPC is beneficial with regard to the
stressing of a girder, it is important to know what portion of that strength gain is actually
useable.
Short-term creep tests were conducted on UHPC cylinders that were of moderate
compressive strength. Two strength levels were investigated: 8.5 ksi and 12.5 ksi. Within
one batch of UHPC, 4-in. diameter cylinders were cast for creep tests and 3-in. diameter
cylinders were cast to determine the concurrent compressive strength of the UHPC. The
specimen preparation procedures for the creep cylinders mimicked the procedures that
0200400600800
1000120014001600
0 100 200 300Elapsed Days Under Load
Cree
p (m
icro
stra
in)
Delayed Steam
Tempered Steam
Air
Steam

152
were followed for the ASTM C39 compression tests that were previously discussed,
including sulfur capping of the cylinder ends due to the relatively low compressive
strengths.
The creep testing was completed in a 100 kip capacity MTS testing machine. Each
cylinder rested one end on a flat steel bearing and was loaded through the other end by a
spherical bearing. Each cylinder was loaded at a computer controlled constant load rate of
150 psi/sec until the desired compressive load level was reached. This load level was then
maintained for 30 minutes, after which the load was removed at 150 psi/sec. The
deformation of the cylinder was monitored throughout the test via three LVDTs that were
mounted on two parallel rings attached to the cylinders. This deformation measurement
system was the same as the one used in the elastic modulus testing (previously discussed
in Section 3.3.2). A photograph of the test setup is provided in Figure 3.8.2-A.
Figure 3.8.2-A: Short-term creep test setup

153
The early age creep results are presented in Table 3.8.2-A. The table provides the
cylinder identifier, the compressive test at the time of creep testing based on concurrently
tested 3-in. diameter cylinders, and the stress level maintained during the creep test. The
stress levels tested ranged from 60% of the compressive strength to just over 90%.
Table 3.8.2-A lists the 30 min creep coefficient, Cc-30, for each of the cylinders that was
able to carry the load through the end of the test. This creep coefficient is similar to the
standard creep coefficient, except that here it equals the amount of additional creep strain
that occurred during the 30 minutes divided by the initial elastic strain when the constant
load level was reached. The two cylinders loaded to stress levels above 90% of the
compressive strength both failed and thus no value of Cc-30 is listed.
Table 3.8.2-A: Early age creep results
Cylinder Identifier
Compressive Strength
Applied Stress
Stress / Strength Cc-30
(ksi) (ksi) 8 to 9.5 ksi Compressive Strength
A1 9.5 5.66 0.60 0.42 A2 8.5 6.34 0.75 0.66 A3 9.25 7.79 0.84 0.79 A4 8 7.07 0.88 0.80
12 to 13 ksi Compressive Strength B1 12.5 7.48 0.60 0.32 B2 12.25 8.79 0.72 0.39 B3 12.25 9.47 0.77 0.44 B4 12.25 10.15 0.83 0.52 B5 12.75 10.89 0.85 0.85
Failed Under Load A5 9.5 8.61 0.91 N/A B6 12.25 11.22 0.92 N/A

154
Figures 3.8.2-B and 3.8.2-C show plots of the results of these tests. The observed strain
values have been normalized on the strain when the constant stress level is first reached.
In this way, the effect of stress level on early age creep is clearly visible. At both strength
levels, stressing to above 85% causes twice the creep strain to occur and stressing above
90% caused failure. Even stressing to only 60% caused a significant amount of creep
strain to accumulate in a short time.
Figure 3.8.2-B: Early age creep behavior of 8 ksi to 9.5 ksi UHPC
3.9 Coefficient of Thermal Expansion
The coefficient of thermal expansion of UHPC was measured through the use of the
provisional AASHTO test specification, TP60-00. The test method determines the
coefficient of thermal expansion (CTE) by measuring the length change of a concrete
cylinder in a variable temperature water bath. Three 4-in. diameter UHPC cylinders from
each of the four curing regimes were tested.
0.0
0.5
1.0
1.5
2.0
2.5
-5 0 5 10 15 20 25 30 35Elapsed Time (minutes)
Tota
l Stra
in /
Initi
al L
oade
d St
rain
Stress/Strength0.88, 0.84, 0.75, 0.60

155
Figure 3.8.2-C: Early age creep behavior of 12.5 ksi UHPC
Normally, the degree of water saturation of a concrete will influence its CTE. To
counteract this fact, the test method requires that the concrete needs to be in a saturated
condition prior to testing. In the current testing of UHPC, the saturation of the cylinders
prior to testing was considered to be detrimental to the final results for two reasons. First,
one of the primary variables in the overall test program is the curing condition of the
UHPC at the time of testing. Saturating the UHPC would change the condition of the
UHPC by introducing more water into the matrix, which could then react with
unhydrated cement. Second, because saturation of the UHPC is problematic due to its
low permeability, determining when a specific degree of saturation was reached would be
difficult. Thus, the exterior surfaces of the cylinders, aside from the bearing points of the
supports and LVDT, were sealed with epoxy prior to testing.
0.0
0.5
1.0
1.5
2.0
2.5
-5 0 5 10 15 20 25 30 35Elapsed Time (minutes)
Tota
l Stra
in /
Initi
al L
oade
d St
rain
Stress/Strength0.85, 0.83, 0.77, 0.72, 0.60
Stress/Strength = 0.92

156
The testing of the twelve cylinders was completed after they had undergone their
complete curing treatment. All the cylinders were at least 2 months old. The Air treated
cylinders were the oldest at 4.5 months at the time of testing.
The results from the CTE testing are shown in Table 3.9-A. In general, the CTE of UHPC
is around 15 x 10-6 in./in./°C. This value is somewhat higher than the normally expected
value for concrete of around 10 x 10-6 in./in./°C. However, recall that UHPC contains
both a high cement content and no coarse aggregate. Hydrated Portland cement paste has
been reported to have a CTE of between 11 x 10-6 and 16 x 10-6 in./in./°C, and aggregates
tend to exhibit lower CTE values (Neville 1996).
Table 3.9-A: Coefficient of thermal expansion results
Coefficient of Thermal Expansion
Curing Regime Results No. Average Standard Deviation
(x10-6 in./in./°C) (x10-6 in./in./°C) (x10-6 in./in./°C) Steam 15.3, 15.7, 15.8 3 15.6 0.3
Air 14.4, 14.6, 15.1 3 14.7 0.4 Tempered Steam 15.0, 15.5, 15.8 3 15.4 0.4 Delayed Steam 15.0, 15.2, 15.5 3 15.2 0.3
3.10 Heat of Hydration
The amount of heat that UHPC generates during initial curing is of interest for two
reasons: (1) it can be used as an indicator of other behaviors and (2) it could cause
detrimental behaviors if not accounted for in the design. Time-temperature data were
gathered for 6-in. diameter cylinders during the first few days after casting. This testing
was completed on two UHPC mixes. The first mix was the standard UHPC mix that has

157
been discussed throughout this report. The second mix included a slight modification of
the mix design in that no accelerator was added. Specifically, 1.87 lb/ft3 of Rheocrete
CNI was eliminated from the mix, and an extra 2.00 lb/ft3 of water was added.
The time-temperature results were collected for cylinders in three environments. Figure
3.10-A shows the heat that was generated by cylinders in a normal laboratory
environment. These results indicate that the accelerator can have a significant effect on
set time, but that the overall level of heat generation is not significantly different. Figure
3.10-B shows the heat that was generated by cylinders that were kept in a normal
laboratory environment until setting began, after which the Steam treatment was applied.
Again, the accelerator’s primary impact seems to be in the rate of setting and not in the
peak heat generated. Note that the Steam treatment of the accelerated mix was started
earlier in the setting behavior, thus impacting the comparative level of the peak
temperatures recorded.
Figure 3.10-A: Heat generated in 6-in. diameter cylinders during initial curing
65
70
75
80
85
90
0 20 40 60Elapsed Hours After Mixing
Tem
pera
ture
(o F)
With Accelerator Without Accelerator
Surrounding Air Temperature

158
Figure 3.10-B: Heat generated in 6-in. diameter cylinders from casting through steaming
The difficulty with the previously discussed methods of measuring the heat generated by
the UHPC is that local conditions within a laboratory environment can vary. Air currents
that aid in the dissipation of heat can have a significant impact on final results. To
address this issue, time-temperature data were also collected using a well-insulated
calorimeter. For these tests, each 6-in. diameter cylinder was placed in a Quadrel
iQdrumTM heat signature calorimeter and monitored for 6 days. The results are shown in
Figure 3.10-C. Through the use of the calorimeter the effect of the accelerator becomes
very clear. The accelerator causes a slow temperature rise to occur prior to setting and
caused setting to begin over 1 day earlier. Heat was generated more quickly during
setting, but the peak temperature reached by the cylinder was only 5ºF higher than in the
unaccelerated mix. Note that these relative changes between mix designs are instructive;
however, the actual time-temperature and setting behaviors of any UHPC mix will
depend on many other factors as well (i.e., age of premix, precise environmental
conditions, quantity of accelerator).
6080
100120140160180200220
0 20 40 60 80 100 120 140Elapsed Hours After Mixing
Tem
pera
ture
(o F) Without
AcceleratorWith
Accelerator

159
Figure 3.10-C: Heat signature for 6-in. diameter cylinders in a well insulated calorimeter
3.11 Air Void Analysis
An air void analysis was completed on the UHPC. The modified point-count method of
ASTM C457 was used to determine the air void structure. The variables investigated in
this testing included the effect of the analysis location within individual cast cylinders,
the effect of the time a cylinder was held on a vibrating table after casting, the effect of
mix stiffness, and the effect of using an accelerator in the mix design.
The casting procedure was as follows. The UHPC was mixed as usual, following the
normal mix design and procedure, except that a non-accelerated mix (as described in
Section 3.11) was included. The UHPC was then cast into 4-in. diameter plastic cylinder
molds. The filling of the molds differed from the usual procedure in that some of the
molds were filled without using the vibrating table while others were filled on the
vibrating table and were then held in place on the table for a specific length of time. After
40
60
80
100
120
140
160
180
0 24 48 72 96 120Elapsed Hours After Casting
Tem
pera
ture
(o F)
Without accelerator
With accelerator

160
casting, the cylinders were screeded, covered in plastic, and left in a laboratory
environment to set.
The preparation and testing of the cylinders for the air void structure analysis was as
follows. After setting, the cylinders were cut in half lengthwise. One of the two halves
was then polished using up to an 800-grit sandpaper. Each cylinder’s half was then
divided into a top and bottom section on its flat face. Modified point-count measurements
were then completed on each of these sections. Because this UHPC did not contain any
coarse aggregate, the fibers were counted as coarse aggregate within the data collection
procedure. In total, each air void data collection set covered an area of 10.5 in.2 and
traversed a length of 50 in. while counting 1429 points.
The results from these tests are presented in Table 3.11-A. The results are grouped into
sets for each of the three mixes tested. For reference, the stiff mix has a flow table
reading of 6.5 in. after 20 impacts, and the normal flow mixes both have readings of 7.5
in. after 20 impacts. Each pair of rows shown with a common vibrating table time is the
top and bottom results from the same cylinder half.
Although some slight differences were observed in various groupings of specimens, the
limited sample set makes drawing specific conclusions difficult. In general, the air
content across the range of mixes and specimen locations was approximately 6.5%. The
bottom of the cylinders tended to have slightly more air, likely due to air in the top of the
cylinders being removed by vibration. The cylinders that were held on the vibrating table

161
for 300 seconds after filling also tended to have a decrease in air content. The stiffer mix
tended to have slightly less air than the more flowable mix, and the results of the
accelerated and unaccelerated mixes had no clear differences.

162
Table 3.11-A: Air void analysis results
Vibration
Table Time Location Air Paste Fine Agg. Fiber
Voids Counted
Mean Chord Length
Voids per in.
Specific Surface
Spacing Factor
(seconds) (%) (%) (%) (%) (in.) (in.2/in.3) (in.) Stiff Mix w/ Accelerator (M1J) 0 Top 5.7 47.2 43.3 3.8 249 0.0114 5.0 351 0.017 0 Bottom 6.2 51.2 38.8 3.8 267 0.0115 5.3 347 0.017 Fill + 20 Top 5.5 36.4 55.1 3.0 274 0.0101 5.5 397 0.013 Fill + 20 Bottom 6.9 30.7 59.5 3.0 257 0.0133 5.1 300 0.015 Fill + 60 Top 6.7 43.2 47.0 3.0 289 0.0116 5.8 344 0.015 Fill + 60 Bottom 7.4 42.4 47.2 3.0 287 0.0129 5.7 310 0.016 Fill + 300 Top 6.5 31.5 59.8 2.2 233 0.0140 4.7 286 0.016 Fill + 300 Bottom 4.7 25.1 66.3 3.9 221 0.0106 4.4 377 0.013 Normal Flow Mix w/ Accelerator (M1JxxA) 0 Top 6.2 43.7 48.0 2.1 282 0.0110 5.6 362 0.015 0 Bottom 7.1 44.7 46.9 1.3 302 0.0118 6.0 338 0.015 Fill + 20 Top 6.4 45.8 46.5 1.4 291 0.0109 5.8 366 0.015 Fill + 20 Bottom 7.6 44.0 46.9 1.5 385 0.0099 7.7 404 0.012 Fill + 60 Top 7.8 29.9 60.8 2.0 349 0.0111 7.0 359 0.011 Fill + 60 Bottom 9.2 27.6 61.1 2.1 375 0.0122 7.5 327 0.009 Fill + 300 Top 6.9 42.2 49.3 1.5 234 0.0148 4.7 270 0.019 Fill + 300 Bottom 6.1 41.5 50.9 1.5 218 0.0140 4.4 286 0.019 Normal Flow Mix w/o Accelerator (M1K) 0 Top 6.3 49.0 41.1 3.6 281 0.0112 5.6 357 0.016 0 Bottom 7.3 48.1 41.9 2.7 251 0.0145 5.0 276 0.019 Fill + 20 Top 6.7 43.0 47.9 2.4 244 0.0138 4.9 291 0.018 Fill + 20 Bottom 4.8 39.2 51.8 4.2 207 0.0117 4.1 343 0.017 Fill + 60 Top 7.5 49.5 39.7 3.3 233 0.0161 4.7 249 0.021 Fill + 60 Bottom 7.2 49.6 39.7 3.4 285 0.0126 5.7 316 0.017 Fill + 300 Top 3.2 44.0 50.5 2.2 107 0.0150 2.1 266 0.027 Fill + 300 Bottom 4.6 42.8 50.0 2.6 151 0.0153 3.0 262 0.022

163
3.12 Steel Fiber Dispersion Testing
Dispersion of fibers throughout UHPC is a necessary part of achieving many of its
material properties. In this section, a simple set of tests is described wherein the
dispersion of fiber throughout UHPC cylinders was measured. This batch of UHPC, L03,
exhibited a relatively fluid rheology with a flow table result after 20 impacts of 9.25 in.
The 3-in. diameter cylinders for these tests were cast without the use of a vibrating table,
and some of the cylinders were then impacted on an ASTM C230 flow table. After the
cylinders had gained sufficient strength, they were cut in half along their length. Four 1
in.2 areas were then marked on the flat face of the cylinders. The delineated areas were
located in a line along the length of the cylinder at a 0.5 in. spacing. The fibers contained
within each area were then counted.
Five cylinders were tested according to this procedure. Each of these cylinders underwent
a different number of impacts on the flow table, ranging from 0 to 100. The fiber
counting results are presented in Figure 3.12-A. The results seem to indicate that more
fibers tend to be located toward the bottom of each cylinder. Whether this result is caused
by the impacts administered on the flow table or if it is an artifact of the method used to
pour the UHPC into the cylinder molds is not clear.
Of greater importance is the wide range of fiber concentrations evident throughout the
five cylinders. Figure 3.12-B shows the four areas measured on the cylinder that
underwent 25 impacts. One green dot has been placed on the head of each individual

164
fiber. Clearly, casting technique is very important if equal dispersion of fibers throughout
the mix is desired.
Figure 3.12-A: Fiber dispersion analysis results for cylinders impacted on an ASTM C230 flow table
Figure 3.12-B: Fiber dispersion analysis photographs for a 1 in.2 area in the (a) bottom, (b) lower middle, (c) upper middle, and (d) top of a cast cylinder
3.13 Durability Testing
A series of durability tests were conducted to determine the resistance of UHPC to
various environmental aggressors. These tests included measurement of the chloride ion
(a) (b) (c) (d)
0
50
100
150
200
250
300
350
Bottom Lower Middle Upper Middle Top
Fibe
rs p
er S
quar
e In
ch
0 impacts 25 impacts 50 impacts75 impacts 100 impacts

165
penetrability, scaling and freeze-thaw resistance, abrasion resistance, and alkali-silica
reaction susceptibility. The results are detailed throughout this section.
3.13.1 Rapid Chloride Ion Penetrability Testing
The ability of concrete to resist ingress of chloride ions can result in a significantly more
durable concrete. The ASTM C1202 test for the Electrical Indication of Concrete’s
Ability to Resist Chloride Ion Penetration, frequently referred to as the rapid chloride ion
penetrability test, was conducted on specimens from the four UHPC curing regimes. This
test approximates the resistance that a concrete may exhibit to chloride ion penetration by
measuring the amount of electrical current that passes through a 2-in. thick slice of
concrete over 6 hours. A 60 Volt DC potential is applied across the slice of a 4-in.
diameter cylinder, while a sodium chloride solution is applied to one side of the slice, and
a sodium hydroxide solution is applied to the other side.
Figure 3.13.1-A shows a cylinder slice prior to being tested and while a test is in
progress. The cylinders were cast and cured following normal procedures. For these tests,
each cylinder was cast in a 4-in. diameter mold that was filled to 3 in. After both
demolding and the application of any curing treatment, the cylinders were cut to length,
and both ends of the cylinder were then ground to create a uniform finish. The outside
circumference of each cylinder was sealed with epoxy. The standard amount of steel fiber
reinforcement was included in all cylinders. The short, discontinuous nature of the steel
fibers in the UHPC matrix allowed for this test to be completed without shortening the
circuit or generating significant heat in the ponded fluids.

166
Figure 3.13.1-A: (a) Cylinder and (b) setup for rapid chloride ion penetrability test
Results from these tests are presented in Table 3.13.1-A. Three tests were performed for
each curing regime at 28 days after casting. An additional three tests were performed on
the Air and Tempered Steam treated regimes at 56 days, because these regimes had
exhibited slightly higher results during the first tests.
Aside from the Air treated tests from 28 days, all of the results are in the negligible range
as defined by ASTM C1202. Also, the Air and Tempered Steam treated regimes
exhibited significant reductions in charge passed between 28 and 56 days. Figure 3.13.1-
B shows averaged results for current versus time from three sets of cylinders. For
reference, if 0.003 amps of current were passed through the concrete for the duration of
the test then the total charge passed would be 65 Coulombs.
(a) (b)

167
Table 3.13.1-A: Rapid chloride ion penetrability results
Coulombs Passed
Curing Regime Age (days) No. Average Standard
DeviationChloride Ion Penetrability
Steam 28 3 18 1 Negligible Air 28 2 360 2 Very Low Air 56 3 76 18 Negligible
Tempered Steam 28 3 39 1 Negligible Tempered Steam 56 3 26 4 Negligible Delayed Steam 28 3 18 5 Negligible
Figure 3.13.1-B: Average current passed versus time results for three sets of cylinders
3.13.2 Chloride Penetration
In conjunction with the chloride ion tests described in Section 3.13.1, standard chloride
ion penetration testing was conducted according to the AASHTO T259 specification.
This test, often referred to as the chloride ponding test, entails ponding a 3-percent
0.000
0.005
0.010
0.015
0.020
0.025
0.030
0 60 120 180 240 300 360Minutes Elapsed
Curr
ent (
Am
ps)
Air (28 days)
Air (56 days)Steam (28 days)

168
sodium chloride solution on the surface of the concrete for 90 days. After 90 days, the
level of migration of chloride ions into the concrete is determined.
This test was conducted on three specimens from each of the curing regimes. The
specimens were cast in 4-in. diameter steel cylinder molds that were filled at least 3 in.
full during casting. After both demolding and the application of any curing treatment, the
circumferential surface of each cylinder was coated in epoxy. A section of rubber hose
was then slid over the cast face end of the cylinder and affixed with a hose clamp.
Finally, 28 days after casting, the sodium chloride solution ponded on the cylinder face.
Note that the solution was ponded on the steel mold cast face of the cylinder to replicate
the UHPC surface that would have been achieved in a precast concrete production
facility.
The AASHTO T260 standard test method was used to sample and test the concrete
following the ponding. Samples were taken from each cylinder at depths of 0.5, 1.0, 1.5,
2.0, 2.5, and 3.0 in. from the ponded surface. The samples were obtained by using a drill
press with a ¼ in. masonry bit to drill into the side of the cylinder at the correct depth.
Approximately 15 grams of the pulverized concrete was captured at each specified depth.
The steel fiber shavings were then magnetically removed from each sample of the
concrete powder. Thus, at least 10 grams of powder were available for the chloride ion
testing.

169
The chloride ion testing was conducted according to Procedure A, Section 5.2:
Procedure for Total Chloride Ion Content. The chlorides were unlikely to penetrate any
significant distance into the concrete because of the penetrability of this concrete. This
allowed a large collection of background chloride content samples to be obtained at 2.5
in. and 3.0 in. The average background chloride ion content in pounds per cubic yard of
concrete was determined to be 0.086 with a standard deviation of 0.007.
Figure 3.13.2-A presents the corrected results for these tests. The removal of the
background chloride content from each sample caused some of the samples to seem to
exhibit negative chloride ion contents. The AASHTO specification indicates that these
results should be rounded up to zero. Overall, the chloride ion content in the UHPC for
all of the curing regimes is extremely low. There is some trend toward higher chloride ion
contents near the ponded surface; however, the amount of chlorides that migrated into the
concrete over 90 days is still extremely small.
An additional benefit of this set of tests is that the behavior of the surface of this steel
fiber reinforced UHPC can be qualitatively observed. Figure 3.13.2-B shows a Tempered
Steam treated cylinder just before the 90 days of ponding began and 1 day after it
concluded. This specimen is representative of all twelve tests that were completed
because minor corrosion of steel fibers on and very close to the surface occurred. This
corrosion would probably more aptly be described as surface staining caused by exposed
fibers. There was no indication that the corrosion of the fibers was progressing into the
interior of the UHPC.

170
Figure 3.13.2-A: Chloride ion content results after 90 days of ponding
Figure 3.13.2-B: (a) Cylinder prior to and (b) after 90 days of chloride ponding
3.13.3 Scaling Resistance
The UHPC scaling resistance to deicing chemicals was evaluated through the use of the
ASTM C672 standard test method. In this test method, a solution of calcium chloride is
(a) (b)
-0.05
0.00
0.05
0.10
0.15
0.20
0.25
0.30
0 0.5 1 1.5 2 2.5 3Depth from Ponded Surface (in.)
Add
ed C
hlor
ide
Ion
Cont
ent
(lb/y
d3 of C
oncr
ete) 1 1 1 1
2 2 2 2 3 3 3 3
Steam AirTempered Delayed
Steam Steam

171
ponded on the surface of the concrete. The concrete specimen is then placed in a 0ºF
freezing environment for 18 hours followed by a 73ºF thawing environment for 6 hours.
This cycle is repeated daily, while ensuring periodically that the surface of the specimen
remains covered in the ponding solution.
The ASTM C672 testing included two slabs from each curing regime. Each slab was cast
in a 14 in. by 14 in. square steel mold that was 3 in. deep. The cast surface on the bottom
of the slab became the surface to be ponded after demolding. The curing treatments were
applied to the slabs, and then the dams were epoxied to the ponding surface. The dams
were composed of Steam treated UHPC. A rapid-setting, two-part epoxy was used as the
bonding agent slab and the dam. Figure 3.13.3-A shows one of the slabs prior to the
initiation of testing. The total exposed ponding area on the surface of each slab was
approximately 100 in.2.
The testing of these slabs commenced in two phases. In the first phase, a walk-in freezer
was used to generate the freezing condition, while the standard laboratory environment
generated the thawing environment. The capabilities of this freezer were such that a
consistent temperature could not be maintained. Over the course of 4 months, 70 cycles
were completed. Up through the fiftieth cycle, the temperature in the freezer was usually
below 15ºF. For the next twenty cycles, the temperature was usually in between 18ºF and
26ºF. Due to the inability of this freezer to maintain a sufficiently cold temperature, this
phase of the testing was halted. At the cessation of these tests, no scaling was observed
on the surface of any of the slabs.

172
Figure 3.13.3-A: Scaling slab prior to the initiation of ASTM C672 testing
The second phase of the ASTM C672 testing used an environmental chamber to carefully
control the freezing and thawing portions of each cycle to within +/- 2ºF of the prescribed
values. A total of 145 additional cycles were completed on all eight slabs. Every few
cycles, the slabs were checked for leaking of the dams and for the proper solution level
on the ponded surface. The slabs were also drained, flushed, inspected, and refilled after
cycles 20 and 50. No scaling was observed. After cycle 145, the slabs were drained
through a #30 sieve to capture any small scaling particles that might have been present.
Each slab produced less than 0.5 grams of material, which included small bits of
concrete, pieces of epoxy, and other small detritus that had made its way onto the slabs
over the course of 95 cycles.

173
A final inspection of the ponded surface indicated that no scaling had occurred, thus an
ASTM C672 surface condition rating of 0 was warranted. No differences were observed
between the slabs from any of the four curing regimes. The surfaces did tend to show a
slightly rougher texture after testing, with many more of the small air bubbles visible just
under the ponded surface. Figure 3.13.3-B shows the same slab that was pictured in
Figure 3.13.3-A after having undergone the 70 plus 145 cycles of scaling as described
above.
Figure 3.13.3-B: Scaling slab after ASTM C672 testing
Figure 3.13.3-C shows a byproduct of the ASTM C672 scaling tests. Some of the dams
on top of the slabs did not properly seal with the slab surface. At the joint, the calcium
chloride solution slowly leaked out and ran down the side of the slab. This leak allowed
for an extremely aggressive environment on the vertical surfaces of these slabs. Even

174
after the 70 plus 145 cycles of freezing and thawing in this environment, these vertical
surfaces only showed minor surface deterioration of the type shown in the figure. The
corrosion of the fibers did not seem to penetrate into the slabs, and no scaling, spalling, or
chipping of the concrete surface was apparent.
Figure 3.13.3-C: Surface deterioration of a vertical surface after 70 plus 145 cycles of wetting/drying with a chloride solution in a freezing/thawing environment
3.13.4 Abrasion Resistance
The abrasion resistance of UHPC was measured through the standard test method
described in ASTM C944. This test determines abrasion resistance by measuring the
amount of concrete abraded off of a surface by a rotating cutter in a given time period.
The cutter consists of a series of dressing wheels mounted on a rod that is attached to a
drill press. Figure 3.13.4-A shows a picture of the cutter head bearing on a specimen. The

175
drill press is used to apply a constant force through the cutter into the specimen and to
rotate the cutter at 200 revolutions per minute.
Figure 3.13.4-A: ASTM C944 abrasion test setup
The test procedure specifies that the force exerted by the cutter on the specimen surface
should be 22 lbs. unless the test is conducted on concrete that is particularly abrasion
resistant. Preliminary testing on UHPC indicated that doubling the load to 44 lbs. as
recommended by the standard would provide better results, thus this load level was used
for the testing.
Cylinders with a 6-in. diameter were cast for these tests. The specimens were cast
following normal procedures except that steel molds were used, and the molds were only
filled approximately 3 in. full. Three cylinders were cast for each curing regime.

176
The abrasion resistance of a concrete surface will vary depending on the finish of its
surface. For this reason, the ASTM C944 test was completed on the finishes of three
different concrete surfaces for each of the four curing regimes. The surface finishes
included a steel cast surface, a sandblasted surface, and a ground surface. In the test
program, the 12 cylinders were all tested in the steel cast surface state. The cylinders
were then sandblasted after which they were tested again. Finally, the cylinders were
ground and tested a third time.
The ASTM test procedure indicates that the testing should include abrading the surface
with the rotating cutter for 2 minutes. At the conclusion of the 2 minutes, the amount of
concrete that has been abraded away is reported. In this test program, a modification was
made to the test procedure in which the surface abrasion was repeated so that a total of
between three and five abrasion sequences, with a duration of 2 minutes each, were
applied to each specimen. The number of abrasion sequences varied depending on the
abrasion depth capacity of the cutter and the resistance of the specimen.
Figure 3.13.4-B shows two of the steel cast surface specimens after abrasion testing. The
Air treated cylinder on the left underwent four abrasion sequences that lasted 2 minutes
each. The Steam treated cylinder on the right underwent five abrasion sequences that also
lasted 2 minutes each. The photo clearly shows that the steel cast surface of Steam treated
UHPC is much more abrasion resistant than the Air treated UHPC. The rotating cutter
had difficulty breaking into the surface on the Steam treated cylinder and tended to skid,
with only slight abrasion occurring near the center of rotation.

177
Figure 3.13.4-B: Steel cast surface Air and Steam Treated abrasion specimens after 8 and 10 minutes of abrading, respectively
The results for the ASTM C944 abrasion testing are presented in Figures 3.13.4-C
through 3.13.4-E. Throughout these figures, the results for each curing regime and
surface condition set are the averages of the results for the three cylinders tested. Figure
3.13.4-C presents the ASTM C944 abrasion weight loss as defined in the test
specification. As detailed above, this result only includes the first 2 minutes of abrading
for each specimen. The other two figures present the results from the entire sequence of
tests completed on each specimen. Figure 3.13.4-D presents the average amount of
concrete per abrading over the sequence of abradings. Figure 3.13.4-E presents the least-
squares linear approximation of the weight loss per abrading.
Air Steam

178
Figure 3.13.4-C: ASTM C944 weight loss (grams) per abrading
Figure 3.13.4-D: Average weight loss (grams) per abrading
0.130.30
0.171.00
2.200.73
0.070.30
0.200.100.130.13
0.0 0.5 1.0 1.5 2.0 2.5 3.0
Steam, CastSteam, BlastedSteam, Ground
Air, CastAir, BlastedAir, Ground
Tempered Steam, CastTempered Steam, BlastedTempered Steam, Ground
Delayed Steam, CastDelayed Steam, BlastedDelayed Steam, Ground
ASTM C944 Weight Loss (g) per Abrading
0.090.210.19
2.562.24
1.600.14
0.300.41
0.070.150.19
0.0 0.5 1.0 1.5 2.0 2.5 3.0
Steam, CastSteam, BlastedSteam, Ground
Air, CastAir, BlastedAir, Ground
Tempered Steam, CastTempered Steam, BlastedTempered Steam, Ground
Delayed Steam, CastDelayed Steam, BlastedDelayed Steam, Ground
Average Weight Loss (g) per Abrading

179
Figure 3.13.4-D: Linear best-fit weight loss (grams) per abrading
These results show that a steam-based curing treatment of any kind has a significant
impact on the abrasion resistance of UHPC. In general, the Air treated cylinders lost
approximately an order of magnitude more concrete per abrading than did any of the
other cylinders. Quantitatively, the steam-based treated cylinders usually lost between 0.1
and 0.3 grams per abrading while the Air treated cylinders usually lost between 1 and 3
grams per abrading. Also, as would be expected given its smoother texture, the steel cast
surface performed the best compared with the sandblasted and ground surfaces.
These results can be compared to the results from Horszczaruk (2004) presented in
Section 2.4.5. The testing of 12 ksi to 14.5 ksi steel fiber reinforced concretes produced
results ranging from 0.14 grams to 0.25 grams of mass loss per abrading for the more
0.080.220.18
1.892.10
1.180.14
0.310.34
0.070.140.18
0.0 0.5 1.0 1.5 2.0 2.5 3.0
Steam, CastSteam, BlastedSteam, Ground
Air, CastAir, BlastedAir, Ground
Tempered Steam, CastTempered Steam, BlastedTempered Steam, Ground
Delayed Steam, CastDelayed Steam, BlastedDelayed Steam, Ground
Best-fit Weight Loss (g) per Abrading

180
abrasion resistant concretes. (These results are directly comparable to the UHPC results
presented in 3.13.4-D.) However, these results are based on ASTM C944 with the
standard 22 lb. load, as opposed to the double load used in the present research program.
The UHPC mass loss would have been significantly lower with the decreased abrasive
normal force on the cutter head. Also, note that Horszczaruk’s research indicated that
higher strength concretes exhibited constant abrasion resistance, from test initiation until
conclusion. This seems not to be the case with UHPC, which displayed increased
abrasion resistance prior to the breaching of the smooth cast surface.
3.13.5 Freeze-Thaw Resistance
The resistance of UHPC to freezing and thawing degradation was quantified through the
use of the ASTM C666 (Procedure A) standard test method. In this test, concrete prisms
are subjected to freezing and thawing while submerged in a water bath. The aggressive
environment created in this accelerated durability test helps to determine if the concrete
has a microstructure that can resist the thermal expansion and contraction effects of
water. The concrete could achieve this resistance by either resisting the initial water
penetration or by allowing the thermal expansion of any penetrated water to occur within
a voided microstructure.
The specified lower and upper temperature value targets for the freezing and thawing
environments are 0ºF and 40ºF, respectively. The automated equipment used in this test
program allowed for five cycles of freezing and thawing to be completed per day. In this
test method, each prism is housed in a water-filled container that is only slightly larger

181
than the prism itself. The containers are placed in an environmental chamber that freezes
the prisms and their surrounding water layer using cold air and then thaws the prisms
using water.
The 3 in. by 4 in. by 16 in. UHPC prisms produced for this test were cast following
normal procedures. Three prisms were cast for each curing regime. After casting, any
curing treatments were applied. The freeze/thaw testing began between 5 and 6 weeks
after casting, following 2 days in which the prisms were submerged in 40ºF water to
prepare them for the initial test measurement. In total, 690 cycles of freezing and thawing
were conducted over the course of 9 months. During stoppages in testing, the prisms were
stored in a frozen state in a walk-in freezer. In a few instances, however, machine
malfunctions did allow the prisms to soak in room temperature water for up to a few days
until the malfunction was corrected.
Periodically, the freeze/thaw cycling was halted, and the prisms were measured. The data
collection included mass determination and capture of the fundamental transverse
frequency of each prism. Figure 3.13.5-A is a photograph showing the setup used to
determine the fundamental or resonant frequency. In this test, a transducer records the
vibrations induced in a prism supported on two wires by an instrumented hammer. The
capture and determination of this frequency response was completed according to ASTM
C215.

182
Figure 3.13.5-A: Resonant frequency testing of a freeze/thaw prism
Figure 3.13.5-B presents pictures of an Air treated prism both before and near the end of
testing. The second photograph shows that the prism experienced some deterioration of
fibers that were exposed on the surface. Also, the surface of the prism tended to become
slightly pitted as the cycling progressed. Overall, this pitting was very minor and was
much more prevalent on the Air treated prisms than on any of the steam treated regimes.
Figure 3.13.5-B: Freeze-thaw prism (a) before testing and (b) after 564 cycles
(a) (b)

183
The resonant frequency results from this test program are presented in Figure 3.13.5-C.
These results are the average values from the three prisms that were tested for each
curing regime. Note the clear difference between the initial resonant frequency results
from each curing regime. All prisms in each regime resonated within 16 Hz of one
another, indicating a tight band of results.
Figure 3.13.5-C: Resonant frequency of freeze/thaw prisms
The relative dynamic modulus (RDM) is a value defined in the ASTM C666 test method
as the percent difference in the squares of the frequency at any cycle compared with the
initial frequency before freeze/thaw cycling. This calculation normalizes the results for
ease of comparison to other tests. Figure 3.13.5-D shows these results. In general, this
test method assumes that freeze-thaw cycling will cause the RDM to decrease as the
concrete deteriorates. This RDM decrease would occur due to the resonant frequency
decreasing as the prism develops internal microcracking. The figure shows that the RDM
changed very little in the Tempered Steam and Delayed Steam regimes, decreased
2400
2450
2500
2550
2600
2650
0 100 200 300 400 500 600 700Cycles
Reso
nant
Fre
quen
cy (H
z)
Steam AirTempered Steam Delayed Steam

184
slightly in the Steam treated regime, and increased significantly in the Air treated regime.
Overall, these results confirm that UHPC is very resistant to deterioration caused by
freezing and thawing. However, it is premature to conclude that the Air treated UHPC
exhibits the best freeze-thaw resistance because these RDM values are being influenced
by other factors beyond those intended in the test.
Figure 3.13.5-D: Relative dynamic modulus of elasticity of freeze/thaw prisms
One indicator that an additional unintended behavior was occurring during the freeze-
thaw cycling was the mass change exhibited by the prisms. Figure 3.13.5-E presents the
mass change results. All the regimes exhibited mass increase throughout the testing, with
the Air treated prisms averaging a 0.2% increase by 125 cycles. In a normal freeze-thaw
test, a prism will lose mass as it deteriorates. As mentioned previously, these prisms
showed very little deterioration throughout the test. However, it seems that instead of
95
100
105
110
115
120
125
0 100 200 300 400 500 600 700Cycles
Rela
tive
Dyn
amic
Mod
ulus
(%)
Steam AirTempered Steam Delayed Steam

185
deteriorating during the cycling, these prisms were taking on water and possibly even
hydrating.
Figure 3.13.5-E: Mass change of prisms during freeze-thaw testing
Further experiments were conducted to investigate the increase in RDM in the Air treated
prisms. To determine if the prisms were taking on water and possibly hydrating, an
additional batch of eight prisms were cast. This batch included two prisms that were
treated according to each curing regime. After 28 days, initial freeze-thaw measurements
were completed on the prisms, and then one prism from each curing regime was placed in
a water bath. The other prism from each curing regime was maintained in a laboratory
environment. The prisms were kept under these conditions for 250 days, during which
mass and dynamic modulus of elasticity testing was periodically completed.
The resonant frequency results from these eight prisms are presented in Figure 3.13.5-F.
The RDM results are presented in Figure 3.13.5-G. The legend for each series indicates
-0.10
0.00
0.10
0.20
0.30
0.40
0 100 200 300 400 500 600 700Cycles
Mas
s Cha
nge
(%)
Steam AirTempered Steam Delayed Steam

186
the curing regime and whether the prism was placed in air or water after day 28. These
figures show that for the three steam-based treatment regimes, a steady increase in
frequency occurred throughout the testing in the prisms maintained in the laboratory
environment. The submerged prisms from these same regimes show a more rapid
increase initially followed by the same type of steady increase. The Air treated prisms
show different behavior, with the submerged prisms exhibiting a rapid increase in
frequency response during the first 10 days and both Air treated prisms showing large
overall increases in frequency response. The mass change of these prisms is also
instructive, with the results provided in Figure 3.13.5-H. The masses on all of the prisms
increased throughout the testing, with the Air treated prisms tending to show a larger
increase than their counterparts in the three steam-based treatment regimes.
Figure 3.13.5-F: Resonant frequency of prisms maintained at room temperature in a laboratory environment or in a water bath
2300
2350
2400
2450
2500
2550
2600
2650
0 50 100 150 200 250Time (Days)
Reso
nant
Fre
quen
cy (H
z)
Steam, Air Steam, WaterAir, Air Air, WaterTempered Steam, Air Tempered Steam, WaterDelayed Steam, Air Delayed Steam, Water

187
Figure 3.13.5-G: Relative dynamic modulus of elasticity of prisms maintained at room temperature in a laboratory environment or in a water bath
Figure 3.13.5-H: Mass change of prisms maintained at room temperature in a laboratory environment or in a water bath
95
100
105
110
115
120
125
0 50 100 150 200 250Time (Days)
Rela
tive
Dyn
amic
Mod
ulus
(%)
Steam, Air Steam, WaterAir, Air Air, WaterTempered Steam, Air Tempered Steam, WaterDelayed Steam, Air Delayed Steam, Water
-0.10
0.00
0.10
0.20
0.30
0.40
0 50 100 150 200 250Time (Days)
Mas
s Cha
nge
(%)
Steam, Air Steam, WaterAir, Air Air, WaterTempered Steam, Air Tempered Steam, WaterDelayed Steam, Air Delayed Steam, Water

188
One final experiment was conducted to determine if the prisms were hydrating as they
were gaining water. A set of 3-in. diameter cylinders were cast along with the eight
prisms previously discussed. These cylinders were divided into four groups, paralleling
the conditions that the prisms in the Air and Steam treatment regimes underwent through
the 56th day after casting. An additional two sets of control cylinders were cast for testing
in compression at 28 days.
Table 3.13.5-A: Effect of a water bath on the compressive strength of Steam and Air treated UHPC
Compression Strength
Curing Regime Subsequent Environment
Age (days) No. Average Standard
DeviationSteam N/A 28 4 20.77 0.72 Steam Air 56 5 21.69 0.59 Steam Water Bath 56 5 22.20 1.16
Air N/A 28 4 15.25 0.20 Air Air 56 5 15.64 0.74 Air Water Bath 56 5 17.44 1.18
These compression results show that placing UHPC in a water bath can increase the
compressive strength. As would be expected, the strength increase is greater in the Air
treated UHPC than in the Steam treated UHPC. This greater increase is likely partially
due to the greater permeability of the Air treated UHPC.
These additional tests, which were completed following the initial freeze-thaw testing,
have shown that the procedure followed for the freeze-thaw testing could lead to
unintended water permeation and to additional hydration of the UHPC. This effect has
been shown to be limited in the steam-based treatment curing regimes; however, it can be

189
significant in the Air treated regime. The added hydration creates the possibility of a 15%
increase in the RDM if a prism spends 250 days in a water bath and a 10% increase in
compressive strength if a cylinder is placed in a water bath from day 28 to 56.
3.13.6 Alkali-Silica Reaction
Alkali-silica reaction (ASR) testing was performed in accordance with ASTM C1260.
This accelerated test method allows for the possible detection of the deleterious effects of
ASR far more rapidly that could be achieved using the standard test method, ASTM
C1293. The ASTM C1260 test involves submerging mortar bars in an 80ºC sodium
hydroxide solution for 2 weeks, while periodically measuring the length of the bar. This
series of tests were extended to 4 weeks.
Standard mortar bar molds were used to cast the specimens for this series of tests.
Because this UHPC contains no coarse aggregate, no special preparation of the batch
ingredients was necessary before casting of the bars. Six mortar bars were cast for each
curing condition. The mortar bars had a 1 in. by 1 in. cross-section and were 11 in. long.
The bars had gage studs cast into each end so that ASTM C490 length change
measurements could be recorded throughout the testing. Figure 3.13.6-A shows one of
the mortar bars in the length comparator for measurement.

190
Figure 3.13.6-A: Length comparator for ASR measurements
The standard test method includes specific instructions regarding timing throughout the
test. These instructions include demolding the mortar bars at 24 hours, placing the bars in
an 80ºC water bath for the following 24 hours, then placing the bars in the 80ºC sodium
hydroxide solution bath until test completion. Due to the curing regimes being
investigated in this research program, the timetable recommended in the standard test
method could not be followed. Table 3.13.6-A provides the timetable for each of the five
sets of specimens that were tested.
Submerging the UHPC in the 80ºC bath is somewhat similar to the steam-based curing
regimes wherein the UHPC is placed in a high-heat, high-humidity environment. For this
reason, it is anticipated that the test method described in ASTM C1260 may inadvertently
provide additional curing to the UHPC, especially UHPC that did not undergo a steam-
based curing treatment. Thus, two sets of specimens were tested in the Air treated curing

191
regime. In what is deemed the Air (standard) set in Table 3.13.6-A, the ASR testing was
not initiated until 28 days after casting. In the Air (modified) group, the ASR testing was
initiated immediately after demolding.
Table 3.13.6-A: Timetable for ASTM C1260 specimens
Table 3.13.6-B presents the results from this series of tests. The standard test method
indicates that expansion values less than 0.10% after 14 days of testing are indicative of
innocuous behavior, whereas expansion values over 0.20% are potentially deleterious.
The UHPC expansion results are an order of magnitude below this lower threshold after
14 days and even after 28 days of testing. Figure 3.13.6-B presents the entire set of test
results, including approximately 10 length readings for each curing regime throughout the
28 days of testing.
These results indicate that there should be no concern of ASR problems with the concrete
after a steam-based curing regime is applied. Given the procedures used in this test
method to check for ASR susceptibility, an Air treated UHPC may not be as resistant to
ASR as determined in these tests. However, for ASR to occur in any concrete, free water
Curing Regime Demold Curing Treatment 24 hr Water Bath
NaOH Bath Start
Steam 25 hrs 26th – 74th hr 98th – 122nd hr 122nd hr Air (standard)† 25 hrs 25th hr – 28th day 28th – 29th day 29th day Air (modified)‡ 26 hrs None 26th – 51st hr 51st hr
Tempered Steam 26 hrs 26th – 74th hr 98th – 122nd hr 124th hr Delayed Steam 26 hrs 15th – 17th day 18th – 19th day 19th day
† ASR testing initiated 28 days after casting‡ ASR testing initiated 26 hours after casting

192
must be present. Given the low permeability of UHPC, it seems unlikely that ASR would
be an issue under any curing regime.
Table 3.13.6-B: ASTM C1260 alkali-silica reactivity expansion results
Figure 3.13.6-B: ASTM C1260 alkali-silica reactivity expansion results
3.14 Split Cylinder Tension Testing on Cracked Cylinders
Any material that is affected by external environmental aggressors will necessarily be
more affected by those aggressors if pathways into the interior of the material are present.
14-day Expansion (%) 28-day Expansion (%)
Curing Regime Bars Tested Average Standard
Deviation Average Standard Deviation
Steam 6 +0.013 0.008 +0.009 0.005 Ambient Air† 6 +0.011 0.002 +0.012 0.002 Ambient Air‡ 6 -0.004 0.002 +0.012 0.001
Tempered Steam 6 +0.005 0.002 +0.004 0.003 Delayed Steam 6 +0.001 0.002 +0.002 0.002
† ASR test initiated 28 days after casting ‡ ASR test initiated 1 day after casting
-0.02%
0.00%
0.02%
0.04%
0.06%
0.08%
0.10%
0 5 10 15 20 25 30Elapsed Time Since ASR Test Initiation (days)
Mor
ar B
ar E
xpan
sion
SteamAir (standard)Air (modified)Tempered SteamDelayed Steam

193
The durability of uncracked UHPC has been well covered by the topics discussed in
Section 3.13. However, in some applications cracked UHPC could be subjected to
aggressive environments. The cracks could allow for ingress of contaminants and for a
more rapid deterioration of the UHPC than would be expected based on uncracked
durability results. Recall the research presented in Section 2.4.3 wherein Rapoport et al.
(2002) indicated that the permeability of fiber reinforced normal concrete could be
increased by cracking if the cracks were larger than 0.004 in.
To begin to access the durability of cracked UHPC, a series of tests were conducted to
determine if the ponding of a sodium chloride solution on cracked UHPC would
negatively impact the post-cracking tensile strength. Although these tests are not
standardized, they are a combination of the ASTM C496 split cylinder tensile tests
discussed in Section 3.4.2 and the AASHTO T259 ponding tests discussed in Section
3.13.2. The split cylinder tensile test portion of this program was conducted identically to
the tests discussed earlier in the chapter, including the measurement of lateral
deformation using a pair of LVDTs. The only difference was in the staging of the test
wherein specimens were not necessarily loaded directly to failure (as will be discussed
below). The ponding portion of these tests was identical to the AASHTO T259 tests
described previously.
This series of tests included thirty cylinders with a 4-in. diameter; half of the cylinders
came from batch L1R and half came from L2R. Only the Steam and Air treated cases

194
were investigated. The casting and curing of the specimens followed standard procedures,
and the testing discussed herein was initiated on the 28th day after casting.
The fifteen cylinders from each batch were divided into five groups of three. The first
group of cylinders, the control group, was loaded to failure. The second group was loaded
until cracking had occurred, then unloaded, then reloaded to failure. The third group was
loaded identically to the second group, except that after unloading the cylinders were
stored in a laboratory environment for 90 days. The fourth group was identical to the
third group except that, during the 90 day storage, water was ponded on a cracked end of
the cylinder. Finally, the fifth group was identical to the fourth group, except that a 3%
sodium chloride solution was ponded on a cracked surface.
The cracking of each cylinder was determined by monitoring the lateral deformation
behavior. The two means of determining if a crack had occurred included a clear jump in
the lateral deformation or a definite reduction in stiffness of the load versus lateral
deformation response. Most cylinders exhibited a clear jump in their response, but a few
Air treated cylinders only exhibited the stiffness change. Cylinders from the second
through the fifth groups were unloaded immediately after cracking was observed.
The cracks on these specimens were then identified and measured using an optical
microscope. First, alcohol was used as a volatile penetrant to highlight each crack. A
crack that was made visible using this technique can be seen in Figure 3.14-A. The cracks
were then located using the microscope set at 350x magnification. In general, each end of

195
each cylinder only had one crack. Once located, each crack was traced to find its largest
width. The cracks were then photographed for later analysis of the crack widths. A
photograph of a crack from one of the Steam treated cylinders is shown in Figure 3.14-B.
At this optical magnification and given the resolution of the digital photograph acquired,
the crack shown in this figure is only 2 pixels wide, corresponding to a width of 0.00014
in.
The crack widths on the ponded faces of the twelve ponded cylinders ranged from 0.0007
in. to 0.00047 in. Ten of the twelve cylinders had crack widths between 0.00014 in. and
0.00027 in. Table 3.14-A provides the crack width and split cylinder peak strength results
for the cylinders that were ponded.
Figure 3.14-A: Crack in a split cylinder tensile specimen
Crack

196
Figure 3.14-B: Crack in a split cylinder tensile specimen under 350x magnification
Table 3.14-A: Crack width and split cylinder peak strength results for ponded cylinders
Crack Width (in) Curing Regime
Ponding Solution
Cylinder Number Ponded End Nonponded
End Split Cylinder Peak Strength
(ksi) Steam Water 1 .00020 .00014 3.39 Steam Water 2 .00027 .00014 3.74 Steam Water 3 .00027 .00014 3.10 Steam NaCl 1 .00014 .00020 3.21 Steam NaCl 2 .00014 .00007 3.58 Steam NaCl 3 .00014 .00007 3.89
Air Water 1 .00047 .00020 2.84 Air Water 2 .00027 No Crack 3.19 Air Water 3 .00020 .00014 2.94 Air NaCl 1 .00007 No Crack 3.21 Air NaCl 2 .00020 .00020 3.12 Air NaCl 3 .00020 .00014 3.17
Crack

197
The results of these tests indicate that the ponding of either the water or the sodium
chloride solution had little effect on the peak tensile load carried by the cylinders. Figure
3.14-C provides the post-cracking strength results for all five groups of cylinders for both
curing regimes. The peak load carried shows no clear change, and it is clear that the
ponding of the water or the sodium chloride did not have a serious detrimental effect on
the fibers crossing the crack in each cylinder. However, it must also be noted that the
sodium chloride solution did cause corrosion of fibers exposed on the ground end of the
cylinder, similar to what was observed in the AASHTO T259 and ASTM C672 tests.
Further research into the permeability of cracked UHPC is necessary to determine what
crack size results in a change in the permeability characteristics of the material.
Figure 3.14-C: Split cylinder peak strength results
3.88
3.60
3.64
3.41
3.56
2.82
2.95
3.18
2.99
3.16
0.0 1.0 2.0 3.0 4.0
Load to Failure
Crack, Unload, Fail
Crack, Unload, Wait 90d, Fail
Crack, Unload, Pond Water 90d, Fail
Crack, Unload, Pond NaCl 90d, Fail
Load to Failure
Crack, Unload, Fail
Crack, Unload, Wait 90d, Fail
Crack, Unload, Pond Water 90d, Fail
Crack, Unload, Pond NaCl 90d, Fail
Split Cylinder Peak Strength (ksi)
AirSteam

198
CHAPTER 4
GIRDER MATERIAL PROPERTIES
4.1 Test Specimen Casting, Harvesting, and Preparation
The initial UHPC AASHTO Type II girder test program included a limited amount of
work on material characterization. During the casting of the two girders, which will be
discussed in Chapter 5, a total of three cylinders and three prisms were cast for future
testing. The cylinders had a 3-in. diameter, and the prisms were 2 in. by 2 in. by 11 in.
The limited availability of test specimens increased the importance of each specimen. It
also forced the use of specimens harvested from undamaged areas of the girders after the
girder tests were completed. Both the cores and prisms were cut from the girders. The
method used is described below.
The cast cylinders and prism molds were filled according to standard fiber reinforced
concrete casting methods (these methods are described in Chapter 3). These specimens
were treated to the same curing environment that was used for the girders throughout the
fabrication process. The prisms required no special preparation, while the cylinders had
their ends cut and ground to ensure parallel loading surfaces. This process resulted in 3-
in. diameter cylinders with approximately 5-in. lengths.
After the girder tests were complete, cores and prisms were harvested from Girder 28S.
The web and top flange at the east end of Girder 28S were not damaged during either the
testing of this girder or of its parent girder, Girder 80F. Six cores with 4-in. diameters

199
were obtained by drilling vertically through the top flange of the girder between the
strands. An additional sixteen prisms were cut from the web of the girder. These prisms
had a nominal cross-section of 2 in. by 2 in., were approximately 16 in. long, and had a
long axis that ran parallel to the length of the girder. Finally, five additional cores were
drilled from the web of the girder. These cores had diameters of 2.75 in.
The preparation of the harvested cores included grinding the ends of the core, measuring
the core to ensure parallel ends, and measuring the length and diameter. This method was
similar to the method used within the larger material characterization program. The
preparation of the harvested prisms was somewhat more extensive than would be
expected for cast prisms. Because these prisms were cut from a large block of UHPC
using a diamond saw, the cross-sectional dimensions of the prisms varied and had to be
measured. The cut prisms were measured at eight locations along their lengths on all four
faces of the prism. The average cross-sectional dimensions for each prism were then
calculated.
4.2 UHPC Compression Testing
In total, 14 compression tests were completed on cylinders or cores composed of UHPC
that was associated with the two AASHTO Type II girders. In general, these compression
tests were performed in a 1000 kip capacity Forney test machine. The lone exception was
cylinder “3,” which was tested in a 400 kip capacity Universal testing machine. The
cylinders were all loaded at approximately 35 psi/sec as specified in ASTM C39. The

200
cylinders were all loaded directly to failure. The cores underwent two unloads between
40% and 10% of their projected strengths before being loaded to failure.
Most of the compression specimens were instrumented with resistance-based strain gages
prior to testing. These gages were applied either axially or circumferentially on the
outside of the cylinder. In general, four axial gages and two transverse gages were used
on each specimen to capture the strain response while eliminating errors caused by
uneven loading. Table 4.3 lists the strain gage configuration applied to each specimen.
Gages with a 0.5-in. length were used in all instances except for cylinder “3,” which had
axial gages with a 1-in. length.
Table 4.2-A provides the results from the cylinders and core tests. With the exception of
core CW-5, the results show relatively little scatter. These results indicate that the
compressive strength is 29 ksi, the modulus of elasticity is 7600 ksi, and the strain at peak
strength is 0.0043. In terms of transverse behavior, the Poisson’s ratio is 0.18 with a
transverse modulus of elasticity of 42600 ksi.
These UHPC compression tests also reiterated a number of the qualitative findings
discussed in Chapter 3. Namely, the cores and cylinders tended to exhibit a dramatic
decrease in load carrying capacity soon after the peak load was reached. However, the
specimens remained largely intact throughout the failure. Again, this is due to the
presence of the steel fiber reinforcement.

201
Table 4.2-A: Compression test results
Specimen Strain
Gages † Diameter Length Strength Strain at Strength
Modulus of Elasticity
Transverse Modulus of Elasticity
Poisson’s Ratio
(in.) (in.) (ksi) (ksi) (ksi) Cylinder 1 None 3.0 5.0 27.7 - - - - 2 None 3.0 5.0 28.0 - - - - 3 4A, 2T 3.0 5.1 28.4 0.0043 7340 44500 0.17
Core CW-1 4A, 2T 2.76 5.54 31.0 0.0044 7690 41340 0.19 CW-2 4A, 2T 2.76 5.58 28.9 0.0045 7490 43580 0.17 CW-3 4A, 2T 2.76 5.47 28.0 0.0040 7560 42590 0.18 CW-4 None 2.76 5.55 27.8 - - - - CW-5 4A, 2T 2.76 5.42 32.4 0.0059 6880 40630 0.17 CF-1 4A, 2T 3.98 7.98 28.8 0.0040 7830 41350 0.19 CF-2 4A 3.98 8.06 30.8 0.0045 7370 - - CF-3 4A 3.99 8.04 28.5 0.0042 7480 - - CF-4 4A, 2T 3.99 7.97 28.7 0.0041 7650 40930 0.19 CF-5 4A 3.98 7.91 28.5 0.0043 7620 - - CF-6 4A, 2T 3.98 7.97 30.7 0.0046 7730 43830 0.18
† “A” indicates axial strain gage. “T” indicates transverse gage.

202
4.3 UHPC Flexural Prism Testing
Monotonic flexural prism testing was successfully completed on two cast and six cut
prisms associated with the AASHTO Type II girders. The prisms were all tested in four-
point bending in MTS load frames. As previously mentioned, the prisms all had nominal
cross-section dimensions of approximately 2 in. by 2 in. The span lengths ranged from 6
in. to 12 in. The cast prisms were oriented in the load frame such that the top and bottom
of the prism as cast became the back and front of the prism as tested.
The load rate varied depending on the particular specimen being tested. Some prisms
underwent essentially static loading wherein the load level was increased slowly enough
so that it took minutes before the cracking load was reached. Other prisms were loaded
much more rapidly, at up to 1500 lb/sec.
All prisms were instrumented with at least two resistance-based bonded strain gages on
their top and bottom flanges. The gages had either a 0.5 in. or a 1.0 in. gage length and
were centered on the midspan of the loading. The gages on the bottom flange served the
dual purpose of both indicating the strain level prior to first cracking and recording the
first cracking event.
The results from these tests are presented in Table 4.3-A. The cracking strain listed is the
average strain recorded in the tension flange of the prism at first cracking. The two values
of cracking stress shown are calculated via different, but equally viable, methods. In the
left column, the cracking stress is calculated using the cracking strain and the

203
assumptions of pure bending and the applicability of Hooke’s Law. The right column
calculates the cracking stress based on the load at cracking, the cross-sectional
dimensions, the loading configuration, and the assumption of pure bending. The value
presented in the right column corresponds to the tensile stress that would be calculated
based on the ASTM standard test methods for prism flexure testing. Because these prisms
were all tested on relatively short spans, it is unlikely that either of these methods of
calculating the cracking stress is truly accurate. The cracking strain results show that the
strain at first cracking is approximately 0.0003. The cracking stress results indicate that
an average cracking stress between 2.2 ksi and 2.4 ksi could be expected depending on
the method used to calculate the result.
Because these prism flexure tests were not controlled based on the actual deflection of the
prism, direct comparisons from post-cracking results obtained here cannot be compared
with the results presented in Chapter 3. However, these results are still relevant because
they provide information related to the qualitative post-cracking response of UHPC. The
load versus MTS recorded cross-head deflection response of cast prism “1” is shown in
Figure 4.3-A. The deflection is normalized based on the deflection at first cracking. Note
the continued increase in load after first cracking occurs, until a peak load greater than
twice the cracking load is reached. In general, the shape of this load-deflection response
is very similar to the responses presented in the prism testing section of Chapter 3.

204
Figure 4.3-A: Third-point loading response of a 2 in. by 2 in. prism on a 9 in. span
0
1000
2000
3000
4000
5000
0 2 4 6 8 10 12Normalized Cross-head Deflection
Load
(lbs
)

205
Table 4.3-A: Prism flexure test results
Specimen Width Depth Span Shear SpanInitial Load
Rate Cracking
Strain Cracking Stress† Cracking Stress‡ (in.) (in.) (in.) (in.) (ksi) (ksi) Cast 1 2.0 2.0 9 3 Static .000341 2.59 2.42 2 2.0 2.0 6 2 Static .000300 2.28 2.08
Cut PW-10 1.95 2.06 12 4.5 Static .000264 2.01 1.86 PW-12 2.08 2.07 12 4.5 Static .000255 1.94 1.73 PW-13 1.85 1.90 12 4.5 350 lb/sec .000310 2.36 2.20 PW-08 2.23 1.80 12 4.5 1500 lb/sec .000383 2.91 2.60 PW-14 1.90 1.92 12 4.5 1500 lb/sec .000351 2.67 2.32 PW-15 1.91 2.10 12 4.5 1500 lb/sec .000315 2.39 2.23
† Based on pure bending, Hooke’s Law, the cracking strain, and an assumed modulus of elasticity of 7600 ksi. ‡ Based on loading configuration, cross-sectional dimensions, and load at first cracking assuming pure bending.

206
CHAPTER 5
GIRDER FABRICATION AND EXPERIMENTAL METHODS
The experimental program—from the girder fabrication through the methods used to test
the full-scale UHPC girders—is described in this chapter. The girder fabrication process
is described first, followed by a discussion of the test matrix and the test setup. The
specific details of each girder specimen and the instrumentation plan for each girder are
then presented. Finally, the loading procedure implemented in each test is described.
5.1 Girder Fabrication
Two AASHTO Type II girders were fabricated at Prestress Services of Kentucky, Inc., in
Lexington, Kentucky. Normal AASHTO Type II formwork was used in the casting of the
girders. The 80-ft and the 30-ft girders were cast end-to-end such that the same strands
were stretched through both formworks. These girders did not contain any mild steel
reinforcement.
The concrete premix was delivered to the fabricator in large bags that contained all of the
non-liquid and non-steel concrete constituents. These constituents were then combined
with the water and superplasticizer following the manufacturers recommendations.
During the final stage of mixing, the steel fiber reinforcement was added. The overall
mixing procedure was very similar to the procedures discussed within the presentation of
the UHPC material characterization study results.

207
The fresh UHPC was transported to the formwork in standard ready-mix concrete trucks
and was then poured into the formwork. The 80-ft girder required approximately 8 yd3 of
concrete and was placed in three lifts. The 30-ft girder required approximately 3 yd3 of
concrete and was cast in a similar fashion. The placement of the UHPC into the form for
the shorter girder was completed in approximately 12 minutes. The girders were
externally vibrated on an intermittent basis using a formwork vibrator during the casting.
Immediately after casting, the exposed surface on top of the girder was covered with
plastic.
The curing and steam treatment of the girders was completed during the week after
casting. The girders remained covered and were allowed to cure in the ambient
atmosphere until they had gained sufficient strength to resist the forces imparted by
strand release. After the strands were released, the girders were steam treated for at least
48 hours. The steam treatment was completed through the use of the precast plant’s steam
generation system that is integral to each casting bed. After treatment, the girders were
ready for shipment.
5.2 Test Matrix
As stated in Chapter 1, the objective of this research was to determine the applicability of
UHPC to highway bridge superstructure applications. The test matrix, presented in Table
5.2-A, was developed to address this objective. As shown in the table, four girder
specimens were tested, all with different overall spans and shear spans. The girder
designations shown in the table will be used throughout this text. These designations

208
provide a general indication of the overall span length (in feet) and whether the test
focused on shear or flexural behavior.
Table 5.2-A: Test matrix
Girder Designation
Behavioral Focus Girder Section Overall Span
(ft) Shear Span
(ft) 80F Flexure AASHTO Type II 78.5 36.25 28S Shear AASHTO Type II 28 6.5 24S Shear AASHTO Type II 24 7.5 14S Shear AASHTO Type II 14 6
5.3 Test Setup and Specimen Details
The test specimens detailed in the test matrix above were not originally four separate
specimens. As described in the girder fabrication account, two AASHTO Type II girders
with lengths of 80 and 30 feet were originally cast. The four tests were completed in the
same order that the specimens are listed in Table 5.2-A, thus allowing the broken pieces
from the flexure test to be used in the subsequent two shear tests. The final shear test used
a portion of the 30-ft girder. Figure 5.3-A provides a schematic indicating the origin of
the four girder specimens from the original two girders.

209
Figure 5.3-A: Origin of the four girder specimens, with the south elevation of the tested configuration shown
West End East EndGirder 80F78.5 ft SpanFlexure Test
Girder 28S28 ft SpanShear Test
Girder 24S24 ft SpanShear Test
Girder 14S14 ft SpanShear Test
Rotated West to East
West End East End
West End East End
West End East End
LoadLoad
Load
Load
Load

210
The cross-section of an AASHTO Type II girder is shown in Figure 5.3-B. This
AASHTO shape is 36 in. deep and has a 12 in. wide top and an 18 in. bottom flange. The
girder web is 15 in. deep and is 6 in. thick. These girders each contained twenty-six 0.5-
in. diameter 270 ksi low relaxation prestressing strands. Twenty-four of these strands are
located in the bottom flange, spaced in a grid pattern on 2 in. spacing. Alternating strands
in the bottom flange are debonded for a length of 36 in. from each end of the original two
girders.
Generally, AASHTO Type II girders contain significant amounts of mild steel
reinforcement, primarily in the form or stirrups and possibly temperature and shrinkage
steel. The girders tested in this study contained no mild steel reinforcement. These girders
were designed to carry tensile flexural forces primarily via the prestressing strand and to
carry tensile shear forces via the fiber reinforced concrete matrix.
Two basic loading configurations were used: one for the flexural test and one for the
shear tests. In both configurations, the girder was simply-supported and the load was
applied vertically downward through the top flange of the girder. Hydraulic jacks applied
the loads.
Girder 80F was loaded symmetrically by two point loads each located 3 feet from
midspan. The simple supports, each located 39.25 feet from midspan, were rollers that
allowed for independent movement of the ends of the girder. The bearings were centered

211
9 in. from the ends of the girder. Prior to testing, this girder had a camber of
approximately 2.5 in. at midspan.
Figure 5.3-B: AASHTO Type II cross-section and strand pattern
2 in
2 in
2 in
2 in
2 in2 in2 in2 in
2 in
2 in
T4N4
T3N4
T4N3
T3N3
T4N2
T3N2
T4N1
T3N1
T2N3T2N2T2N1
T1N1
CN
indicates debonded strand
270 ksi 0.5 inch low relaxationprestressing strand
36 in
6 in
6 in
15 in
3 in
6 in
6 in
3 in
12 in
18 in

212
The three shear tests were each loaded by a single point load located closer to the east
end of the girder. The simple supports included a roller at the east end and a rocker
bearing at the west end. The rocker was implemented to alleviate safety concerns
emanating from the non-symmetric application of load. In girder tests 28S and 24S, the
roller bearing was centered 4 feet from the east end of the girder. In girder test 14S, the
roller bearing was centered 6 in. from the east end of the girder. This setup allowed for a
determination of the effect of strand debonding on the shear strength of the girder.
5.4 Instrumentation
The instrumentation plan for the four girder tests included five basic types of
instrumentation. Electrical resistance strain gages were used to capture the strain behavior
on the surface of the concrete girder. One and two in. long gages were used, depending
on application and availability. In general, the linear string potentiometers were used to
measure girder deflection. Tilt meters were used to measure girder rotation. Linear
variable differential transformer (LVDT) displacement transducers were used to measure
prestressing strand slippage. Finally, load cells were used to measure the live load applied
to the girder at the load point(s). The following discussion describes the instrumentation
plan for each girder specimen in detail.
5.4.1 Girder 80F
Figure 5.4.1-A shows the test setup and instrumentation plan for Girder 80F. The
majority of the instrumentation was placed on the girder in one of five vertical
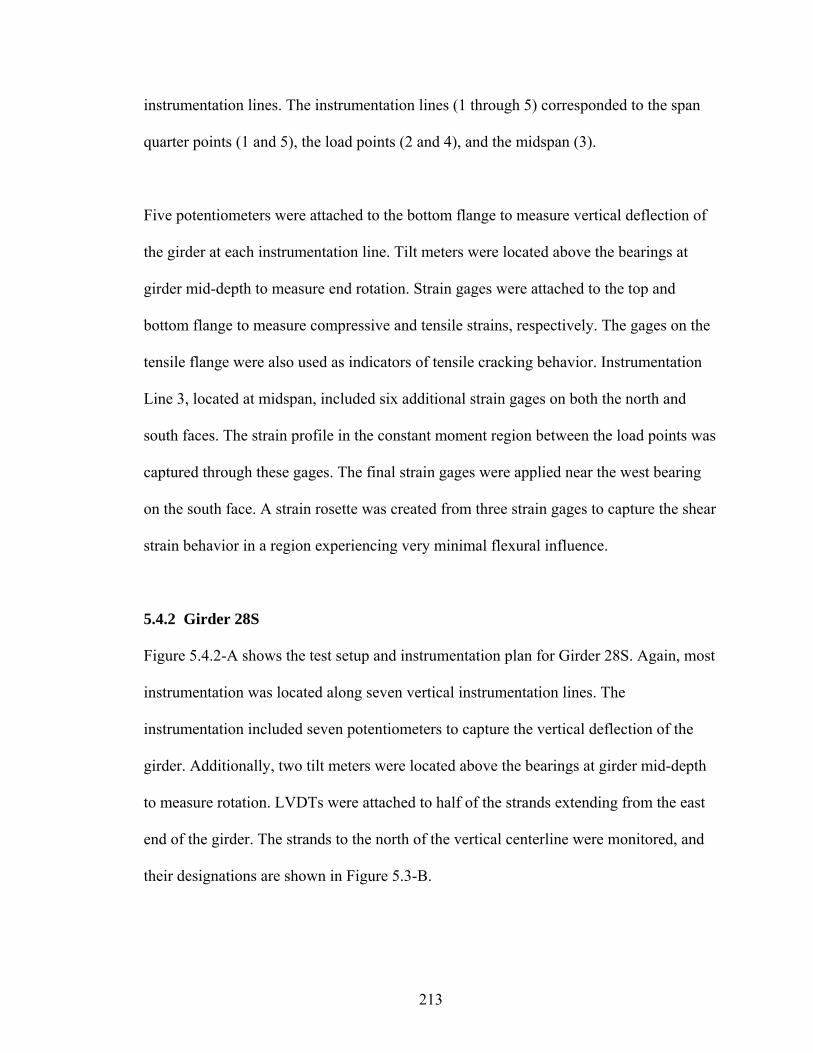
213
instrumentation lines. The instrumentation lines (1 through 5) corresponded to the span
quarter points (1 and 5), the load points (2 and 4), and the midspan (3).
Five potentiometers were attached to the bottom flange to measure vertical deflection of
the girder at each instrumentation line. Tilt meters were located above the bearings at
girder mid-depth to measure end rotation. Strain gages were attached to the top and
bottom flange to measure compressive and tensile strains, respectively. The gages on the
tensile flange were also used as indicators of tensile cracking behavior. Instrumentation
Line 3, located at midspan, included six additional strain gages on both the north and
south faces. The strain profile in the constant moment region between the load points was
captured through these gages. The final strain gages were applied near the west bearing
on the south face. A strain rosette was created from three strain gages to capture the shear
strain behavior in a region experiencing very minimal flexural influence.
5.4.2 Girder 28S
Figure 5.4.2-A shows the test setup and instrumentation plan for Girder 28S. Again, most
instrumentation was located along seven vertical instrumentation lines. The
instrumentation included seven potentiometers to capture the vertical deflection of the
girder. Additionally, two tilt meters were located above the bearings at girder mid-depth
to measure rotation. LVDTs were attached to half of the strands extending from the east
end of the girder. The strands to the north of the vertical centerline were monitored, and
their designations are shown in Figure 5.3-B.

214
Figure 5.4.1-A: Instrumentation plan for Girder 80F
Load Load
78.5 ft
3 ft 3 ft19.5 ft
CL
2.75 ft
Top Face
Bottom Face
South Elevation
West End East End6 in
3 in
3 in
4 in
4 in
18 in
1 in
5 in3 in
10 in15 in
0.75 ft
T T
T
19.5 ft
PotentiometerStrain GageTilt Meter
South Face
North Face
South Face
North Face
Inst. Line 1 Instrumentation Line 2Inst. Line 3
Inst. Line 4 Inst. Line 5
20 in
Note: Vertical scale is 3 times larger than horizontal scale

215
Figure 5.4.2-A: Instrumentation plan for Girder 28S
West End East End
Load
Top Face
Bottom Face
South Elevation
PotentiometerStrain GageTilt MeterT
Load
North Elevation(Mirrored View)
T T
28 ft 4 ft
1.5 ft1.5 ft1.5 ft2 ft2.5 ft3 ft4 ft
4 in
4 in
18 in
3 in5 in
10 in15 in
20 in
16 in 3 in
6 in
Instrumentation Line 1Instrumentation Line 2
Instrumentation Line 3Instrumentation Line 4
Instrumentation Line 7Instrumentation Line 6
Instrumentation Line 5
Strand Slip LVDT

216
5.4.3 Girder 24S
Figure 5.4.3-A shows the test setup and instrumentation plan for Girder 24S. The
instrumentation plan for this test was similar to—but more extensive than—that
implemented for the testing of Girder 28S. This change resulted from the behaviors
observed during the testing of Girder 28S. Most instrumentation was located along nine
vertical instrumentation lines (Instrumentation Lines X, 0, 1, …, 7). Note that
Instrumentation Lines 1 through 7 were in similar locations in the previous test, while
lines 0 and X are located above the east support and at midlength of the east end
overhang.
Strain gages were used at various locations on the surface of the girder to monitor local
tensile and compressive strains. Strain gages were applied to the top and bottom flanges
to capture similar behaviors to those observed in the testing of Girder 80F. Gages were
also applied along the depth of the cross-section under the load point to capture the strain
profile on the cross-section. Four additional strain gages were applied to the north face of
the top flange block to capture the compressive strains and to monitor the development of
a compression strut as the test progressed. Finally, strain rosettes were created at three
locations in the center of the web on the north face. These rosettes allowed for the
monitoring of the principal compressive and tensile stresses in the web in both the shorter
and longer shear spans.
Seven potentiometers were used to capture the vertical deflection behavior of the girder.
Again, two potentiometers captured the rotation of the girder above the support points. In

217
an identical fashion to the setup for the previous test, LVDTs were used to measure the
strand slip, as shown in Figure 5.3-B.
Strain gages were placed on the top and bottom of the girder and on the north face to
capture the axial and shear strain behavior. A total of seven rosettes were applied to the
web in this test, with the additional rosettes capturing the strain behavior in the east
overhang, at the load point, and farther into the longer shear span. Strain gages were
again placed on the north face of the compression flange. Additional gages were also
placed along the transition at the bottom of the web. Cracking along this transition had
influenced the girder behavior on the previous test, so these gages were intended to
capture localized strain aberrations occurring across this plane at the base of the web.
5.4.4 Girder 14S
Figure 5.4.4-A shows the test setup and instrumentation plan for Girder 14S. This
instrumentation plan was very similar to that implemented for Girder 24S. The primary
difference is that the 4-ft overhang on the east end was eliminated, thus so was
Instrumentation Line X. In addition, Instrumentation Line 7 was eliminated due to the
shorter overall span.

218
Figure 5.4.3-A: Instrumentation plan for Girder 24S
West End
Load
Top Face
Bottom Face
South Elevation
PotentiometerStrain GageTilt MeterT
Load
North Elevation(Mirrored View) T T
24 ft 4 ft
2.25 ft1.5 ft1.5 ft2.25 ft3 ft3 ft3 ft
4 in
18 in
6 in
Inst. Line 1Inst. Line 2Inst. Line 3Inst. Line 4
Inst. Line 5Inst. Line 6
Inst. Line 7
17 in3 in
22 in26 in
Inst. Line XInst. Line 0
South Face
North Face
Strand Slip LVDT

219
Figure 5.4.4-A: Instrumentation plan for Girder 14S
West End
Load
Top Face
Bottom Face
South Elevation
PotentiometerStrain GageTilt MeterT
Load
North Elevation(Mirrored View)
T T
14 ft 0.5 ft
1.5 ft1.5 ft1.5 ft1.5 ft3 ft2 ft
4 in
18 in
6 in
Inst. Line 1Inst. Line 2
Inst. Line 3Inst. Line 4Inst. Line 5
Inst. Line 6
17 in3 in22 in
26 in
Inst. Line 0
North Face
South Face
Strand Slip LVDT

220
5.5 Loading Procedure
Loads were applied to the girders through their top flange using hydraulically actuated
jacks. The loads were applied vertically in the plane of the strong axis of each girder. In
the Girder 80F test, the load was applied through two load points, each 3 feet from
midspan. The load point bearing was a pair of back-to-back channels grouted to the
surface. The shear tests were all loaded through a single load point. The load point
bearing assembly was a steel plate grouted to the surface with a half-round bearing
welded to the jack side of the plate. The jack applied a vertical force to this half-round
bearing, thus limiting the horizontal forces imparted to the girder.
All the data collection instruments described within the instrumentation plan were
monitored throughout the test. The test plan was conducted and modified throughout the
test based on these values. Initially, each test was conducted under load control. Load
was increased in predefined increments, then the loading was stopped, and the data were
collected. This procedure continued until the girder was observed to be softening. The
test control was then shifted to deflection control, wherein the vertical deflection of the
girder under the load point was incremented. The hydraulic jacks were instructed to
extend until a certain girder deflection was reached, then the loading was stopped, and the
data were collected. The deflection increments varied from smaller values when the
specimen was initially beginning to soften to larger values when the specimen was
exhibiting little residual stiffness.

221
At predefined intervals throughout each test, the loading was stopped and unload/reload
data were captured. This testing protocol allowed for the capture of the residual elastic
response of the girder, regardless of the level of inelastic damage that had already
occurred. In general, six to eight unloads were completed and were evenly spaced
throughout each test. The unloads usually decreased the load on the specimen to
approximately 0.75Pmax, or 75 percent of the current maximum load. The load was then
increased and the data were collected at 0.80Pmax, 0.85Pmax, 0.90Pmax, and 0.95Pmax. The
load was then increased to Pmax, and the test continued in the same manner as it had
before the initiation of the unload/reload protocol.
All girders were loaded until they were determined to have failed. Failure was defined as
either crushing of the concrete or gross cracking of the concrete accompanied by rupture
or significant slippage of prestressing strands.

222
CHAPTER 6
UHPC GIRDER TEST RESULTS
This chapter presents detailed results from the four UHPC girder tests. The results from
the flexure test on the 80-ft long AASHTO Type II girder are presented first, followed by
the results from the three full-scale shear tests.
6.1 Static Flexural Testing
As discussed in Chapter 5, Girder 80F was an 80-ft long AASHTO Type II prestressed
girder. The girder was loaded in four-point bending by point loads located 3 feet from the
centerline and by roller supports located 39.25 feet from the centerline. The girder
contained twenty-six 270 ksi low relaxation strands and no mild steel.
Figure 6.1-A shows the applied load versus the vertical deflection response for this
girder. The response as measured from the girder’s bottom flange at the centerline is
shown in Figure 6.1-A(a), and the average deflection at the load points and quarter points
is shown in Figure 6.1-A(b). The load-deflection response shows that the girder behavior
began to soften between 70 and 80 kips at a deflection of approximately 3.0 in. The
girder exhibited significant additional capacity reaching a peak load of 178 kips at a
deflection of 18.5 in. A similar response can be observed in Figure 6.1-B, which shows
the applied load versus rotation at the girder support. Figure 6.1-C provides a plot of the
deflected shape of the girder at seven load steps throughout the test. Note that the data
points closest to the supports were derived from the support rotation values.

223
Figure 6.1-A: Load-deflection response of Girder 80F
(a) Deflection measured at midspan
(b) Average deflections measured at load and quarter points
020406080
100120140160180200
0 5 10 15 20Deflection (in.)
Tota
l App
lied
Load
(kip
s)
Peak Load = 178 kips
020406080
100120140160180200
0 5 10 15 20Deflection (in.)
Tota
l App
lied
Load
(kip
s)
Load PointQuarter Point

224
Figure 6.1-B: Load-rotation response of Girder 80F
Figure 6.1-C: Deflected shape of Girder 80F at selected load levels
020406080
100120140160180200
0 0.5 1 1.5 2 2.5 3 3.5
End Rotation (degrees)
Tota
l App
lied
Load
(kip
s)
West Bearing RotationEast Bearing Rotation
-20
-15
-10
-5
0
-40 -30 -20 -10 0 10 20 30 40Distance from Girder Centerline (ft)
Ver
tical
Def
lect
ion
(in.)
178 kips
150 kips
120 kips
90 kips60 kips
30 kips

225
The sixteen strain gages located at the girder’s centerline were used to create a strain
profile over the depth of the girder throughout the test. Individual gages were used until
their readings became unreliable due to cracking of the underlying concrete. The data
from both sides of the girder correlated well. The neutral axis location and the curvature
of the cross-section could be computed from these results. Figure 6.1-D shows the
applied moment versus midspan curvature response. Similarly, Figure 6.1-E shows the
neutral axis depth from the top of the girder versus the applied moment. Note that the
basic elastic section analysis indicates that the neutral axis at test initiation should have
been located approximately 20.5 in. down from the top of the girder. This plot shows that
the neutral axis began to rise at an applied moment of approximately 17000 k-in., which
corresponds to a load of approximately 78 kips. Also, note the stability of the neutral axis
depth during the unloads/reloads.
Figure 6.1-D: Moment-curvature response of Girder 80F
0
5000
10000
15000
20000
25000
30000
35000
40000
45000
0 0.0001 0.0002 0.0003 0.0004 0.0005Curvature (in-1)
Mid
span
App
lied
Mom
ent (
k-in
)

226
Figure 6.1-E: Midspan neutral axis depth from the top of Girder 80F
The strain rosette on the south face of the girder near the west bearing was used to
capture the data presented in Figures 6.1-F and 6.1-G. The data shown in these plots are
not continuous because difficulties with the data acquisition system resulted in the loss of
ten data points in the middle of the test. Figure 6.1-F provides the principal tensile and
compressive strains at the rosette. Figure 6.1-G shows the angle of the principal strains in
clockwise degrees from horizontal on the south face. In both figures, note the linearity of
the results. The tensile principal strain angle was approximately 40 degrees from vertical,
and the strain increased elastically up to over 75 microstrain. No shear cracking was
observed in the girder.
0
5
10
15
20
0 10000 20000 30000 40000Midspan Applied Moment (k-in)
Neu
tral A
xis D
epth
(in.
)

227
Figure 6.1-F: Principal strains in the web near the west support of Girder 80F
Figure 6.1-G: Principal strain angles in the web near the west support of Girder 80F
020406080
100120140160180200
-120 -90 -60 -30 0 30 60 90 120Microstrain
App
lied
Load
(kip
s)
Tensile Principal StrainCompressive Principal Strain
020
4060
80100120
140160
180200
-90 -60 -30 0 30 60 90
Principal Strain Angle
App
lied
Load
(kip
s)
CompressivePrincipalAngleTensilePrincipalAngle
(Clockwise degrees from horizontal)

228
Significant audible cracking—which started when the load reached 73 kips and continued
throughout the remainder of the test—emanated from the girder. However, in general,
these cracking sounds could not individually be correlated to cracks on the surface of the
girder. In fact, the cracks were not visible without the aid of a highly volatile crack
revealing spray until the load had reached approximately 160 kips. After this load was
reached, many tightly spaced hairline flexure cracks were visible in the bottom flange and
web near midspan.
The test was halted overnight just after a peak load of 140 kips was reached. The girder
was locked in place with a deflection of 12 in. Prior to resuming the test, the cracks on
the bottom flange were mapped using the volatile spray. Figure 6.1-H shows
photographic results of this mapping from six points along the length of the girder. The
crack spacing near midspan was approximately 0.2 in. This spacing had increased to 0.4
in. at 10 feet from midspan, 1.0 in. at 16 feet, and 5 in. at 22 feet. No cracks were visible
either to the unaided eye or through simple magnification devices.

229
Figure 6.1-H: Crack spacing on the bottom flange of Girder 80F at 12 in. midspan overall girder deflection

230
As previously mentioned, Girder 80F exhibited a significant deflection capacity prior to
failure. Figure 6.1-I shows the girder carrying a load of 175 kips with a resulting
deflection of 17 in. Soon after this photograph was captured, the girder reached its
maximum applied load of 178 kips, which corresponds to an applied moment of 38700 k-
in. The maximum combined dead and live load moment was 42500 k-in. For
comparison, recall from Section 2.5.3 that a similar ultimate flexural capacity was
attained experimentally by Russell and Burns (1993) during the testing of a 46 in. deep
decked I-girder. This girder had a 6 ksi, 72-in. wide top flange, and was prestressed with
28 0.5-in. strands.
After the maximum load was reached, the girder began to exhibit drastically decreased
stiffness. The loading was stopped at this point. As the girder softened the load
decreased, because the loading apparatus was hydraulically actuated. Approximately one
minute prior to failure, a single gross crack was observed growing up from the bottom
flange at the west load point. Unlike any other cracks in the girder, this crack was clearly
visible to observers from a distance of 15 feet. Failure of the girder was dramatic, with
the girder fracturing into two separate, unconnected pieces. Failure occurred due to a
combined tensile failure of the concrete matrix and the prestressing strands. At the failure
location, the fibers pulled out and all the strands necked and ruptured. Figure 6.1-K
shows the west failure surface.

231
Figure 6.1-I: Girder 80F after approximately 17 in. of deflection
Figure 6.1-J: Girder 80F immediately after failure

232
Figure 6.1-K: Failure surface of Girder 80F including (a) overall west failure surface and (b) close-up of west failure surface showing pulled-out fibers and necked strands
(a) (b)

233
6.2 Static Shear Testing
The results from three shear tests of full-scale AASHTO Type II prestressed UHPC
girders are presented in this section. Results for Girder 28S are presented first, followed
by results for Girder 24S and Girder 14S.
6.2.1 Girder 28S
The first shear test was completed on Girder 28S. The test specimen had an overall span
of 28 feet and a shear span of 6.5 feet resulting in a shear span-to-depth ratio of 2.17. The
east bearing on this girder was placed 4 feet from the end of the girder to minimize the
effect that the debonding of the strands would have on the test results.
As shown in Figure 5.3-A, Girder 28S was originally the west end of Girder 80F. Prior to
the Girder 28S test, the girder was examined for damage that may have resulted from the
Girder 80F test. Significant flexural cracking was observed toward the midspan of Girder
80F (i.e., the west end of Girder 28S). Additionally, a longitudinal hairline crack was
observed along the base of the web, which went from 1 ft east of the east bearing to just
west of the load point. This crack may have either occurred due to the failure of Girder
80F or during fabrication or shipping of the girder.
The response of Girder 28S to the applied loading is shown in Figure 6.2.1-A through
6.2.1-C. Figure 6.2.1-A shows the applied load versus the vertical deflection response at
the seven instrumentation lines. Figure 6.2.1-B focuses on the data from the tilt meters at
the east and west bearings. Figure 6.2.1-C shows a plot of the deflected shape of the

234
girder at six load levels. Recall that the single point load was applied 21.5 feet from the
west support. Note how the location of maximum deflection shifts east as the test
progresses. This shift, a direct function of the softening of the east end of the girder, will
be discussed later in this chapter.
The potentiometer readings nearest to the load point clearly indicate that the girder began
to show softening behavior at a load of 250 kips. The girder still had a significant reserve
load capacity and reached a peak load of 500 kips. At this peak load, the shear load
carried by the east shear span was 384 kips. For comparison, Tawfig (1995, 1996) found
that decked AASHTO Type II girders composed of 8 to 12 ksi HPC and containing shear
reinforcement carried approximately 270 kips of shear before failure.
Figure 6.2.1-A: Load-deflection response of Girder 28S
0
100
200
300
400
500
0.0 0.2 0.4 0.6 0.8 1.0 1.2 1.4 1.6
Deflection (in.)
App
lied
Load
(kip
s)
Pot 1 Pot 2Pot 3 Pot 4Pot 5 Pot 6Pot 7

235
Figure 6.2.1-B: Bearing rotation response of Girder 28S
Figure 6.2.1-C: Deflected shape of Girder 28S
0
100
200
300
400
500
600
-0.2 -0.1 0.0 0.1 0.2 0.3 0.4 0.5 0.6
Rotation (degrees)
App
lied
Load
(kip
s) East Bearing
West Bearing
-1.4
-1.2
-1
-0.8
-0.6
-0.4
-0.2
0
0.2
0 4 8 12 16 20 24 28
Distance Along Girder from West Bearing (ft)
Ver
tical
Def
lect
ion
(in.)
490 kips
400 kips
300 kips
200 kips
100 kips

236
Half of the prestressing strands extending from the east end of the girder were
instrumented to measure strand slip. Figure 6.2.1-D shows the strand slip behavior
throughout the test. Only the instrumented debonded strands are shown because all of the
fully bonded instrumented strands showed less than 0.002 in. of slip throughout the test.
Results from the four strain rosettes are presented in Figures 6.2.1-E through 6.2.1-H.
The tensile principal strain and strain angle values are presented in the first two figures.
The compressive principal strain and strain angle are presented in the second two figures.
Note that the strain angles are measured in clockwise degrees from horizontal as viewed
from the south face of the girder.
Figure 6.2.1-D: Strand slip in Girder 28S
0
100
200
300
400
500
600
-0.01 0 0.01 0.02 0.03 0.04 0.05 0.06 0.07 0.08 0.09Strand Slip (in.)
App
lied
Load
(kip
s)
T1N1T2N2T3N2T3N4T4N1T4N3
Note: The fully bonded strands are not shown as they showed less than 0.002 in. slippage throughout the test.

237
Figure 6.2.1-E: Principal tensile strain in the web of Girder 28S
Figure 6.2.1-F: Principal tensile strain angle in the web of Girder 28S
0
100
200
300
400
500
-90 -60 -30 0 30 60 90Principal Tensile Strain Angle
App
lied
Load
(kip
s)
Rosette 1Rosette 2Rosette 3Rosette 5
(Clockwise degrees from horizontal)
0
100
200
300
400
500
-50 0 50 100 150 200 250
Microstrain
App
lied
Load
(kip
s)
Rosette 1Rosette 2Rosette 3Rosette 5

238
Figure 6.2.1-G: Principal compressive strain in the web of Girder 28S
Figure 6.2.1-H: Principal compressive strain angle in the web of Girder 28S
0
100
200
300
400
500
-1200 -1000 -800 -600 -400 -200 0Microstrain
App
lied
Load
(kip
s)
Rosette 1Rosette 2Rosette 3Rosette 5
0
100
200
300
400
500
-90 -60 -30 0 30 60 90Principal Compressive Strain Angle
App
lied
Load
(kip
s)
Rosette 1Rosette 2Rosette 3Rosette 5
(Clockwise degrees from horizontal)

239
Cracking and other damage to the girder were observed both audibly and visually
throughout the test. The first cracking was heard at a load of 280 kips. The cracking
continued throughout the remainder of the test and seemed to primarily emanate from the
eastern half of the girder. Throughout the test, the preexisting hairline crack at the base of
the web continued to grow larger and longer. At a load of 350 kips, this crack was clearly
visible from 15 feet. Figure 6.2.1-I shows the size of this crack at a load of 450 kips. This
crack, along with its branch that rose toward the load point beginning around 450 kips,
was the only gross cracking observed prior to girder failure. However, many other
smaller cracks were present. These cracks were initially only visible through the use of an
indicating spray, and were later visible by short-range unaided viewing.
Figure 6.2.1-I: Crack at south base of Girder 28S web at a load of 450 kips

240
Figure 6.2.1-J shows the south face of the east shear span near the east bearing just after
girder failure. Note the longitudinal crack at the base of the web, the vertical crack
descending from the top of the top flange, and the crushed area in the web above the
bearing. Figure 6.2.1-K shows the damage recorded after girder failure.
The failure of the girder was precipitated by a number of events. First, the longitudinal
shear crack at the base of the web continued to grow longer and wider throughout the
test. Near the completion of the test, the width of the crack was sufficient that only
minimal tensile load transfer via fiber reinforcement across the crack would have been
possible. Just after the peak load was reached, the base of the girder web just above the
bearing began to crush. This slow process (lasting approximately 90 seconds) was finally
halted by the rupturing of the two strands in the top flange. Note that the instrumented top
flange strand did not show any slip throughout the test and that the rupture was 48 in.
from the end of the girder. The failure mode of this girder will be discussed in more depth
in Chapter 7.

241
Figure 6.2.1-J: Tension failure of top flange and crushing of web at conclusion of test

242
Figure 6.2.1-K: Crack pattern at failure in Girder 28S
CRUSH
Load
9 mm crack spacing
6 mm crack spacing
9 mm crack spacing
3 mm crack spacing9 mm crack spacing
Note: 1. Crack widths are not drawn to scale.2. Tightly spaced crack areas are not drawn to scale.
Preexisting hairline crack

243
6.2.2 Girder 24S
The second shear test was completed on Girder 24S. This girder had an overall span of 24
feet and a shear span of 7.5 feet, resulting in a shear span-to-depth ratio of 2.5. The east
bearing on this girder was centered 4 feet from the end of the girder to minimize the
effect that the debonding of the strands would have on the test results.
As shown in Figure 5.3-A, Girder 24S was originally the east end of Girder 80F. Similar
to Girder 28S, this girder was examined for damage that may have resulted from the
Girder 80F test. Significant flexural cracking was observed toward the west end of the
girder; however, the majority of this cracking was outside of the test span. Additionally, a
single crack was observed that started in the east overhang region at the bottom flange
and ended in the web just west of the east bearing. This crack probably resulted from the
motion of this end of the girder immediately following the failure of Girder 80F.
Figure 6.2.2-A shows the applied load versus the vertical deflection response of the
girder. Individual curves are shown for each potentiometer, including Pot 4, located
under the load point. Figure 6.2.2-B shows the applied load versus the girder rotation at
the east and west supports. Figure 6.2.2-C shows the deflected shape of the girder at nine
points throughout the test. Recall that the load was applied 16.5 feet from the west
bearing.

244
Figure 6.2.2-A: Load-deflection response of Girder 24S
Figure 6.2.2-B: Bearing rotation of Girder 24S
0
100
200
300
400
500
600
700
800
0.00 0.25 0.50 0.75 1.00 1.25Rotation (deg)
App
lied
Load
(kip
s)
East Bearing RotationWest Bearing Rotation
0
100
200
300
400
500
600
700
800
0.00 0.25 0.50 0.75 1.00 1.25 1.50 1.75 2.00 2.25
Deflection (in.)
App
lied
Load
(kip
s)
Pot 1 Pot 2Pot 3 Pot 4Pot 5 Pot 6Pot 7

245
Figure 6.2.2-C: Deflected shape of Girder 24S
The deflection measurements nearest to the load point indicate that the girder began to
show softening behavior at a load between 300 and 400 kips. The girder still had a
significant reserve load capacity and reached a peak load of 731 kips. At this peak load,
the shear load carried by the east shear span was 502 kips. Again, this capacity is
significantly above the decked AASHTO Type II shear capacity determined by Tawfig
(1995, 1996) for HPC.
Half of the prestressing strands extending from the east end of the girder were
instrumented to measure strand slip. None of the strands showed any slippage until after
the girder failed. For this reason, the strand slip results are not plotted here.
-2.5
-2
-1.5
-1
-0.5
0
0 4 8 12 16 20 24Distance Along Girder from West Bearing (ft)
Ver
tical
Def
lect
ion
(in.)
730 kips
700 kips
600 kips
500 kips
400 kips300 kips200 kips100 kips

246
Results from the seven strain rosettes are presented in Figures 6.2.2-D through 6.2.2-G.
The tensile principal strain and strain angle are presented in the first two figures. The
compressive principal strain and strain angle values are presented in the second two
figures. Note that the strain angle values are measured in clockwise degrees from
horizontal as viewed from the south face of the girder. Also, in these figures, tension and
compression are not always strictly correct. For instance, at certain load levels, Rosette 4
in Figure 6.2.2-D exhibits a principal tensile strain that is actually compressive. A
subsequent comparison with Figure 6.2.2-G shows that the compressive principal strain
for Rosette 4 is compressive and is far larger. In this case, both principal strains were
compressive; therefore, the less compressive strain is presented as tensile.
Cracking and other damage to the girder throughout the test were observed both audibly
and visually. The first cracking was heard at a load of 370 kips. The cracking continued
throughout the remainder of the test and seemed to primarily emanate from the eastern
half of the girder. Up until just before failure, no gross cracking was observed in the
girder. However, many small cracks were present. These cracks were only visible
through the use of an indicating spray and were primarily shear cracks in the girder web.
The failure of this girder was sudden and dramatic. Toward the conclusion of the test,
two parallel shear cracks appeared in the girder web that were clearly visible from 15
feet. These cracks were approximately on the direct line from the bottom flange bearing
plate to the top flange load plate. One of the cracks ran from the bottom to the top of the
web while the other ran from the bottom to halfway up the web.

247
Figure 6.2.2-D: Principal tensile strain in the web of Girder 24S
Figure 6.2.2-E: Principal tensile strain angle in the web of Girder 24S
0
100
200
300
400
500
600
700
800
-200 0 200 400 600 800 1000 1200 1400 1600 1800 2000Microstrain
App
lied
Load
(kip
s)
Rosette X Rosette 1Rosette 2 Rosette 3Rosette 4 Rosette 5Rosette 6
0
100
200
300
400
500
600
700
800
-90 -60 -30 0 30 60 90Principal Tensile Strain Angle
App
lied
Load
(kip
s)
Rosette X Rosette 1Rosette 2 Rosette 3Rosette 4 Rosette 5Rosette 6
(Clockwise degrees from horizontal)

248
Figure 6.2.2-F: Principal compressive strain in the web of Girder 24S
Figure 6.2.2-G: Principal compressive strain angle in the web of Girder 24S
0
100
200
300
400
500
600
700
800
-1000 -800 -600 -400 -200 0Microstrain
App
lied
Load
(kip
s)
Rosette XRosette 1Rosette 2Rosette 3Rosette 4Rosette 5Rosette 6
0
100
200
300
400
500
600
700
800
-90 -60 -30 0 30 60 90Principal Compressive Strain Angle
App
lied
Load
(kip
s)
Rosette XRosette 1Rosette 2Rosette 3Rosette 4Rosette 5Rosette 6
(Clockwise degrees from horizontal)

249
Figure 6.2.2-H shows photographs taken from a digital video of the failure. These two
parallel shear cracks released in a brittle fashion, and the girder failed. As previously
mentioned, none of the strands slipped until after the failure. The two top flange strands
did break in three locations during the failure; however, this secondary failure was related
to the large release of energy coming from the concrete tensile (shear) failure. Figure
6.2.2-I shows the girder after failure. Figure 6.2.2-J shows the crack and failure patterns
recorded after the girder had failed.
6.2.3 Girder 14S
The third shear test was completed on Girder 14S. As shown in Figure 5.3-A, this girder
was one end of an untested 30-ft girder. This specimen had an overall span of 14 feet and
a shear span of 6 feet, resulting in a shear span-to-depth ratio of 2.0. The east bearing on
this girder was placed 6 in. from the end of the girder, similar to where it would be placed
in practice. Note that half of the bottom flange strands are debonded to 36 in. from the
end of the girder.
Figure 6.2.3-A shows the applied load versus the vertical deflection response of the
girder. Similarly, Figure 6.2.3-B shows the applied load versus the girder rotation at the
east and west supports. Figure 6.2.3-C shows the deflected shape of the girder at nine
points throughout the test. Recall that the load was applied 8 feet from the west support.

6 -250
Figure 6.2.2-H: Failure of Girder 24S. (a) 1/15th second before failure. (b) 1/30th second before failure. (c) At failure. (d) 1/30th second after failure.
(a) (b)
(d) (c)

251
Figure 6.2.2-I: Failed Girder 24S (a) south elevation and (b) bottom flange near bearing
(b)
(a)

252
Figure 6.2.2-J: Crack pattern at failure in Girder 24S
Load
Note: 1. Crack widths are not drawn to scale.2. Tightly spaced crack areas are not drawn to scale.
3 mm crack spacing
6 mm crack spacing
18 mm crack spacing
Initial failure surfaceSubsequent failure surface
Subsequent failure surface

253
Figure 6.2.3-A: Load-deflection response for Girder 14S
Figure 6.2.3-B: Bearing rotation for Girder 14S
0
100
200
300
400
500
600
700
800
0.00 0.25 0.50 0.75 1.00 1.25
Rotation (deg)
App
lied
Load
(kip
s)
East Bearing RotationWest Bearing Rotation
0
100
200
300
400
500
600
700
800
0.00 0.25 0.50 0.75 1.00 1.25 1.50 1.75 2.00
Deflection (in.)
App
lied
Load
(kip
s)Pot 1Pot 2Pot 3Pot 4Pot 5Pot 6

254
Figure 6.2.3-C: Deflected shape for Girder 14S
The deflection measurements nearest to the load point indicate that the girder began to
show softening behavior at a load of between 450 and 500 kips. The girder still had a
significant reserve load capacity and reached a peak load of 766 kips. At this peak load,
the shear load carried by the east shear span was 438 kips.
Half of the prestressing strands extending from the east end of the girder were
instrumented to measure strand slip. Figure 6.2.3-D shows the strand slip results
throughout the test. The results for 11 of the 13 instrumented strands are shown. The
LVDTs attached to the remaining two strands were not providing reliable results at the
conclusion of the test; therefore, the results from these instruments were disregarded.
-1.6
-1.2
-0.8
-0.4
0
0 2 4 6 8 10 12 14
Distance Along Girder from West Bearing (ft)
Ver
tical
Def
lect
ion
(in.)
300 kips560 kips
600 kips
765 kips
600 kips
150 kips450 kips
300 kips

255
Figure 6.2.3-D: Strand slip in Girder 14S
Results from the six strain rosettes are presented in Figures 6.2.3-E through 6.2.3-H. The
tensile principal strain and strain angle values are presented in the first two figures. The
compressive principal strain and strain angle values are presented in the second two
figures. Note that the strain angle values are measured in clockwise degrees from
horizontal on the south face of the girder. Also, similar to the Girder 24S results, tension
and compression are not always strictly correct with regard to the sign of the principal
strains.
0
100
200
300
400
500
600
700
800
900
0.00 0.10 0.20 0.30 0.40 0.50
Strand Slip (in.)
App
lied
Load
(kip
s)
CN T1N1 T2N2T2N3 T3N1 T3N3T3N4 T4N1 T4N2T4N3 T4N4
Strand Rupture

256
Figure 6.2.3-E: Principal tensile strain in the web of Girder 14S
Figure 6.2.3-F: Principal tensile strain angle in the web of Girder 14S
0
100
200
300
400
500
600
700
800
-100 0 100 200 300 400 500 600 700Microstrain
App
lied
Load
(kip
s)
Rosette 1Rosette 2Rosette 3Rosette 4Rosette 5Rosette 6
0
100
200
300
400
500
600
700
800
-90 -60 -30 0 30 60 90Principal Tensile Strain Angle
App
lied
Load
(kip
s) Rosette 1Rosette 2Rosette 3Rosette 4Rosette 5Rosette 6
(Clockwise degrees from horizontal)

257
Figure 6.2.3-G: Principal compressive strain in the web of Girder 14S
Figure 6.2.3-H: Principal compressive strain angle in the web of Girder 14S
0
100
200
300
400
500
600
700
800
-700 -600 -500 -400 -300 -200 -100 0 100 200 300 400Microstrain
App
lied
Load
(kip
s)
Rosette 1Rosette 2Rosette 3Rosette 4Rosette 5Rosette 6
0
100
200
300
400
500
600
700
800
-90 -60 -30 0 30 60 90 120 150Principal Compressive Strain Angle
App
lied
Load
(kip
s)
Rosette 1Rosette 2Rosette 3Rosette 4Rosette 5Rosette 6
(Clockwise degrees from horizontal)

258
Cracking and other damage to the girder throughout the test were observed both audibly
and visually. The first cracking was heard at a load of 360 kips. The cracking continued
throughout the remainder of the test and seemed to primarily emanate from the eastern
half of the girder. At a load of approximately 700 kips, a larger crack became visible that
could clearly be seen from 15 feet away. This crack continued to grow longer and wider
as the applied load was increased. Figure 6.2.3-I(a) shows the crack at the peak load
carried by the girder. Subsequent to this point in the test, the girder continued to soften
while the displacement increased and the load decreased. The crack continued to grow
toward the bearing and load point until it a secondary crack formed. Figure 6.2.3-I[b])
shows the girder after the formation of the secondary crack in the bottom flange 36 in.
from the end of the girder. This is precisely the location to which half of the bottom
flange strands were debonded.
Failure of the girder occurred when prestressing strands in the bottom flange began to
rupture. The vertical crack in the bottom flange at the end of the debonding length
continued to widen as, sequentially, the fully bonded strands broke. As more
displacement was imparted into the girder, more strands ruptured until all 12 fully bonded
bottom flange strands had ruptured. Figure 6.2.3-J shows the crack and failure patterns
that were recorded after girder failure.

259
Figure 6.2.3-I: Girder 14S at (a) peak load and (b) post-peak load of 595 kips
(b)
(a)

260
Figure 6.2.3-J: Crack pattern at failure in Girder 14S
Load
3 mm crack spacing
6 mm crackspacing3 mm crack
spacing
6 mm crackspacing
12 mm crackspacing6 mm crack
spacing
12 mm crackspacing
3 mm crack spacing
Failure crackPhotoelastic sheet
Note: 1. Crack widths are not drawn to scale.2. Tightly spaced crack areas are not drawn to scale.

261
CHAPTER 7
DISCUSSION OF RESULTS
7.1 Tensile Behavior of UHPC
Four small-scale experimental test methods were used to study the tensile behavior of
UHPC. These test methods included the ASTM C1018 prism flexure test, the ASTM
C496 split cylinder test, the AASHTO T132 mortar briquette test, and the cylinder direct
tension test. Individual test results were presented in Section 3.4. In this chapter, the
results will be combined and compared and the test methods and their applicability and
practicality for UHPC will be discussed.
7.1.1 Summary of Experimental Results
The four small-scale concrete tension testing methods used in this research provided
varied bodies of results. Table 7.1.1-A presents the primary quantifiable results from the
four test methods. Each test provided an indication of the tensile cracking strength of
UHPC. The direct tension and prism flexure tests also provided an indication of the
modulus of elasticity of UHPC. Finally, the prism flexure tests provided an indication of
the post-cracking toughness of UHPC. For reasons discussed in Section 3.4.1, the third-
point loaded UHPC prism with the 12-in. span is taken as the standard prism flexure
loading configuration, and its results are presented in this section.

262
Table 7.1.1-A: UHPC material characterization results for average tensile properties of UHPC
Material Characteristic Steam Air Tempered
Steam Delayed Steam Supplemental Description
First Cracking Strength (ksi) Split Cylinder 1.7 1.3 1.7 1.7 ASTM C496 Prism Flexure 1.3 1.3 1.5 1.4 ASTM C1018; 12 in. span; corrected result Mortar Briquette 1.2 0.9 1.4 1.0 AASHTO T132 Direct Tension 1.4 – 1.6 0.8 – 1.0 1.1 – 1.3 1.3 – 1.6 Axial tensile load Combined Result, fct 1.3 0.9 1.3 1.3 Best estimate of tensile cracking strength Modulus of Elasticity (ksi) Direct Tension 7500 6900 7550 7550 Axial tensile stress and strain based Prism Flexure 8540 7150 8160 8100 Flexural and shear deflection based; 12-in. span Post-Cracking Strength (ksi) Mortar Briquette 1.3 0.9 1.3 0.9 AASHTO T132; influenced by fiber dispersion and orientation Flexural Toughness Prism Flexure: I10 14.4 12.8 13.0 13.8 ASTM C1018; 12-in. span Prism Flexure: I30 53 48 43 48 ASTM C1018; 12-in. span Compression Testing Results Compressive Strength, fc’ (ksi) 28.0 18.3 24.8 24.8 ASTM C39; 28-day strength Modulus of Elasticity (ksi) 7600 6200 7400 7300 ASTM C469; 28-day modulus Tension, Compression fct = x (fc’)0.5 7.8 6.7 8.3 8.3 fct = x fc’ 0.046 0.049 0.052 0.052

263
The tensile cracking strength of UHPC is critical to the design of UHPC structures;
however, it is difficult to experimentally determine. All of the four test methods provide
realistic tensile cracking strengths that could be assumed to be accurate representations of
actual tensile behavior. However, Table 7.1.1-A also shows that, for each curing regime,
the tensile cracking strength can vary by approximately 0.5 ksi depending on the test
method used. For this reason, engineering judgment must be used to predict the true
tensile cracking behavior.
Table 7.1.1-A shows that the results for the cylinder direct tension and mortar briquette
test cracking tensile strength were generally similar for each curing regime. This
similarity is not surprising because both test methods are based on the uniaxial
application of tensile stresses. The prism flexure results, after the application of the
correction factor discussed in Section 3.4.1.1, are generally slightly higher than the direct
tension results. Note that without the correction factor, the prism flexure results would be
approximately two times the direct tension results. Finally, the split tensile results are
approximately one-third larger for all curing regimes, a result that is not unexpected when
comparing split cylinder test results with direct tension results (Petroski 1987). Direct
tension results are normally more highly regarded than split cylinder results. However,
direct tension tests may possibly be disproportionately impacted by local heterogeneities
as compared to the larger structures that they are supposed to mimic. Therefore, lower
tensile cracking strengths may be reported than what would actually be observed in
practice.

264
The results from these four test methods were combined together to determine the tensile
cracking strength. The combining of these results takes into account the overall body of
results, the number of tests, and the deviation of results from the average value. When
these factors are combined, the tensile cracking strength of Steam treated UHPC is 1.3
ksi. The tensile cracking strength of Air treated UHPC is 0.9 ksi. The tensile cracking
strength of Tempered Steam and Delayed Steam treated UHPC are both 1.3 ksi.
These tensile cracking strength results can be compared with the compressive strength
results discussed previously in this report. The bottom of Table 7.1.1-A shows that the
tensile cracking strength, fct, is approximately 5% of the compressive strength, fc’, in all
four curing regimes. Alternatively, Equation 7.1.1-A is frequently used to approximate a
tensile strength from a given compressive strength. In this equation, the square root of the
compressive strength is related to the tensile strength by a linear multiplier, x. In this
case, the UHPC that underwent the Steam treatment has a multiplier of 7.8, the Air
treated UHPC has a multiplier of 6.7, and the Tempered and Delayed Steam treated
regimes have a multiplier of 8.3.
'cct fxf = (7.1.1-A)
The modulus of elasticity results obtained from the tension tests are also presented in the
table. Given the limited number of direct tension tests completed, these results can be
considered to be similar to the compression test modulus of elasticity results discussed in
Chapter 3. Although the Air treated result is 11% higher, the remainder of the results are

265
within 3.5%. However, the prism flexure modulus of elasticity results are generally
between 10% and 15% higher than the comparable compression test results. This result
indicates that the UHPC prism flexure tests tend to overestimate the modulus of elasticity
as compared to the standard compression testing methods because nearly all of the prism
groups exhibit this behavior, regardless of cross-section and loading configuration.
The post-cracking tensile behavior is much more difficult to quantify, but this research
program has resulted in a number of both general and specific findings. The mortar
briquette tests provide the most direct indication of the post-cracking behavior. Figure
3.4.3-B through 3.4.3-E show the full load-displacement curves for all of the mortar
briquette tests. First and foremost, these figures indicate that UHPC tends to display post-
cracking strength levels similar to its precracking strength levels. The table lists the
average post-cracking strength values, which are all within 0.1 ksi of the mortar briquette
first tensile cracking strength levels. Note, however, that post-cracking behavior is very
dependent on fiber dispersion and orientation. The small-scale mortar briquettes most
likely did not accurately represent the large-scale tensile members for these two factors.
Limited post-cracking strength results are also available from the split cylinder tests.
These tests indicate that, under the biaxial state of stress present in this test configuration,
UHPC exhibits significant post-cracking load carrying capacity. For each curing regime,
the peak load carried after cracking is approximately twice the cracking load. However,
the compressive forces paralleling the tensile crack in this loading configuration increase
the fiber/matrix bond and thus contribute to the post-cracking load carrying capacity.

266
Finally, comparative results were also obtained from the prism flexure tests. The results
from this standardized test can easily be compared both within this study and with normal
and fiber reinforced concretes tested by other researchers. Comparisons with the standard
toughness levels set in ASTM C1018 and with the results from other researchers indicate
that UHPC exhibits very high post-cracking toughness values. Specifically, all the UHPC
curing regimes were at or above the stated fiber reinforced concrete toughness upper limit
for the values of I5, I10, and I20. Also, these tests indicate that a relatively uniform level of
toughness will be achieved throughout the curing regimes. However, these results do not
mean that all UHPC display identical post-cracking load carrying behavior, because the
ASTM C1018 toughness measure relates post-cracking to pre-cracking behaviors and
thus is biased by the pre-cracking strength.
7.1.2 Summary of Experimental Test Methods
Sections 7.1.1 and 3.4 describe the small-scale tension tests employed in this research
program and the relevant results from each test. This section builds on those presentations
to present and to compare the test methods. Test capabilities and the difficulties
associated with completing each test will be discussed.
The split cylinder test is the simplest UHPC tension test to successfully complete. This
test program has shown that consistent UHPC tensile cracking strength results can be
obtained by following the ASTM C496 test procedure. The only addition to the test is the
inclusion of a cylinder lateral expansion measurement and recording device. Thus, a

267
measure of the tensile cracking strength of UHPC can be obtained using a standard
hydraulic compression testing machine, a simple data acquisition system, and a pair of
displacement transducers. Alternatively, an evaluation technique capable of detecting a
crack in UHPC, such as ultrasonic inspection, could be used to note cracking in steam-
based treated UHPC, thus eliminating the need for data acquisition and full range
transducers. Test results presented in Section 7.1.1 indicated that conversion of the split
tensile cracking strength result to the overall tensile cracking strength result could be
obtained by multiplying the split cylinder result by a factor of 0.75. Unfortunately, the
unknown post-cracking stress distribution in the cylinder does not allow for the
quantitative determination of any post-cracking tensile behaviors.
A slightly more advanced loading setup is required for completing the AASHTO T132
mortar briquette test. The test performed in this research program required a test machine
capable of loading under crosshead displacement control and a data acquisition system
capable of recording load and displacement readings throughout the test. The primary
benefit of this test over the split cylinder test is that it directly measures uniaxial tensile
properties of UHPC. This benefit allows for a more accurate rendering of the UHPC
tensile cracking strength. Also, this test method can provide some indication of the post-
cracking tensile strength of UHPC; however, the difficulties inherent in the casting of
these small briquette specimens decrease the confidence in any post-cracking strength
results. As such, the benefits of this test over the split cylinder test are marginal unless a
qualitative verification of post-cracking load-carrying capacity is desired.

268
The ASTM C1018 prism flexure test is significantly more intensive with regard to testing
equipment than either of the previous two test methods. To successfully complete this
test, a test machine capable of loading under an external displacement transducer control
is necessary, along with a data acquisition system to record load and displacement.
Additionally, an electronic averaging circuit to combine the deflection results from the
specimen can provide for more consistent, uniform loading. The benefit of the prism
flexure test is that it provides an indication of the tensile cracking strength, the modulus
of elasticity, and an arbitrarily defined but widely used measure of the post-cracking
tensile toughness. Because a cross-comparison between different fiber reinforced
concretes or concretes cast in different laboratories is important, this test can provide
needed results that are unavailable through simpler test setups. However, as discussed in
Section 3.4.1.1, tensile cracking strength results from this test method must be corrected
using an empirical relationship. The acquisition of pure tensile cracking behaviors from
this test method is not possible.
The final test method, the direct tension test, is the most difficult test to implement and
also provides the most complete body of results. This method requires a test machine
capable of loading under external displacement control, an electronic averaging circuit
for at least three displacement transducers, and a data acquisition system to record the
load and displacements. Additionally, a means of gripping the tensile specimen, such as
the high-strength, high-modulus epoxy used in the research, is necessary. Finally, great
care must be taken in the fabrication of the small-scale specimens to ensure that they
replicate the regions in large-scale structures that are subjected to tensile stresses. If all

269
these requirements are met, this test has the possibility of capturing the full tensile stress-
strain or stress-crack opening behavior. These results would include the tensile cracking
strength, the modulus of elasticity, the post-cracking tensile strength, and the load-
carrying capacity from tensile cracking through fiber pullout. The test program discussed
in this report did not achieve the goal of successfully completing direct tension tests, and
thus was not able to determine the full tensile stress-strain response of UHPC from small-
scale tension tests.
The selection of a particular tension test for UHPC must be predicated on the results
desired. The tests discussed in this section could be used to meet certain needs, but other
tests or modifications of these tests could also be used. For example, it is likely that
UHPC used in structures will require a minimum level of tensile strength. As a quality
control issue, a hydraulically operated test machine under load control could be used to
ensure that the minimum level of tensile strength is achieved. This could be accomplished
by an experienced quality control professional performing a mortar briquette or split
cylinder test wherein the UHPC was required to hold a sustained stress level prior to the
audible indication of tensile cracking.
7.2 Local and Global Mechanical Failure Modes of UHPC
UHPC exhibits a number of macrostructural mechanical failure modes. These failure
modes can be categorized into three specific types: compressive, tensile cracking, and
tensile fiber pullout. A fourth failure mode, the high-cycle fatigue failure of crack-

270
bridging steel fibers, has been observed under special loading conditions but will not be
discussed in this report.
The compressive failure of UHPC can be considered to be similar to the compressive
failure of any fiber reinforced concrete. In general terms, UHPC fails under axial
compressive load through lateral tensile expansion. This lateral expansion is partially
restrained by the internal steel fiber reinforcement, thus allowing for a more ductile
failure than may be expected. As with any concrete, higher strength UHPC tends to fail in
a more brittle manner than lower strength UHPC.
On a large scale, the compressive failure of a girder web being subjected to shear loading
was observed during the Girder 28S test. This compression failure can be described as a
slow crushing and surface cracking of the UHPC girder web as loads were being
redistributed around the failing area. No significant spalling of the concrete was observed
during this compression failure. This slow crushing continued for over 1 minute before
the newly redistributed loads caused a tensile fiber pullout failure to occur in another
location.
On a smaller scale, compression failures in hundreds of UHPC cylinders were observed
while performing the ASTM C39 compression test. The failure of any cylinder that
underwent steam-based treatment was brittle, with a rapid load decrease occurring
immediately after the peak load was achieved. Even as such, these cylinders remained
largely intact with relatively few small fragments leaving the cylinder. The failure of the

271
cylinders that underwent the Air treatment behaved in a much more ductile manner.
Some of these cylinders, particularly the ones with strengths above the average of 18.3
ksi, did exhibit brittle behavior. However, most of these cylinders failed through a
continuous, non-abrupt decrease in load after reaching the peak. The failures of these
lower strength (and less cured) cylinders were significantly more ductile and exhibited
quantifiable post-peak behavior that was not achievable on a hydraulically-actuated load
testing machine with the higher strength cylinders. Finally, the compression testing of a
3-in. diameter Steam treated UHPC cylinder that did not contain any fiber reinforcement
resulted in an extremely brittle failure with significant fragmentation of the UHPC.
The tensile behavior of UHPC allows for continuing tensile load carrying capacity across
a cracked plane. The design of the structure will determine whether the tensile cracking
of UHPC is a failure mode. Regardless, for the purposes of this discussion the UHPC
behavior at this critical junction will be described.
Similar to the compression failures described above, the tensile cracking of UHPC can be
either brittle or ductile. Although these differences in behaviors were observed in all
small-scale tensile tests, the differences were most clearly observed in the split cylinder
tensile tests. In these tests, the cylinders that had been subjected to steam-based
treatments tended to exhibit a clear aural indication of first cracking and displayed
discontinuous load-displacement behavior as the crack abruptly formed then was arrested
by the bridging fibers. Conversely, the Air treated cylinders did not exhibit an aural
indication of first cracking and sometimes displayed continuous load-displacement

272
behavior at cracking. Also, the crack width at crack arrest tended to be larger in the
cylinders that underwent the steam-based treatment, which was likely due to the higher
tensile strengths at which cracking occurred.
The full-scale flexure and shear girder tests provide a significant amount of additional
information regarding the cracking behavior of Steam treated UHPC. Observations
during these tests indicate that tensile cracks form perpendicular to highly stressed tensile
regions, and their formation is clearly indicated by an audible signal. These cracks were
highly linear because the girders contained no passive reinforcement and the UHPC
contained no coarse aggregate. The initial cracks that formed in these tests were
extremely tight. The only method that could determine the location of these surface
cracks was the use of a volatile indicating spray. As the tests progressed, the cracks began
to widen slightly, and additional cracks filled in nearby. Observations from the full-scale
flexure test indicate that the crack spacing of 1/8 in. or less is possible in highly stressed
regions. These results clearly indicate UHPC’s ability to redistribute stresses and to
undergo multiple cracking prior to fiber pullout.
Final tensile failure of UHPC generally occurs when the steel fiber reinforcement begins
to debond from and to pull out of the UHPC matrix. Because fibers are randomly
distributed and oriented in the UHPC, individual fiber loads vary at any particular global
load level. Mechanically, pullout occurs when the load carried by an individual fiber
overcomes the ability of the UHPC to grip the fiber. Pullout by any fibers increases the
load that other nearby fibers have to carry. Multiple pullouts in a specific location that

273
require gross load redistribution through alternate load paths can be defined as fiber
pullout failure.
The full-scale flexure test on Girder 80F and the shear test on Girder 24S provide clear
indications of the effect of fiber pullout on global girder behavior. In Girder 80F,
hundreds of tightly spaced cracks carried significant flexural tensile forces in the bottom
bulb of the girder. At the peak load carried by the girder, the fibers at one specific cross-
section began to pull out. This crack quickly became significantly wider than any other
crack in the girder and placed large additional strains on the prestressing strands at this
location. Because the strands could not sustain this large strain, the strands ruptured and
the girder failed.
In Girder 24S, many tightly spaced cracks formed perpendicular to the diagonal tensile
forces being carried by the web of the girder. As the loads on the girder increased, more
cracks formed and the fibers bridging the existing cracks became more highly stressed.
Eventually, the fibers bridging a very highly stressed crack began to pull out. Because
this girder contained no mild steel reinforcement to aid in load redistribution, the girder
abruptly failed.
In both girder tests discussed above, the failure of the girder as a whole was precipitated
by the local bond failure between the fibers and the UHPC matrix. These results clearly
indicate that unless significant mild or prestressing steel redundancy exists in the UHPC
member, fiber pullout will result in member failure.

274
7.3 Effect of Curing Procedure on UHPC Properties
One of the primary focuses of this research program was to determine the effect that the
application of a curing treatment had on the behaviors exhibited by UHPC. To quantify
this effect, the majority of the research completed within the material characterization
portion of this study included four different curing regimes. The curing regimes included
the manufacturer recommended Steam treatment, a delayed version of the same
treatment, a reduced temperature version of the same treatment, and an untreated case in
which the UHPC remained in a laboratory air environment until testing.
Table 7.3-A presents a compilation of results from the material characterization study.
The results provided in the table are average values that were summarized for ease of
discussion. A full discussion of each portion of this test program is provided in Chapter 3.
The application of a curing treatment clearly impacts UHPC behavior. A comparison of
the Steam and Air treated regime results indicates that the application of the
recommended Steam treatment has a significant effect on some properties. In terms of
mechanical properties, Steam treatment will increase the compressive strength, tensile
cracking strength, and elastic modulus. In terms of long-term stability, Steam treatment
will decrease creep and speed the realization of the asymptotic shrinkage virtually
eliminating any shrinkage after the treatment is complete. In terms of durability, Steam
treatment seems to decrease the permeability of UHPC thus increasing its resistance to
chloride penetration. A more durable mechanical matrix that is better able to resist
abrasive forces is also created.

275
The application of intermediate curing treatments, such as in the Tempered Steam and
Delayed Steam regimes, also has a significant—although generally slightly reduced—
impact on the UHPC behavior. While the compressive strength and elastic modulus are
increased by these treatments, they both fall short of the level achieved with the full
Steam treatment. Interestingly, tensile cracking behavior enhancements seem to be
similar regardless of the type of steam treatment applied. Note that the creep behavior is
significantly enhanced by the Delayed Steam treatment while it is only slightly enhanced
by the Tempered Steam treatment. In terms of durability, the chloride ion penetrability is
extremely low regardless of the steam treatment applied.
Another curing treatment procedure, illuminated during this test program, is slightly
outside of the clearly defined boundaries of the curing regimes. In Section 3.3.5, the
effect of demolding cylinders in terms of their early age setting and strength gain was
discussed in terms of compressive strength. These tests showed that demolding UHPC,
and thus exposing it to a low humidity environment, prior to sufficient setting and
strength gain could have a significant impact on the 28-day compressive strength. It is
extremely important to wait until a sufficient strength level has been achieved before
demolding UHPC and to keep UHPC in a moist environment during the continued
strength gain. This procedure was not always followed within this material
characterization study and, as discussed in Chapter 3, some of the observed behaviors
were reduced as a result.

276
The overriding result of the entire UHPC curing treatment comparison is that, regardless
of the curing treatment applied, UHPC exhibits significantly enhanced properties
compared with standard normal strength and high performance concretes. The application
of the Steam treatment is clearly beneficial; however, this procedure is also not always
necessary as long as the user is willing to accept decreases in strength, long-term
stability, and durability.
7.4 Early Age Strength Gain of UHPC
The compressive strength gain behavior of UHPC is an important characteristic of the
concrete. Results detailed in Chapter 3 indicated that UHPC does not have any
compressive strength for nearly 1 day after casting. Then, once initial set occurs, UHPC
rapidly gains strength over the course of the next few days until over 10 ksi of strength is
achieved. At that point, the rate of strength gain decreases, but the strength gain continues
until over 18 ksi of compressive strength is achieved by 28 days.
Figure 7.4-A presents a compilation of the compressive strength data for the Air treated
cylinders tested between 1 and 56 days (the results are discussed in Section 3.3.2). These
results include both cylinders in the Air treatment group and cylinders in the other
treatment groups that had not yet undergone their own steam treatment. Also, recall from
Section 3.6 that initial set tended to occur at approximately 15 hours, and final set
occurred 2 hours later.

277
Table 7.3-A: Average UHPC material properties presented according to curing treatment
Material Characteristic Steam Air Tempered
Steam Delayed Steam Supplemental Description
Compressive Strength (ksi) 28.0 18.3 24.8 24.8 ASTM C39; 28-day strength Modulus of Elasticity (ksi) 7600 6200 7400 7300 ASTM C469; 28-day modulus Split Cylinder Cracking Strength (ksi) 1.7 1.3 1.7 1.7 ASTM C496 Prism Flexure Cracking Strength (ksi) 1.3 1.3 1.5 1.4 ASTM C1018; 12-in. span; corrected Mortar Briquette Cracking Strength (ksi) 1.2 0.9 1.4 1.0 AASHTO T132 Direct Tension Cracking Strength (ksi) 1.4 – 1.6 0.8 – 1.0 1.1 – 1.3 1.3 – 1.6 Axial tensile load Prism Flexural Tensile Toughness (I30) 53 48 43 48 ASTM C1018; 12-in. span Long-Term Creep (Ccu) 0.29 0.78 0.66 0.31 ASTM C512; 11.2 ksi sustained load Long-Term Shrinkage (microstrain) 766 555 620 657 ASTM C157; initial reading after set Total Shrinkage (microstrain) 850 790 – – Embedded vibrating wire gage Coeff. of Thermal Exp. (x10-6 in/in/ºC) 15.6 14.7 15.4 15.2 AASHTO TP60-00 Chloride Ion Penetrability (Coulombs) 18 360 39 18 ASTM C1202; 28-day test Chloride Ion Permeability (lb/yd3) < 0.1 < 0.1 < 0.1 < 0.1 AASHTO T259; ½-in. depth Scaling Resistance No Scaling No Scaling No Scaling No Scaling ASTM C672 Abrasion Resistance (grams lost) 0.17 0.73 0.20 0.13 ASTM C944 2x weight; ground surface Freeze-Thaw Resistance (RDM) 96% 112% 100% 99% ASTM C666A; 600 cycles Alkali-Silica Reaction Innocuous Innocuous Innocuous Innocuous ASTM C1260; tested for 28 days

278
Figure 7.4-A: Compressive strength gain as a function of time after casting
A regression analysis was completed to fit a transition function to the data presented in
Figure 7.4-A. The delayed then rapid early age strength gain behavior of UHPC results in
a somewhat complex approximating function. The Weibull Cumulative function,
provided as Equation 7.4-A below and plotted in Figure 7.4-A, accurately describes the
strength gain behavior for any time after 0.9 days following casting. This equation
includes the time in days after casting, t, the 28-day compressive strength in ksi, fc’, and
the compressive strength at time t in ksi, ',tcf . The initial and final set times of UHPC can
vary depending on the age of the premix and the environmental conditions, thus this
equation may not be applicable to UHPC exhibiting different setting behaviors.
⎥⎥⎥
⎦
⎤
⎢⎢⎢
⎣
⎡
⎟⎟⎟
⎠
⎞
⎜⎜⎜
⎝
⎛
⎟⎟
⎠
⎞
⎜⎜
⎝
⎛ −+−−=
63.063.0
1''
, 35.2)2(ln3exp1 tff ctc (7.4-A)
02468
101214161820
0 10 20 30 40 50 60Days after Casting
Com
pres
sive
Stre
ngth
(ksi
)
Equation 7.4-A with fc’ = 18.3 ksi

279
7.5 Comparison of Cylinder and Cube Compression Strength Results
The cylinder is the standard concrete compression test specimen geometry used in the
United States. This is understandable because cylinder molds are inexpensive and the
casting of concrete cylinders is relatively easy. However, as opposed to traditional
concrete, UHPC cylinders cannot be easily prepared for testing. In any concrete
compression test, the even and parallel loading of the ends of the cylinder is critical to
achieving accurate test results. The high compressive strength of UHPC eliminates the
possible use of end capping materials and predicates grinding or milling to ensure plane,
parallel loading surfaces. Unfortunately, the equipment necessary to perform this end
preparation on UHPC cylinders is not yet locally available to all quality control and
testing departments.
One method of eliminating the need for cylinder end preparation is to use cubes as the
standard means to measure the compressive strength of UHPC. Cubes are cast with two
pairs of plane, parallel faces thus greatly simplifying the specimen preparation process.
The primary drawbacks to the use of cubes are the expense of the molds, the
unfamiliarity with the test methods, and the indirect nature of the results obtained from
the test. In general, cube compression test results are higher than cylinder compression
test results on the same concrete due to the aspect ratio of the specimens and the
confining effect of the machine platens. To account for these differences, a strength
reduction factor normally needs to be applied to a cube compression test result. This
factor can vary significantly depending on many concrete properties, but has been

280
reported to be in the vicinity of 0.82 for ordinary concrete and increases toward 1.0 as the
concrete strength increases (de Larrard et al. 1994).
Section 3.3.4 presented the results from a series of cube and cylinder compression tests.
Recall that the 2-in., 3-in., and 4-in. diameter cylinders, as well as the 2 in. and 100 mm
cubes were tested and that the series of tests were repeated three times on different
batches of UHPC. If the 3-in. diameter cylinder is considered to be the control specimen,
the results showed that the compressive strength exhibited by the 100 mm cube
specimens ranged from 1.2% below to 8.0% above the control specimen strength. The
strength of the 2 in. cube ranged from 4.6% to 6.1% above. These increases of less than
10% are sufficiently small; therefore, cube tests should be able to be used as a direct
substitute for cylinder compression tests in some applications. Although most owners will
probably require cylinder compression tests as the standard strength test result reported
for the foreseeable future, the UHPC component fabricator internal quality control testing
using the cube specimens would not be precluded.
One additional finding from the results presented in Section 3.3.4 relates to the size of the
compression specimen (for either the cylinder or the cube). The results indicate that
smaller specimens, particularly the 2-in. diameter cylinders and the 2 in. cubes, tended to
exhibit larger standard deviations. The casting-based heterogeneities (i.e., entrapped air
voids) in the UHPC that are proportionally larger in smaller specimens are likely behind
these results. For this reason, the use of compression specimens that have a minimum
dimension smaller than 3 in. is not recommended.

281
7.7 Shrinkage Behavior of UHPC
A significant portion of this research program has focused on the tensile behaviors of
UHPC and the applicability of those tensile behaviors to structural engineering.
Assurance of those tensile properties in a completed structural member is a factor of
many things, including both casting/placing techniques and curing treatments. Another
important factor is the formwork and its ability to restrain shrinkage forces.
The test results presented in Section 3.7 indicate that UHPC exhibits shrinkage behaviors
that are somewhat different than those exhibited by normal concrete. Overall long-term
shrinkage of UHPC is somewhat large, with an asymptotic value nearing 850 microstrain.
More importantly, the results indicate that UHPC shrinks very rapidly in the 24 hours
after the initiation of setting behaviors. This rapid shrinkage can include up to 400
microstrain of shrinkage during this time frame with a shrinkage rate of up to 60
microstrain per hour. The shrinkage continues at an increased rate as compared to normal
concrete with 95% of its ultimate shrinkage occurring by 2 months after casting.
These early age shrinkage behaviors are important to the successful casting of UHPC
structural members, because UHPC will crack at tensile strains significantly below these
shrinkage strains. Thus, the casting of UHPC must mitigate or eliminate shrinkage
restraints on the cast member. For highway bridges, standard I-shaped girders are not
particularly susceptible to restrained shrinkage cracking. However, in the casting of a
member with restrained areas, such as a double-tee section or a box section, special care
must be taken to allow for monitoring and the release of shrinkage strains.

282
7.8 Long-Term Stability of UHPC
The basic premise behind the application of prestressing forces into concrete girders is
that the application of an eccentric compressive axial force onto a beam will delay
inelastic behaviors and increase the ultimate capacity. To achieve these goals, the
prestressing forces must be maintained indefinitely. Time-dependent concrete behaviors
such as creep and shrinkage can both negatively impact the maintenance of the
prestressing force, thus reducing the enhancement provided by the prestress.
Section 7.12 addresses the long-term stability of UHPC specifically as it relates to the
material characterization results and the AASHTO Type II prestressed girders discussed
in this study. This section addresses the general long-term stability of UHPC, including
the creep and shrinkage behaviors that can be expected and the possible methods to
alleviate those behaviors.
In large scale prestressed concrete girder fabrication facilities, the time required to
fabricate a girder from initial form setup to cutting of strands and removing the girder
from the form is critical. This amount of time determines the turnover for the casting bed
and directly influences the cost of each girder. In general, precasters want to create a
rapid turnover, thus they are interested in stressing the girder as soon as possible after
casting. The results of this method, for any concrete, are that the expected creep and
shrinkage values will be larger and the prestress losses will be greater.

283
The shrinkage behavior of UHPC has been discussed in Sections 3.7 and 7.7. UHPC can
be expected to undergo nearly half (400 microstrain) of its long-term shrinkage (850
microstrain) during the first 24 hours after setting. Also, Steam treatment will hasten the
achievement of the ultimate shrinkage value and will effectively stabilize the UHPC
against further shrinkage indefinitely. For these reasons, delaying the stressing of the
girder is clearly beneficial.
The creep behavior is also influenced by the concrete strength at girder stressing. The
long-term creep results from Section 3.8 indicate that creep coefficients between 0.3 and
0.8 can be expected for UHPC that is treated according to one of the curing regimes.
However, the prestress would likely be applied before any of these treatments are
completed in a production environment. For this reason, the creep behavior at earlier
ages, and thus at lower compressive strengths, is important. The early age creep testing
presented in Section 3.8.2 focuses on this behavior for UHPC that is still of relatively low
strength. Creep at two compressive strength levels was investigated, namely 9 ksi and
12.5 ksi. These results indicate that significantly less creep will occur after moderate
increases in strength; however, the creep strains observed only 30 minutes after loading a
12.25 ksi cylinder to 10.15 ksi were still over 50% of the elastic strains from the initial
loading. This 30 minute effective creep coefficient of 0.52 is quite high considering that
the long-term final creep coefficient for a 16.5 ksi UHPC loaded after 28 days of curing
is only 0.78.

284
Similar to the shrinkage results discussed above, the creep results indicate that delaying
the stressing of the girder until higher strengths are achieved can be beneficial in terms of
long-term prestressed girder behavior. These higher strengths and the better resistance to
creep can come either from purely delaying the stressing as in the Air treatment regime or
from Steam treating the UHPC prior to application of the prestress.
7.9 Modulus of Elasticity of UHPC
Because compression testing of cylinders is a frequently used quality control method for
structural concrete, engineers often attempt to relate other characteristics of concrete’s
behavior to the compression test results. Many researchers have performed work that
focuses on the relationship between the compressive strength of concrete and its elastic
modulus. This section compares the strength and modulus results of this test program
with the results from predictor equations developed elsewhere.
Recall that the modulus of elasticity testing was completed on compression cylinders
according to the ASTM C469 test method. The results from these tests were presented in
Section 3.3. Table 7.9-A summarizes the overall 28-day results from these tests for each
curing regime along with the compressive strength values.
Table 7.9-A: Compressive strength and modulus of elasticity results
Curing 28-day Compressive Strength Modulus of Elasticity Steam 28.0 ksi 7650 ksi
Air 18.3 6200 Tempered Steam 24.8 7400 Delayed Steam 24.8 7300

285
The American Concrete Institute’s Building Code and Commentary (ACI 318) provides
two relationships for the modulus of elasticity. Equation 7.9-A shows the first
relationship wherein the square root of the compressive strength of concrete is related to
the modulus of elasticity through a scalar factor. In this equation, both the compressive
strength, fc’, and the modulus of elasticity, E, are in psi. This equation was derived from,
and is most relevant to, normal strength and normal weight concrete.
'57000 cfE = (7.9-A)
ACI 318 provides a second relationship for the modulus of elasticity wherein the unit
weight of the concrete is included. This modification allows for estimation of the
modulus of elasticity for concrete with a unit weight between 90 and 155 lb/ft3. This
modification of the estimation equation is important, because both the weight of the
concrete and the modulus of elasticity are normally heavily dependent on the type of
aggregate used. Equation 7.9-B presents this relationship, with ρ as the unit weight of
concrete in lb/ft3. Recall that the unit weight of UHPC is approximately 155 lb/ft3. Using
this unit weight in Equation 7.9-B would result in an equation similar to 7.9-A with a
scalar of 63700. Note that Equation 7.9-B is also the relationship provided in the
AASHTO LRFD Bridge Design Specification.
'5.133 cfE ρ= (7.9-B)

286
The Comité Européen du Beton (Popovics 1998) has presented a different relationship
between the compressive strength and the modulus of elasticity. This relationship is
shown in Equation 7.9-C for metric units and in Equation 7.9-D after being converted
into English units (psi).
33.0' )8(5.9 += cfE (7.9-C)
33.0' )1160(266600 += cfE (7.9-D)
A final relationship between the compressive strength and the modulus of elasticity was
developed by Kakizaki et al. (1992). This research focused on high strength concretes (12
to 20 ksi). After an algebraic manipulation into English units (psi), the equation can be
expressed as shown in Equation 7.9-E.
'43960 cfE = (7.9-E)
A comparison of these published relationships to the data obtained in this study indicates
that some relationships are more applicable than others. Figure 7.9-A plots the four
relationships and the data presented in Table 7.9-A. It is clear that the ACI 318 equations
significantly overestimate the modulus of elasticity in this strength range; however, it
must be stated that this strength range is well outside the typical applicability of these
equations. The Comité Européen du Beton equation is closer but also overestimates the

287
results. The Kakizaki equation slightly underestimates the results with a reasonable level
of accuracy.
All of these equations have a similar form, and three of the four differ only by the scalar
factor. The UHPC modulus of elasticity results were reevaluated to determine what value
of the scalar factor would provide the best fit to the observed results. The result of this
analysis is Equation 7.9-F. This relationship is also shown in Figure 7.9-A and is
recommended as a strength to modulus of elasticity relationship for UHPC regardless of
the curing condition applied.
'46200 cfE = (7.9-F)
The test results presented in Section 3.3 also provide information regarding the modulus
of elasticity increase as the UHPC sets and gains strength. Inclusion of these data points,
collected from the Air treated cylinders between 1 and 21 days removed from casting,
into the compressive strength versus modulus of elasticity relationship provides a fuller
view of the overall behavior of UHPC. Figure 7.9-B shows the data that are included in
Table 7.9-A and the additional modulus of elasticity results. Figure 7.9-B also includes
Equation 7.9-F. The figure clearly shows that this equation is applicable to UHPC over a
wide range of strengths, not just to the final strength values between 18 and 28 ksi.
Therefore, Equation 7.9-F is considered applicable over the compressive strength range
of 4 to 28 ksi.

288
Figure 7.9-A: Modulus of elasticity as a function of 28-day compressive strength
Equation 7.9-F does not accurately estimate the modulus of elasticity for UHPC with a
compressive strength in the 1 to 3 ksi range. The equation can overestimate the modulus
of elasticity by as much as 50%. To rectify this lapse in the applicability of the equation,
a more sophisticated equation was used to approximate the Air treated data shown in
Figure 7.9-B. A best-fit regression analysis was applied to these data to determine a
function that accurately represented the behavior. The simplest function to meet the
0
2000
4000
6000
8000
0 5 10 15 20 25 30
28-day Compressive Strength (ksi)
Mod
ulus
of E
last
icity
(ksi
)
Steam
Air
Tempered Steam
Delayed Steam
57000(fc')^0.5
63700(fc')^0.5
9.5(fc'+8)^0.33
3.65(fc')^0.5
46200(fc')^0.5
57000 fc'0.5
43960 fc'0.5
266600 (fc'+1160)0.33
63700 fc'0.5
46200 fc'0.5

289
requirements was the Log Normal function as shown in Equation 7.9-G. In this equation,
fc’ is the compressive strength of the concrete at a particular age and E is the
corresponding modulus of elasticity, both in psi. This equation can be used to
approximate the modulus of elasticity for compressive strengths as high as 19 ksi.
⎥⎥⎥⎥⎥
⎦
⎤
⎢⎢⎢⎢⎢
⎣
⎡
⎟⎟⎟⎟⎟
⎠
⎞
⎜⎜⎜⎜⎜
⎝
⎛⎟⎟⎠
⎞⎜⎜⎝
⎛
−=
2'
7.144000
ln
21exp7100000
cf
E (7.9-G)
Figure 7.9-B: Modulus of elasticity as a function of compressive strength
7.10 Compressive Stress-Strain Behavior of UHPC
The compressive stress-strain behavior of UHPC has been discussed extensively in this
report, including the material property characterization results presented in Section 3.3
0
1000
2000
3000
4000
5000
6000
7000
8000
0 5 10 15 20 25 30Compressive Strength (ksi)
Mod
ulus
of E
last
icity
(ksi
)
Steam Air
Tempered Steam Delayed SteamAir (< 28 days) Series8
Eqn. 7.11-G
46200 fc'0.5

290
and a further analysis of those results presented in Section 7.9. The current section
presents an analysis wherein an equation is determined that represents the ascending
branch of the compressive stress-strain response for each of the four curing regimes. This
analysis is based on the experimental results presented in Section 3.3.3.
The compressive stress-strain responses of different concretes vary because concrete is a
heterogeneous material without standardized mix designs. Many researchers have
presented analytical approximations for the ascending branch of the compressive stress-
strain behavior, all of which have been based on specific sets of experimental data.
However, this body of research has resulted in minimal consensus on the equation’s
formulation or results (Popovics 1998).
From an experimental standpoint, gathering consistent, accurate data from the full range
of compressive behavior response is very difficult. This fact is primarily due to the
increasingly nonlinear behaviors that concrete tends to exhibit as the strain at the
compressive strength is reached and surpassed. Even if the descending branch of the
behavior is ignored as the compressive strength is approached, the observed straining
behavior of the concrete becomes very dependent on the experimental loading and strain
measurement techniques that have been used.
The preceding discussion leads to the conclusion that any strength values and strain
values from earlier in the concrete response are likely more accurate than strain values
from later in the concrete response. The concrete compressive strength, fc’, and the

291
concrete modulus of elasticity, E, can both be considered to be relatively accurate based
on experimental results. However, the concrete strain at the compressive strength and the
associated secant modulus are both based on strain measurements that are more difficult
to accurately capture and are thus less accurately known. This fact points to a weakness
of many other models of concrete compressive stress-strain behavior, because they are
based on an accurate knowledge of the compressive strain at the peak strength.
Recall from Section 3.3 that a number of specific parameters were quantified within the
compressive stress-strain responses of the UHPC. Intermediate stress and strain level
benchmarks were identified in addition to the standard strength and stiffness measures.
These benchmarks were defined by the decrease in observed stress compared with a
theoretical linear elastic response at a particular strain. Average results for the one, three,
and 5% decrease levels were presented in Table 3.3.3-A. For this analysis, additional
benchmarks were defined at the 10% decrease level and at the cessation of the
continuous, steady increase in stress-strain response. Figure 7.10-A illustrates the stress
decrease factor compared with the linear elastic behavior, α, on a sample Air treated
UHPC compressive stress-strain curve. Sample actual stress, fc, and strain, εc, values are
shown along with the stress and strain differences from the linear elastic response.
These benchmarks were used to define the behavior of each compressive specimen. The
results were then normalized based on the compressive strength and modulus of each
specimen. Note that although the compressive stress normalization is based on the
experimentally obtained compressive strength, the strain normalization is based on the

292
theoretical linear elastic strain at the compressive strength. This normalization technique
minimizes the inaccuracies discussed above by avoiding the use of the actual strain at the
compressive strength. Finally, the results from each curing regime were compiled into
individual data sets.
Figure 7.10-A: Compressive stress-strain behavior compared with linear elastic response
Figure 7.10-B presents the normalized stress-strain response benchmark data points for
the Steam treated UHPC cylinders discussed in Section 3.3. This figure shows the general
shape that the approximation must match to accurately represent the UHPC behavior.
However, it does not allow for easy differentiation between potential curves that fit the
data. A more accurate representation of the overall behavior can be obtained by focusing
on the deviation of the actual behavior of the concrete compared with the theoretical
0
2
4
6
8
10
12
14
16
18
20
0.000 0.001 0.002 0.003 0.004Axial Strain
Com
pres
sive
Stre
ss (k
si)
E1
(εc,fc)
αεc
αεcE

293
linear elastic response. Figure 7.10-C presents the same benchmarks in terms of the
decrease from the linear elastic response compared with the normalized strain. This
presentation highlights the behaviors that must be captured in the model.
Figure 7.10-B: Normalized compressive stress-strain results for Steam treated UHPC
Figure 7.10-C: Deviation from linear elastic compressive behavior for Steam treated UHPC
0.0
0.2
0.4
0.6
0.8
1.0
1.2
1.4
0.0 0.2 0.4 0.6 0.8 1.0 1.2 1.4Compressive Strain (Normalized by fc'/E)
Com
pres
sive
Stre
ss(N
orm
aliz
ed b
y f c
')
11
0.00
0.05
0.10
0.15
0.20
0.25
0.30
0.0 0.2 0.4 0.6 0.8 1.0 1.2 1.4 1.6Compressive Strain (Normalized by fc'/E)
α

294
Figures similar to 7.10-C were created for the other three curing regimes as well. In all
cases, the figures indicate that the UHPC remains close to the theoretical linear elastic
response through much of its behavior. Approximation curves were fit to each of these
data sets. The simplest equation that fits the data moderately well was an exponential
function with two constants as shown in Equation 7.10-A. These constants, a and b, help
fit the equation to the data, and their values for each curing regime are provided in Table
7.10-A. The approximation curve for the Steam treated UHPC is shown in Figure 7.10-C.
aae c
c
bfE
−='
ε
α (7.10-A)
Table 7.10-A: Constants for Equation 7.10-A
Curing Regime a b Steam 0.0010 0.243
Air 0.0114 0.440 Tempered Steam 0.0041 0.341 Delayed Steam 0.0044 0.358
The analysis discussed above leads to a simple means of defining the ascending branch of
the compressive stress-strain response of UHPC. Equation 7.10-B presents the standard
linear elastic relationship between stress and strain with the inclusion of a modifying
factor. This factor, specifically (1-α), determines the extent to which the actual curve
deviates from the linear elastic response. Recall that α is defined by Equation 7.10-A.
Dividing Equation 7.10-B by the compressive strength normalizes the equation and
allows for the direct inclusion of Equation 7.10-A and therefore a single equation

295
defining the normalized compressive stress in terms of the normalized compressive
strain. Recall that this equation was derived to be applicable only for the ascending
branch of the curve.
( )αε −= 1Ef cc (7.10-B)
These relationships were used to create general stress-strain responses for the four curing
regimes. These responses were based on the compressive strength and modulus of
elasticity results presented in Chapter 3. The curves are shown in Figure 7.10-D.
Figure 7.10-D: Compressive stress-strain response approximations
7.11 Development Length of Prestressing Strand in UHPC
Results from two of the UHPC girder shear tests provide an indication of the
development length of 270 ksi low relaxation prestressing strand in this type of concrete.
0
5
10
15
20
25
30
0.000 0.001 0.002 0.003 0.004Compressive Strain
Com
pres
sive
Stre
ss (k
si)
SteamAirTempered SteamDelayed Steam

296
In both tests, sufficient stresses were placed onto prestressing strands with 4 feet or less
of embedment length to cause the strands to rupture.
Section 6.2.1 presents the results from the testing of Girder 28S. Recall that this three-
point loading test setup included a 28 ft total span, a 6.5 ft shear span, and a 4 ft overhang
beyond the shear span. This overhanging portion of the girder allowed for the partial to
full development of the prestressing strands outside of the region of the girder that
traditionally encounters high stresses from flexure or shear. Figure 6.2.1-K shows the
distress that was apparent in this girder at failure. As mentioned in Chapter 6, the failure
of this girder included the simultaneous rupturing of the two strands in the top flange of
the girder directly over the bearing. Because no slip was observed in the instrumented top
strand prior to rupture, it is clear that the full development length of these strands was
less than the 48 in. of embedment between the rupture location and the end of the girder.
The failure of Girder 14S provides further information regarding the development length
of this prestressing strand in UHPC. Recall that this three-point loading test setup
included a 14 ft total span, a 6 ft shear span, and no overhang (i.e., the bearing was
centered 6 in. from the end of the girder). As with all of the girders, half of the strands in
the bottom flange were debonded for 3 feet from the end of the girder. The sequential
rupture of the 12 fully bonded strands in the bottom flange defined the failure of this
girder. Figure 6.2.3-J illustrates the distress apparent in the girder at failure, with the
strand ruptures occurring at the second large bottom flange crack from the right end of

297
the girder. Note that this crack was 37 in. from the right end of the girder, at the precise
location where the full complement of strands became bonded.
Figure 6.2.3-D shows the strand slip behavior for five of the fully bonded strands in the
bottom flange and for five of the debonded strands in the bottom flange, along with one
of the top flange strands. The debonded strands all behaved very similarly, showing
initial slip at an applied girder load of 500 kips, 0.1 in. of slip at the peak girder load of
766 kips, and between 0.35 and 0.5 in. of slip when the fully bonded strands began to
rupture. Of the five fully bonded strands that were monitored, the two in the bottom row
of strands showed no slippage prior to rupture. The three in the second and third rows
from the bottom of the girder showed less that 0.06 in. of slippage, with the slippage
beginning at the girder’s peak load capacity and ceasing when these strands ruptured. The
results from these five instrumented strands indicate that the development length of
UHPC under realistic shear loading conditions is less than 37 in.
The girder test results discussed above indicate that the development length of 0.5 in. 270
ksi low-relaxation prestressing strand in UHPC under realistic full-scale loading
conditions is less than 37 in. In total, one monitored strand ruptured prior to slipping
while being subjected to a flexural tensile loading with 48 in. of embedment, two
monitored strands ruptured prior to slipping while spanning 37 in. through a heavily
distressed shear region, and three strands ruptured after a slight slippage while spanning
37 in. through a heavily distressed shear region. This result is consistent with the findings
of Steinberg and Lubbers (2003) as discussed in Section 2.4.2.

298
7.12 Estimation of Prestress Losses in UHPC Girders
The loss of prestressing force due to instantaneous and long-term effects is an inherent
part of pretensioning concrete. In prestressed concrete, the primary instantaneous effect is
elastic shortening of the concrete member. The long-term effects are comprised of
concrete shrinkage, concrete creep, and relaxation of the prestressing strand.
This section focuses on determining the prestress losses that occurred in the AASHTO
Type II girders. The experimental results for these girders were presented in Chapter 6.
The AASHTO LRFD Bridge Design Specification defines the total loss of prestress as
being comprised of the four effects mentioned above. The specification provides
empirical relationships that can be used to estimate these losses. However, these
estimations are based on conventional concrete technology, thus more accurate
estimations of UHPC girder behavior can be achieved through the use of the
experimental results presented in this report.
The AASHTO Type II girders discussed in Chapters 5 and 6 were each prestressed with
24 strands in the bottom bulb and 2 strands in the top bulb. The fabricator stressed these
270-ksi low-relaxation strands to 55% of their ultimate strength or 149 ksi. The strand
stressing was completed within 1 day prior to the casting of the UHPC. After casting,
approximately 3 days passed before each girder was stressed. The girders were then
steam treated.

299
The time-dependent prestress loss due to shrinkage of the UHPC can be approximated
based on the experimental results presented in Section 3.7. The early age unrestrained
shrinkage of UHPC was determined to be approximately 500 microstrain at 3 days after
casting. The final stabilized asymptotic shrinkage value after steam treatment was
determined to be approximately 850 microstrain. Thus, 350 microstrain of shrinkage can
be expected to occur after the stressing of the girder. The strands can be assumed to have
a stiffness of 28500 ksi; therefore, this shrinkage will reduce the stress in the strand by
10.0 ksi.
The time-dependent prestress loss due to creep of the UHPC can be approximated based
on the experimental results presented in Section 3.8. An elastic analysis of the UHPC
girders at transfer indicates that the stress in the concrete at the centroid of the prestress is
approximately 3.0 ksi. The strength of the concrete at transfer would have been at least
10 ksi and would have continued to increase both before and during steaming until the
final compressive strength of 28 ksi was achieved. Based on this information, the level of
stress on the concrete was clearly at or below 30% of the compressive strength.
The creep coefficient for UHPC can vary depending on the age of the concrete and the
curing treatment that has been applied. The results presented in Chapter 3 indicate that a
creep coefficient of 0.3 can be expected after the Steam treatment, but that the creep
coefficient could be as high as 0.78 if Air treated UHPC is subjected to a compressive
stress equal to 67% of its compressive strength. Based on these results, a reasonably

300
conservative aggregate value for the long-term creep coefficient of UHPC stressed as
described above is estimated to be 0.5.
Additionally, this analysis requires an estimation of the modulus of elasticity of the
UHPC throughout the time frame during which creep is occurring. Experimental results
have indicated that the modulus of elasticity can range from 6200 ksi to 7650 ksi for the
28-day Air treated to Steam treated UHPC, respectively. Also, early age modulus of
elasticity testing has indicated that the modulus of elasticity for 10 ksi UHPC will be
approximately 5000 ksi. Conservatively, the modulus of elasticity for this analysis is
assumed to be 6000 ksi because a smaller modulus will result in larger overall creep
losses.
The goal of this creep analysis is to determine the stress loss in the strands resulting from
the creep strain imparted into the concrete. The creep strain in the concrete is calculated
by multiplying the creep coefficient by the initial concrete strain at prestress transfer.
This concrete strain can be approximated to equal the 3.0 ksi initial prestress divided by
the modulus of elasticity of 6000 ksi. Thus, the creep strain in the concrete is 240
microstrain, and the resulting loss of prestress in the strands is 6.9 ksi.
The elastic shortening loss in the UHPC girder was calculated based on a strain
compatibility analysis of the girder cross-section. All prestressing strands were
considered separately, thus strands at different distances from the neutral axis exhibited
different levels of stress. The modulus of elasticity of the UHPC was assumed to equal

301
5000 ksi at transfer. The elastic shortening of the UHPC girder at the center of gravity of
the prestressing strands is 540 microstrain. Multiplying this value by the modulus of
elasticity of the strands results in an average elastic shortening loss in the strands of 15.4
ksi.
Finally, the time-dependent losses due to strand relaxation after transfer were calculated
based on the relationship provided in the AASHTO LRFD Bridge Design Specification.
The calculation estimates the relaxation loss by relating it to the other three losses
detailed above. Specifically, this loss equals 6 ksi minus 12% of the elastic shortening
loss minus 6% of the creep and shrinkage losses. In total, the strand relaxation loss for the
UHPC girder described above is 3.1 ksi.
The total prestress losses for this prestressed girder equal 35.6 ksi. This value includes the
time-dependent 10.0 ksi shrinkage loss, the 6.9 ksi creep loss, and the 3.1 ksi strand
relaxation loss. It also includes the 15.4 ksi elastic shortening loss that occurs at the
stressing of the girder. Because the girders were only stressed to 55% of the ultimate
strand strength, the time-dependent losses total 14% of the strand jacking stress, and the
instantaneous elastic losses total 10% of the strand jacking stress.
These losses are of similar magnitude to the losses that normally occur in prestressed
concrete girders, which seems to indicate that UHPC provides minimal benefit in terms
of prestress loss behaviors. However, it must be noted that the low level of initial jacking
stress results in a significantly larger percentage of stress loss than would occur with a

302
higher initial jacking stress. Also, the stressing of the girder when the UHPC compressive
strength is 10 ksi results in much higher losses than would occur if the UHPC had
reached 15 ksi or more without the Steam treatment or had reached 28 ksi with the Steam
treatment. These higher compressive strengths would result in decreased shrinkage
strains, decreased creep strains, and a higher modulus of elasticity that would reduce
elastic shortening.
7.13 Flexural Behavior of Prestressed UHPC Girders
The static loading of Girder 80F provided significant information regarding the full-scale
flexural behavior of UHPC girders. The results of this test are presented in Section 6.1.
The following sections provide an in-depth analysis of these test results with a focus on
modeling the global girder behaviors.
7.13.1 Analytical Predictions of Global Behavior
Simple, accepted analytical methods exist for the prediction of the flexural behavior of
prestressed concrete girders. These methods are based both on structural mechanics and
on empirical relationships. In general, these empirical relationships approximate the non-
linear stress-strain behaviors of normal reinforced concrete. Although these analytical
methods cannot accurately model the entire mechanical behavior of UHPC, the flexural
capacity and centerline load-deflection behaviors were analyzed using these techniques
for comparative purposes.

303
Recall from previous discussions that Girder 80F is an AASHTO Type II girder spanning
78.5 feet and composed of 28 ksi UHPC. The girder is prestressed with 24 270-ksi low-
relaxation strands in the bottom flange and 2 strands in the top flange. It contains no mild
steel reinforcement. The strands were all initially stressed to 55% of their ultimate
strength. As discussed in Section 7.12, the time-dependent stress losses in the strands
total 14%.
The initial, elastic behavior of the girder was analyzed through a strain compatibility
analysis. In this analysis the prestress forces are applied to the girder cross-section at
discrete locations, thus allowing strands at different depths from the neutral axis to apply
different force levels onto the girder. The stiffness of the concrete at girder stressing,
Ec,stressing, was approximated to be 5000 ksi for this portion of the analysis, which
determines the elastic shortening losses in the strands. The girder’s self-weight flexural
stresses were also calculated using this concrete stiffness. The time-dependent losses
were then applied to the girder through the use of a second concrete stiffness, Ec,losses.
This value was assumed to be 6000 ksi for Girder 80F.
The preceding analyses determine the state of stress in the girder at the initiation of live
load application. Based on these results, the flexural capacity of the girder can be
approximated. For normal concrete, this analysis requires only an empirical
approximation of the compressive stress-strain behavior. The modeling presented here is
based on the assumptions that the Whitney stress block is applicable to UHPC and that

304
UHPC carries no tensile forces after cracking. This second assumption is significantly in
error, as will be discussed in Section 7.13.5.
The peak load applied to Girder 80F was 178 kips, corresponding to an applied moment
of 38700 k-in. with the neutral axis located 10 in. down from the top of the girder. A
flexural analysis of the girder that was based on the analytical techniques discussed above
indicates that the moment capacity should be 27840 k-in. with the neutral axis located 5
in. down from the top of the girder at failure. An additional flexural analysis was
completed to compare the capacity of this girder to an HPC girder of identical
configuration with a compressive strength of 8 ksi. The modulus of elasticity of this
girder was assumed to be 5150 ksi based on AASHTO LRFD equation 5.4.2.4-1. The
analysis indicates that the flexural capacity of this girder is 20400 k-in. with the neutral
axis located 16.5 in. down from the top of the girder at failure.
Modeling the load-deflection behavior requires further approximations of elastic behavior
limits and inelastic behaviors. Specifically, approximations of the tensile cracking stress
and the effective flexural stiffness of the cross-section are required. AASHTO LRFD
equation 5.7.3.6.2-1 was used to model the post-cracking flexural stiffness of the girder.
The tensile cracking strength, fct, of the UHPC was approximated by the equation for
normal weight concrete presented in AASHTO LRFD Section 5.4.2.6.
Figure 7.13.1-A presents the load-deflection response for Girder 80F and for three other
cases analyzed through the methods discussed above. One of the alternate cases

305
corresponds to the flexural capacity of the 8 ksi HPC girder, and the other two alternate
cases both correspond to the 28 ksi UHPC flexural capacity analysis. The tensile cracking
strength of the 8 ksi concrete is assumed to be 0.67 ksi. The tensile cracking strength of
the 28 ksi concrete is assumed to be 1.25 ksi in one case and 2.9 ksi in the other. These
tensile strengths represent the AASHTO LRFD approximation and the observed tensile
cracking strength, respectively.
A comparison of the observed girder flexural behavior with the three other curves shown
in Figure 7.13.1-A indicates three primary findings. First, it is clear that Girder 80F
carried a significant additional load and displayed significant additional ductility as
compared with the predicted behavior of an 8 ksi HPC girder. Second, the significantly
decreased flexural capacity and residual stiffness of the two theoretical 28 ksi girders
indicate that the elimination of the fiber reinforcement’s contribution to the strength and
stiffness approximations results in a very conservative answer. Finally, the difference
between the two 28 ksi girder theoretical approximations indicates that the tensile
cracking strength of UHPC has a significant impact on the deflection response of a girder
at a particular load level.
7.13.2 Cracking Behavior
The tensile cracking behavior of prestressed UHPC girders has been observed to be
significantly different than would be expected in normal concrete girders. As discussed in
Section 6.1 and as presented in Figure 6.1-H, the tensile flange of this prestressed girder
displayed a very high crack spacing density. Also, the crack spacing throughout the span

306
seemed proportional to the flexural forces applied. The focus of this section is to derive a
general relationship between the cracking behavior of UHPC in the tension flange of a
prestressed concrete girder and the strain observed in the girder.
Figure 7.13.1-A: Predicted behavior of girders tested in the configuration of Girder 80F
The load and strain data collected during the testing of Girder 80F, along with the crack
spacing density observations, allows for the derivation of a relationship between the
apparent UHPC strain and the cracking of UHPC. The basic assumption required to
initiate this derivation is that the girder is undergoing pure flexural behavior with plane
sections remaining plane. Under pure flexural behavior, the neutral axis location and
curvature of the midspan cross-section recorded during the testing of Girder 80F can be
used to derive the effective strain in the bottom flange of the girder at any applied live
load moment. This calculation was performed, and the results for each data point
recorded throughout the test are presented in Figure 7.13.2-A. A curve, also shown in the
020406080
100120140160180200
0 5 10 15 20Centerline Deflection (in.)
Tota
l App
lied
Load
(kip
s) Girder 80F Observed Behavior
fc'=8 ksi, fct=0.67 ksifc'=28 ksi, fct=1.25
fc'=28 ksi, fct=2.9 ksi

307
figure, was then fit through the data to define a continuous relationship between these
two variables.
The preceding analysis has allowed for a general relationship between the applied
moment and the bottom flange strain. The next step is to determine the actual bottom
flange strain in the girder at the load step where the crack spacing observations were
recorded. As previously mentioned, the crack spacing observations were recorded when
the total applied load on the girder was 155 kips, thus defining the applied moment
throughout the span and, with Figure 7.13.2-A, the bottom flange strain. The preexisting
bottom flange strain due to prestress forces and dead load were calculated based on the
known prestress forces, the assumed prestress losses, and the dead weight of the girder.
Recall that the 14% prestress losses resulted in an overall prestressing force of 455 kips at
an eccentricity of 9.15 in. below the elastic neutral axis. The addition of the live load
strains to the preexisting strains results in the total tensile strain that existed in the bottom
flange of the girder at the time of the crack density observations.
The specific crack spacing observations from Girder 80F are presented in Figure 7.13.2-
B. This figure shows the crack spacing in terms of the distance from midspan. The
calculations discussed above allow for the transformation of this distance value into the
strain in the UHPC caused by the prestressing forces, dead load, and live load. The results
of this transformation are presented in Figure 7.13.2-C. This figure, presented in semilog
format, displays the observed crack spacing as related to the strain in the UHPC.

308
Figure 7.13.2-A: Girder 80F midspan bottom flange strain throughout testing
Figure 7.13.2-B: Flexural crack spacing observed on the bottom flange of Girder 80F at a total applied load of 155 kips
Figure 7.13.2-C also presents a curve representing the best-fit equation that was fit to the
strain versus crack spacing results. The equation for this curve is presented in Equation
7.13.2-A. The crack spacing, w, in inches can be determined from the strain, ε, in
0
2000
4000
6000
8000
10000
12000
0 10000 20000 30000 40000Applied Live Load Moment (k-in)
Botto
m F
lang
e St
rain
(m
icro
stra
in) Best-fit Equation
0
1
2
3
4
5
6
7
8
0 5 10 15 20 25Distance from Midspan of Girder 80F (ft)
Crac
k Sp
acin
g (in
)

309
microstrain and the constants a through d that equal 0.113, 71700, -2.25E+06, and
1.44E+07, respectively.
25.1ln
εε
εdcbaw +
++= (7.13.2-A)
Figure 7.13.2-C: Flexural crack spacing related to tensile strain
Alternatively, the crack spacing could be viewed as the independent variable. This
revision allows for the estimation of strain based on crack spacing. Figure 7.13.2-D
revises the previous figure into this more convenient format. This figure also graphically
presents Equation 7.13.2-B. This equation provides a more convenient format for
determining the strain in microstrain based on the crack spacing in inches. Here, the
variables a through c are 450, 500, and 40, respectively.
2wc
wba ++=ε (7.13.2-B)
0.1
1.0
10.0
0 1000 2000 3000 4000 5000
Bottom Flange Tensile Strain (microstrain)
Crac
k Sp
acin
g (in
)
Equation 7.13.2-A

310
Figure 7.13.2-D: Tensile strain related to flexural crack spacing
7.13.3 Effective Moment of Inertia
Elastic flexural analysis was used to determine the stiffness of Girder 80F, including both
before and after flexural cracking of the girder. The testing of Girder 80F included
periodic partial unloading cycles. During these cycles, approximately 30% of the load
was removed from the girder before being reapplied incrementally. The data collected
during the reloading cycles allow for the analysis of the residual elastic behavior of the
girder. This analysis focuses on the load-deflection behavior of the girder.
The load and deflection behaviors recorded during the initial loading of the girder and
during eight unloadings were analyzed. This analysis assumed pure flexural behavior and
a constant UHPC modulus of elasticity, E, of 8100 ksi. Recall that vertical deflections of
the girder were recorded at six locations: midspan (bottom and top flange), both load
points, and both quarter points. The slope of the load-deflection behavior at each
0
1000
2000
3000
4000
5000
0.1 1.0 10.0Crack Spacing (in.)
Botto
m F
lang
e Te
nsile
Stra
in
(mic
rost
rain
)Equation 7.13.2-B

311
potentiometer was determined for each loading or reloading cycle using a best-fit linear
approximation.
These slopes were then used to determine the effective moment of inertia, Ieff, of the
girder as a whole. A revision of standard flexural deflection relationships allows for the
calculation of Ieff through the use of the known geometry of the loading. Equation 7.13.3-
A provides the relationship between the slope of the load deflection response, mP/∆, and
the load, P, and Ieff for deflections measured at the centerline of the girder. This equation
includes variables for the girder span, L, the distance from the bearing to the load point,
a, the dead load of the girder, ω, and the initial uncracked moment of inertia of the cross-
section, Iuncracked. Note that this analysis accounts for the effects of the dead load on the
residual stiffness of the girder.
( )
uncrackedP
eff
IL
mPE
LaLPaI4
/
422
5384
5438ωω
+⎟⎟⎠
⎞⎜⎜⎝
⎛+−
=
∆
(7.13.3-A)
Equation 7.13.3-B is very similar to the previous equation, except that it is a generalized
relationship that is applicable for deflections recorded at any point on the girder between
a bearing and its closest load point. In this equation, x is the distance from the bearing to
the location of the deflection measurement.

312
( ) ( )( )
uncrackedP
eff
IxLxLx
mPE
xLxLxxaLaPxI323
/
32322
224
2332+−
+⎟⎟⎠
⎞⎜⎜⎝
⎛+−+−−
=
∆
ωω for x ≤ a (7.13.3-B)
The analysis described above allows for the determination of Ieff values for the girder at
various load levels and at various locations across the span. The results, presented in
Figure 7.13.3-A, from the six deflection measuring locations were averaged for each load
level. The Ieff values are displayed on the midspan load-deflection response of the girder,
with Ieff being indicated at the location on the curve for which each analysis was
conducted. Note that the value calculated based on the initial loading of the girder is
shown in the lower right corner of the figure.
Figure 7.13.3-A: Effective moment of inertia of Girder 80F
020406080
100120140160180200
0 5 10 15 20Midspan Deflection (in)
App
lied
Load
(kip
s)
Ieff = 27390 in4
Ieff = 30260 in4
Ieff = 32750 in4
Ieff = 38870 in4
Ieff = 46650 in4
Ieff = 52340 in4
Ieff = 51020 in4
Ieff = 49790 in4
E = 8100 ksi I = 52400 in4
Initial Values

313
7.13.4 Flexural Stiffness Under Flexural Loading
Observations gathered during the testing of Girder 80F and calculations completed after
the test indicate that the overall flexural behavior of this girder is more likely to be
accurately modeled by standard structural mechanics than would normally be expected
for concrete girders. The cracking behavior of UHPC wherein the material continues to
possess tensile strength and stiffness after cracking is the driving factor behind this
conclusion. Based on the fact that the deflection and rotation of the girder are known at
all load levels up to failure, it is reasonable to perform a section-based analysis of the
girder wherein the flexural stiffness of the girder at each cross-section will be determined
based on the overall girder behavior.
A flexural analysis of Girder 80F was performed to determine the flexural stiffness of any
cross-section along the length of the girder as a function of the live and dead load
moment, M, applied to the girder at that location. The virtual work analysis technique
was used. Equation 7.13.4-A provides the basic analytical relationship wherein the
moment on the girder, M, is multiplied by the moment, m, generated in the equilibrium
system by a “dummy” load at the location where the deflection, ∆, is desired. The
flexural stiffness of the girder, EI, which also varies along the length of the girder, is
included as well. The integration, or in this case the summation, of nearly 1000 discrete
cross-sectional slices along the length of the girder provides the solution. Note that shear
deformations were excluded from the analysis because they were assumed to be minimal
given the loading and girder configurations.

314
dxxEIxMxm
L
∫=∆0 )(
)()( (7.13.4-A)
In this analysis, the UHPC modulus of elasticity was held constant and the moment of
inertia was allowed to vary to achieve the correct overall flexural stiffness, K. The initial
value for the modulus of elasticity was determined through the method described above
with the uncracked moment of inertia of the girder, Iuncr, equal to 52400 in.4 Recall that
this value is the moment of the inertia as calculated for the transformed section at the
time the girder was tested. The initial elastic behavior of the girder as recorded through
the deflection and rotation gages indicates that the overall modulus of elasticity of the
girder is 8100 ksi. Additionally, recall that the experimentally observed dead plus live
load cracking moment of the girder is 17800 k-in., and the corresponding moment
capacity was 42300 k-in.
The analysis described above was completed on a trial-and-error basis. First, a potential
relationship was proposed between the flexural stiffness and the total moment. The
analysis was performed to determine the resulting deflections and rotations at each of the
potentiometers and tilt meters. This analysis was repeated for each observational step (or
load level) throughout the experimental testing of the girder. The analytical results were
then compared with the experimental observations, and the K versus M relationship was
revised accordingly. The analyses were then repeated until a sufficiently accurate flexural
stiffness was determined.

315
Equation 7.13.4-B provides the flexural stiffness relationship that was computed for this
girder cross-section. This cumulative exponentially modified Gaussian equation relates K
to M through six variables that define the shape of the curve. Figure 7.13.4-A graphically
presents the relationship. Note how the stiffness of the cross-section does not begin to
decrease until the moment has increased well above the cracking moment. This behavior
is due to the cracking spacing behavior and post-cracking load carrying ability of UHPC
as discussed earlier in this chapter.
(7.13.4-B)
with: K = flexural stiffness of girder cross-section, k-in.2
M = live plus dead load moment on girder cross-section, k-in. E = 8100 ksi
Iuncr = 52400 in.4 b = -60300 c = 20730 d = 583 e = 22900 Figure 7.13.4-B presents the results of a comparison between the analytical deflection or
rotation calculated using Equation 7.13.4-B and the experimentally observed behavior.
The results of this comparison are displayed for the six monitored deflections and the two
rotations for each of the 122 observational steps that comprise the girder test. The mean
value of the predicted-to-observed ratio is also presented. This figure shows that the
predicted deflections and rotations are within 5% of the experimental values throughout
nearly the entire test.
⎥⎥⎦
⎤
⎢⎢⎣
⎡⎥⎦
⎤⎢⎣
⎡⎟⎟⎠
⎞⎜⎜⎝
⎛ −+⎟⎟
⎠
⎞⎜⎜⎝
⎛⎟⎠⎞
⎜⎝⎛ −
−+−⎟
⎠⎞
⎜⎝⎛ −
++=eMc
ed
ed
dcM
ee
dcMbIEK uncr 2
2
2exp
22erf
||2erf1
2

316
Figure 7.13.4-A: Flexural stiffness of an AASHTO Type II girder
Figures 7.13.4-C through 7.13.4-F provide graphical representations of the accuracy of
the flexural stiffness model. Figure 7.13.4-C presents the experimentally observed
midspan deflection results and the analytical values. Figure 7.13.4-D focuses on the
deflection results at the load points, and Figure 7.13.4-E focuses on the deflection at the
quarter points. Finally, Figure 7.13.4-F presents the experimental and analytical results
for the rotation at the ends of the girder. In all cases, note the accuracy with which the
analytical model corresponds to the experimentally observed behaviors.
0
50
100
150
200
250
300
350
400
450
0 10000 20000 30000 40000Dead + Live Load Moment (k-in)
Flex
ural
Stif
fnes
s, K
(K x
106 ) (
k-in
2 )
Cracking Moment
Moment Capacity

317
Figure 7.13.4-B: Ratio of predicted deflections and rotations to experimental results
Figure 7.13.4-C: Predicted and observed midspan deflection results
0
50
100
150
200
0 5 10 15 20Midspan Deflection (in)
Tota
l App
lied
Load
(kip
s)
Observed Bottom FlangeObserved Top FlangePredicted
0.75
0.80
0.85
0.90
0.95
1.00
1.05
1.10
1.15
1.20
1.25
0 20 40 60 80 100 120Observation Step
Pred
icte
d / O
bser
ved
West Quarter Point Deflection East Quarter Point DeflectionWest Load Point Deflection East Load Point DeflectionMidspan Deflection Midspan (Top) DeflectionWest Rotation East RotationOverall Average

318
Figure 7.13.4-D: Predicted and observed load point deflection results
Figure 7.13.4-E: Predicted and observed quarter point deflection results
Figure 7.13.4-F: Predicted and observed end rotation results
0
50
100
150
200
0 5 10 15 20Load Point Deflection (in)
Tota
l App
lied
Load
(kip
s)
Observed West Load PointObserved East Load PointPredicted
0
50
100
150
200
0 5 10 15 20Quarter Point Deflection (in)
Tota
l App
lied
Load
(kip
s)
Observed West Quarter PointObserved East Quarter PointPredicted
0
50
100
150
200
0 0.5 1 1.5 2 2.5 3 3.5 4Rotation (degrees)
Tota
l App
lied
Load
(kip
s)
Observed West RotationObserved East RotationPredicted

319
7.13.5 Uniaxial Stress-Strain Model of Girder Flexural Behavior
The effective structural use of UHPC requires knowledge of its uniaxial stress-strain
behavior. An analytical derivation of the uniaxial stress-strain response of the UHPC was
obtained from the experimental results of the flexural testing of Girder 80F. This section
presents the basis of this derivation and the derived stress-strain response.
The testing and instrumentation setup for Girder 80F was presented in Chapter 5, and the
test results were presented in Chapter 6. One principle component of these results was the
strain profile on the midspan cross-section of the girder. This strain profile was
determined based on bonded strain gage readings in uncracked regions of the cross-
section on both faces of the girder. Plane sections are assumed to remain plane in this
analysis; therefore, the strain profile results were then extrapolated to determine both the
strains at the top and bottom of the cross-section and the location of the neutral axis.
Figure 7.13.5-A shows these results for each load step throughout the test. The
experimental results also included the moment applied to midspan of the girder
throughout the test and the composite stiffness of the girder as derived in Section 7.13.4.
Finally, an approximation of the compressive stress-strain response of UHPC was derived
in Section 7.10.
The state of strain in the girder at the initiation of flexural loading must be known to
complete this analysis. Prior to the application of flexural live load, the only stresses at
midspan are caused by the prestress force and the dead load. An analysis was completed
to determine the stresses in the UHPC and the prestressing strands. The basic

320
assumptions in this analysis included that plane sections within the cross-section remain
plane and that strain compatibility between the strands and the concrete is maintained.
The prestressing force and dead load were applied to the girder when its compressive
strength was at least 10 ksi and its modulus of elasticity was 5000 ksi. The prestressing
losses discussed in Section 7.12 were then applied after the modulus of elasticity
increased to 6000 ksi. The compressive stresses in the concrete at the initiation of the
Girder 80F test were determined to be 1.0 ksi at the top of the midspan cross-section and
1.5 ksi at the bottom of the midspan cross-section. The stresses in the strands ranged from
122.2 ksi in the top flange strands to 118.9 ksi in the lowest bottom flange strands.
Figure 7.13.5-A: Experimental strain profile results for midspan of Girder 80F
-6000
-4000
-2000
0
2000
4000
6000
8000
10000
12000
0 20 40 60 80 100 120Load Step
Mic
rost
rain
0
5
10
15
20
Neu
tral A
xis D
epth
(in.
)
Neutral Axis Depth
Bottom Flange Strain
Top Flange Strain

321
These concrete and strand stress values were then transformed into equivalent strain
values on the cross-section. This transformation assumed linear elastic behavior with
8100 ksi and 28500 ksi as the moduli of elasticity for the UHPC and the prestressing
strands, respectively. Thus, the linear strain profile on the cross-section at the Girder 80F
test’s initiation included 123 microstrain of compression at the top of the girder and 190
microstrain of compression at the bottom. The strain in the top prestressing strands was
4287 microstrain, and the four layers of strands in the bottom flange had strains of 4192,
4185, 4178, and 4170 from top to bottom, respectively.
These results provide the basis for the analysis that was completed to determine the full
uniaxial stress-strain behavior of UHPC. The analytical procedure included the following
steps. First, the midspan cross-section of the girder was discretized into 72 concrete slices
and 5 prestressing strand slices parallel to the neutral axis. The strain on each of these
slices at every load step throughout the test was then calculated based on the observed
strain profiles. A complete uniaxial stress-strain response for the UHPC was then
assumed. Using this stress-strain response and assuming that the prestressing strand
behaved linear elastically, the stresses on the cross-section at each load step were
calculated. Note that this analysis initially focused on the loading steps throughout the
test and ignored the unloading and reloading steps.
The summation of the stresses in the concrete and the strands were then compared with
one another to ensure that the internal forces on the cross-section were in equilibrium at
every load step. The assumed UHPC uniaxial stress-strain response was repeatedly

322
modified, and the calculations were recomputed until the internal forces on the cross-
section were sufficiently coincident. Figure 7.13.5-B shows the uniaxial stress-strain
response that was derived through this analytical technique. Figure 7.13.5-C shows the
force in the concrete, the force in the strands, and the ratio of the two values for each load
step. On all loading steps, the concrete and strand forces are within 7% of one another.
This result is considered sufficiently accurate given the experimental variability inherent
in the test results that are the basis for these calculations.
Figure 7.13.5-B is composed of four separate curves. Each curve defines a portion of the
behavior. In compression, the UHPC follows the relationship defined in Section 7.10
with a modulus of elasticity of 8100 ksi. The initial tensile behavior of UHPC is
considered to be linear elastic with an 8100 ksi modulus of elasticity. The post-cracking
behavior of UHPC is defined by the red curve in Figure 7.13.5-B, with an initial modulus
of elasticity of 5000 ksi. The final portion of the behavior is the tensile transition zone
during the initial cracking of the concrete. This transition, highlighted in green on Figure
7.13.5-B, allows the UHPC to transform from an uncracked, elastic material into a
significantly cracked material that is still capable of carrying tensile loads.
Note that the UHPC has to carry 3.0 ksi of tensile stress before the cross-section becomes
sufficiently cracked to cause the stress-carrying capacity to decrease. This value is well
above the tensile cracking strength that was determined in the UHPC material property
characterization testing, because those tests focused on first cracking while the girder test
focused on sufficient cracking to change global behaviors. Small-scale tensile tests tend

323
to limit the load path redundancy thus allowing initial crack(s) to grow longer and wider
prior to other cracks forming. Full-scale prestressed girders offer redundancy through two
means. First, the prestressing strands tend to help maintain tight cracks. Second, the large
scale of the girder eliminates the localized stiffness effects caused by single cracks on
prism flexure specimens.
To complete this analysis, the unloading and reloading behaviors of UHPC were
investigated. Similar to most structural materials, after UHPC undergoes inelastic
deformation, subsequent unloading and reloading of the concrete causes it to behave
linear elastically with a reduced modulus of elasticity. This continues until new strain
levels are attained. In this analysis, UHPC not experiencing peak tensile or compressive
strains was assumed to behave linear elastically with a stiffness equal to the secant
modulus of elasticity of the peak strain ever attained. This assumption was used both in
tension and compression. For the post-cracking tensile behaviors, shown by the red curve
in Figure 7.13.5-B, the origin for the secant modulus was shifted to the location where the
red curve is shown to intersect the x-axis. In the tensile cracking transition region, the
secant moduli were calculated just before and after the transition region. The secant
values in the transition region were then linearly interpolated from these end values.

324
Figure 7.13.5-B: Analytically derived uniaxial stress-strain behavior of UHPC
-30
-25
-20
-15
-10
-5
0
5
-4000 -2000 0 2000 4000 6000 8000 10000Microstrain
Stre
ss (k
si)
-2
-1
0
1
2
3
4
-500 0 500 1000 1500 2000Microstrain
Stre
ss (k
si)

325
Figure 7.13.5-C: Summation of forces on cross-section during loading steps
The results of this analysis are presented in Figure 7.13.5-D. This figure shows the
experimentally captured external moments that were applied to the midspan cross-
section. The figure also shows the internal moments on the cross-section caused by the
assumed stress-strain response at every load step. The results are quite accurate until the
final load steps of the test. At this point, the model tends to overestimate the internal
moment, which is understandable for two reasons. First, the experimentally determined
strain profile on the cross-section is least accurate at these high loads when the cross-
400
600
800
1000
0 20 40 60 80 100 120
Load Step
Forc
e on
Cro
ss-s
ectio
n (k
ips)
Prestressing SteelConcrete
0.8
0.9
1
1.1
1.2
Ratio
Concrete Force / Prestressing Steel Force

326
section is significantly cracked and the neutral axis has moved closer to the top flange.
Second, the method used to determine the uniaxial stress-strain response builds on itself
throughout the test. Therefore, more accuracy is built into the lower tensile and
compressive strain ranges than can be expected in the higher strain ranges.
The final portion of this analysis focuses on determining the stiffness exhibited by the
UHPC throughout its uniaxial behavior. In Section 7.13.4, the stiffness of this UHPC
AASHTO Type II cross-section was determined for the range of applied moments
encountered in this test. Thus, the total stiffness of the midspan cross-section, as analyzed
in this section of the report, should add up to the stiffness determined in Section 7.13.4.
Figure 7.13.5-E presents the results from Section 7.13.4 and the stiffness results from this
analysis. The UHPC stiffness on the loading branch in compression and in tension prior
to cracking was defined by the tangent modulus of elasticity. The stiffness was defined
by the secant modulus of elasticity during unloadings and reloadings, and after cracking.
This method of determining the moment of inertia of the UHPC flexural section provides
very accurate results, with only a slight underestimation of the stiffness after cracking has
occurred, as shown in Figure 7.13.5-E.

327
Figure 7.13.5-D: External and internal moments on midspan cross-section
Figure 7.13.5-E: Internally and externally determined moment of inertia
0
10000
20000
30000
40000
50000
0 20 40 60 80 100 120Load Step
Dea
d an
d Li
ve L
oad
Mom
ent (
k-in
)
Girder 80F Test ResultStress-Strain Model Result
0
10000
20000
30000
40000
50000
60000
0 20 40 60 80 100 120
Load Step
Mom
ent o
f Ine
rtia
(in4 )
Moment of Inertia Defined in Section 7.13.4Stress-Strain Model Result

328
7.14 Shear Behavior of Prestressed UHPC Girders Containing No Mild Steel
Three AASHTO Type II prestressed UHPC girders were failed in shear as part of this
research program. The results of these tests were presented in Chapter 6. This section
combines the results from these three tests. First, the shear capacity results are compared
with the predicted capacity calculation results. Second, the shear cracking behavior of
UHPC is discussed. The final part of this section focuses on a truss model developed to
explain the behaviors observed in one particular shear test.
7.14.1 Predicted vs. Actual Global Behavior
The primary goal of the three full-scale shear tests was to determine the shear capacity of
prestressed UHPC girders. To summarize the results presented in Chapter 6, Girder 28S
had a shear capacity of 384 kips and failed due to a preexisting horizontal crack at the
base of the web. Girder 24S had a shear capacity of 502 kips and failed due to diagonal
tension in the shear region. Girder 14S had a shear capacity of 438 kips and failed due to
a combination of diagonal tension and strand slip. These results indicate that the shear
capacity of a 36-in. deep prestressed concrete girder can be as high as 500 kips without
any standard shear reinforcement. Under a normal loading condition, in which strand slip
might be expected, a shear capacity of more than 400 kips can still be expected.
Predicting the shear capacity of these UHPC girders can be attempted through the use of
standard structural design procedures. However, because UHPC exhibits strengths well
beyond the limits of most structural design codes, those code provisions cannot
necessarily predict the shear behavior of UHPC girders. Most codes predict the shear

329
capacity of prestressed concrete girders by dividing the shear resistance into three terms.
These terms include the contributions from the concrete, the mild reinforcing steel, and
the prestressing strands. Because these UHPC girders contained no mild steel and no
draped strands, the only relevant term is the concrete resistance to shear forces.
For comparative purposes, an AASHTO Type II girder, similar to those discussed in this
report, was analyzed to determine its shear resistance. This prestressed girder was
composed of 8 ksi concrete and contained #4 stirrups at a 4-in. spacing. According to the
AASHTO Standard Bridge Design Specification, this girder would have exhibited a
nominal shear capacity of approximately 250 kips, with half of the capacity coming from
the concrete and half from the stirrups. Although this level of shear capacity is significant
for this depth of girder, it also illustrates the high level of shear capacity achieved with
the UHPC girders.
The Association Française de Génie Civil (AFGC) Interim Recommendations for Ultra
High Performance Fibre-Reinforced Concretes (2002) is one design aid that does directly
address the contribution of fiber reinforcement to shear capacity. In this document, the
ultimate shear strength of the cross-section is defined as the composed portions
contributed by the concrete, the standard steel reinforcement, and the fiber reinforcement.
For the UHPC girders tested in this study, the concrete contribution to the shear capacity,
VRb, is given by Equation 7.14.1-A. In this equation, γEγb is a safety factor defined to
equal 1.5. The compressive strength is fc’, b0 is the web width, and z is the lever arm at
the ultimate moment. All measurements are in metric units. The lever arm is assumed to

330
equal the distance from the center of the compression block to the center of the strands,
or 26.5 in. for these girders. Thus, the design value for the concrete contribution to the
shear capacity is 51 kips. Alternatively, because this equation is being used to model
experimentally observed behaviors, setting the factor of safety terms to equal 1.0 results
in a concrete contribution to the shear capacity of 77 kips.
zbfV cbE
Rb 0'24.0
γγ= (7.14.1-A)
The fiber contribution, Vf, within the AFGC recommended provisions is defined by
Equation 7.14.1-B. The variable S is the area of the shear plane being considered.
This variable is assumed to equal 90% of the web width multiplied by the depth to the
centroid of the prestressing strands. βu is the angle of the compression struts in the shear
area as measured from the horizontal. The assumption that the angle is 40 degrees is a
conservative estimate of the angle based on the prestressed concrete girder behavior. The
variable γbf defines a factor of safety that is set equal to 1.3. Finally, σp defines the
average residual tensile stress carried by the fibers across a shear crack from cracking
until a limiting strain value is achieved. This value is normally based on experimental
tension test results. In this case, based on the results presented in Chapter 3 and in
Sections 7.1 and 7.13, the residual tensile stress will be assumed to be 1.0 ksi. Thus, the
design value for the fiber contribution to the UHPC shear capacity is 156 kips.
Alternatively, setting the factor of safety terms again to 1.0 results in a fiber contribution
to the shear capacity of 170 kips.

331
ubf
pf
SV
βγσtan
= (7.14.1-B)
These girders contain no mild steel reinforcement and the prestressing strands are not
draped; therefore, the concrete and fiber contributions are the only two items relevant to
determining the shear capacity. In total, the AFGC recommendations indicate that the
ultimate design shear capacity of the AASHTO Type II prestressed girders tested in this
study is 207 kips. Eliminating the factor of safety terms produces the true AFGC estimate
of the shear capacity, which is 247 kips. Although this method of estimating the shear
capacity of UHPC girders is more rigorous than many shear capacity calculations, the
method still clearly significantly underestimates the shear capacity of these UHPC
girders.
7.14.2 Cracking Behavior
The shear cracking of the UHPC girders during the shear tests is again indicative of the
structural cracking behaviors associated with UHPC. First, this section discusses the
cracking behaviors observed during the shear tests. Then the cracking behavior of Girder
24S is analyzed to determine the effective prestress force applied to the girder.
Girders 24S and 14S both exhibited diagonal web shear cracking that eventually led to
the failure of the girders. Girder 24S first exhibited shear cracking at a shear load of 254
kips. The cracking initiated in the portion of the shear span closer to the load point,
because this location experienced both high shear stresses and larger flexural forces. The
angle of the shear cracks at this location was approximately 35 degrees from the

332
horizontal. Girder 14S first exhibited shear cracking at a shear load of 205 kips. Again,
shear cracking initiated in the web close to the load point with an angle of 38 degrees
from the horizontal.
The number of shear cracks in both girders increased as the shear load increased.
Initially, the cracks were spaced approximately 1 in. apart throughout the web from the
load point to the bearing. As the test progressed, the crack spacing decreased as more
cracks appeared until the crack spacing had decreased to 0.25 in. or less in some
locations.
As presented in Chapter 5, Girder 24S failed when the fibers bridging a highly stressed
shear crack began to pull out. In this girder, the loss of tensile capacity across the shear
crack resulted in immediate failure because the shear forces could not be redistributed
around the crack. The cracking and eventual fiber pullout across a crack in Girder 14S
resulted in a different type of failure. In this girder, the shear capacity and girder stiffness
decreased simultaneously as the fibers pulled out and the strands slipped, thus allowing
for a slow decrease in shear capacity until over one-fourth of the shear load had been
shed.
The first cracking behavior of a prestressed girder is indicative of both the tensile
cracking strength and the level of prestress applied to the girder. The method used to test
Girder 24S resulted in the prestressing strands fully transferring their stress into the girder
outside of the highly stressed shear region. The analysis of this girder enabled the

333
verification of the prestress force and tensile cracking strength values that were discussed
previously. Shear and flexural strains at cracking on an element in the web of this girder,
located under the rosette strain gage closest to the load point, indicate that 161
microstrain of tension caused cracking. If the tensile cracking strain of UHPC is assumed
to be 200 microstrain, the effective prestress force on this girder would be 455 kips,
which was determined in Section 7.12. Note that a 200 microstrain tensile cracking strain
would correspond to an 8000 ksi modulus of elasticity with linear elastic behavior
through cracking at 1.6 ksi. This tensile cracking behavior is consistent with the
behaviors discussed in Section 3.1.
7.14.3 Simplified Model of UHPC Girder Shear Failure
The girder shear behaviors observed during the testing of Girders 24S and 14S indicate
that the shear behavior of a UHPC I-girder containing no mild steel shear reinforcement
is less complex than is normally associated with a concrete girder. For example,
determination of the shear capacity of a concrete girder could involve the estimation of
the capacity provided by the concrete alone, the capacity provided by the mild steel
reinforcement alone, and the capacity that results from the interaction of the mild steel
reinforcement to enhance the concrete capacity. The terms associated with concrete
behavior are normally difficult to ascertain and are frequently approximated through
empirical relationships. Observations from the UHPC girder tests indicate that the shear
behaviors of a UHPC girder as failure is approached are significantly less complicated
and lend themselves to basic modeling and approximation procedures.

334
The descriptions of the failure of Girder 24S, in particular the photographs shown in
Figure 6.2.2-H, clearly illustrate that the failure of this girder was caused by diagonal
tensile forces in the highly stressed shear region of the girder. Because this UHPC girder
contained no mild steel, this tensile failure of the concrete was not influenced by
reinforcing bars bridging the cracks. Also, because UHPC has a very fine granular
structure, it is not anticipated that any significant level of aggregate interlock could be
present in a UHPC girder. All indications—including the observations of many tightly
spaced cracks parallel to the eventual tensile failure plane—lead to the conclusion that
simply determining the vertical component of the tensile stress capacity over the expected
shear failure plane would lead to the shear capacity of the girder.
This simple analytical procedure is conceptually equivalent to the fiber contribution to
shear capacity (detailed in the AFGC recommended provisions and discussed in Section
7.14.1). In the AFGC design procedure, the fiber contribution to the shear capacity is
composed of terms representing the average tensile capacity of UHPC at failure, the
angle of the failure plane relative to the girder, and a partial depth of the cross-section.
Algebraic manipulation shows that the AFGC equation actually estimates the shear
failure plane area, multiplies it by the average estimated tensile stress over the failure
plane, and converts the result into a vertical component that is useful for shear
calculations.
Thus, the knowledge of two girder specific properties and one material property allow for
the estimation of the shear capacity of the girder. During design, the angle of the failure

335
plane can be estimated based on the level of prestress in the girder. The area of the failure
plane is more difficult to estimate. However, it should be able to be bounded based on the
thickness of the web, the height of the web and web transitions, and the angle of the
failure plane. Finally, the average tensile stress exhibited by UHPC prior to fiber pullout
must be estimated based on prior knowledge of the material behavior.
Test results from Girders 24S and 14S can be used to illustrate the capabilities of this
simple analytical procedure. The failure plane angles in these two girders were measured
to be 28 and 25 degrees from the horizontal, respectively. The peak shear loads carried by
these girders prior to the fiber pullout were 500 and 438 kips, respectively. The depth of
the cross-section that the failure plane traverses can be estimated to be between the depth
of the web, 15 in., and the AFGC recommended depth, 28 in. Observed shear cracking
behaviors during the tests indicate that most diagonal tensile shear loads were carried by
the girders within the web and a small part of the web transitions. Thus, for this analysis
the depth of the failure plane is assumed to be 19 in. By assuming this depth of failure
plane over the width of the web at the failure plane angles mentioned above, the
geometry of the failure surface has been defined. Using these values, the average tensile
stress in Girder 24S is determined to be 2.3 ksi. In Girder 14S the value is determined to
be 1.8 ksi.
These average tensile stress values prior to fiber pullout are reasonable approximations of
UHPC behavior based on results presented elsewhere in this report. The tensile stress-
strain behavior derived in Section 7.13.5 and presented in Figure 7.13.5-B is of greater

336
relevance for this discussion. In that analysis of the flexural loading of a prestressed
girder, the figure shows that the average tensile stress prior to fiber pullout was over 2.5
ksi. Because the shear regions in Girders 24S and 14S were not supplementally
reinforced by prestressing strands like the bottom flange of a prestressed girder, it is
understandable that the average stress across the failure plane might be lower prior to
fiber pullout. Regardless, this analytical procedure clearly provides a reasonable
interpretation of shear failure behavior based on sound engineering principles without
reverting to empirical relationships.
7.14.4 Strut-and-Tie Model of Girder 28S Failure
The fiber reinforced concrete matrix is capable of carrying and dispersing both tensile
and compressive loads. Therefore, in general, truss modeling of UHPC behavior is likely
to be less useful than truss modeling on normal or high performance concrete behavior.
Thus, the tension ties that are a major part of most truss models become significantly less
relevant with UHPC.
However, the final failure of Girder 28S involved crushing of the web concrete and
tensile rupture of the top flange. These behaviors were not expected in a girder shear test,
which lead to the development of a truss model to explain the global behavior at failure.
Recall that this girder test included the development of a shearing plane along the base of
the web in the highly stressed shear region.

337
Figure 7.14.4-A displays the truss system that was developed to model the failure of
Girder 28S. In this figure, the brown dashed lines indicate compression struts while the
solid green lines indicate tension ties. The design of this model includes a complete
delamination of the web from the bottom flange within the highly stressed shear region,
which ensured that no forces were able to transfer across this boundary.
Figure 7.14.4-A: Truss model for failure of Girder 28S
At failure, the applied load on this girder was 500 kips, with 384 kips being carried by the
east support. Given this loading, the forces in kips in the compression struts of the truss
model include: A = -249, B = -359, C = -76, D = -327, E = -235, H = -234, J = -470, K =
-35, P = -785, Q = -541, S = -334, and T = -805. The forces in the tension ties include: F
= 240, G = 247, I = 216, L = 272, and N = 643.
A B C
D E
F
G H I
J K L
N
P Q S T
Applied Load
East Reaction

338
Although truss models provide an upper bound to the solution, an examination of this
answer indicates that it is a reasonable solution. In particular, a detailed analysis shows
that the node connecting seven compression struts just above the bearing is the critical
node. As was observed in the girder test, the compression forces shown in the struts
would create a compression failure of this 28 ksi UHPC at this node. This model also
reasonably predicts the subsequent tensile failure of the top flange above the bearing. The
tension tie shown in Figure 7.14.4-A carries 272 kips. This load is large enough to cause
tensile cracking of the UHPC top flange and to initiate fiber pullout leading to strain
localization in the strands and strand rupture.

339
CHAPTER 8
DESIGN PHILOSOPHY FOR UHPC BRIDGE GIRDERS
8.1 Introduction
The experimental research and associated analytical analyses undertaken in this research
program provide significant insight into the potential structural behavior of UHPC bridge
girders. The design of prestressed concrete I-girders normally focuses on flexural and
shear behaviors. The results of this research program indicate that the flexural and shear
behaviors of prestressed I-girders that are composed of UHPC can be modeled through
straightforward analytical procedures. Therefore, rational design of UHPC I-girders
based on these same analytical principles is possible. This chapter presents a rational
design philosophy for prestressed UHPC I-girders.
8.2 Flexure
The flexural behavior of an AASHTO Type II UHPC girder has been extensively
discussed in this report. The behavior of this girder from initial elastic loading through
failure was analyzed to determine the contribution of the UHPC to the overall flexural
behaviors of the girder. Figure 7.13.5-B provides the analytically determined uniaxial
stress-strain response of UHPC within the girder during the test. With this knowledge, the
flexural design for other prestressed I-girders is possible.
The design of a prestressed UHPC I-girder for flexure requires only two factors. First, a
conservative approximation of the UHPC’s uniaxial stress-strain response must be

340
applied to the cross-section. Second, the occurrence of the expected flexural behaviors
must be ensured. A primary factor must be taken into consideration in an I-girder to
ensure the expected UHPC behavior: Sufficient prestressing strands or mild steel
reinforcement must exist in the primary flexural tensile regions so that cracks in the
UHPC remain tightly closed and closely spaced. Without sufficient gross reinforcement
restraining the tensile flexural regions, individual cracks will begin to widen as the fibers
pull out, and the tightly spaced cracking, shown in Figure 6.1-H, will probably not occur.
Determining a sufficiently conservative approximation of UHPC uniaxial stress-strain
behavior depends on the application and on the prescribed design limits. In a situation
where cracking of the girder is not allowed at service loads, the girder can easily be
designed using normal design procedures with the known modulus of elasticity and
tensile cracking strength of UHPC. In a situation where a minimal amount of cracking
will be allowed at service loads, a post-cracking uniform tensile stress capacity will need
to be assumed. Finally, for the ultimate load state, a full compressive and tensile stress-
strain response will be required. This response will include an effective tensile strain that
causes fiber pullout, a limiting tensile capacity relevant at any strain below the fiber
pullout strain, and a limiting compressive strength.
A conservative uniaxial stress-strain response for UHPC could be described by the
following three conditions. First, the UHPC could be assumed to behave linear elastically
in compression up to 0.85 times the compressive strength. Second, in tension, the UHPC
could be assumed to behave in a rigid-plastic fashion at a conservative percentage of the

341
post-cracking tensile capacity at strains below the tensile pullout strain. Third, based on
the results presented in this report, sample values could include 24 ksi for the
compressive strength, 1.5 ksi for the tensile capacity, and 0.007 for the limiting tensile
strain. Figure 8.2-A graphically presents this sample stress-strain behavior.
Figure 8.2-A: Sample uniaxial stress-strain behavior for I-girder flexural design
Determining the flexural capacity of a UHPC I-girder using a stress-strain response such
as the one shown in Figure 8.2-A can be completed using basic mechanics of materials
concepts. A number of iterations on the neutral axis depth and on the limiting strain
condition will likely be needed before a final solution is reached.
8.3 Shear
The shear behavior of prestressed UHPC I-girders was also extensively discussed in this
report. Three AASHTO Type II prestressed girders that did not contain any mild steel
shear reinforcement or any draped prestressing strands were tested to determine their
-30
-25
-20
-15
-10
-5
0
5
-0.004 -0.002 0 0.002 0.004 0.006 0.008
Strain
Stre
ss (k
si)

342
shear capacity. The shear capacities exhibited by these girders were very large in
comparison to normal AASHTO Type II girders. The behaviors were also very consistent
with the mechanics of materials concepts of the flow of tensile and compressive forces in
the shear region of a bridge girder.
A basic design philosophy, based on these results, is proposed to aid in the shear design
of UHPC girders. The results presented in Section 7.14 indicate that a reasonable
estimate of the shear capacity can be determined by assuming that all shear forces are
carried by diagonal tension and compression in the web of the girder. Given the high
compressive strength of UHPC, the limiting value will be the post-cracking tensile stress
capacity. The shear capacity of a UHPC girder can be conservatively estimated with the
area of the web as a variable and an approximated angle of the diagonal tensile failure
plane in the girder. A conservative estimate of the average tensile stress capacity of
UHPC must be known prior to the fiber pullout.
The analyses discussed in Section 7.14 indicate that the average tensile strengths in the
unreinforced webs of two AASHTO I-girder were 1.8 ksi and 2.3 ksi. In both cases,
conservatively large shear areas were assumed so that the average tensile strength
determined was minimized. Regardless, a conservative estimate of the available average
tensile strength of UHPC could be set at a reasonable percentage of the observed
strengths. From this value, the shear failure plane area required can be determined, which
leads directly to the necessary dimensions of the girder web.

343
To ensure that the expected shear behaviors can occur, the girder must be detailed to
allow for tight crack spacing and small crack widths in the highly stressed shear region.
Therefore, to ensure this cracking behavior, the shear region must be restrained by the top
and bottom flanges of the girder. Additionally, draped prestressing strands that pass
through highly stressed shear regions will also likely help to retard crack growth.
However, even with these details, the crack restraining actions in the web will not be as
efficient as the ones that occur in the bottom flange of a prestressed girder. Thus, the
tensile stress and strain capacities, discussed in Section 8.2, are not expected to be
applicable in this situation.
Finally, determining the state of stress in the girder web under prestressing and dead
loads is important when designing a prestressed girder for shear. The significant
compressive forces in the web could possibly delay the onset of tensile cracking and the
eventual tensile fiber pullout behaviors.

344
CHAPTER 9
CONCLUSIONS AND FUTURE RESEARCH
9.1 Introduction
Ultra-High Performance Concrete (UHPC) is a new type of concrete that exhibits
properties of enhanced strength, durability, and long-term stability. The objective of this
research was to evaluate the potential use of UHPC in highway bridge girders. This
objective was achieved by characterizing UHPC material behaviors through small-scale
specimen testing and by characterizing structural behaviors through full-scale girder
testing.
The research included two experimental phases and one analytical phase. The
experimental phases focused on determining the material and structural behaviors of
UHPC. Over 1000 individual specimens were tested to determine the material
characterization of UHPC. The tests determined the compressive and tensile behaviors,
the long-term stability, and the durability of UHPC. The full-scale bridge girder testing
was conducted on AASHTO Type II prestressed girders. One flexure test on an 80-ft
span girder and three shear tests on shorter span girders were conducted. These girders
did not contain any mild steel reinforcement; therefore, the UHPC carried all secondary
(i.e., shear, temperature, shrinkage) tensile forces. The analytical phase of this research
combined, analyzed, and elaborated on the results from the experimental phases. This
phase included developing predictor equations for basic properties of UHPC and

345
developing a rational philosophy for the flexure and shear design of prestressed UHPC I-
girders.
The conclusions of this study are presented in Section 9.2. A brief discussion of ongoing
and potential future research topics follows in Section 9.3.
9.2 Conclusions
The following conclusions are based on the research presented in this report. For clarity,
the conclusions have been grouped into three sections, focusing on study-wide
conclusions, highway bridge girder specific conclusions, and material characterization
specific conclusions.
9.2.1 General
The following conclusions focus on the overall body of work presented in this report:
1. UHPC displays significantly enhanced material properties compared with
normal and high performance concrete.
2. UHPC is a viable substitute for normal concrete and HPC in prestressed I-
girders.
3. UHPC I-girders can be designed to more efficiently carry flexure and shear
forces. A conservative estimate of the full UHPC tensile and compressive
stress-strain behavior could be used to predict the flexural capacity of an I-
girder. A conservative estimate of the post-cracking tensile capacity could be

346
used to predict the diagonal tensile capacity of UHPC in the shear region of a
girder.
9.2.2 Highway Bridge Girders
The following conclusions focus on UHPC highway bridge girders:
1. The placing of UHPC in an I-girder formwork can be completed very rapidly
with little need for supplemental vibration. UHPC was observed to be
virtually self-placing. The ability of UHPC to be reinforced internally by fiber
reinforcement allows for the reduction or elimination of most mild steel
reinforcement, which greatly simplifies the I-girder formwork preparation.
Without taking any special precautions to release the formwork during setting,
no shrinkage cracks were observed in the girders.
2. The shear capacity of UHPC AASHTO Type II girders that did not contain
any mild steel shear reinforcement or any draped prestressing strands were
between 380 and 500 kips. Traditional shear failure of the girder web, without
any strand slippage, occurred in one girder at 500 kips. Two other girders
failed at lower loads due to strand slippage and to horizontal debonding of the
web from the bottom flange, which resulted from a preexisting defect.
3. The live load flexural capacity of a UHPC AASHTO Type II girder
containing twenty-four 0.5-in. prestressing strands was 38700 k-in. This
increased flexural capacity compared with normal concrete and HPC is
primarily the result of the sustained post-cracking tensile capacity of UHPC.

347
4. The failure of bridge girders composed of UHPC was observed to be
precipitated by the pull out of fibers that were bridging tension cracks in the
concrete. The flexural failure of an AASHTO Type II girder occurred when
the UHPC at a particular cross-section began to lose tensile capacity due to
fiber pullout. This loss of the UHPC tensile capacity necessitated the transfer
of those internal flexural tensile forces onto the prestressing strands. This
transfer then resulted in the rupture of the prestressing strands. The traditional
shear failure of a similar girder was also caused by the loss of tensile capacity
of the UHPC due to fiber pullout. In this loading configuration, the girder
could not redistribute the tensile shear forces through any other load path, thus
the girder rapidly lost all load carrying capacity. A different girder’s shear
failure in combination with strand slip demonstrated that fibers tend to pull
out gradually over a short time frame and that, in the presence of an alternate
load path, the girder can continue to maintain some load carrying capacity.
5. UHPC that is subjected to large tensile strains will exhibit tightly spaced
cracking in a restrained region of a structural member. Crack spacing as small
as one-eighth inch was observed during the structural testing of bridge girders.
The tensile flange of a prestressed girder allows for the very tight crack
spacing due to the prestressing strands ensuring tight cracks and allowing for
the redistribution of some local strain irregularities. The web region of an I-
girder is sufficiently restrained by the top and bottom flanges to exhibit
relatively tight crack spacing, but the web region spacing is not as tight as
occurs in the tension flange under flexural loading.

348
6. The development length of 0.5-in., 270-ksi low relaxation prestressing strands
in UHPC is less than 37 in. The AASHTO Type II girder shear tests indicate
that in a heavily distressed shear region, the prestressing strands will rupture
after only minimal slip if they are embedded at least 37 in. into the UHPC.
9.2.3 Material Property Characterization
The following conclusions focus on the material property characterization of UHPC:
1. Steam-based treatment of UHPC tends to significantly enhance its material
properties. Three steam-based treatments—Steam, Delayed Steam, and
Tempered Steam—were investigated and compared with UHPC that was not
subjected to a curing treatment after casting. In general terms, Steam
treatment increases UHPC’s compressive strength by 53% to 28 ksi, increases
its modulus of elasticity by 23% to 7600 ksi, decreases its creep coefficient
from 0.78 to 0.29, and virtually eliminates long-term shrinkage. Steam
treatment also decreases chloride ion penetrability to a negligible level and
significantly enhances abrasion resistance. The enhancements of material
properties affected by the Delayed Steam and Tempered Steam treatments are
similar to those of the Steam treatment but of a slightly lesser magnitude.
2. UHPC exhibits very high compressive strengths, regardless of the curing
treatment applied. The average 28-day compressive strengths of Steam,
Delayed Steam, Tempered Steam, and Air treated UHPC were found to be 28,
24.8, 24.8, and 18.3 ksi. The compressive strength of Steam treated UHPC
was found to have stabilized by the completion of the curing treatment. Thus,

349
Steam treated UHPC can reach its full compressive strength within 4 days
after casting.
3. The mixing time and rheological properties of fresh UHPC are influenced by
the concrete mixer design, the ambient environmental conditions in the mixer,
and the elapsed time since blending of the premix. A 1934 vintage pan mixer
was successfully used to mix the UHPC; however, the inability of this mixer
to impart significant energy into the mix resulted in extended mixing times.
Low humidity within the mixer and in the mix room can result in stiffer
UHPC. Older UHPC premix requires more mixing to achieve the correct
rheological properties, likely due to the agglomeration of fine particles in the
premix during storage.
4. The set time of UHPC is significantly delayed compared with normal
concrete; final set does not occur until 12 to 24 hours after casting. This time
to set could also be longer depending on the admixtures and on other
constituents in the mix.
5. Once setting has initiated, UHPC gains compressive strength very rapidly. If
maintained at normal laboratory temperatures, UHPC compressive strength
will increase to over 10 ksi by 2 days after setting. Subsequently, the rate of
strength gain will decrease; 14 ksi will be reached by 10 days after setting.
6. The compressive strength of UHPC is not affected by the specimen geometry
used to determine the result. Cylinders with 2-in., 3-in., and 4-in. diameters
were tested according to ASTM C39, and 2 in. and 100 millimeter cubes were
tested according to ASTM C109. The testing was conducted for two batches

350
of Steam treated UHPC and for one batch of Air treated UHPC. In all cases,
the compressive strength results did not vary by more than 8% from the 3 in.
cylinder control result. However, the 2 in. cubes and cylinders did tend to
exhibit a larger standard deviation. The minimal preparation requirements for
a cube specimen and the similarity of results mentioned above make the 100
mm cube a viable specimen geometry for UHPC compressive strength
determination.
7. The curing conditions present during and just after the setting of UHPC can
significantly affect the final properties of the concrete. In the Air treated case,
concrete cylinders that were stripped as final set was being reached exhibited
25% lower 28-day compressive strengths compared with those stripped 1 day
after setting was complete. A 30% difference was observed in the Steam
treated case. These strength differences are likely due to the relatively more
permeable nature of UHPC at earlier ages combined with the very low
moisture content in the UHPC. This low moisture content results in a loss of
water to the surrounding atmosphere and thus reduced hydration of the
concrete.
8. The tensile strength of UHPC, both before and after tensile cracking, is
significantly higher than the strength that occurs in normal concrete. Four test
methods were implemented to capture the tensile strength of UHPC. The
combined results of these tests indicate that the tensile cracking strength of
UHPC is approximately 1.3 ksi after the steam-based curing treatment and
approximately 0.9 ksi without any treatment. Qualitatively, UHPC was

351
observed to exhibit similar levels of tensile strength after cracking; however,
in general, these tests were unable to indicate specific post-cracking strengths.
9. The ASTM C496 split cylinder tension test, modified to capture first cracking,
provides the clearest indication of the tensile cracking strength of UHPC.
Through the use of a hydraulically controlled test machine and minimal
instrumentation, the tensile cracking strength of UHPC can be obtained. Other
tensile tests require more extensive instrumentation, specialization of
specimen geometry, and more sophisticated loading equipment.
Unfortunately, the split cylinder test is not useful for determining the post-
cracking tensile stress capacity, because the biaxial state of stress applied to
the cylinder does not accurately mimic the conditions that are normally
associated with tensile regions in a structural member.
10. The modulus of rupture defined by the ASTM C1018 prism flexure test
overestimates the tensile cracking strength of UHPC by approximately 60%.
This result was confirmed through the completion of this test on 2-in. square
cross-sections with 6, 9, 12, and 15-in. spans, and on 3 in. by 4 in. cross-
sections with a 12-in. span.
11. The ASTM C1018 prism flexure test provides a clear means of comparing the
post-cracking tensile behavior of various fiber-reinforced concretes. UHPC,
regardless of curing treatment, performed exceptionally well according to the
toughness indices defined by this test. For example, the I20 toughness index
normally ranges from 1 to 25 for fiber-reinforced concretes. In UHPC, the I20
results ranged from 28 to 32. Although these results cannot be directly

352
reinterpreted to apply to full-scale structural members, they do indicate that
UHPC can continue to carry significant tensile loads after cracking.
12. UHPC displays durability properties that are significantly beyond those
normally associated with concrete. Regardless of the curing treatment, the
ASTM C666 relative dynamic modulus was at least 95% of the original value
after more than 600 freeze-thaw cycles. UHPC exhibited no scaling under the
ASTM C672 test, even after undergoing approximately 200 cycles. The
chloride ion penetrability as measured by ASTM C1202 was below 50
Coulombs for UHPC that had undergone the steam-based treatment, and was
360 Coulombs for Air treated UHPC 28 days after casting. The Air treated
UHPC results dropped to 76 Coulombs by 56 days after casting. UHPC was
found to be innocuous to alkali-silica reaction.
13. Exposing cracked UHPC split cylinders to an aggressive environment did not
result in any noticeable decrease in the peak tensile load carrying capacity.
Tight cracks, as might be observed in a highly stressed tensile flexural region
of an I-girder, were created by loading cylinders in a split cylinder
configuration. These cracks were on the order of 0.0002 in. wide. A cracked
face of the cylinder was then ponded with a sodium chloride solution as
specified in AASHTO T259. After 90 days of ponding, the cylinders were
tested for peak split cylinder tensile strength. The peak load carrying capacity
of either Steam or Air treated UHPC did not have a discernable decrease after
cracking, thus indicating that the sodium chloride solution did not enter the
cracks and did not cause the fiber reinforcement to deteriorate.

353
14. UHPC exhibits shrinkage behaviors that are somewhat different from those of
normal concrete. In total, UHPC tends to exhibit approximately 800
microstrain of shrinkage as measured from casting through 1 year. However,
shrinkage initiation is affected by the delayed set times associated with
UHPC, and the majority of the shrinkage occurs in a short time frame just
after the concrete has set. Unrestrained shrinkage rates of over 60 microstrain
per hour were observed during the period of rapid strength gain just after
setting. Without any curing treatment, UHPC will continue to shrink at an
ever decreasing rate. Steam treatment accelerates the shrinkage to such an
extent that the entirety of the shrinkage occurs during the two-day treatment,
and the UHPC is then stabilized against further shrinkage. Also, the total
shrinkage in Steam treated UHPC tends to be slightly higher than the
asymptotic shrinkage approached by Air treated UHPC.
15. Large compressive stresses on relatively low strength UHPC can cause
significant short-term creep. This situation is akin to the stressing of
prestressed girders. Eight to thirteen ksi compressive strength UHPC was
loaded to compressive stresses between 60% and 90% of the strength. During
the 30 minutes following the load application, the UHPC exhibited 30-minute
creep coefficients between 0.32 and 0.85. UHPC loaded to over 90% of its
compressive strength failed under the sustained load. The creep that occurred
over this short load duration indicates that the total long-term creep of UHPC
loaded at this compressive strength would be much higher than that observed
in the long-term creep testing.

354
9.3 Ongoing and Future Research
The findings from this report suggest a number of potential topics for future research:
1. Develop optimized bridge girders that take advantage of the material
properties of UHPC. These bridge girders should use the tensile and
compressive capacities of UHPC, while also enhancing the design life of the
bridge as a whole by eliminating many of the less durable components of a
normal bridge.
2. Fabricate full-scale, optimized UHPC bridge girders to resolve problems
associated with casting slender concrete members with fiber reinforced
concrete.
3. Develop a practical test to quantitatively determine the post-cracking uniaxial
tensile behavior of UHPC.
4. Conduct full-scale flexure and shear testing to verify the design philosophies
presented in this report.
The research program discussed herein has already been extended to encompass a portion
of the topics listed above.

355
REFERENCES Acker, P., “Micromechanical Analysis of Creep and Shrinkage Mechanisms,” in Ulm, F.-
J., Z.P. Bazant, and F.H. Wittman (eds.) “Creep, Shrinkage, and Durability Mechanisms of Concrete and Other Quasi-Brittle Materials,” Proceedings of ConCreep-6@MIT, Elsevier, London, 2001, pp. 15-25.
Acker, P., “Why Does Ultra High-Performance Concrete (UHPC) Exhibit Such a Low
Shrinkage and Such a Low Creep?” Autogenous Deformation of Concrete, ACI SP-220, 2004, pp. 141-154, Detroit, MI: American Concrete Institute.
Acker, P., and M. Behloul, “Ductal® Technology: A Large Spectrum of Properties, A
Wide Range of Applications,” Proceedings of the International Symposium on Ultra High Performance Concrete, Kassel, Germany, September 13-15, 2004, pp. 11-23.
Aldea, C., S. Shah, and A. Karr, “Permeability of Cracked Concrete,” Materials and
Structures, V. 32, pp. 370-376. American Association of State Highway and Transportation Officials, AASHTO Standard
Specifications for Highway Bridges, 15th ed., 1992. American Association of State Highway and Transportation Officials, AASHTO LRFD
Bridge Design Specifications, 2002. AASHTO T106, “Standard Method of Test for Compressive Strength of Hydraulic
Cement Mortar (Using 50 mm or 2 in. Cube Specimens),” In American Association of State Highway and Transportation Officials, Standard Specifications for Transportation Materials and Methods of Sampling and Testing, Washington, D.C., 2000.
AASHTO T132, “Standard Method of Test for Tensile Strength of Hydraulic Cement
Mortars,” In American Association of State Highway and Transportation Officials, Standard Specifications for Transportation Materials and Methods of Sampling and Testing, Washington, D.C., 2000.
AASHTO T161, “Standard Method of Test for Resistance of Concrete to Rapid Freezing
and Thawing,” In American Association of State Highway and Transportation Officials, Standard Specifications for Transportation Materials and Methods of Sampling and Testing, Washington, D.C., 2000.
AASHTO T259, “Standard Method of Test for Resistance of Concrete to Chloride Ion
Penetration,” In American Association of State Highway and Transportation Officials, Standard Specifications for Transportation Materials and Methods of Sampling and Testing, Washington, D.C., 2000.

356
AASHTO T260, “Standard Method of Test for Sampling and Testing for Chloride Ion in
Concrete Raw Materials,” In American Association of State Highway and Transportation Officials, Standard Specifications for Transportation Materials and Methods of Sampling and Testing, Washington, D.C., 2000.
AASHTO T277, “Standard Method of Test for Electrical Indication of Concrete’s Ability
to Resist Chloride Penetration,” In American Association of State Highway and Transportation Officials, Standard Specifications for Transportation Materials and Methods of Sampling and Testing, Washington, D.C., 2000.
American Concrete Institute, Building Code Requirements for Structural Concrete, ACI
318, 1995. ASTM C39, “Standard Test Method for Compressive Strength of Cylindrical Concrete
Specimens,” American Society for Testing and Materials Standard Practice C39, Philadelphia, Pennsylvania, 1994.
ASTM C78, “Standard Test Method for Flexural Strength of Concrete (Using Simple
Beam with Third-Point Loading),” American Society for Testing and Materials Standard Practice C78, Philadelphia, Pennsylvania, 1994.
ASTM C109, “Standard Test Method for Compressive Strength of Hydraulic Cement
Mortars (Using 2-in. or [50-mm] Cube Specimens),” American Society for Testing and Materials Standard Practice C109, Philadelphia, Pennsylvania, 1998.
ASTM C157, “Standard Test Method for Length Change of Hardened Hydraulic-Cement
Mortar and Concrete,” American Society for Testing and Materials Standard Practice C157, Philadelphia, Pennsylvania, 1993.
ASTM C227, “Standard Test Method for Potential Alkali reactivity of Cement-Aggregate
Combinations (Mortar-Bar Method),” American Society for Testing and Materials Standard Practice C227, Philadelphia, Pennsylvania, 1997.
ASTM C230, “Standard Test Method for Flow Table for Use in Tests of Hydraulic
Cement,” American Society for Testing and Materials Standard Practice C230, Philadelphia, Pennsylvania, 1998.
ASTM C457, “Standard Test Method for Microscopical Determination of Parameters of
the Air-Void System in Hardened Concrete,” American Society for Testing and Materials Standard Practice C457, Philadelphia, Pennsylvania, 1998.
ASTM C469, “Standard Test Method for Static Modulus of Elasticity and Poisson’s
Ratio of Concrete in Compression,” American Society for Testing and Materials Standard Practice C469, Philadelphia, Pennsylvania, 1994.

357
ASTM C496, “Standard Test Method for Splitting Tensile Strength of Cylindrical Concrete Specimens,” American Society for Testing and Materials Standard Practice C496, Philadelphia, Pennsylvania, 1990.
ASTM C512, “Standard Test Method for Creep of Concrete in Compression,” American
Society for Testing and Materials Standard Practice C512, Philadelphia, Pennsylvania, 1987.
ASTM, “Standard Test Method for Resistance of Concrete to Rapid Freezing and
Thawing,” American Society for Testing and Materials Standard Practice C666, Philadelphia, Pennsylvania, 1997.
ASTM C672, “Standard Test Method for Scaling Resistance of Concrete Surfaces
Exposed to Deicing Chemicals,” American Society for Testing and Materials Standard Practice C672, Philadelphia, Pennsylvania, 1992.
ASTM C944, “Standard Test Method for Abrasion Resistance of Concrete or Mortar
Surfaces by the Rotating Cutter Method,” American Society for Testing and Materials Standard Practice C944, Philadelphia, Pennsylvania, 1995.
ASTM C1018, “Standard Test Method for Flexural Toughness and First-Crack Strength
of Fiber-Reinforced Concrete (Using Beam With Third-Point Loading),” American Society for Testing and Materials Standard Practice C1018, Philadelphia, Pennsylvania, 1997.
ASTM C1202, “Standard Test Method for Electrical Indication of Concrete’s Ability to
Resist Chloride Ion Penetration,” American Society for Testing and Materials Standard Practice C1202, Philadelphia, Pennsylvania, 1997.
ASTM C1260, “Standard Test Method for Potential Alkali reactivity of Aggregates
(Mortar-Bar Method),” American Society for Testing and Materials Standard Practice C1260, Philadelphia, Pennsylvania, 1994.
ASTM C1437, “Standard Test Method for Flow of Hydraulic Cement Mortar,” American
Society for Testing and Materials Standard Practice C1437, Philadelphia, Pennsylvania, , 2001.
Association Française de Génie Civil, Interim Recommendations for Ultra High
Performance Fibre-Reinforced Concretes, 2002. Behloul, M., K.C. Lee, and D. Etienne, “Seonyu Ductal® Footbridge,” In Concrete
Structures: The Challenge of Creativity, FIB Symposium 2004 Proceedings, April 26-28, Avignon, France: Association Française de Génie Civil, 6 pp.
Blais, P.Y., and M. Couture, “Precast, Prestressed Pedestrian Bridge – World’s First
Reactive Powder Concrete Structure,” PCI Journal, Sept.-Oct. 1999, pp. 60-71.

358
Boulay, C., and A. Colson, “A Concrete Extensometer Eliminating the Influence of
Transverse Strains on the Measurements of Longitudinal Strains,” Materials and Structures, V. 14, No. 79, 1981, pp. 35-38, (in French).
Boulay, C., P. Rossi, and J.-L. Tailhan, “Uniaxial Tensile Test on a New Cement
Composite Having a Hardening Behaviour,” in di Prisco, M., R. Felicetti, and G.A. Plizzari, Eds., Fiber Reinforced Concretes – BEFIB 2004, Proceedings of the Sixth International RILEM Symposium, 2004, pp. 61-68.
Builelaar, P., “Heavy Reinforced Ultra High Performance Concrete,” Proceedings of the
International Symposium on Ultra High Performance Concrete, Kassel, Germany, September 13-15, 2004, pp. 25-35.
Carpinteri, A., and B. Chiaia, “Embrittlement and Decrease of Apparent Strength in
Large-Sized Concrete Structures,” Sadhana, V. 27, No. 4, August 2002, pp. 425-448. Cavill, B., and Chirgwin, G., “The World’s First RPC Road Bridge at Shepherds Gully
Creek, NSW,” Proceedings of the Fifth Austroads Bridge Conference, Hobart, Australia, May 2004.
Chanvillard, G., and S. Rigaud, “Complete Characterization of Tensile Properties of
Ductal® UHPFRC According to the French Recommendations,” Proceedings of the 4th International RILEM Workshop on High Performance Fiber Reinforced Cement Composites (HPFRCC4), Ann Arbor, Michigan, June 15-18, 2003, 14 pp.
De Larrard, F., A. Belloc, S. Renwez, and C. Boulay, “Is the Cube Test Suitable for High
Performance Concrete?” Materials and Structures, V. 27, No. 174, 1994, pp. 580-583. Hajar, Z., A. Simon, D. Lecointre, and J. Petitjean, “Construction of the First Road
Bridges Made of Ultra-High-Performance Concrete,” Proceedings, 2003 International Symposium on High Performance Concrete, Orlando, Florida, October 2003, 18 pp.
Hegger, J., D. Tuchlinski, and B. Kommer, “Bond Anchorage Behavior and Shear
Capacity of Ultra High Performance Concrete Beams,” Proceedings of the International Symposium on Ultra High Performance Concrete, Kassel, Germany, September 13-15, 2004, pp. 351-360.
Horszczaruk, E., “Abrasion Resistance of High Strength Fiber-Reinforced Concrete,” in
di Prisco, M., R. Felicetti, and G.A. Plizzari, Eds., Fiber Reinforced Concretes – BEFIB 2004, Proceedings of the Sixth International RILEM Symposium, 2004, pp. 257-266.

359
Kakizaki, M., Effect of Mixing Method on Mechanical Properties and Pore Structure of Ultra-High Strength Concrete, Katri Report No. 90, Kajima Corporation, Tokyo, 1992, 19 pp.
Li, V., “Engineered Cementitious Composites (ECC) – Tailored Composites Through
Micromechanical Modeling,” Fiber Reinforced Concrete: Present and Future, Ed. N. Banthia, Canadian Society of Civil Engineers, 1997, 213 p.
Li, V.C., H.-C. Wu, M. Maalej, and D.K. Mishra, “Tensile Behavior of Cement-Based
Composites with Random Discontinuous Steel Fibers,” Journal of American Ceramic Society, V. 79, No. 1, Jan. 1996, pp. 74-78.
Li, Z., F. Li, T.P. Chang, and Y. Mai, “Uniaxial Tensile Behavior of Concrete Reinforced
with Randomly Distributed Short Fibers,” ACI Materials Journal, V. 95, No. 5, Sept.-Oct. 1998, pp. 564-574.
Morris, A.D., and G.G. Garrett, “A Comparative Study of the Static and Fatigue Behavior
of Plain and Steel Fibre Reinforced Mortar in Compression and Direct Tension,” International Journal of Cement Composites and Lightweight Concrete, V. 3, No. 2, 1981, pp. 73-91.
Nanni, A., “Splitting-Tension Test for Fiber Reinforced Concrete,” ACI Materials
Journal, V. 85, No. 4, Jul.-Aug. 1988, pp. 229-233. Neville, A.M., Properties of Concrete, Fourth and Final Edition, John Wiley & Sons,
Inc., New York, 1996. Petroski, H.J., and R.P. Ojdrovic, “The Concrete Cylinder: Stress Analysis and Failure
Modes,” International Journal of Fracture, V. 34, 1987, pp. 263-279. Phillips, D.C., and B.S. Zhang, “Direct Tension Test on Notched and Unnotched Plain
Concrete Specimens,” Magazine of Concrete Research, V. 45, No. 162, 1993, pp. 25-35.
Popovics, S., Strength and Related Properties of Concrete, John Wiley & Sons, Inc.,
New York, 1998. Rapoport, J., C.-M. Aldea, S.P. Shah, B. Ankenman, and A. Karr, “Permeability of
Cracked Steel Fiber-Reinforced Concrete,” ASCE Journal of Materials in Civil Engineering, V. 14, No. 4, Jul.-Aug. 2002, pp. 355-358.
RILEM, TC 162-TDF, “Test and Design Methods for Steel Fibre Reinforced Concrete –
Recommendations: Uni-axial Tension Test for Steel Fibre Reinforced Concrete,” Materials and Structures, V. 34, Jan.-Feb. 2001, pp. 3-6.

360
Rossi, P., “High Performance Multimodal Fiber Reinforced Cement Composites (HPMFRCC): The LCPC Experience,” ACI Materials Journal, V. 94, No. 6, Nov.-Dec. 1997, pp. 478-483.
Russel, B.W., and N.H. Burns, “Static and Fatigue Behavior of Pretensioned Composite
Bridge Girders Made with High Strength Concrete,” PCI Journal, V. 38, No. 3, May-June 1993, pp. 116-128.
Saito, M., and S. Imai, “Direct Tensile Fatigue of Concrete by the Use of Friction Grips,”
ACI Journal, V. 80, No. 5, 1983, pp. 431-438. Semioli, W.J., “The New Concrete Technology,” Concrete International, Nov. 2001, pp.
75-79. Steinberg, E., and A. Lubbers, “Bond of Prestressing Strands in UHPC,” Proceedings,
2003 International Symposium on High Performance Concrete, Orlando, Florida, October 2003, 15 pp.
Stiel, T., B. Karihaloo, and E. Fehling, “Effect of Casting Direction on the Mechanical
Properties of CARDIFRC®,” Proceedings of the International Symposium on Ultra High Performance Concrete, Kassel, Germany, September 13-15, 2004, pp. 481-493.
Tawfig, K., “Cracking and Shear Capacity of High Strength Concrete Bridge Girders,”
FL/DOT/RMC/612(1)-4269, Jan. 1995, 145 pp. Tawfig, K., “Cracking and Shear Capacity of High Strength Concrete Bridge Girders
Under Fatigue Loading,” FL/DOT/RMC/612-7896, Nov. 1996, 124 pp. Timoshenko, S., and J.N. Goodier, Theory of Elasticity, 2nd Edition, McGraw-Hill Book
Company, New York, 1951. USBR 4914, “Procedure for Direct Tensile Strength, Static Modulus of Elasticity, and
Poisson’s Ratio of Cylindrical Concrete Specimens in Tension,” United States Department of Interior, Bureau of Reclamation, 1992.
Wang, Y., V.C. Li, and S. Backer, “Experimental Determination of Tensile Behavior of
Fiber Reinforced Concrete,” ACI Materials Journal, V. 87, No. 5, Sept.-Oct. 1990, pp. 461-468.
Zhang, J., H. Stang, and V. Li, “Experimental Study on Crack Bridging in FRC Under
Uniaxial Fatigue Tension,” Journal of Materials in Civil Engineering, ASCE, V. 12, No. 1, Feb. 2000, pp. 66-73.
Zheng, W., A.K.H. Kwan, and P.K.K. Lee, “Direct Tension Test of Concrete,” ACI
Materials Journal, V. 98, No. 1, Jan.-Feb. 2001, pp. 63-71.


CURRICULUM VITAE
Benjamin Allen Graybeal is a research engineer employed by PSI, Inc. as a contractor for the Federal Highway Administration’s Turner-Fairbank Highway Research Center. Since 2001, his work has focused on structural concrete research including characterization of structural materials and large scale structural testing of bridges and bridge members. From 1998 to 2001, he worked at Turner-Fairbank as a research engineer focusing on the nondestructive evaluation of highway structures. While at Turner-Fairbank, Mr. Graybeal has presented research findings on topics ranging from Ultra-High Performance Concrete to visual inspection of highway bridges to automated inspection of steel welds. He has authored ten proceedings papers and presented results at equally many national and international conferences. Mr. Graybeal is a Professional Engineer in the State of Virginia. Mr. Graybeal received his Bachelor of Science in Civil Engineering from Lehigh University in May of 1996. He earned a Master of Science in Structural Engineering from the same school in May of 1998. His Master’s thesis, titled “Confinement Effectiveness of High Strength Spiral Reinforcement in Prestressed Concrete Piles”, focused on the full scale testing of spirally reinforced columns and the development of a rational design procedure for the proportioning of the reinforcement. The present report was completed for his doctoral dissertation at the University of Maryland, with anticipated graduation in May 2005.