Embed Size (px)
Citation preview
ABSTRACT
Title of Document: EVALUATION OF THERMAL INTERFACE
MATERIALS AND THE LASER FLASH METHOD
Vinh Khuu, Doctor of Philosophy, 2009 Directed By: Chair Professor, Michael Pecht,
Department of Mechanical Engineering
Thermal interface materials (TIMs) are used to reduce the interfacial thermal
resistance between the chip and the heat sink, which has become a bottleneck to heat
removal in a variety of electronic applications. Degradation in thermal performance
of the TIM can contribute to unacceptably high chip temperatures, which can
significantly impact device or system performance during operation. While progress
has been made in recent years in the development of tools to measure beginning-of-
life thermal performance, characterizing the long-term performance of the TIM can
be crucial from a life cycle stand point since TIMs may experience harsh operating
conditions, including high temperature and high humidity, for extended periods of
time in typical applications.
The laser flash method is one approach for measuring thermal conductivity
that has an advantage over more commonly used techniques because of the non-
contact nature of the measurement. This technique was applied to 3-layer structures to

investigate the effects of thermal cycling and elevated temperature/humidity on the
thermal performance of select polymer TIMs in pad form, as well as an adhesive and
a gel. While most samples showed little change (less than 10% in thermal resistance)
or slight improvement in the thermal performance, one thermal putty material showed
degradation due to temperature cycling resulting from bulk material changes near the
glass transition temperature. Scanning acoustic microscope images revealed
delamination in one group of gap pad samples and cracking in some putty samples
due to temperature cycling.
Finite element simulations and laser flash measurements performed to validate
the laser flash data indicated that sample holder plate heating, an effect previously
unexamined in the literature, can lead to inaccurately high TIM thermal conductivity
values due to suppression of the sample temperature rise during the laser flash
measurement. This study proposed a semi-empirical methodology to correct for these
effects. Simulated laser flash test specimens had bondlines that showed little
thickness variation (usually within the measurement error) due to clamping by the
sample holder plates. Future work was proposed to refine the laser flash sample
holder design and perform additional validation studies using thermal test vehicles
based on nonfunctional packages.
EVALUATION OF THERMAL INTERFACE MATERIALS AND THE LASER FLASH METHOD
By
Vinh P. Khuu
Dissertation submitted to the Faculty of the Graduate School of the University of Maryland, College Park, in partial fulfillment
of the requirements for the degree of Doctor of Philosophy
2009 Advisory Committee: Professor Michael Pecht, Chair Professor Avram Bar-Cohen Professor Christopher Davis Associate Professor Patrick McCluskey Dr. Michael Osterman Professor Peter Sandborn

© Copyright by Vinh Khuu
2009

ii
Dedication
To my parents

iii
Acknowledgements
I would like to thank Professor Pecht for the opportunity to work at CALCE
and his support of my work and Dr. Osterman for his support of my research. I am
grateful for the help that Professor Bar-Cohen provided on many thermal aspects of
my research and in general for broadening my interests and knowledge of thermal
packaging. Thanks to Professors McCluskey, Sandborn, and Davis for serving on my
dissertation committee and for providing helpful comments on the dissertation.
I wish to express my sincere gratitude to CALCE staff members for assistance
in experiments and for providing feedback during morning meetings, notably Ahmed
Amin, Dr. Michael Azarian, Dr. Diganta Das, Sony Mathew, Dr. Keith Rogers,
Anshul Shrivastava, and Bhanu Sood.
The CALCE and TherPES students and visiting scholars have been an
invaluable resource throughout my PhD career. Vidyu Challa deserves mention for
help with scanning acoustic microscope measurements and ANSYS viscoelastic
modeling. I appreciate Mark Zimmerman’s assistance in reviewing papers. I
gratefully acknowledge the financial support of the CALCE consortium for much of
the TIMs research.
Finally, I would like to thank my family, especially my parents, for their
constant support of my education. It is a privilege to offer the successful completion
of my doctoral studies as a testament to the hopes and dreams they brought to this
country nearly three decades ago.

iv
Table of Contents Dedication ..................................................................................................................... ii Acknowledgements ...................................................................................................... iii Table of Contents ......................................................................................................... iv List of Tables ............................................................................................................... vi List of Figures ............................................................................................................. vii Nomenclature ............................................................................................................... ix Chapter 1: Introduction ................................................................................................. 1
Background and Motivation ..................................................................................... 1 Problem Statement .................................................................................................... 5 Research Objectives and Approach .......................................................................... 5 Dissertation Overview .............................................................................................. 8
Chapter 2: Literature Review ........................................................................................ 9 Thermal Interface Material Reliability and Degradation ........................................ 13 Thermal Conductivity Measurement Techniques ................................................... 23 Laser Flash Method................................................................................................. 27
Chapter 3: Reliability Tests ........................................................................................ 31 Theory of the Laser Flash Method .......................................................................... 31
Basic Operation ................................................................................................... 31 Multilayer Analysis ............................................................................................. 32
Experimental Approach .......................................................................................... 35 Laser Flash Test Samples.................................................................................... 36 Laser Flash Test Sample Holder ......................................................................... 38 Sample Preparation ............................................................................................. 41 Reliability Test Procedure ................................................................................... 44 Reliability Test Conditions ................................................................................. 45
Results ..................................................................................................................... 46 Room Temperature Observations ....................................................................... 46 Temperature Cycling Test (-40 to 125 °C) ......................................................... 48 Temperature Cycling Test (-55 to 125 °C) ......................................................... 54 Analysis of Putty B Thermal Performance Degradation .................................... 56 Elevated Temperature/Humidity Results ............................................................ 59
Chapter 4: Validation of Laser Flash Results from Reliability Tests ......................... 63 Modeling Approach ................................................................................................ 63
Thermal Simulations ........................................................................................... 63 Structural Simulations ......................................................................................... 65
Experimental Results .............................................................................................. 67 Modeling Results .................................................................................................... 71
Thermal Simulations ........................................................................................... 71 Structural Simulations ......................................................................................... 83
Comparison of Laser Flash Data with Steady-State Data ....................................... 89 Steady-State Tester Design ................................................................................. 89 Time-Dependent Steady-State Measurements of Gel Samples .......................... 92

v
Absolute Steady-State Thermal Conductivity Comparison ................................ 93 Steady-State Measurement Uncertainty Analysis ............................................... 94
Laser Flash Uncertainty Analysis and Convergence Study .................................... 94 Chapter 5: Conclusions and Recommendations ........................................................ 99
Conclusions ............................................................................................................. 99 TIM Reliability Study ......................................................................................... 99 Laser Flash Method Study ................................................................................ 101
Contributions......................................................................................................... 102 Recommendations for Future Work ...................................................................... 106
Appendix ................................................................................................................... 108 Bibliography ............................................................................................................. 113

vi
List of Tables Table 3.1 TIM test samples.
38
Table 3.2 TIM bondline thicknesses.
43
Table 3.3 TIM layer thermal resistance at room temperature.
47
Table 3.4 TIM layer thermal resistance under temperature cycling (-40 to 125 °C).
48
Table 3.5 Calculated TIM thermal resistance under temperature cycling (-55 to 125 oC).
55
Table 3.6 Calculated Putty B thermal conductivity based on laser flash measurements.
57
Table 3.7 Calculated TIM thermal resistance under 85 oC/85%RH. 60
Table 4.1 Comparison of laser flash measurements with vendor values: a) square test coupons; b) round test coupons.
68
Table 4.2 TIM thermal conductivity based on laser flash measurements with aluminum and Lexan sample holder plates.
71
Table 4.3 Calculated TIM thermal conductivity based on simulation of Gap Filler assuming no contact resistance between the TIM test sample and sample holder plates.
77
Table 4.4 Calculated TIM thermal conductivity based on simulation of Gap Filler using 320 mm2 square samples varying contact resistance between the TIM test sample and sample holder plates.
78
Table 4.5 Steady-state TIM z-displacement.
87
Table 4.6 Steady-state TIM z-displacement of Gap Pad A.
88
Table 4.7 Comparison between experimental TIM thermal conductivity values with datasheet values.
94
Table 4.8 Comparison of Laser Flash Measurements with Vendor Values.
97
Table 4.9 Uncertainty analysis overview of Gap Filler laser flash measurements.
98
vii
List of Figures Figure 2.1 Schematic illustration of TIM usage in a flip-chip BGA
architecture.
10
Figure 2.2 Illustration of TIM thermal resistance.
12
Figure 3.1 Illustration of the laser flash method.
32
Figure 3.2 Configuration used for laser flash measurements of clamped 3-layer test samples.
33
Figure 3.3 TIM thermal resistance measurement and calculation.
35
Figure 3.4 Overview of the experimental procedure.
36
Figure 3.5 Illustration of TIM gap pad bondline.
37
Figure 3.6 Illustration of clamped TIM assembly.
39
Figure 3.7 TIM sample holder plates with coupons.
40
Figure 3.8 Pump-out in the putty A samples: a) Before temperature cycling; b) After 255 temperature cycles.
50
Figure 3.9 a) Non-temperature-cycled Gap Pad A sample b) Temperature-cycled Gap Pad A sample (after 760 cycles).
53
Figure 3.10 a) Non-temperature-cycled Putty A sample b) Temperature-cycled Putty A sample (after 760 cycles).
53
Figure 3.11 Putty B storage modulus as a function of temperature.
58
Figure 4.1 Overview of TIM thermal conductivity calculation procedure.
65
Figure 4.2 Effect of area on TIM thermal conductivity based on the laser flash measurements.
69
Figure 4.3 Effect of area on TIM thermal conductivity based on the laser flash measurements of Gap Filler.
70
Figure 4.4 Thermal finite element mesh.
72
Figure 4.5 Temperature rise profiles from laser flash simulations.
73
viii
Figure 4.6 Local heat flux profile on top clamping plate from laser flash simulations.
74
Figure 4.7 Local temperature rise profiles throughout assembled test structure from laser flash simulations: a) y-axis scale from 0 to 8 K; b) y-axis scale from 0 to 1.2 K.
75
Figure 4.8 Output TIM thermal conductivity based on FEA simulation as a function of input TIM thermal conductivity.
81
Figure 4.9 Structural finite element mesh (5.9 mm opening, 16.4 mm/side square test specimen): a) open; b) solid.
84
Figure 4.10 Z-displacement (m) of Putty B at a 25% TIM compression level: a) open; b) solid.
86
Figure 4.11 Steady-state thermal resistance test vehicle: a) TIM tester schematic; b) assembled TIM tester.
91
Figure 4.12 Measured gel thermal conductivity after high temperature cure.
93
Figure 4.13 Calculated TIM thermal conductivity as a function of thermal diffusion time ratios of 3-layer copper-Gap Pad A-alloy 42 test specimen.
96

ix
Nomenclature
R = thermal resistance
Ha = hardness
m = mean asperity slope
P = contact pressure
kh = harmonic mean thermal conductivity
σ = root mean squared surface roughness
Rjc = junction-to-case thermal resistance
Ea = activation energy
A = acceleration factor
kb = Boltzmann constant
t = time
T = temperature
k = thermal conductivity
BLT = bond line thickness
αCTE = CTE
τ = shear stress
G = shear modulus
l = length
E = Young’s Modulus
A = cross-sectional area
ν = Poisson’s ratio
t1/2 = half-rise time
x
L = thickness
α = thermal diffusivity
ηi = square root of the heat diffusion time
H = volumetric specific heat
V = normalized temperature
X = function of H
ω = function of the heat diffusion time ratio
Q = heat pulse function
τtime = shear stress decay time
1
Chapter 1: Introduction
Background and Motivation
It is generally believed that when two solid surfaces are joined together in
mechanical contact, only 1 to 2% of the effective areas are in actual physical contact
due to the imperfect contact interface caused by gaps and asperities (Prasher, 2006).
In microelectronic applications, this often leads to high resistance heat paths. Due to
increasing power dissipation levels occurring in a variety of electronic devices,
minimizing the total thermal resistance between the chip and the ambient
environment can be crucial in maintaining component operating temperatures at
acceptable levels. Current thermal management strategies must address decreasing
volumes and more stringent thermal requirements, which have caused interfacial
thermal resistance to become a bottleneck to heat removal (Nakayama and Bergles,
2003).
Thermal interface materials (TIMs) play a critical role in the thermal
management of electronics by providing a path of low thermal impedance between a
heat-generating element, such as a chip, and a heat dissipating element, such as a heat
sink. In many microprocessor and discrete RF applications, TIMs, despite aiding heat
dissipation, can account for 30 to 50% of the total thermal resistance budget,
including the component package up to the ambient environment (Lasance, 2003). A
wide array of TIM types, such as greases, phase change materials, pads, films, and
adhesives are now commercially available. The selection process can be challenging
2
since the overall performance of a TIM depends on many factors including process
variables, assembly conditions, bulk material properties, and properties of the
interface. Characterizing the thermal performance of thermal interface materials in a
manner representative of actual applications can be critical since erroneous selection
may lead to greater-than-expected thermal resistances in the thermal path.
In many automotive, military, and space applications, TIMs experience harsh
operating conditions, including high temperature and high humidity, for extended
periods of time. Degradation in the thermal performance of the TIM during its
operating life can impair device or system performance, lead to malfunctions, or
cause premature failure (Gowda, 2005). For instance, Chiu et al. (2001) showed that
thermal grease pump-out (the gradual squeezing out of the grease from the interface
gap) after 2000 power cycles can lead to a 50% increase in interfacial thermal
resistance while Gektin (2005) showed that 5% voiding in a TIM 1 material (die-to-
heat spreader) can lead to over a 70% reduction in overall system thermal
performance.
Few models of TIM degradation exist, however. In fact, predicting
degradation in thermal conductivity as a function of environmental stress conditions
over time is not possible with the current level of understanding. The lack of accurate
physics-based models to describe TIM degradation behavior has necessitated
improved experimental techniques (Prasher, 2006). In addition, product data on
reliability is often not provided by TIM vendors, and if reliability data is made
available, which reliability tests are used, how they are conducted, and how thermal
conductivity is measured can vary dramatically among manufacturers. Obtaining
3
accurate reliability data often involves additional design challenges beyond those
encountered in beginning-of-life (BOL) thermal performance testing. Having the
capability to accurately capture changes in the contact component of the thermal
resistance throughout a reliability test is essential for TIM thermal characterization
since many degradation and failure mechanisms affect or originate at the contact
interface between the TIM and the mating surface.
Evaluating TIM reliability using steady-state material tests, such as those that
follow ASTM-D5470 (2006), a test standard commonly used by TIM manufacturers
can be challenging. Assessing the impact of environmental exposure with material
tests would involve subjecting test specimens to environmental exposure conditions
(usually in a test chamber) and then measuring the thermal conductivity using the
instrument outside the chamber. In a steady-state material tester, high contact
pressures, which are needed to ensure good thermal contact between the test
specimen and the hot and cold blocks, can complicate the measurement of low
modulus or viscoelastic specimens due to the possibility of disturbing the specimen in
the process of loading and unloading it from the tester. Test specimens should remain
undisturbed between environmental exposure and thermal conductivity measurements
to ensure accurate TIM degradation data.
Thermal test vehicles, which typically consist of heating elements,
temperature sensors, and dummy processors designed to replicate TIM application
environments, represent another common approach to measuring TIM thermal
conductivity and can approximate the stresses and strains in the TIM during
environmental exposure more accurately than material test approaches. However,
4
thermal test vehicles can be costly and time consuming to develop and may not be
suitable if high absolute accuracy is required.
The laser flash method is another approach for measuring thermal
conductivity that has advantages over other techniques because of the non-contact
nature of the measurement. An established technique for bulk material testing of thin
solid test specimens, it has also been used to study solders, adhesives, and thermal
greases (Gowda et al., 2005; Chiu et al., 2002; Campbell et al., 1999, 2000).
However, one common criticism of the technique is that assembled samples don’t
simulate loading conditions in typical applications (Smith et al., 2008). Some have
also noted that the absolute error can be high when measuring multilayer test
specimens since other thermal and mechanical properties need to be known (stacked
up uncertainties) and the method can be difficult or impossible to use when the
coupons/substrates and the TIM have differing thermal diffusivities (Lee, 1977).
Practical considerations limiting its wider use by customers are the relatively high
cost of a typical laser flash instrument and the fact that the method is not commonly
used by TIM vendors and end-users, making comparisons with non-laser flash data
difficult. These criticisms have not yet been thoroughly examined in the literature and
many questions remain as to how to apply the laser flash method to obtain accurate
and realistic thermal resistance data suitable for assessing reliability, particularly of
TIMs in pad form. Use of the laser flash method for TIM characterization was
examined in this study and the validity of a few criticisms were explored in depth.
This research builds on the existing knowledge of TIM characterization techniques
and TIM degradation behavior and addresses some perceived deficiencies of the laser
5
flash method, which may nevertheless offer advantages over more commonly used
steady-state thermal conductivity measurement techniques.
Problem Statement
Although studies are available on the thermal performance of solders,
adhesives, and thermal greases, little literature exists on the reliability of TIMs in pad
form and gels. Temperature cycling and elevated temperature/humidity conditions are
commonly encountered in the service life of electronic systems, particularly those
used in automotive, space, and military applications, but their effect on thermal
performance has not yet been studied for TIMs in pad form and thermal gel. While
the laser flash method has been applied to the study of solders and adhesives, a few
thermal and mechanical issues that can contribute to error have not yet been
addressed in the literature, notably heating of test sample clamping plates during laser
flash measurements, clamping of the test specimen, and coupon-TIM thermal
diffusivity differences.
Research Objectives and Approach
The first part of this study, which focused on the reliability of polymer TIMs,
examined the effects of temperature cycling as well as elevated temperature and
humidity on TIM layer thermal resistance using the laser flash method. The thermal
performance throughout the reliability tests were determined using thermal resistance
values based on laser flash measurements, and the physical changes were examined
6
using scanning acoustic microscopy and other techniques. Additional measurements
were performed to quantify the amount that room temperature effects contributed to
changes throughout environmental exposure.
The second part of this study explored the application of the laser flash
method to the evaluation of the reliability of TIMs. The effects of sample holder plate
heating, which were studied using simulation as well as experimentation, were
examined by varying the sample coupon size and varying the contact pressure. With
sample holder plate heating effects present, which may lead to inaccurately high TIM
thermal conductivity values, this work investigated how to interpret and incorporate
the laser flash method to measure changes in thermal resistance. The influence of
clamping plates structurally on the TIM layer was also investigated using finite
element simulation. Although it is known that TIM thermal conductivity values can
be inaccurate or impossible to determine when the thermal diffusivities of the coupon
or substrate layers differ significantly from that of the TIM layer, criteria for
acceptability assuming a 3-layer resistive case of the Lee method have not yet been
established. To address this need, numerical analysis was performed to determine if
an acceptable range of thermal diffusion time ratios (coupon to TIM layer thermal
diffusion time) could be determined.
The research goals are summarized in the following objectives:
1. Use the laser flash method to measure the thermal performance of TIMs
subjected to reliability test conditions.
2. Explain the causes of thermal performance degradation.

7
3. Assess the effects of sample holder plate heating, clamping, and error due to
coupon-TIM thermal diffusivity differences on measured TIM thermal conductivity
values.
4. Validate thermal resistance measurements obtained from the laser flash
method using a steady-state thermal resistance measurement method.
Objective 1 focuses on measuring the thermal performance changes of select
polymer TIMs subjected to three reliability tests (two temperature cycling and one
elevated temperature/humidity test). Objective 2 is intended to explain the thermal
resistance changes measured using the laser flash method. This involves assessing the
effects of environmental exposure on TIM coupon interfaces using scanning acoustic
microscopy, visual inspection, as well as other analysis techniques needed to explain
the causes of any observed degradation.
Objectives 3 and 4 are intended to validate the laser flash data obtained in
objective 1. The third objective addresses three aspects of conducting laser flash
measurements that are studied in the context of TIM reliability evaluation using
thermal resistance values. These include determining the effects of varying the
coupon/substrate areas on calculated TIM thermal resistance values, assessing the
impact of clamping TIM samples in laser flash measurements, and determining if
thermal diffusion time ratios could be used as criteria to identify TIM-substrate
material combinations and thicknesses suitable for the laser flash method.
Objective 4 relates to the accuracy of data obtained using the laser flash
method to measure changes in thermal resistance, and how values compare overall to
8
steady-state techniques, which are generally more accurate and more widely accepted
in the industry.
Dissertation Overview
The work is organized as follows. Chapter 2, which focuses on background
literature, discusses experimental techniques, previous degradation studies, and
theoretical models of TIM degradation, which serve as the foundation for a discussion
of the need for improved experimental techniques to measure TIM degradation.
Emphasis is placed on the laser flash method, and its advantages over other methods.
Chapter 3 describes the fundamentals of the laser flash method and the test fixtures
used in this study. Details about the reliability test procedure and measurement
conditions are also provided. Experimental data from the reliability tests are presented
as well as additional analysis using scanning acoustic microscopy and
thermogravimetric analysis to explain observed thermal performance degradation for
two groups of TIM samples. Chapter 4 presents the results of the laser flash study,
intended to validate data obtained in the TIM reliability study. The analysis addresses
factors contributing to error in the thermal diffusivity measurement as well as how
well the test structures simulate realistic mechanical loading conditions, primarily in
the bondline thickness variation. Finally, Chapter 5 summarizes the important results
with recommendations on TIM selection based on the reliability study findings and
describes ways to ensure accurate measurements and the effects of characteristics of
the samples holder plates and 3-layer laser flash test specimen for measuring TIM
specimens.
9
Chapter 2: Literature Review
Managing thermal contact resistance has been a central issue in the design,
assembly, and operation of electronics and electrical equipment since the days of
vacuum tubes (Nakayama and Bergles, 2003). Theoretical and experimental research
over the past half century has provided insight into the underlying mechanisms
governing heat transfer through contacting solid structures, which can occur as
conduction through contact spots, conduction through an interstitial medium, or as
radiation. Methods to address thermal contact problems from basic principles
typically have involved approximating the geometry and using mechanical
deformation models combined with thermal models of heat transfer (Madhusudana,
1995; Yovanovich, 2005). This has led to the development of correlations, such as the
following expression, describing the solid–solid contact resistance Rcs between two
nominally flat surfaces assuming plastic deformation of the asperities:
95.08.0⎟⎠⎞
⎜⎝⎛=
PHa
mkR
h
σ (2.1)
where Ha is the hardness, σ is the root mean squared surface roughness, P is the
contact pressure, kh is the harmonic mean thermal conductivity, and m is the mean
asperity slope. The use of TIMs to reduce thermal contact resistance has a long
history, and early published literature describes their use in spacecraft thermal control
applications (Cunnington, 1964). The growth and development of the semiconductor
industry since the invention of the transistor, which has placed increasing demands on
thermal management, has resulted in a wide array of TIMs available on the market,

10
which differ in construction, composition, performance, cost and intended
application. While solder, metal foil, graphite, and carbon nanotube TIMs have
received attention in recent years (Rodgers et al., 2005), polymeric TIMs are the
focus of this research due to their widespread availability. Polymer TIMs, which are
typically either dispensed or in pad form, consist of a polymer matrix filled with
highly conducting particles to enhance their thermal conductivity.
While TIMs can be found in applications ranging from portable electronics to
datacenters, their use in flip chip configurations has led users to employ a
classification scheme based on their location within the system. Either they are inside
the component package at the die-heat spreader interface (Type 1) or outside the
package at the heat spreader-heat sink interface (Type 2), as illustrated in Figure 2.1.
Die attach material are sometimes classified as Type 0 TIMs (Rodgers et al., 2006).
heat sink
TIM 2
component
board
TIM 1
Figure 2.1: Schematic illustration of TIM usage in a flip-chip BGA
architecture.
While the primary function of a TIM is to dissipate heat from the chip to
allow higher processing speeds, the ability of the TIM to absorb strain resulting from
the mismatch of coefficients of thermal expansion (CTEs) of the die, substrate, and

11
the integrated heat spreader (IHS) during temperature cycling is also important.
Furthermore, cooling microprocessors requires not only maintaining the average
temperature below a design point, but also reducing the temperature of hotspots. Even
though the use of TIMs generally leads to an improvement over bare solid-solid
contact, degraded TIM thermal performance remains an important concern due to the
potential to affect the total junction-to-ambient thermal resistance, which can impact
chip performance, as has been described in several experimental and analytical
studies (Jung et al., 2003; Singhal et al., 2004; Somasundaram et al., 2008; Li et al.,
2008).
While mechanical, electrical, and cost considerations can influence the
selection of the optimal TIM for a given application, thermal performance most
directly reflects the primary function. In the past decade, physics-based models have
been developed to estimate the thermal performance of TIMs, expressed as a thermal
resistance or effective conductivity. The thermal resistance, R, across a TIM layer
was used in this study to describe the thermal performance and can be expressed by
the sum of the thermal contact resistances, Rcontact1 and Rcontact2, at each interface and
the bulk resistance of the TIM:
21/ contactcontactTIMtotal RRkBLTR ++= (2.2)
where BLT is the bondline thickness and kTIM is the bulk thermal conductivity of the
TIM layer. This formulation assumes 1-D heat flow in a direction perpendicular to the
interface. These thermal resistances are illustrated in Figure 2.2.
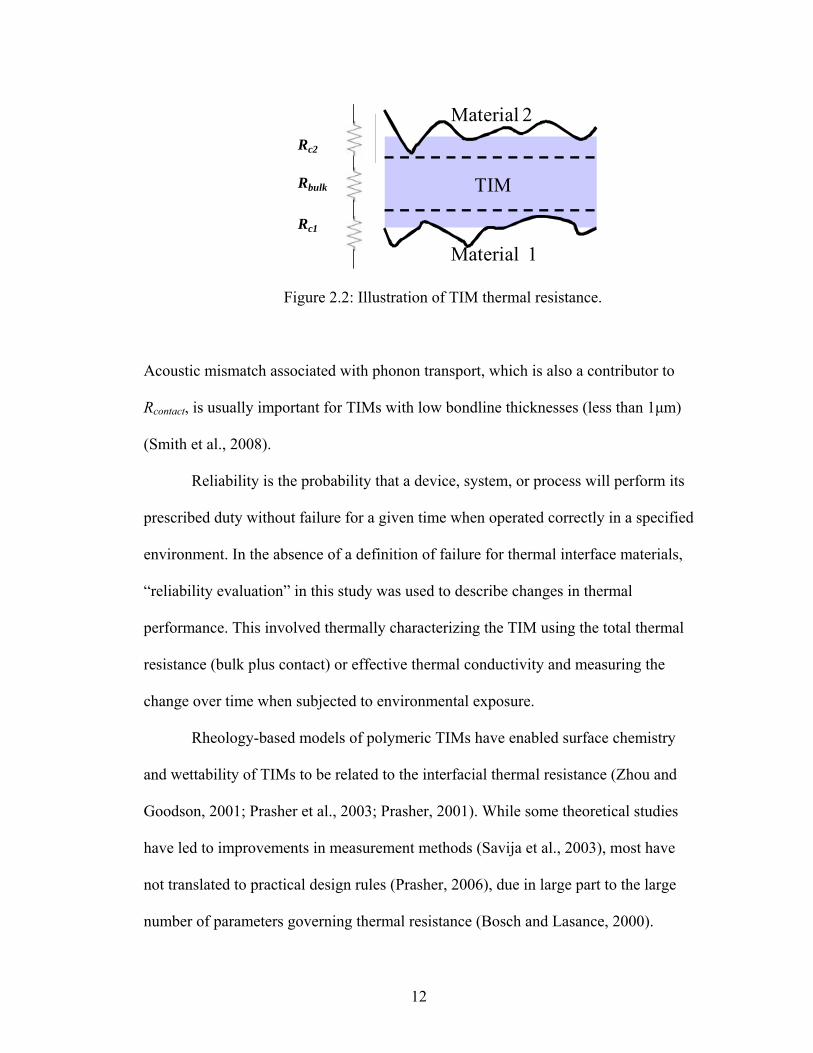
12
Rbulk
Rc2
Rc1
TIM
Material 2
Material 1
Figure 2.2: Illustration of TIM thermal resistance.
Acoustic mismatch associated with phonon transport, which is also a contributor to
Rcontact, is usually important for TIMs with low bondline thicknesses (less than 1μm)
(Smith et al., 2008).
Reliability is the probability that a device, system, or process will perform its
prescribed duty without failure for a given time when operated correctly in a specified
environment. In the absence of a definition of failure for thermal interface materials,
“reliability evaluation” in this study was used to describe changes in thermal
performance. This involved thermally characterizing the TIM using the total thermal
resistance (bulk plus contact) or effective thermal conductivity and measuring the
change over time when subjected to environmental exposure.
Rheology-based models of polymeric TIMs have enabled surface chemistry
and wettability of TIMs to be related to the interfacial thermal resistance (Zhou and
Goodson, 2001; Prasher et al., 2003; Prasher, 2001). While some theoretical studies
have led to improvements in measurement methods (Savija et al., 2003), most have
not translated to practical design rules (Prasher, 2006), due in large part to the large
number of parameters governing thermal resistance (Bosch and Lasance, 2000).
13
Several experimental studies have explored the dependence of interfacial thermal
resistance on surface characteristics (shape and curvature) (Stern et al., 2006), TIM
layer properties (bondline thickness, filler particle size, fraction, and modulus) (Dean
and Gettings, 1998; Han, 2003), and contact pressures (Bharatham et al., 2006).
Gowda et al. (2003) studied the effects of filler particle size and distribution on the
performance of thermal greases. Matayabas and LeBonheur (2005) focused on cured
gels in examining how to optimize filler particle size and modulus to achieve reliable
performance. Since the accuracy of models in predicting TIM thermal performance is
still limited, however, improved experimental techniques are critical for
characterizing TIM thermal performance.
Most TIMs research prior to 2000 was experimental in nature, and several
literature reviews are available summarizing the historical theoretical and
experimental developments related to TIMs as well as those made in recent years
(Prasher, 2006; Smith et al., 2008; Goel et al., 2008; Dani et al., 2005; Sarvar et al.,
2006; Liu et al., 2006; Linderman et al., 2007). This literature review provides an
overview of TIMs research with an emphasis on reliability and degradation and will
consider the following topics: reliability and degradation mechanisms of TIMs,
thermal conductivity test methods for TIMs, and the laser flash method.
Thermal Interface Material Reliability and Degradation
The proper selection of a TIM often requires considering not only the
beginning-of-life thermal performance, but also the reliability, which is often not
characterized by TIM manufacturers. Environmental conditions, assembly conditions,
14
and properties of the TIM and neighboring structures play key roles in determining if
and how a TIM experiences thermal performance degradation during its operating
life.
The effects of temperature cycling and elevated temperature and humidity,
which are addressed in this study, are potential concerns for polymer TIMs. These
conditions may be encountered in harsh operating environments, such as those
experienced by automotive, space, and avionic applications. Temperature cycling
may be problematic for elastomeric TIM pads if there is a large mismatch in
coefficients of thermal expansion between the mating surfaces, which can lead to loss
of contact at one or more surfaces (Viswanath et al., 2002).
In many instances, degradation in performance due to high temperature can be
explained by considering the bulk behavior of polymers. For silicones or siloxanes (a
commonly used material for both TIMs in pad form as well as dispensed TIMs),
prolonged exposure to heat can cause degradation of the siloxane network, resulting
in hardening of the bulk polymer, which over time can leave the polymer dry and
brittle and cause it to lose adhesion to metal interfaces (Dal, 2004). Breakage of
polymers can be caused by scission of highly linked polymer bonds into free radicals
and monomers (Tummala and Rymaszewski, 1997). Elevated temperature produces
low-molecular-weight cyclic compounds that can cause bulk polymers to crack
(Clarson and Semlyen, 1993). Cracks at the interface or through the bulk of the
material can increase thermal resistance at the interface due to the discontinuity of
heat flow. For silicone, hardening and cracking occurs at temperatures exceeding 180
°C, which is well above the recommended operating temperature usually specified in

15
TIM datasheets. In fact, silicone should be relatively resistant to high temperature due
to the high dissociation energy of the Si-O bonds (Dal, 2004). Luo et al. (2001)
measured only a 2 percent decrease in thermal conductance for a silicone-based paste
and up to a 46 percent decrease for non-silicone pastes after isothermal heating at
100°C for 24 hours. The addition of either Al2O3 or ZnO fillers into silicone rubber
increases both the thermal conductivity and thermal stability but reduces its CTE
(Sim et al., 2003). However, it is also important to note that silicones are susceptible
to hydrolysis due to the presence of polar Si-O bonds (Dal, 2004).
Past work on the impact of temperature on TIMs reliability has been
experimental in nature. In one of the few attempts to model TIM degradation, Samson
et al. (2005) proposed an Arrhenius-type equation based on an empirical curve fit to
express degradation of thermal performance with time due to elevated temperature for
a phase change material:
⎟⎟⎠
⎞⎜⎜⎝
⎛ −+==
TkE
tAtRtRb
ajcjc exp)0()( (2.3)
where Rjc is the junction-to-case thermal resistance, A is an acceleration factor, Ea is
the activation energy for the TIM, kb is the Boltzmann constant, T is temperature, and
t is time.
Moisture in an elevated temperature environment can also cause polymer
thermal interface materials to degrade in performance. Silanol formation causes loss
of hydrophobicity and adhesion due to migration of hydrophilic Si-OH groups into
the exposed surface. This can lead to delamination on metal surfaces. Despite this,
moisture can also improve network formation at low temperatures (Dal, 2004). Dal
(2004) presented failure and material analysis findings of silicone-based thermal paste
16
exposed to moisture and high temperature plus moisture. Using a model for moisture
diffusion into a thermal interface between the heat spreader and the chip with
variables of temperature, humidity and exposure time, Zou et al. (2006) found that
shear strength degrades with increasing moisture content, but the shear modulus does
not correlate with moisture level in the thermal compound.
Although few studies have addressed the effects of humidity on polymer gap
pad pads, fillers, and gels, some studies have examined the effects on polymers used
in non-TIM electronic applications. Gomatam and Sancaktar (2004) observed reduced
adhesion strength of adhesives exposed to a 90% RH environment. In tests performed
by Prabhakumar et al. (2003), the adhesion properties of epoxy-based adhesives did
not change significantly due to temperature/humidity testing, although the silicone-
based adhesives experienced a drastic drop in adhesion strength.
The change in interfacial contact resistance caused by elevated temperatures
was of interest in this study since it was hypothesized that delamination could cause
degradation in thermal performance for gap pads, gap fillers, and putties, which are
generally regarded as being among the most reliable TIM types. However, increased
wetting of the surfaces may also occur, leading to reduced thermal resistance at the
interfaces (Gowda et al., 2005). Furthermore, in an elevated moisture environment,
reduced adhesion strength and thermal contact of the TIM could result in increased
thermal resistance (Gomatam and Sancaktar, 2004). It is important to note that for
many silicone-based TIMs, thermal performance may improve over the course of
environmental exposure. Material in a softened stage can experience stress relaxation
and can better conform to surface irregularities; or silicone extraction may occur,
17
which causes silicone oil to fill in small gaps and asperities that would otherwise
impede conduction across the interface. One goal of this study was to determine
whether degradation due to temperature cycling and elevated temperature/humidity
occurs in select polymer TIMs and to quantify the change in thermal performance.
Many of the most well known examples of degradation affect dispensed
TIMs, such as thermal greases. Because greases do not cure as gels and epoxy
adhesives do, they are susceptible to pump out, which is caused by the expansion and
contraction of the TIM layer, causing it to squeeze out of the interface gap. One trade-
off associated with pump-out is that lower bondline thickness results in lower thermal
resistance, but too low of a bondline thickness may result in regions with a lack of
TIM coverage, resulting in local temperature rises.
Standoffs have been shown to mitigate the effects of pump out (Sikka et al.,
2002). Brunschwiler et al. (2007) developed a method to address the problem of
pump out in thermal greases. Their method consists of using nested channels to
control the flow of the TIM and prevent pump out. Hierarchically nested channels
(HNCs), which are etched onto a mating surface, allow thermal grease to flow easily
in predefined paths during thermal cycling, alleviating many of the pressure gradients
that can lead to pump-out (Brunschwiler et al, 2007). It is important to note that this
solution requires that the die/heat spreader surface include these channels, which may
be costly to incorporate from a manufacturing standpoint.
From a material integration standpoint, gels appear to be an attractive option
because of their reduced propensity for pump-out. Prasher (2006) showed that gel
pump out depends on the ratio G’/G” (storage/loss modulus). Prasher and Matayabas

18
(2004) proposed that insufficiently cured gels exhibited grease-like behavior, which
leads to the formation of voids. They also noted, however, that lower shear modulus
values lead to lower initial thermal resistance, which suggests an optimal range of
shear modulus values that can ensure reliable gel thermal performance. Emerson et al.
(2005) showed that the flow of the matrix resin in a thermal paste depends on the
Peclet number, defined as τw/τs, (where τw is the characteristic time for fluid filtration
and τs is the characteristic time for deformation of the concentrated suspension).
When the Peclet number is greater than one, filtration effects are important. This
results in the tendency of filler particles to separate from the rest of the grease.
Nnebe and Feger (2008) examined dry-out in thermal greases using optical
microscopy and IR thermography. Local variations in the grease microstructure
caused by inhomogeneities in the distribution of the filler particles as well as matrix-
filler compatibility can affect the susceptibility of a thermal grease to degradation,
particularly at low bondline thicknesses (where the thickness is less than 10 times the
largest filler particle size). In aged greases, Nnebe and Feger (2008) applied theories
describing fluid flow through porous media to examine the impact of matrix-filler
interaction.
While reliability problems such as pump out and dry-out have been reported
to occur for thermal greases after prolonged use (Viswanath et al., 2002), the
reliability of gap pads and gap fillers has received less attention. The relatively large
bondline and the inability of gap pads to flow and fill in the microscopic crevices at
the interfaces contribute to the low thermal performance compared to greases, gels,
and solders. Maguire et al. (2005) incorporated thermal gap pads into their case study
19
of TIMs in high power amplifier designs while Gwinn and Webb (2003) compared
the performance of a variety of TIMs, including gap pads, using published data. The
performance over time when subjected to stress was not evaluated in either of these
studies. Viswanath et al. (2002) reported that typical failure mechanisms in thermal
pads are increased thermal resistance due to inadequate pressure or loss of contact at
one or more interfaces. The extent of degradation of TIMs in pad-form and its causes
have yet to be fully described in the literature and were therefore examined in this
study, along with an adhesive and gel.
Experimental studies of degradation of TIMs in packages are common in
industry. In a series of tests including HAST, high temperature storage (150 °C), and
temperature cycling (-55 to 125 °C), Islam et al. (2008) showed that adhesives
outperformed greases and gels due to the excessive voiding, which decreased
mechanical strength and thermal performance. In contrast to their perceived
characteristic behavior, gels were still found to be susceptible to voiding, pump out,
and other degradation issues. Li et al. (2008) performed qualification tests of TIMs in
FC-PBGA (flip chip plastic ball grid array) configurations at both the component
level and the system level under temperature cycling and elevated humidity. Their
results showed that the thermal characteristics and mechanical integrity of the
selected TIM can be evaluated using the same stress conditions used in package
reliability qualification. Zheng et al. (2009) employed packaged TIMs to explain how
hygroscopic expansion and TIM bondline deformation during reflow and moisture
soaking at 85 oC/85% RH drives delamination.

20
Polymer and solder TIMs are susceptible to voiding and delamination, which
are of particular concern when introduced into the package during assembly (Gektin,
2005; Hu et al., 2004). Delamination and voiding have similar effects on the thermal
performance despite the fact that voids can occur deeper into the bulk of the TIM
while delamination occurs at the interface. Voids and delamination near a hot spot
can have a dramatic effect on the maximum chip temperature (Gektin, 2005). Voids
are defects that can be a few millimeters to several hundred nanometers in length, so
although they are often visible at the macro level, they can also occur at the micron or
submicron levels. Voids form when air becomes trapped as the TIM flows during
assembly and can result from insufficient volume or outgassing during curing
(Gowda et al., 2004). During the manufacturing process, voids can form in the die
attach bond layer, and grow and coalesce during thermal cycling and elevated
temperature conditions (Fleischer et al., 2006). In comparing stencil printing to
dispensing of adhesives, Mukadam et al. (2004) examined the effects of heat ramp
rate and peak temperature and showed that the initial part of the cure profile up to the
material gelling temperature largely determines void size distribution.
The similarities between TIMs (types 1 and 2) and die attach materials both in
function and composition make degradation models of die attach materials attractive
in explaining many form of TIM degradation. Sundararajan et al. (1998) described the
shear stress distribution in the die attach layer of a power electronic component
during thermal cycling or power cycling to predict the life of the chip by die attach
fatigue. Thermal fatigue of solder is one example where a large body of work exists
on the reliability of materials used for other electronic applications besides TIMs
21
(Lall et al., 1997). Die attach failure has been well studied and Hu and Pecht (1993)
summarized failure mechanisms and damage models in outlining a design approach
based on physics of failure. Gektin et al. (1998) related dramatic improvement in
underfilled flip chip reliability to reductions in solder joint strain, which followed a
Coffin-Mason relationship.
Thermally conductive adhesive tapes have been studied by Lee (2007) and
Eveloy et al. (2004) and Chu and Selvakumar (2009). Loss of adhesion due to creep
can cause degradation and failure in thermal tapes. Eveloy et al. (2004) measured the
effects of creep on pressure-sensitive adhesives and concluded that tape chemistry
and construction as well as environmental factors determine joint reliability. Besides
adhesive tapes, qualification or performance tests of other TIM types not considered
in this research but described in the literature include phase change materials (Aoyagi
et al., 2008; Bharatham et al., 2005), solders (Deppisch et al., 2006; Hua et al., 2006;
Refai-Ahmed et al., 2007), graphite (Luo et al., 2002; Marotta et al., 2002), and
carbon nanotubes (Fan et al., 2007).
Mechanical degradation of the TIM can have important consequences that
impact system thermal performance. When silicone TIMs are used to bond a heat sink
to a PCB (printed circuit board), the TIM layer absorbs much of the stress on the PCB
caused by the CTE (coefficient of thermal expansion) mismatch between the PCB and
heat sink which could otherwise lead to possible PCB damage (Zhang, 2009). Low
shear modulus, needed to reduce the possibility of decoupling, can depend on
crosslinking density, polymer molecular weight, and selective use of reinforcing
22
fillers. Decrease in bond strength is another consequence of TIM degradation
(Viswanath et al., 2002).
In summary, despite significant developments in bulk thermal resistance
models of particle laden TIMs that take into account surface chemistry as well as
contact resistance models of solid surfaces that take into account mechanical
deformation, predicting in-situ thermal performance is impractical for most TIMs.
Understanding the impact of environmental stress conditions presents additional
challenges. For instance, the role of contact interface effects such as delamination in
contributing to thermal performance degradation has not been well studied. Relating
the impact of the environment to individual parameters that determine interfacial
thermal resistance in order to estimate overall degraded TIM thermal performance has
not yet been performed. The lack of accurate degradation data has hampered
development of physics-based degradation models. Furthermore, while considerable
progress has been made in understanding how many types of TIMs degrade, there is a
need to understand how TIMs in pad form degrade and the conditions for which
degradation in performance occurs. While in many cases comparative TIM studies of
thermal performance have included TIMs in pad form, they have not included
degradation data. In view of the wide range of TIMs and application conditions, it
likely that future degradation models will not be broadly applicable; rather they will
address how specific classes of TIMs degrade under specific application
environments, surface combinations, and loading conditions.
23
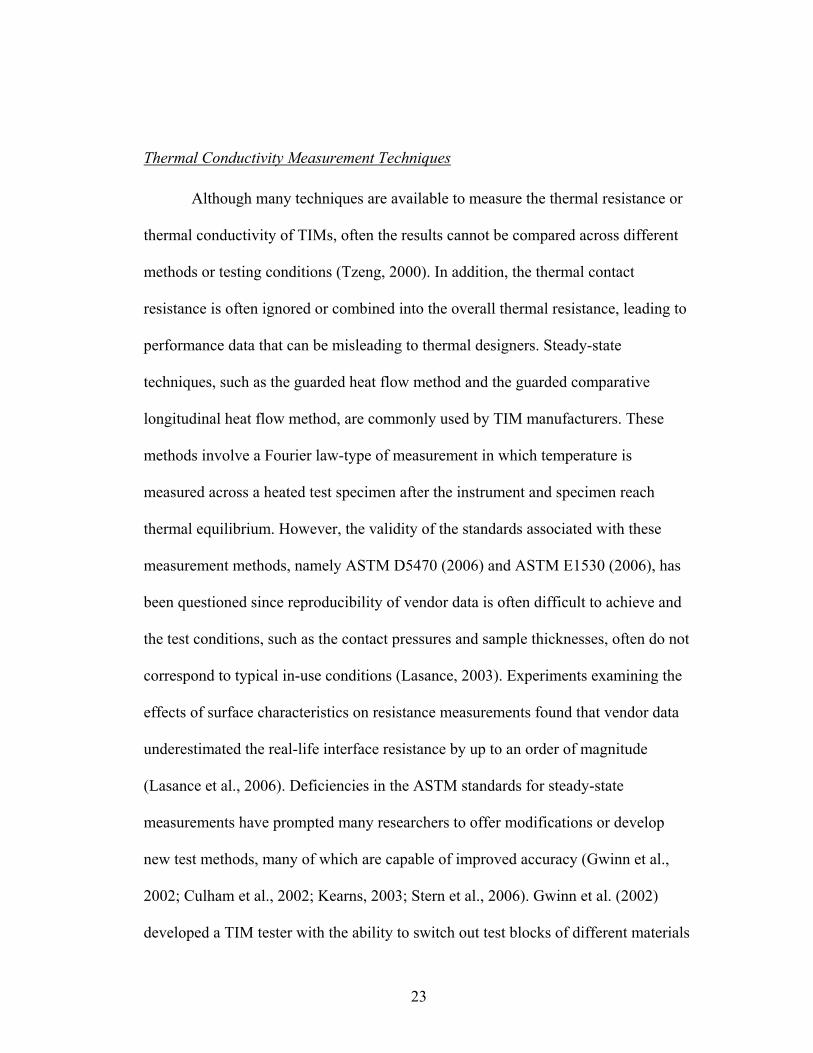
Thermal Conductivity Measurement Techniques
Although many techniques are available to measure the thermal resistance or
thermal conductivity of TIMs, often the results cannot be compared across different
methods or testing conditions (Tzeng, 2000). In addition, the thermal contact
resistance is often ignored or combined into the overall thermal resistance, leading to
performance data that can be misleading to thermal designers. Steady-state
techniques, such as the guarded heat flow method and the guarded comparative
longitudinal heat flow method, are commonly used by TIM manufacturers. These
methods involve a Fourier law-type of measurement in which temperature is
measured across a heated test specimen after the instrument and specimen reach
thermal equilibrium. However, the validity of the standards associated with these
measurement methods, namely ASTM D5470 (2006) and ASTM E1530 (2006), has
been questioned since reproducibility of vendor data is often difficult to achieve and
the test conditions, such as the contact pressures and sample thicknesses, often do not
correspond to typical in-use conditions (Lasance, 2003). Experiments examining the
effects of surface characteristics on resistance measurements found that vendor data
underestimated the real-life interface resistance by up to an order of magnitude
(Lasance et al., 2006). Deficiencies in the ASTM standards for steady-state
measurements have prompted many researchers to offer modifications or develop
new test methods, many of which are capable of improved accuracy (Gwinn et al.,
2002; Culham et al., 2002; Kearns, 2003; Stern et al., 2006). Gwinn et al. (2002)
developed a TIM tester with the ability to switch out test blocks of different materials
24
and surface finishes, which can be useful in reliability evaluation. Improvements in
steady-state methods have led to the availability of commercial testers suitable for
thermal conductivity measurements with less than 5% error (Analysis Tech, 2009).
Transient methods offer some advantages over steady-state techniques in
terms of measurement time and test sample flexibility (Lasance, 2003). The laser
flash method, to be discussed in the following section, the hot disk method (He,
2005), and the modified hot wire method (Mathis, 1999) are examples of transient
methods that have relatively fast measurement speeds and can be used to measure
multiple TIM types, such as greases and adhesives. Bosch and Lasance (2000) and
Lasance and Lacaze (1996) developed transient apparatuses to measure temperature-
time curves, which when used in conjunction with numerical analysis allow thermal
interface resistances to be determined more quickly than typical steady-state methods.
Szekely et al. (2002) developed a technique based on the differential structure
function that yields information on the heat flow path from the heat source to the heat
sink using internal transient temperature response curves. The technique, which can
be applied under typical TIM usage conditions, allows the thermal resistance of the
TIM to be determined in packaged devices.
Use of thermal test vehicles has become an increasingly common method
among end-users for evaluating TIM reliability. Thermal test vehicles typically
consist of heating elements, temperature sensors, and dummy processors designed to
replicate TIM usage conditions. They can approximate the stresses and strains in the
TIM during environmental exposure more accurately than approaches that use
material test specimens (Chen et al., 2008). However, thermal test vehicles can be
25
costly and time consuming to develop and may not be suitable if good absolute
accuracy is required since thermal test vehicles require correlations to convert thermal
resistance data to values that reflect in-situ performance (Jarrett et al., 2007). An
accurate test methodology, such as a steady-state method, can be applied to calibrate
test vehicles (Stern et al., 2006). In addition, using a test vehicle that is too specific to
a single application may cause difficulty in extending the results to packages with
different configurations and environmental conditions. On the other hand, some test
vehicles are based on packages intended to represent multiple component-TIM
combinations (Samson et al., 2005; Chiu et al., 2001).
Aside from thermal conductivity measurement, several experimental
techniques have been employed to assess TIM degradation. These include using IR
thermography (Gupta et al., 2006; Dias, 2003) for characterizing the integrity of
thermal interfaces, differential scanning calorimetry to examine cure behavior and
determine activation energies and endothermic peak temperatures (He, 2001),
scanning electron microscopy to examine TIM bondlines and the interaction between
filler particles and the polymer matrix, and digital radiography and tomography to
detect voiding (Gowda et al., 2006). Scanning acoustic microscopy can detect
physical features, such as cracks, voiding, non-coplanarity, and delamination, which
have been shown to correlate with measured thermal resistance (Haque et al., 2000)
and will be used in this study. This technique allows for nondestructive inspection
and uses the interaction between focused sound waves with a sample immersed in a
couplant such as water to generate images that can reveal differences in acoustic
impedance. Gowda et al. (2005) and Chiu et al. (2002) demonstrated the use of
26
scanning acoustic microscopy to assess voiding effects leading to increased thermal
resistance over time.
System-level effects such as warpage and the often complex interaction
between the TIM and the package should be well understood in evaluating TIM
reliability in realistic applications. Thus, TIM mechanical properties, including shear
modulus (Wang, 2006; Lim and Valderrain, 2007) are needed to fully understand how
the TIM behaves with contact pressure applied (Bharatham et al., 2006). Determining
the bondline thickness accurately is a key experimental challenge that limits the
ability to accurately needed to determine thermal resistance from the thermal
conductivity (Smith and Culham, 2005; Galloway and Kanapurthi, 2008; Wunderle et
al., 2008). It has considerable relevance to reliability evaluation because the test
specimen as measured in a thermal conductivity tester may differ from that in an as-
assembled configuration.
Because of the impact on the bondline thickness and the potential for voiding
and delamination, warpage of the die and the package is a key factor affecting TIM
thermal performance, particularly if operating conditions involve temperature cycling
(Kearney et al., 2009). Several studies have sought to measure predict the degree of
warpage and to understand the effects on TIM thermal resistance (Solbrekken et al.,
2000; Han, 2003; Yang et al., 2009; Too et al., 2007; Li, 2003; Wei et al., 2008).
While the most recent revision to ASTM D5470 (Hanson, 2006) alleviated
many issues regarding high contact pressures used in steady-state TIM thermal
conductivity testing, concerns remain over how well these values represent in-use
TIM thermal performance. In general, a thorough understanding of the conditions
27
used to obtain datasheet thermal conductivity values is critical in translating datasheet
values to application-specific values.
Even with significant advances in the development of thermal conductivity
techniques capable of high absolute accuracy, little work is available describing
methodologies to evaluate TIM reliability using material test specimens. Presumably,
evaluating TIM reliability using material test specimens would involve periodically
removing test specimens from a test chamber and measuring the performance to
generate a time-history profile of thermal performance. The ability for steady-state
techniques to capture changes in TIM thermal performance has yet to be
demonstrated in the literature. Steady-state instruments do not provide the high
degree of control offered by environmental chambers. Samples must be removed
from the chamber and periodically measured in the thermal conductivity
measurement apparatus.
Laser Flash Method
This study focuses on the laser flash method, which measures thermal
diffusivity, a transient property that describes a material’s ability to conduct heat in
comparison to its ability to store heat. Knowledge of thermal diffusivity provides a
means to extract thermal conductivity, and the first thermal diffusivity measurements
using a flash technique were described by Parker et al. (1961) in the 1960s. Various
researchers have proposed refinements to more accurately describe the heat transfer
occurring during measurement, including Cowan (1963), who modified the Parker
model to account for heat loss in the test sample due to radiation, and Clark and

28
Taylor (1975), who used similar assumptions as Cowan but considered the heating
part of the temperature rise curve. These methods differ from the Parker method
(1961) in how the thermal diffusivity is calculated from a measured temperature rise
curve. Sheikh et al. (2000) examined the effects of radial heating, which causes
samples to conduct heat laterally due to nonuniform surface heating. Further efforts
have improved the measurement technique to the point where the method is well
established for material property measurements in many industries.
Some of the sources of error associated with the laser flash method will be
examined in this study. A large body of work exists for describing sources of error of
laser flash measurement, including work by Taylor (1975), Baba and Ono (2000), and
Lee and Taylor (1978) among others, but their work did not address errors from the
standpoint of TIM property measurement.
In this study, the thermal performance and reliability of thermal interface
materials were examined using the laser flash method applied to three-layer sandwich
structures in which the TIM is assembled in between two coupon or substrate layers.
In the 1970s, Lee (1975) and Lee (1977) developed a methodology to measure the
thermal diffusivity of multilayer structures. This approach has been applied by other
researchers to the study of thermal greases (Gowda et al., 2005) and solders (Chiu et
al., 2002). Campbell et al. (1999, 2000), Hasselman et al. (2000), and Kohli et al.
(2001) characterized epoxy adhesives using laser flash measurements of three-layer
composite samples.
Lee and Taylor (1978) showed that it is not practical to measure the thermal
diffusivity of a thin highly conducting layer in between substrates of lower thermal
29
diffusivity. They did not provide criteria however for the acceptable the ratio between
middle layer to outer layer thermal diffusivity, which is also absent from ASTM
E1461, which describes laser flash measurements (2001). Lee (1977) presented
solutions for two and three-layer composite structures, and identified layers as being
resistive or capacitive. Capacitive layers have uniform temperature. Using the ratio of
the heat diffusion times between layers to determine whether capacitive solutions or
the more general resistance solutions should be applied, Lee (1977) presented a 3-
layer resistive solution as well as a solution for 3-layer composite structures with
capacitive first and third layers. However, Lee (1977) did not provide criteria for the
general 3-layer resistive case despite warning that that the iterative algorithm should
not be used on composite structures with large differences in the heat diffusion times,
as small differences in 3-layer thermal diffusivity result in large differences in the
calculated middle layer thermal diffusivity.
The rationale behind examining these issues is a better understanding of
whether thermal diffusion time ratios could be used to determine when the laser flash
method could be applied for a given 3-layer TIM composite test specimen. Such
criteria can be used to determine what thicknesses need to be used when constructing
3-layer test specimens.
When used for TIM reliability evaluation, 3-layer measurements allow
realistic stresses and strains to be captured during the course of a reliability test. Such
a method would also be attractive due to the high degree of control possible for the
environmental exposure, which could be implemented using an environmental
chamber rather than inside the laser flash instrument. Many other features of the laser
30
flash method make it suitable for reliability evaluation. Measurements are relatively
fast, the instrument does not contact the test specimen, and there is no need to log
data using multiple thermocouple channels. In a survey of 17 thermal conductivity
techniques, Graebner (1997) described the laser flash method as requiring “moderate”
operator skill and “medium” cost (including instrumental and sample costs) relative
to other techniques. Chiu et al. (2002) showed that voiding is detectable 3-layer
composite structures. It has also been noted that the laser flash method is capable of
measuring cracked specimens, and shows agreement within 5% of steady-state values
(Shaw, 1969).
Smith et al. (2008) noted that the need for laser flash test samples to
accommodate laser pulses limits their ability to be tested in a product-like test fixture.
This does not diminish the value of the laser flash method toward quantifying some
types of TIM thermal performance degradation, especially those not heavily affected
by the rest of the package and contact surfaces. In the absence of a comprehensive
study on of the laser flash method’s ability to detect degraded TIM structures, more
work needs to be performed to confirm that laser flash method accurately captures the
impact of TIM degradation and how test structures should be designed to hold test
specimens in place during measurements.

31
Chapter 3: Reliability Tests
Theory of the Laser Flash Method
The first part of this study involved assessing the effects of temperature
cycling and elevated temperature/humidity on TIM thermal performance, measured
using the laser flash method.
Basic Operation
The laser flash method involves monitoring the temperature of the rear surface
of a test sample after a burst of energy (supplied by a laser) heats the front surface of
the sample and the resulting temperature rise propagates through the material. The
temperature rise curve, usually measured by an infrared detector, yields the thermal
diffusivity of the test sample as well as the specific heat when a reference
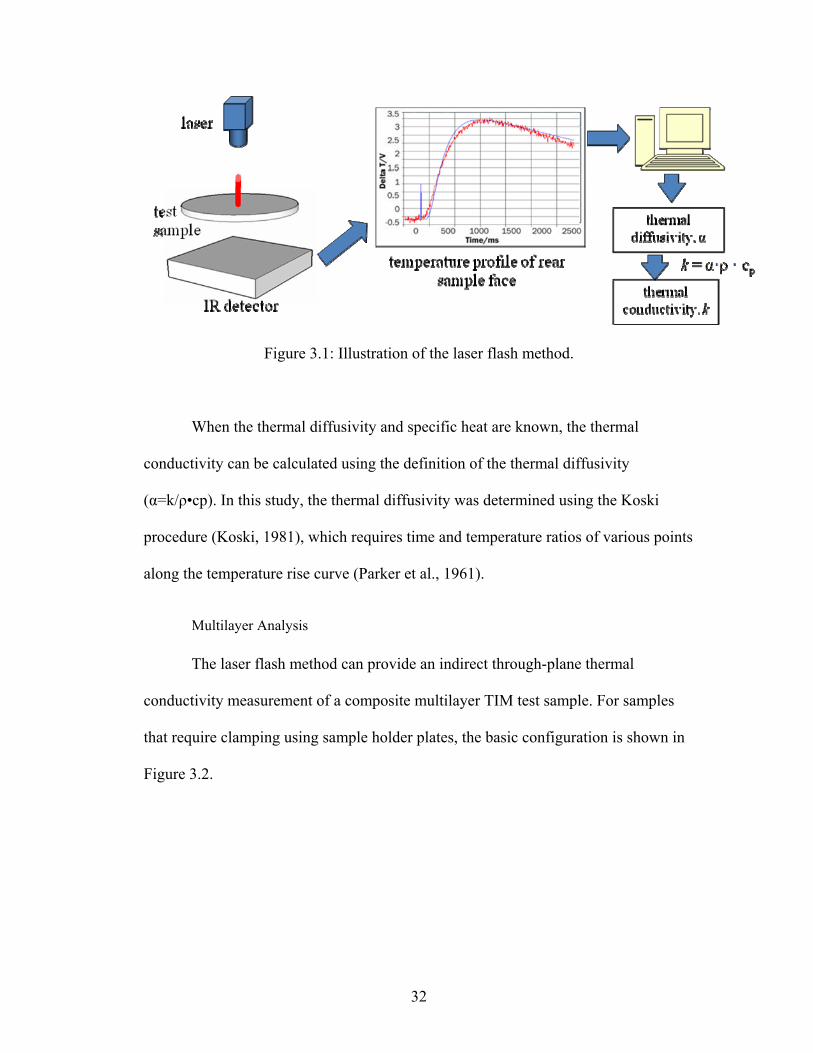
measurement is also performed. The approach is summarized in Figure 3.1.
32
Figure 3.1: Illustration of the laser flash method.
When the thermal diffusivity and specific heat are known, the thermal
conductivity can be calculated using the definition of the thermal diffusivity
(α=k/ρ•cp). In this study, the thermal diffusivity was determined using the Koski
procedure (Koski, 1981), which requires time and temperature ratios of various points
along the temperature rise curve (Parker et al., 1961).
Multilayer Analysis
The laser flash method can provide an indirect through-plane thermal
conductivity measurement of a composite multilayer TIM test sample. For samples
that require clamping using sample holder plates, the basic configuration is shown in
Figure 3.2.
33
heat flux diameter
sample holder plates
laser
detector
composite TIM sample detection area diameter
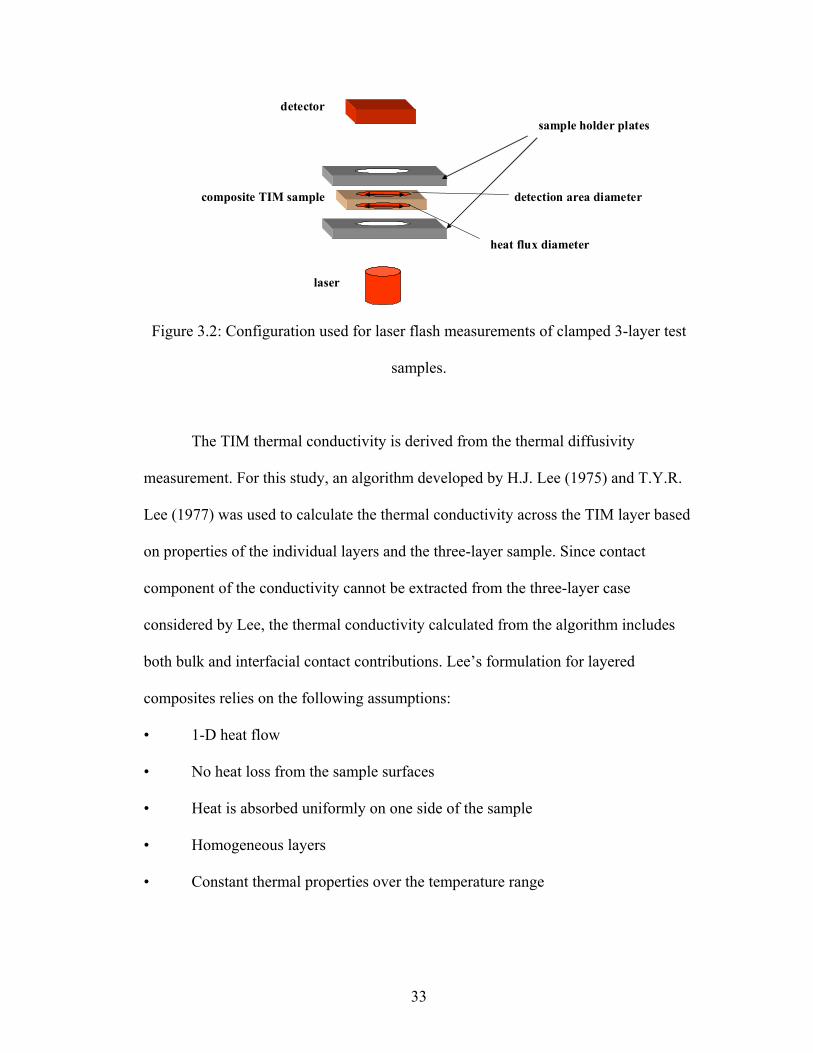
Figure 3.2: Configuration used for laser flash measurements of clamped 3-layer test
samples.
The TIM thermal conductivity is derived from the thermal diffusivity
measurement. For this study, an algorithm developed by H.J. Lee (1975) and T.Y.R.
Lee (1977) was used to calculate the thermal conductivity across the TIM layer based
on properties of the individual layers and the three-layer sample. Since contact
component of the conductivity cannot be extracted from the three-layer case
considered by Lee, the thermal conductivity calculated from the algorithm includes
both bulk and interfacial contact contributions. Lee’s formulation for layered
composites relies on the following assumptions:
• 1-D heat flow
• No heat loss from the sample surfaces
• Heat is absorbed uniformly on one side of the sample
• Homogeneous layers
• Constant thermal properties over the temperature range

34
The half rise time of the temperature response of the composite sample was
determined from the apparent diffusivity obtained from the measured data using the
following relation described by Parker et al. (1961):
2/12
238.1tL
⋅=π
α (3.1)
where t1/2 = half rise time, L = thickness, and α = thermal diffusivity. The half rise
time as well as the single layer properties were then used as inputs into the Lee
algorithm. The kth root of the characteristic equation, γ, must then be determined in
order to solve for the inverse Laplace of the heat diffusion equation:
01)cot()cot()cot()cot()cot()cot(
132/33/2
221/33/121
=−++
γηγηηγηηηγηγη
HH
(3.2)
where ηi is the square root of the heat diffusion time through layer i, ηi/j is the ratio of
ηi to ηj, and H is the volumetric specific heat. The back-side normalized temperature,
V, of the composite sample was then calculated based on the algorithm inputs:
∑∞
= +++⋅+++
+=1 444333222111
344332211
)cos()cos()cos()cos(),,()(21
k
k
XXXXtQXXXXV
γωωγωωγωωγωωηγωωωω (3.3)
where the Xi terms are functions of H, the ω terms are functions of ηij, and Q is a
function of the heat pulse. The diffusivity of the TIM layer was iterated until the
normalized temperature using the three-layer composite solution at the half rise time
converged to 0.5. The thermal conductivity can then be determined for the converged
diffusivity value from the definition of thermal diffusivity. This procedure is
summarized in Figure 3.3 and layers 1, 2, and 3 represent coupon 1, the TIM layer,
and coupon 2, respectively.

35
Figure 3.3: TIM thermal resistance measurement and calculation.
Experimental Approach
TIM samples were assembled to achieve a desired bondline thickness and then
prepared for the laser flash measurements. A neodymium-glass (ND: glass) laser with
a 1060 nm wavelength provided a 15J pulse during laser flash measurements.
Baseline laser flash measurements were then performed prior to subjecting the
samples to a defined environmental condition for a fixed period of time.
Measurements were repeated periodically over the course of the environmental
exposure. Scanning microscope images were taken of the samples after completing
the environmental exposure. Ten samples of each type were measured to achieve
statistical confidence in the assembly procedure, the laser flash data, and the three-
layer calculations. This number included scanning acoustic microscope samples and
room temperature samples used as a control group to assess room temperature effects.
36
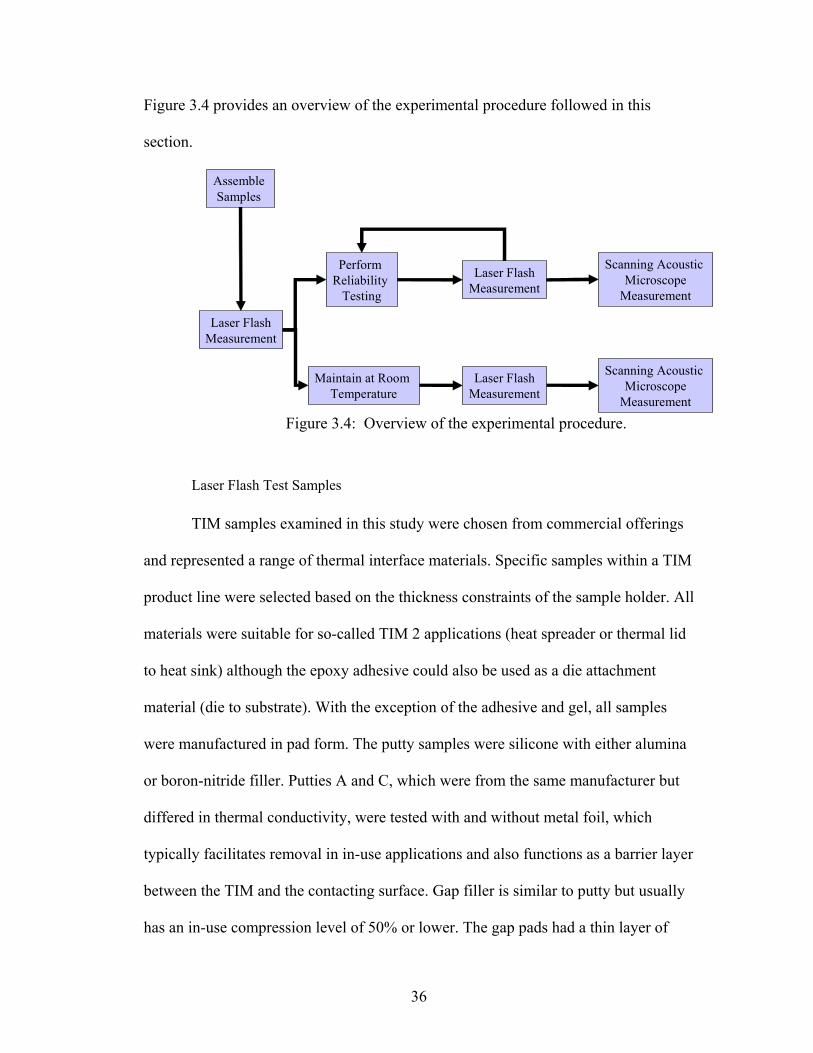
Figure 3.4 provides an overview of the experimental procedure followed in this
section.
Laser Flash Test Samples
TIM samples examined in this study were chosen from commercial offerings
and represented a range of thermal interface materials. Specific samples within a TIM
product line were selected based on the thickness constraints of the sample holder. All
materials were suitable for so-called TIM 2 applications (heat spreader or thermal lid
to heat sink) although the epoxy adhesive could also be used as a die attachment
material (die to substrate). With the exception of the adhesive and gel, all samples
were manufactured in pad form. The putty samples were silicone with either alumina
or boron-nitride filler. Putties A and C, which were from the same manufacturer but
differed in thermal conductivity, were tested with and without metal foil, which
typically facilitates removal in in-use applications and also functions as a barrier layer
between the TIM and the contacting surface. Gap filler is similar to putty but usually
has an in-use compression level of 50% or lower. The gap pads had a thin layer of
Assemble Samples
Laser FlashMeasurement
Perform Reliability
Testing
Laser FlashMeasurement
Scanning Acoustic Microscope
Measurement
Scanning Acoustic Microscope
Measurement
Maintain at Room Temperature
Laser FlashMeasurement
Figure 3.4: Overview of the experimental procedure.
37
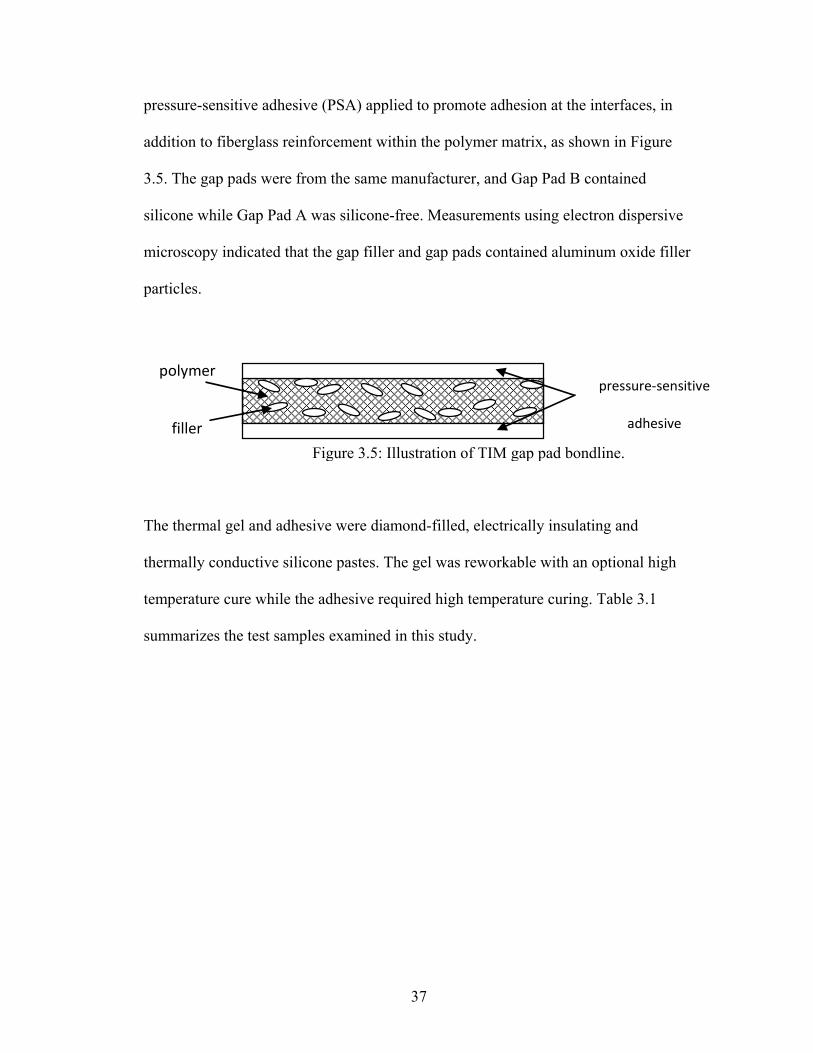
pressure-sensitive adhesive (PSA) applied to promote adhesion at the interfaces, in
addition to fiberglass reinforcement within the polymer matrix, as shown in Figure
3.5. The gap pads were from the same manufacturer, and Gap Pad B contained
silicone while Gap Pad A was silicone-free. Measurements using electron dispersive
microscopy indicated that the gap filler and gap pads contained aluminum oxide filler
particles.
The thermal gel and adhesive were diamond-filled, electrically insulating and
thermally conductive silicone pastes. The gel was reworkable with an optional high
temperature cure while the adhesive required high temperature curing. Table 3.1
summarizes the test samples examined in this study.
filler
polymer pressure‐sensitive
adhesive
Figure 3.5: Illustration of TIM gap pad bondline.

38
Table 3.1: TIM test samples.
Designation Construction and Composition
Vendor k (W/m-K)
Temperature Cycling 1
(-40 to 125oC)
Temperature Cycling 2
(-55 to 125oC)
Elevated Temperature/
Humidity
Putty A alumina-filled silicone 11 yes no yes (w/ foil,
no foil)
Putty B boron nitride-filled silicone 3 no yes yes
Putty C alumina-filled silicone 6 no yes (w/ foil,
no foil) no
Adhesive diamond-filled non-silicone
paste 11.4 yes yes no
Gel diamond-filled non-silicone
paste 10 no yes yes
Gap Filler alumina-filled silicone 2.8 yes no no
Gap Pad A
alumina-filled non-silicone 0.9 yes no yes
Gap Pad B
alumina-filled silicone 2.4 yes no no
Laser Flash Test Sample Holder
To simulate realistic loading conditions, laser flash measurements were
performed on various TIMs assembled into three-layer sandwich structures, enabling
the test samples to remain undisturbed between measurements performed periodically
throughout the environmental exposure, as illustrated in Figure 3.6.
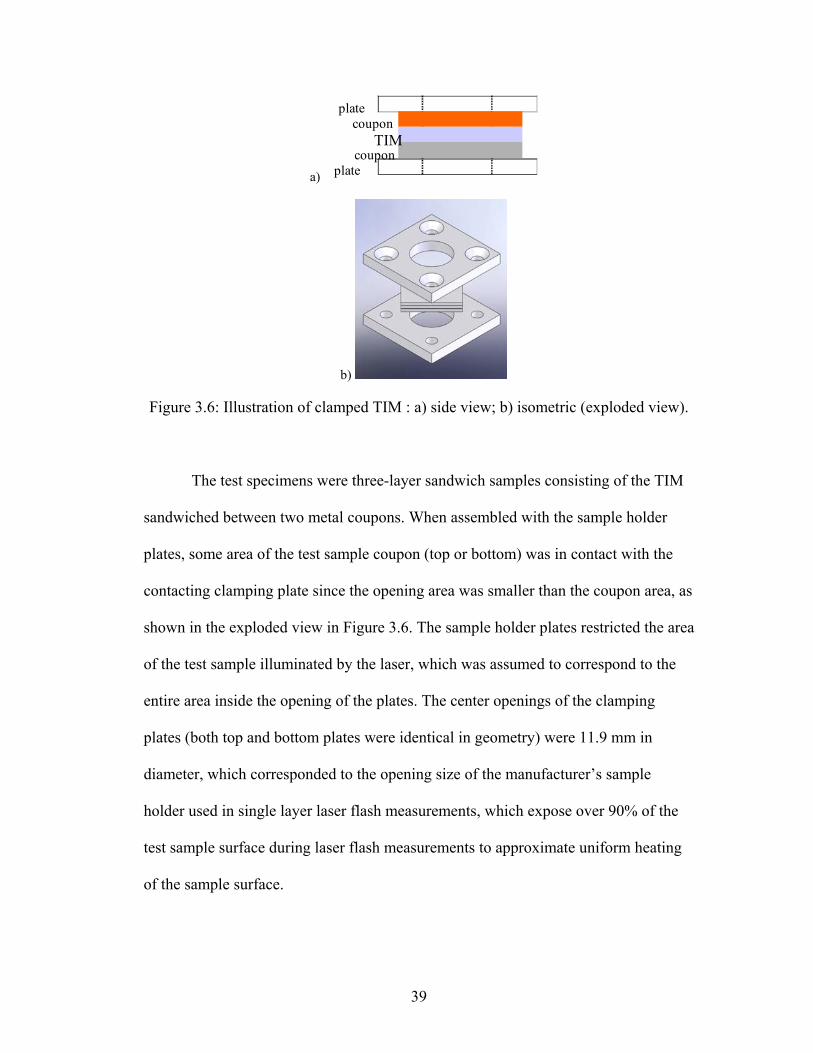
39
a) plate
plate
TIMcoupon
coupon
b)
Figure 3.6: Illustration of clamped TIM : a) side view; b) isometric (exploded view).
The test specimens were three-layer sandwich samples consisting of the TIM
sandwiched between two metal coupons. When assembled with the sample holder
plates, some area of the test sample coupon (top or bottom) was in contact with the
contacting clamping plate since the opening area was smaller than the coupon area, as
shown in the exploded view in Figure 3.6. The sample holder plates restricted the area
of the test sample illuminated by the laser, which was assumed to correspond to the
entire area inside the opening of the plates. The center openings of the clamping
plates (both top and bottom plates were identical in geometry) were 11.9 mm in
diameter, which corresponded to the opening size of the manufacturer’s sample
holder used in single layer laser flash measurements, which expose over 90% of the
test sample surface during laser flash measurements to approximate uniform heating
of the sample surface.
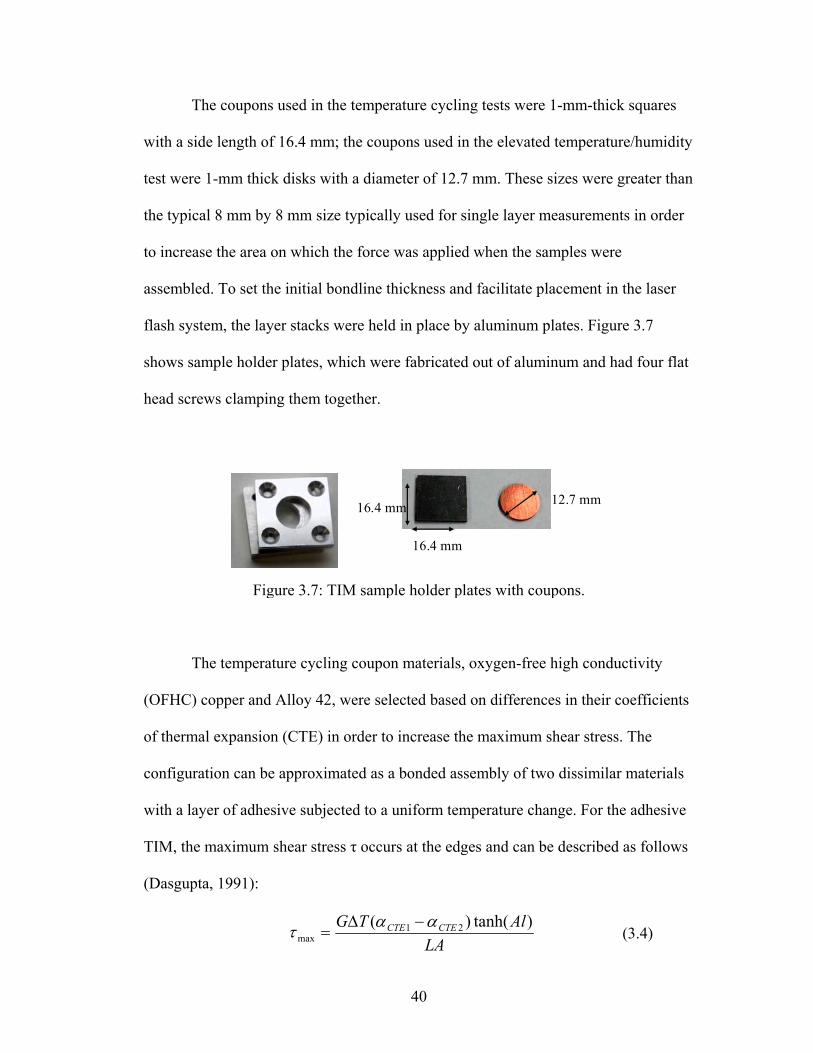
40
The coupons used in the temperature cycling tests were 1-mm-thick squares
with a side length of 16.4 mm; the coupons used in the elevated temperature/humidity
test were 1-mm thick disks with a diameter of 12.7 mm. These sizes were greater than
the typical 8 mm by 8 mm size typically used for single layer measurements in order
to increase the area on which the force was applied when the samples were
assembled. To set the initial bondline thickness and facilitate placement in the laser
flash system, the layer stacks were held in place by aluminum plates. Figure 3.7
shows sample holder plates, which were fabricated out of aluminum and had four flat
head screws clamping them together.
The temperature cycling coupon materials, oxygen-free high conductivity
(OFHC) copper and Alloy 42, were selected based on differences in their coefficients
of thermal expansion (CTE) in order to increase the maximum shear stress. The
configuration can be approximated as a bonded assembly of two dissimilar materials
with a layer of adhesive subjected to a uniform temperature change. For the adhesive
TIM, the maximum shear stress τ occurs at the edges and can be described as follows
(Dasgupta, 1991):
LAAlTG CTECTE )tanh()( 21
maxαατ −Δ
= (3.4)
16.4 mm
16.4 mm 12.7 mm
Figure 3.7: TIM sample holder plates with coupons.
41
⎟⎟⎠
⎞⎜⎜⎝
⎛ −+
−=
22
2
11
12 11AEAEL
GA νν (3.5)
where αCTE is the CTE of the coupon, G is the shear modulus of the TIM, ΔT is the
temperature difference, l is the TIM layer length, L is the TIM layer thickness, A is
the cross-sectional area of the TIM layer, E is the Young’s Modulus, and ν is
Poisson’s ratio. Alloy 42 was preferred over other low CTE materials, such as
ceramic or silicon, as it is less brittle and less prone to cracking when loading is
applied. Furthermore, Alloy 42 is less transparent than silicon in the infrared region
of the spectrum and does not require a gold coating to reduce transmittance. The
calculated maximum shear stress in a 0.25-mm-thick adhesive layer (G = 1.5 GPa)
assuming a temperature cycle range of 160 °C was 9.2 MPa for the copper–Alloy 42
combination (with the same sample geometry used in laser flash measurements). This
result was less than a 15% difference from 10.8 MPa, the calculated maximum shear
stress for the copper-silicon combination. The elevated temperature/humidity test
used copper coupons on the top and bottom. All sample coupons of a given material
were fabricated from the same lot to prevent variations in surface roughness between
samples from affecting the measurements.
Sample Preparation
The surfaces of the coupons were cleaned with isopropyl alcohol prior to
assembling the sandwich structures. Graphite coating was applied to all test sample
sandwiches to enhance the radiational absorptivity and emissivity prior to each
sequence of laser flash runs. Five coats of graphite were applied in accordance with
ASTM E1461 (2001) and the laser flash manufacturer’s directions.
42
Although the laser flash measurement imposed restrictions on the sample
geometry, applying contact force to the TIM allowed loading conditions to more
closely match typical usage applications than those used in many bulk conductivity
measurement tests. The thermal performance of gap pads and gap fillers, which
generally require higher clamping forces for optimal performance compared to
thermal greases, is highly dependent on the loading force (Maguire et al., 2005).
Many manufacturers control contact force when characterizing the thermal
performance of their thermal interface materials per ASTM D5470, but the stresses in
elastomeric materials change over time due to their viscoelastic nature. Since
bondline thickness can be more accurately controlled than force, a nominal 25%
compression was applied to the gap filler, putty, and gap pad samples during
assembly. This thickness value was within the manufacturer’s recommended
compressed thickness values. The thickness was controlled manually by tightening
the sample holder screws and measuring the thickness using a micrometer. Care was
taken to ensure that tightening the screws to compress the TIM would result in a
uniform thickness and not cause gaps that could have resulted in delamination during
assembly. The bondline thicknesses of the as-prepared TIM specimens are
summarized in Table 3.2 as mean values with standard deviations. Room temperature
samples were assembled such that the bondline thicknesses matched those used in
corresponding environmental exposure samples.

43
Table 3.2: TIM bondline thicknesses.
Initial Bondline Thickness (mm)
TIM Temperature
Cycling 1 (-40 to 125oC)
Temperature Cycling 2
(-55 to 125oC)
Elevated Temperature/
Humidity (85oC/85% RH)
Putty A (with foil) 1.1 ± 0.03 N/A 1.4 ± 0.03
Putty A (no foil) N/A N/A 1.4 ± 0.01
Putty B N/A 1.4 ± 0.09 1.4 ± 0.01 Putty C
(with foil) N/A 1.4 ± 0.08 N/A
Putty C (no foil) N/A 1.4 ± 0.04 N/A
Adhesive 0.3 ± 0.01 0.3 ± 0.02 N/A
Gel N/A 0.1 ± 0.04 0.1 ± 0.01
Gap Filler 0.8 ± 0.04 N/A N/A
Gap Pad A 0.6 ± 0.04 N/A 0.6 ± 0.01
Gap Pad B 0.5 ± 0.02 N/A N/A
The bondline of epoxy adhesive samples, which were not held under pressure,
was maintained using Kapton tape at the corners of the sample, chosen because of its
good stability at high temperature. The amount of adhesive dispensed onto the
coupon surfaces was controlled manually by the dispenser before the coupons were
mated together. The adhesive samples were cured per the manufacturer’s instructions
using a 60 °C prebake for 1 hr and a 150 °C bake for 0.5 hrs. For the adhesive
samples, the top and bottom aluminum plates of the sample holder were used to mask
the laser beam and radiation from the rear sample, and no clamping force was applied
by tightening the screws. The gel samples, which were clamped, also used spacers of
the same thickness.
44
Sample thicknesses of the gap pads and fillers were measured with a flat point
micrometer, which had an accuracy of 25-μm, and values were averaged over 3
locations on the surface.
Reliability Test Procedure
The density of the TIM layer was determined by measuring the mass of the
sample and the coupons and assuming that the TIM covered the entire face of the
coupon (neglecting the material squeezed out when compressed). Furthermore, the
vendor value of the TIM layer specific heat was used in the thermal resistance
calculation for all samples except for the adhesive samples, which required DSC
measurement to be performed. Vendor values of thermal diffusivity were determined
from specific heat and vendor thermal conductivity values. Measured values for
specific heat and thermal diffusivity were used for the coupon layers and assumed to
be the same among all samples. The thermal diffusivity was determined to be 0.041
cm2/s for Alloy 42 and 1.17 cm2/s for copper. Thermo-mechanical analysis (TMA)
yielded 3.2 ppm/°C and 14.7 ppm/°C for the Alloy 42 and copper coefficients of
thermal expansion (CTE), respectively.
The Lee algorithm (1975, 1977) requires the specific heat values of the
individual layers of the composite sample. Due to the difficulty in applying the
graphite coating to single layer polymer TIMs, differential scanning calorimetry
(DSC) was used for determining the specific heat in samples where vendor data was
not provided. DSC is a thermoanalytical technique in which the difference in the
amount of heat required to increase the temperature of a sample and reference are
measured as a function of temperature. It is generally a more accurate technique for
45
measuring specific heat than the laser flash method as there is no variability in heat
pulses between successive runs and no dependence on coating material or sample
surface properties (Graebner, 1997).
All laser flash measurements were performed at room temperature, with five
flashes per measurement, as recommended by the manufacturer. Although it can be
shown that the value of the TIM layer thermal resistance is not dependent on which
side faces the laser (Lee, 1975), all laser flash measurements were conducted with the
copper side facing the laser beam to avoid variation due to the coupon surface
finishes. A 50% optical filter, the highest transmittance available for this instrument,
was used in the measurements to attenuate the beam power. For consistency, the
method described by Cowan (1963) was used to determine the thermal diffusivity of
all the samples.
Reliability Test Conditions
Since electronic hardware may experience temperature excursions due to the
environment or daily operation in a variety of military, aerospace, and consumer
applications, temperature cycling tests were used in this study to simulate the stresses
experienced by TIMs during typical usage. In the absence of a standard method for
environmental exposure of TIMs, the temperature range for the first temperature
cycling test was chosen to be -40 to 125 °C, with one cycle lasting for 1 hr (10 °C per
minute ramp rate, 15-min dwell at the low and high temperatures). This temperature
profile was based on a measurement standard used for surface mount solder
attachments (1995). The second temperature profile was -55 to 125°C, with one cycle
lasting for 70 min (15-min dwell at the low and high extremes). Except for Putty B,
46
the selected test temperatures were within the normal operating temperature limits of
the TIMs specified by their manufacturers.
To simulate the combination of elevated temperature and humidity
encountered by electronic hardware, tests were also performed at 85 °C/85% RH.
This stress condition, which allows for the effect of moisture on thermal performance
to be examined, has been applied in other TIM studies and is commonly used in
environmental testing of non-TIM electronic parts and components (Gowda et al.,
2005; IPC, 1995).
Results
Nine samples of each TIM type were prepared for the first temperature
cycling test while the second temperature cycling test and the elevated
temperature/humidity test used 8 samples each. Laser flash measurements were taken
prior to each test and nominally at increments of once every 250 cycles or every 250
hrs. Each thermal resistance value is given as a mean value and the standard deviation
associated with each of the samples (1 value per sample is based on an average of 5
flashes.
Room Temperature Observations
Although examining the behavior of TIM samples subjected to temperature
cycling and elevated temperature/humidity was the main objective of this study,
separate trials were also performed to characterize the behavior of the samples over

47
time at room temperature to distinguish between room temperature and temperature
cycling or elevated temperature/humidity effects.
Table 3.3 summarizes the changes in TIM layer thermal performance over
time when stored at room temperature after being cured. Measurements were
performed for three samples per type. The “time after assembly” refers to the time
after the TIM was compressed between the sample holder plates and the screws were
tightened.
Table 3.3: TIM layer thermal resistance at room temperature.
Thermal resistance (mm2K/W) Time after
assembly
Putty A (no foil) Adhesive Gap
Filler Gap Pad
A Gap Pad
B
10 min 94 ± 7 133 ± 21 126 ± 18 223 ± 25 74 ± 5
1 hr 93 ± 7 116 ± 7 127 ± 15 220 ± 9 75 ± 7
1 day 93 ± 6 109 ± 12 126 ± 15 224 ± 20 72 ± 6
10 days 92 ± 7 97 ± 6 127 ± 13 220 ± 10 69 ± 7
30 days 91 ± 7 89 ± 5 123 ± 14 214 ± 21 61 ± 3 Change after 30
days
-3 (-3%)
-44 (-33%)
-3 (-2%)
-9 (-4%)
-13 (-17%)
After being subjected to a 1 hr prebake at 60°C and a 0.5 hr bake at 150°C, the
epoxy adhesive showed a 33% reduction in resistance after storage for 30 days at
room temperature (the largest change among the samples tested), reaching a thermal
resistance of 89 mm2K/W. Material flow and other relaxation processes, as well as
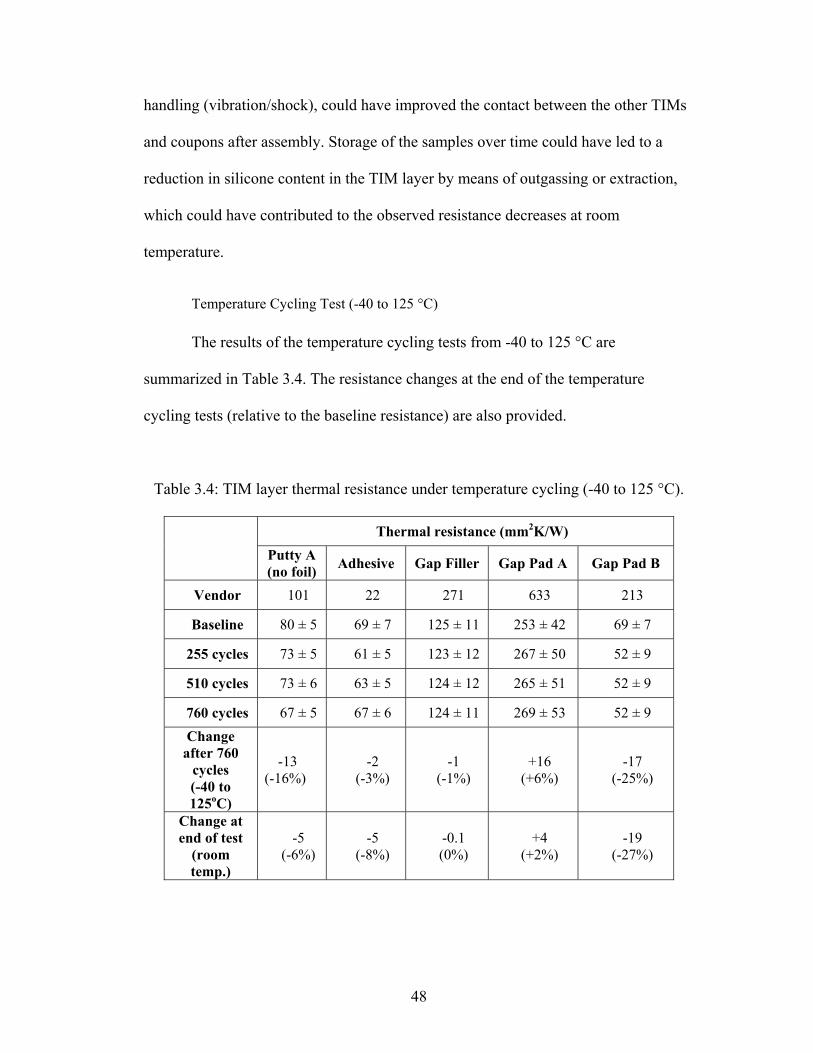
48
handling (vibration/shock), could have improved the contact between the other TIMs
and coupons after assembly. Storage of the samples over time could have led to a
reduction in silicone content in the TIM layer by means of outgassing or extraction,
which could have contributed to the observed resistance decreases at room
temperature.
Temperature Cycling Test (-40 to 125 °C)
The results of the temperature cycling tests from -40 to 125 °C are
summarized in Table 3.4. The resistance changes at the end of the temperature
cycling tests (relative to the baseline resistance) are also provided.
Table 3.4: TIM layer thermal resistance under temperature cycling (-40 to 125 °C).
Thermal resistance (mm2K/W)
Putty A (no foil) Adhesive Gap Filler Gap Pad A Gap Pad B
Vendor 101 22 271 633 213
Baseline 80 ± 5 69 ± 7 125 ± 11 253 ± 42 69 ± 7
255 cycles 73 ± 5 61 ± 5 123 ± 12 267 ± 50 52 ± 9
510 cycles 73 ± 6 63 ± 5 124 ± 12 265 ± 51 52 ± 9
760 cycles 67 ± 5 67 ± 6 124 ± 11 269 ± 53 52 ± 9 Change
after 760 cycles (-40 to 125oC)
-13 (-16%)
-2 (-3%)
-1 (-1%)
+16 (+6%)
-17 (-25%)
Change at end of test
(room temp.)
-5 (-6%)
-5 (-8%)
-0.1 (0%)
+4 (+2%)
-19 (-27%)
49
As shown in Table 3.4, with the exception of Gap Pad A, a reduction in TIM
thermal resistance was observed on average throughout the temperature cycling test,
with the greatest changes usually occurring prior to the measurement at cycle 255.
The observed thermal resistance reduction may have been caused by the release of
silicone from the TIM onto the contacting surfaces. This effect, often referred to as
silicone extraction, is known to affect silicone elastomeric pads and can contaminate
nearby components (Bergquist, 2007), in some instances reducing the contact
resistances by filling in the interstices. The Gap Pad A samples, which contained no
silicone, showed a slight increase of 12 mm2K/W in resistance (5%), but this was
within the uncertainty of the measurement. Higher levels of noise were observed in
the temperature rise signals for the gap filler pads. A comparison with the room
temperature study results in Table 3.4 indicates that factors independent of
temperature cycling, but still temperature-related, may impact thermal performance.
The elevated temperature of the cycling tests may have accelerated the processes
occurring at room temperature.
The adhesive TIMs subjected to temperature cycling decreased in thermal
resistance initially, but then gradually increased. Under room temperature, thermal
resistance of the adhesive TIM continued to reduce throughout the observation
period. Unlike the gap fillers and gap pads in this study, the adhesive was a dispensed
epoxy material requiring a high temperature cure, so the resistance change could have
been caused by additional crosslinking after the samples were subjected to the high
temperature cure. Of all the materials tested, the adhesive baseline resistance was
dramatically lower than the room temperature test values, starting with the 10-min
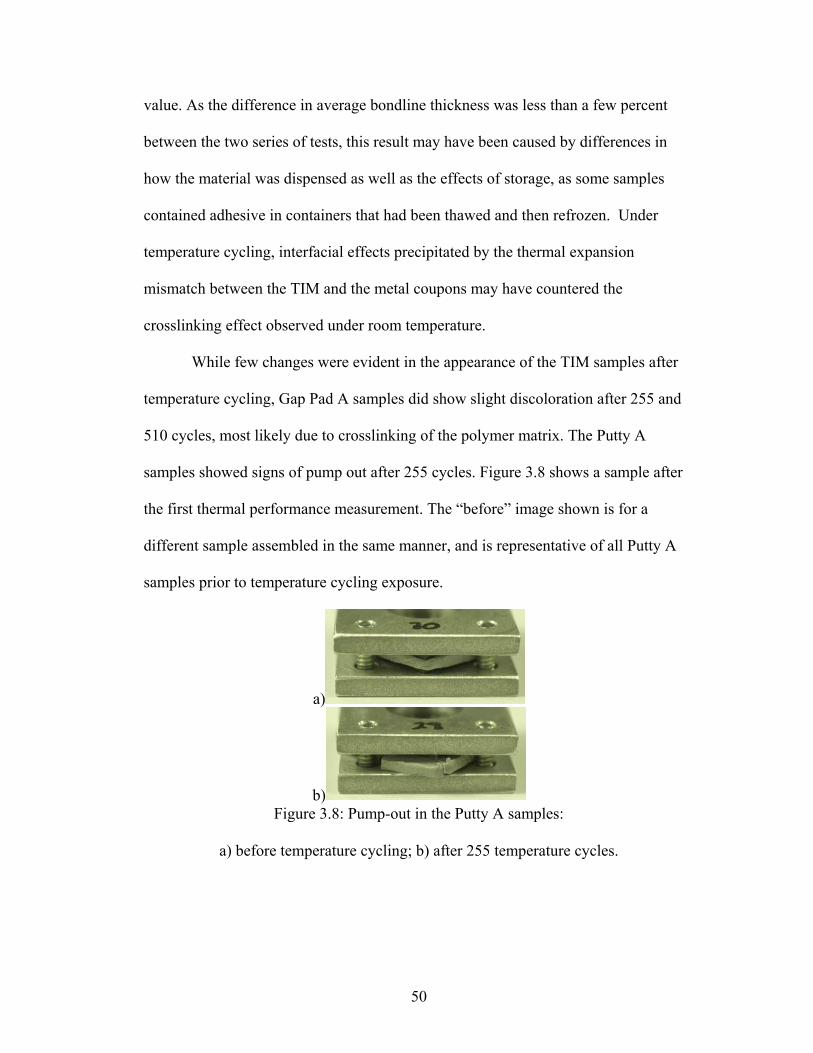
50
value. As the difference in average bondline thickness was less than a few percent
between the two series of tests, this result may have been caused by differences in
how the material was dispensed as well as the effects of storage, as some samples
contained adhesive in containers that had been thawed and then refrozen. Under
temperature cycling, interfacial effects precipitated by the thermal expansion
mismatch between the TIM and the metal coupons may have countered the
crosslinking effect observed under room temperature.
While few changes were evident in the appearance of the TIM samples after
temperature cycling, Gap Pad A samples did show slight discoloration after 255 and
510 cycles, most likely due to crosslinking of the polymer matrix. The Putty A
samples showed signs of pump out after 255 cycles. Figure 3.8 shows a sample after
the first thermal performance measurement. The “before” image shown is for a
different sample assembled in the same manner, and is representative of all Putty A
samples prior to temperature cycling exposure.
a)
b) Figure 3.8: Pump-out in the Putty A samples:
a) before temperature cycling; b) after 255 temperature cycles.
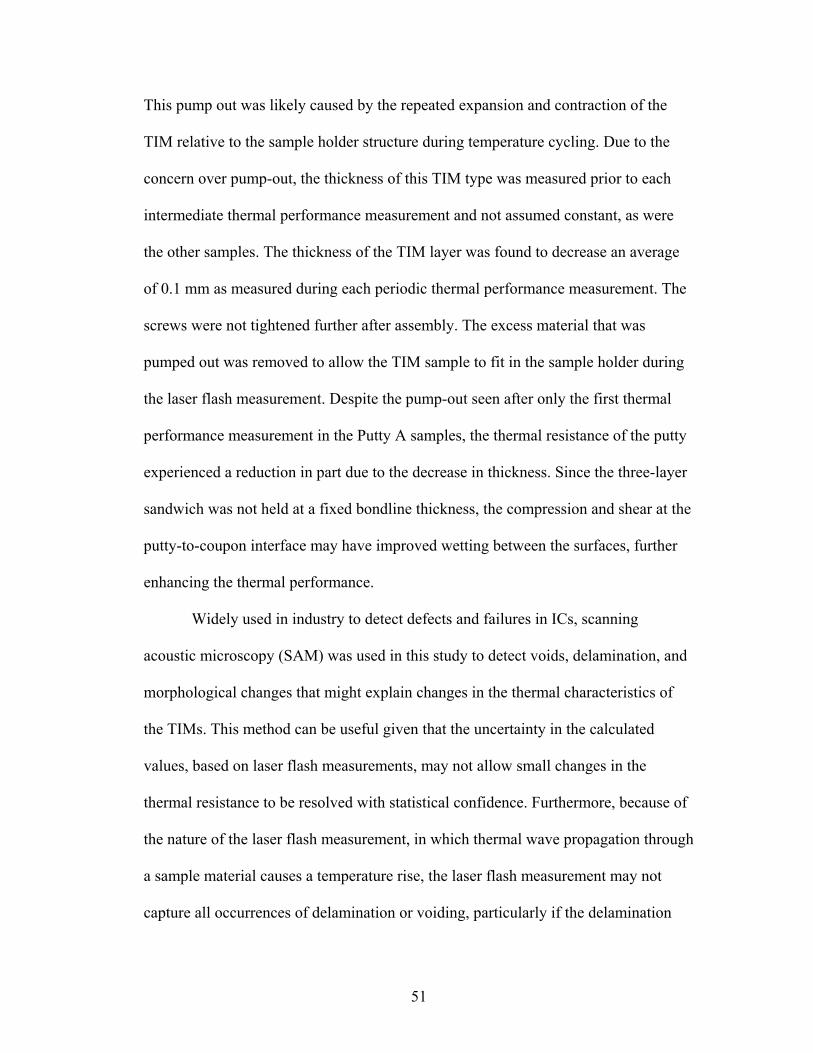
51
This pump out was likely caused by the repeated expansion and contraction of the
TIM relative to the sample holder structure during temperature cycling. Due to the
concern over pump-out, the thickness of this TIM type was measured prior to each
intermediate thermal performance measurement and not assumed constant, as were
the other samples. The thickness of the TIM layer was found to decrease an average
of 0.1 mm as measured during each periodic thermal performance measurement. The
screws were not tightened further after assembly. The excess material that was
pumped out was removed to allow the TIM sample to fit in the sample holder during
the laser flash measurement. Despite the pump-out seen after only the first thermal
performance measurement in the Putty A samples, the thermal resistance of the putty
experienced a reduction in part due to the decrease in thickness. Since the three-layer
sandwich was not held at a fixed bondline thickness, the compression and shear at the
putty-to-coupon interface may have improved wetting between the surfaces, further
enhancing the thermal performance.
Widely used in industry to detect defects and failures in ICs, scanning
acoustic microscopy (SAM) was used in this study to detect voids, delamination, and
morphological changes that might explain changes in the thermal characteristics of
the TIMs. This method can be useful given that the uncertainty in the calculated
values, based on laser flash measurements, may not allow small changes in the
thermal resistance to be resolved with statistical confidence. Furthermore, because of
the nature of the laser flash measurement, in which thermal wave propagation through
a sample material causes a temperature rise, the laser flash measurement may not
capture all occurrences of delamination or voiding, particularly if the delamination
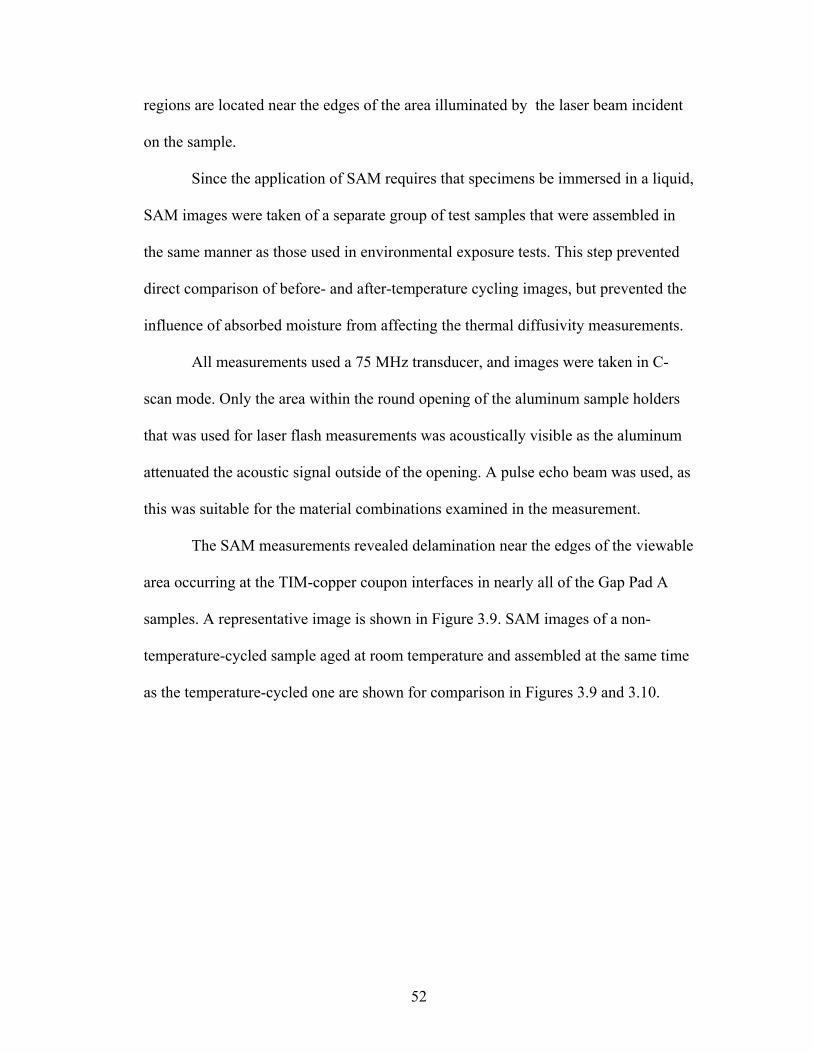
52
regions are located near the edges of the area illuminated by the laser beam incident
on the sample.
Since the application of SAM requires that specimens be immersed in a liquid,
SAM images were taken of a separate group of test samples that were assembled in
the same manner as those used in environmental exposure tests. This step prevented
direct comparison of before- and after-temperature cycling images, but prevented the
influence of absorbed moisture from affecting the thermal diffusivity measurements.
All measurements used a 75 MHz transducer, and images were taken in C-
scan mode. Only the area within the round opening of the aluminum sample holders
that was used for laser flash measurements was acoustically visible as the aluminum
attenuated the acoustic signal outside of the opening. A pulse echo beam was used, as
this was suitable for the material combinations examined in the measurement.
The SAM measurements revealed delamination near the edges of the viewable
area occurring at the TIM-copper coupon interfaces in nearly all of the Gap Pad A
samples. A representative image is shown in Figure 3.9. SAM images of a non-
temperature-cycled sample aged at room temperature and assembled at the same time
as the temperature-cycled one are shown for comparison in Figures 3.9 and 3.10.
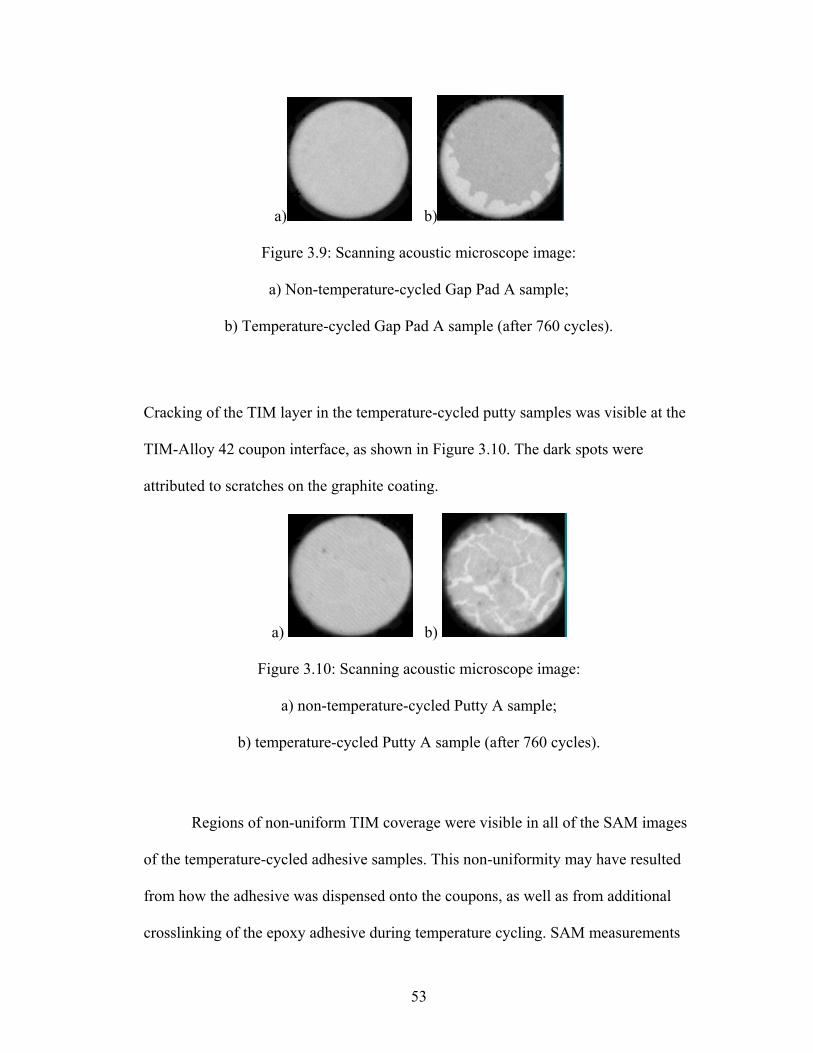
53
Cracking of the TIM layer in the temperature-cycled putty samples was visible at the
TIM-Alloy 42 coupon interface, as shown in Figure 3.10. The dark spots were
attributed to scratches on the graphite coating.
Regions of non-uniform TIM coverage were visible in all of the SAM images
of the temperature-cycled adhesive samples. This non-uniformity may have resulted
from how the adhesive was dispensed onto the coupons, as well as from additional
crosslinking of the epoxy adhesive during temperature cycling. SAM measurements
a) b)
Figure 3.10: Scanning acoustic microscope image:
a) non-temperature-cycled Putty A sample;
b) temperature-cycled Putty A sample (after 760 cycles).
a) b)
Figure 3.9: Scanning acoustic microscope image:
a) Non-temperature-cycled Gap Pad A sample;
b) Temperature-cycled Gap Pad A sample (after 760 cycles).

54
did not reveal any loss of contact at the TIM-coupon interfaces for the Gap Pad B and
gap filler samples.
Temperature Cycling Test (-55 to 125 °C)
The results of temperature cycling from -55 to 125 °C performed on a second
group of test samples are shown in Table 3.5. The error bars show the standard
deviation associated with each of the samples (1 value per sample is based on an
average of 5 flashes).
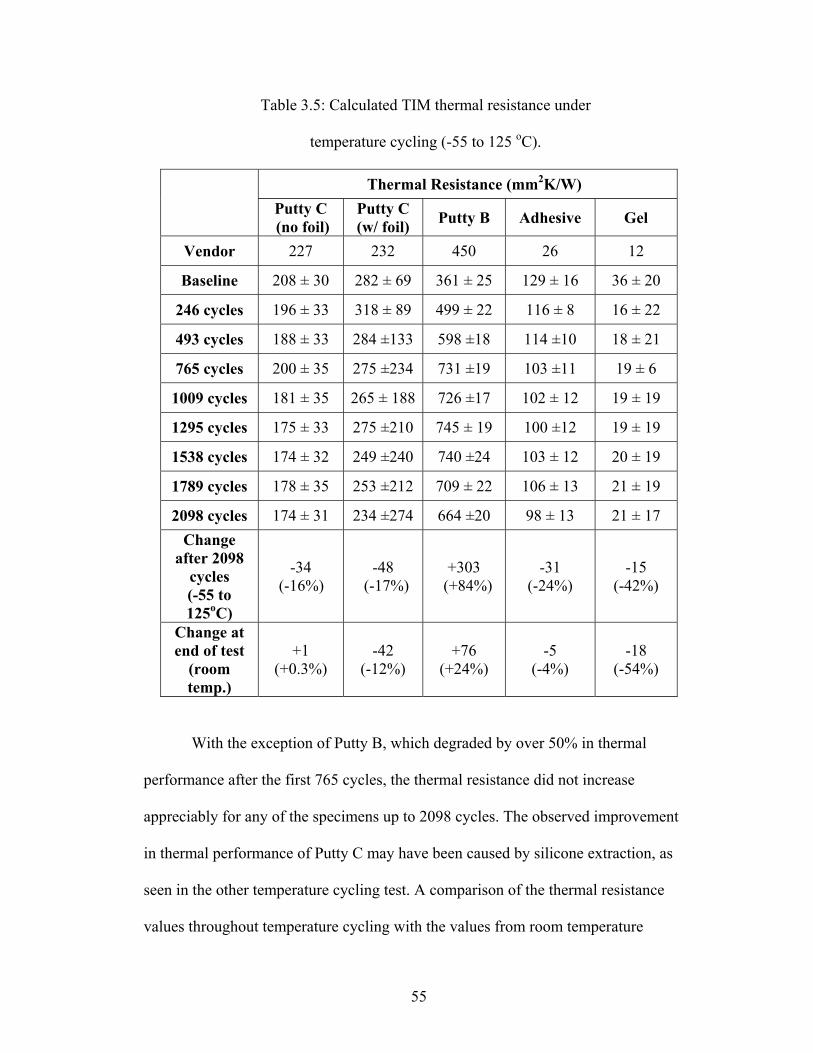
55
Table 3.5: Calculated TIM thermal resistance under
temperature cycling (-55 to 125 oC).
Thermal Resistance (mm2K/W)
Putty C (no foil)
Putty C (w/ foil) Putty B Adhesive Gel
Vendor 227 232 450 26 12
Baseline 208 ± 30 282 ± 69 361 ± 25 129 ± 16 36 ± 20
246 cycles 196 ± 33 318 ± 89 499 ± 22 116 ± 8 16 ± 22
493 cycles 188 ± 33 284 ±133 598 ±18 114 ±10 18 ± 21
765 cycles 200 ± 35 275 ±234 731 ±19 103 ±11 19 ± 6
1009 cycles 181 ± 35 265 ± 188 726 ±17 102 ± 12 19 ± 19
1295 cycles 175 ± 33 275 ±210 745 ± 19 100 ±12 19 ± 19
1538 cycles 174 ± 32 249 ±240 740 ±24 103 ± 12 20 ± 19
1789 cycles 178 ± 35 253 ±212 709 ± 22 106 ± 13 21 ± 19
2098 cycles 174 ± 31 234 ±274 664 ±20 98 ± 13 21 ± 17 Change
after 2098 cycles (-55 to 125oC)
-34 (-16%)
-48 (-17%)
+303 (+84%)
-31 (-24%)
-15 (-42%)
Change at end of test
(room temp.)
+1 (+0.3%)
-42 (-12%)
+76 (+24%)
-5 (-4%)
-18 (-54%)
With the exception of Putty B, which degraded by over 50% in thermal
performance after the first 765 cycles, the thermal resistance did not increase
appreciably for any of the specimens up to 2098 cycles. The observed improvement
in thermal performance of Putty C may have been caused by silicone extraction, as
seen in the other temperature cycling test. A comparison of the thermal resistance
values throughout temperature cycling with the values from room temperature
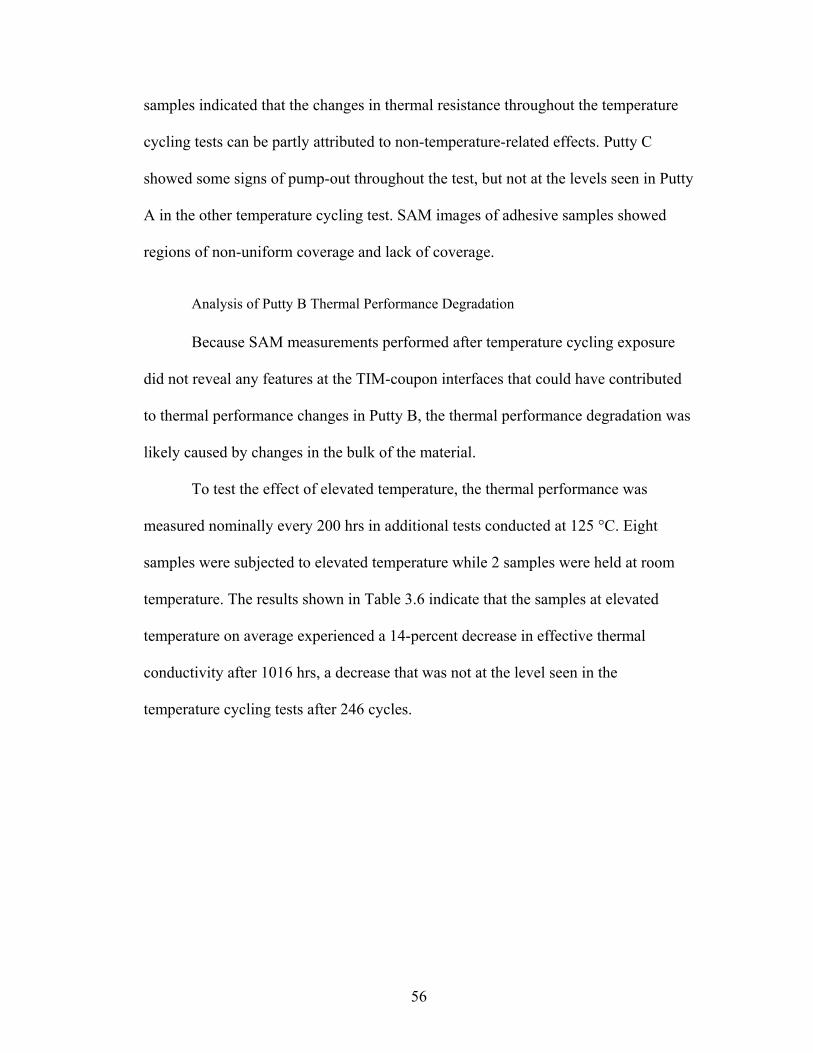
56
samples indicated that the changes in thermal resistance throughout the temperature
cycling tests can be partly attributed to non-temperature-related effects. Putty C
showed some signs of pump-out throughout the test, but not at the levels seen in Putty
A in the other temperature cycling test. SAM images of adhesive samples showed
regions of non-uniform coverage and lack of coverage.
Analysis of Putty B Thermal Performance Degradation
Because SAM measurements performed after temperature cycling exposure
did not reveal any features at the TIM-coupon interfaces that could have contributed
to thermal performance changes in Putty B, the thermal performance degradation was
likely caused by changes in the bulk of the material.
To test the effect of elevated temperature, the thermal performance was
measured nominally every 200 hrs in additional tests conducted at 125 °C. Eight
samples were subjected to elevated temperature while 2 samples were held at room
temperature. The results shown in Table 3.6 indicate that the samples at elevated
temperature on average experienced a 14-percent decrease in effective thermal
conductivity after 1016 hrs, a decrease that was not at the level seen in the
temperature cycling tests after 246 cycles.
57
Table 3.6: Calculated Putty B thermal conductivity based on laser flash
measurements.
Effective TIM Thermal Conductivity (W/m-K)
125oC Room temperature
Baseline 3.5 ± 0.4 3.4 – 3.6
194 hours 3.2 ± 0.3 3.4 – 3.6
386 hours 3.0 ± 0.4 3.4 – 3.6
596 hours 2.9 ± 0.2 3.4 – 3.5
802 hours 2.9 ± 0.2 3.2 – 3.5
1016 hours 3.0 ± 0.2 3.2 – 3.6 % change after 1016
hours -14 +2
As Table 6 shows, thermal decomposition of the TIM due to elevated
temperature was unlikely to be the primary cause for Putty B degradation. This
finding was reasonable since silicone decomposition, which can result from a thermal
decomposition reaction in which the silicone chain is shortened and a cyclic
compound is formed (Dal, 2004; Clarson and Semlyen, 1993), should occur above
180 °C, well above the maximum temperature of the temperature cycling tests,
making this effect alone an unlikely explanation for the observed behavior of Putty B.
The impact of temperature cycling on bulk performance was studied by
examining the effect of the glass transition temperature (Tg) on the thermal
performance of the TIM. The glass transition temperature, Tg, represents the
temperature at which amorphous solids transition from the rubbery to the glassy state.

58
The Tg of Putty B was measured using a dynamic thermal mechanical analyzer
(DTMA) and was performed on a TA Instruments RSA III in dynamic, strain-
controlled, temperature ramp mode. The measurement followed the ASTM E1640-04
Test standard (2004) and used a 5% strain level, a 1-Hz frequency, and a 1 °C/min
ramp rate. Using the temperature at which a change occurs in the slope of the storage
modulus with temperature, as shown in Figure 3.11, the test yielded a Tg of -55 °C,
which was a reasonable value since the presence of filler particles in the silicone can
increase the Tg above that of pure silicone, which is -120 °C (Materials, 2008), and
Putty B was composed of 45% boron nitride (BN) and 55% silicone.
0.00E +00
5.00E +09
1.00E +10
1.50E +10
2.00E +10
2.50E +10
3.00E +10
3.50E +10
4.00E +10
4.50E +10
5.00E +10
‐70 ‐60 ‐50 ‐40 ‐30 ‐20 ‐10 0 10 20 30
Temperature (oC )
E' (N/m
2 )
Figure 3.11: Putty B storage modulus as a function of temperature.
Repeated temperature excursions near the Tg in Putty B may have caused
repeated changes from a hard, brittle state to a soft, rubbery state, leading to
degradation over time. Repeated thermal expansion and contraction, combined with
59
the CTE mismatch of the coupons, may have contributed to additional degradation. It
is important to note that since the minimum temperature during the temperature
cycling test (-55 °C) was below the minimum operating temperature (-45 °C)
recommended by the manufacturer, this behavior may not pose a problem in a typical
application.
Elevated Temperature/Humidity Results
For the elevated temperature/humidity test, the round 12.7 mm diameter metal
coupons were used rather than the 16.4 mm square coupons. This change was found
to result in higher baseline thermal resistance values and a closer match to vendor
data. The results of the elevated temperature/humidity test conducted at 85 ºC/85%
RH on a third group of test samples are shown in Table 7. For the elevated
temperature/humidity tests, all samples with the exception of the Gap Pad A samples
showed an overall resistance decrease at the end of the test compared to the baseline
measurement. The greatest differences between the foil and non-foil were found early
in the test. After 553 hrs, these differences became smaller because the foil most
likely deformed to the contours of the surface. The improvement in performance was
most likely caused by the improved wetting at the contact interfaces due to the
presence of silicone, as was the case for temperature cycling. The Gap Pad A
samples, which were silicone-free, experienced on average a 4% increase in thermal
resistance while other samples experienced up to a 40% reduction in thermal
resistance. The best performing samples were the thermal gels, due to their high bulk
thermal conductivity and thin bondline. Room temperature Gap Pad A and gel
samples remained relatively constant in thermal resistance on average, like the

60
corresponding elevated temperature/humidity samples, as shown in Table 3.7. For the
gel, crosslinking at room temperature may have contributed to a reduction in thermal
resistance in the room temperature samples. For both the Putty A and gel samples, the
greatest overall thermal resistance change occurred after initial exposure (between the
baseline and the measurement at 265 hours), which may have been largely due to
thermal expansion. SAM measurements did not reveal features at the interface that
would have led to changes in thermal performance for the room temperature and
elevated temperature/humidity conditions.
Table 3.7: Calculated TIM thermal resistance under 85 oC/85%RH.
Thermal Resistance (mm2K/W)
Putty A (no foil)
Putty A (w/ foil) Putty B Gap Pad
A Gel
Vendor 125 127 467 656 11
Baseline 163 ± 10 229 ± 48 479 ±31 431 ± 76 41 ± 10
265 hours 147 ± 8 158 ± 15 435 ±14 437 ± 71 28 ± 8
553 hours 147 ± 9 162 ± 12 444 ±17 435 ± 66 27 ± 8
813 hours 146 ± 9 160 ± 11 443 ±11 438 ± 71 26 ± 7
1063 hours 142 ± 8 156 ± 13 374 ±18 428 ± 72 26 ± 8
1310 hours 136 ± 7 154 ± 10 404 ±16 426 ± 65 26 ± 7
1621 hours 141 ± 7 153 ± 14 409 ±23 440 ± 75 26 ± 7
1909 hours 144 ± 8 160 ± 12 407 ±20 441 ± 73 26 ± 7
2173 hours 149 ± 11 172 ± 45 406 ±19 450 ± 72 25 ± 7 Change after 2173 hours
(85oC/85%RH)
-14 (-9%)
-57 (-25%)
-73 (-15%)
+19 (+4%)
-16 (-40%)
Change at end of test
(room temp.)
-8 (-5%)
-98 (-36%)
-72 (-14%)
+19 (+5%)
-14 (-34%)
61
While laser flash data were used to detect changes in TIM thermal
performance, the measured TIM thermal resistance values in temperature cycling
tests were generally lower in magnitude than those calculated using vendor thermal
conductivity values throughout the environmental exposure, with the exception of the
adhesive and some putty samples. This may have been caused by differences in
contact pressure, which could have affected both contact and bulk resistances, or non-
uniform surface heating of the test samples during the laser flash measurement.
Heating of the sample holder clamping plates during the laser flash measurement may
explain much of the lack of agreement in thermal resistance values from temperature
cycling tests, which used the larger square coupons, and elevated
temperature/humidity tests, which used round coupons that more closely matched the
laser flash sample holder openings. The larger coupons allowed more heat to be
conducted into the aluminum sample holder plates due to the higher area in direct
contact with the plates. This effect would have increased the apparent 3-layer thermal
diffusivity based on the measured temperature rise curve, causing experimental TIM
thermal conductivity values to be higher than actual values for the temperature
cycling tests. Measured changes in thermal conductivity over time would also have
been higher than actual values. Using finite element models that simulated heating of
the sample holder plates (to be described in Chapter 4), the actual change in thermal
resistance for the putty B samples, which showed the highest levels of degradation,
was estimated to be up to approximately 33% lower than the measured thermal
resistance changes reported in Table 3.5 as a result of sample holder plate heating.

62
Simulations indicate that samples which showed little change in thermal resistance
due to environmental exposure would still have showed little change even with this
effect. In addition to these effects, variability in thermal resistance values for some
temperature cycling and elevated temperature/humidity test specimens can be partly
attributed to variability in the bondline thickness of the assembled TIM specimens.
63
Chapter 4: Validation of Laser Flash Results from Reliability
Tests
Modeling Approach
To study potential issues arising from use of the laser flash method on
clamped TIM specimens and to explain reliability test measurements presented
Chapter 3, finite element (FE) models were constructed and simulations were
performed. More specifically, thermal finite element model simulations of the laser
flash test measurement assessed the impact of the sample holder on the calculated
TIM thermal conductivity while structural simulations examined mechanical loading
on TIM test specimens.
Thermal Simulations
In Chapter 3, laser flash measurements of 3-layer test specimens clamped
between two sample holder plates yielded TIM thermal conductivity values much
higher than those reported in vendor datasheets. It was surmised that nonuniform
surface heating, leading to radial conduction in the test specimen and heating of the
sample holder plates, was responsible for this discrepancy, but this effect was not
investigated and is therefore explored in this study. When the test coupons are much
larger than the opening in the top sample holder plate, only the open area of the
sample is directly irradiated. Because the surface heating is now localized in the
center of the test specimen surface, lateral heat spreading occurs, and the temperature
64
waves propagate both radially (in plane) and through the thickness of the three-layer
specimen. This is a deviation from ideal laser flash measurements, where the entire
area on one side of the test specimen is irradiated, effectively producing one-
dimensional conduction through the 3-layer test specimen.
The approach used in the FEA simulation of the laser flash measurement
involved first assuming a value for thermal conductivity of the TIM layer and
applying a transient heat flux to the test specimen to approximate the pulse from the
laser that irradiates the test specimen. The half-rise times obtained from the
temperature rise curve of the simulated 3-layer test sample resulted in thermal
diffusivity values, from which TIM thermal conductivity could be determined using
the Lee method. Since this value may differ from the initial value of thermal
conductivity assumed in the model, the value must be iterated. This procedure is
summarized in Figure 4.1. The finite element model was generated assuming no heat
conduction to the sample holder plate and screws, no radiative heat losses from the
test specimen, and isotropic, homogeneous material properties.
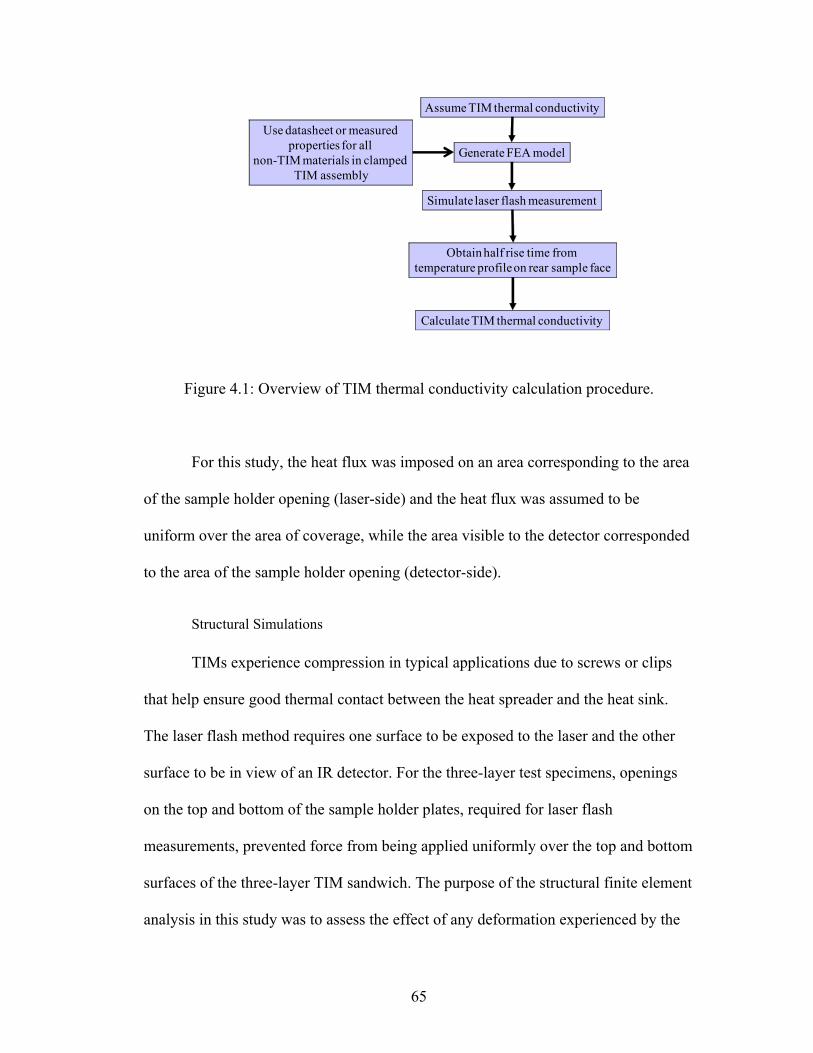
65
Use datasheet or measuredproperties for all
non-TIM materials in clampedTIM assembly
Assume TIM thermal conductivity
Simulate laser flash measurement
Calculate TIM thermal conductivity
Obtain half rise time from temperature profile on rear sample face
Generate FEA model
Figure 4.1: Overview of TIM thermal conductivity calculation procedure.
For this study, the heat flux was imposed on an area corresponding to the area
of the sample holder opening (laser-side) and the heat flux was assumed to be
uniform over the area of coverage, while the area visible to the detector corresponded
to the area of the sample holder opening (detector-side).
Structural Simulations
TIMs experience compression in typical applications due to screws or clips
that help ensure good thermal contact between the heat spreader and the heat sink.
The laser flash method requires one surface to be exposed to the laser and the other
surface to be in view of an IR detector. For the three-layer test specimens, openings
on the top and bottom of the sample holder plates, required for laser flash
measurements, prevented force from being applied uniformly over the top and bottom
surfaces of the three-layer TIM sandwich. The purpose of the structural finite element
analysis in this study was to assess the effect of any deformation experienced by the

66
TIM layer, as a result of the opening in the sample holder plates that clamp the TIM.
The results would help determine how well the TIM laser flash test fixtures
approximate typical TIM application loading conditions, which are assumed to result
in a uniform bondline thickness.
TIMs in this study were assumed to exhibit linear viscoelastic behavior. The
generalized Maxwell model approximates linear viscoelastic behavior as a series of
springs and dashpots in parallel (Ferry, 1980). Mechanical material properties can be
represented using the kernel function of generalized Maxwell elements expressed in
terms of the Prony series as follows (Ferry, 1980; ANSYS, 2009):
∑=
∞ ⎟⎟⎠
⎞⎜⎜⎝
⎛−+=
Gn
i timei
tGGG1
expτ
(4.1)
where G is the elastic shear modulus and τ is the relaxation time for each Prony
component. The viscoelastic material properties were determined using Prony series
fits with 5 terms. Assuming the material was isotropic, shear modulus (G) was
determined from elongation modulus (E) data (ANSYS, 2009), using ν = 0.49, the
isotropic material assumption, and the following relation:
98.2)1(2EEG =
+=
ν (4.2)
To measure the material properties of the TIM layer used in the finite element
models, stress relaxation tests were conducted using dynamic mechanical analysis
(DMA). Input properties for the sample holder plates and coupons were based on
reference handbook values. Simulations were performed with and without the
openings in the sample holder plates used for laser flash measurements, keeping all
other parameters constant to examine the impact of the opening on TIM deformation.
67
Some mechanisms for degradation, such as delamination, occur or originate at
the interface between the TIM and the contacting structure, rather than the bulk of the
TIM. Accurately simulating thermomechanical stresses and strains in the test
structure, including the interactions between the surfaces and the TIM, is important in
simulating conditions that give rise to degradation in TIM thermal performance.
Manufacturing relating conditions and CTE mismatch induced by warpage can lead
to surface non-planarity in the application environment. The initial TIM bondline
could be considered to be relatively flat since flatness tolerances on contacting
components are on the order of 0.002 inch per inch of travel for microprocessor
applications (Dean, 1998).
Experimental Results
Laser flash measurements on multiple TIM samples were carried out using
square and round test coupons, as summarized in Table 4.1. Vendor values of thermal
resistance were based on TIM thermal conductivity datasheet values using as-
assembled thickness values of the test specimens. Laser flash data generally yielded
moderately lower thermal resistances than those based on vendor datasheet values,
but for clamped square specimens, which used samples much larger than the opening,
the differences were up to a factor of 3. Differences with vendor values and
discrepancies among laser flash measurements performed on the same TIM suggested
that test coupons in combination with the sample holders may be contributing to
error.

68
Table 4.1: Comparison of laser flash measurements with vendor values:
a) square test coupons; b) round test coupons.
a) Thermal Resistance (mm2K/W)
Putty A (no foil) Adhesive Gap Filler Gap Pad A Gap Pad B
Vendor 101 22 271 633 213
Measured 80 ± 5 69 ± 7 125 ± 11 253 ± 42 69 ± 7 b)
Thermal Resistance (mm2K/W)
Putty A (no foil)
Putty A (w/ foil) Putty B Gap Pad A Gel
Vendor 125 127 467 656 11
Measured 163 ± 10 229 ± 48 479 ±31 431 ± 76 41 ± 10
To evaluate the impact of radial heating and sample holder plate heating
effects, five round samples of varying radii and five square samples of varying side
length of Gap Pad A were measured at a compression level of between 5-10%. While
these measurements showed that a square TIM specimen larger than the opening can
increase the calculated TIM thermal conductivity, the round specimens did not show
this trend, and in some cases, a higher radius led to a lower calculated TIM layer
thermal conductivity. These results are summarized in Figure 4.2. It was also seen
that with increasing sample area, the signal also decreased and for samples with larger
radii or side lengths, the temperature profiles had lower signals to noise ratios,
indicating that these data points may not be suitable for establishing a trend.
As shown in Figure 4.3, which shows measured TIM thermal conductivity values for
various sample sizes using aluminum or Lexan sample holder plates, Gap pad A
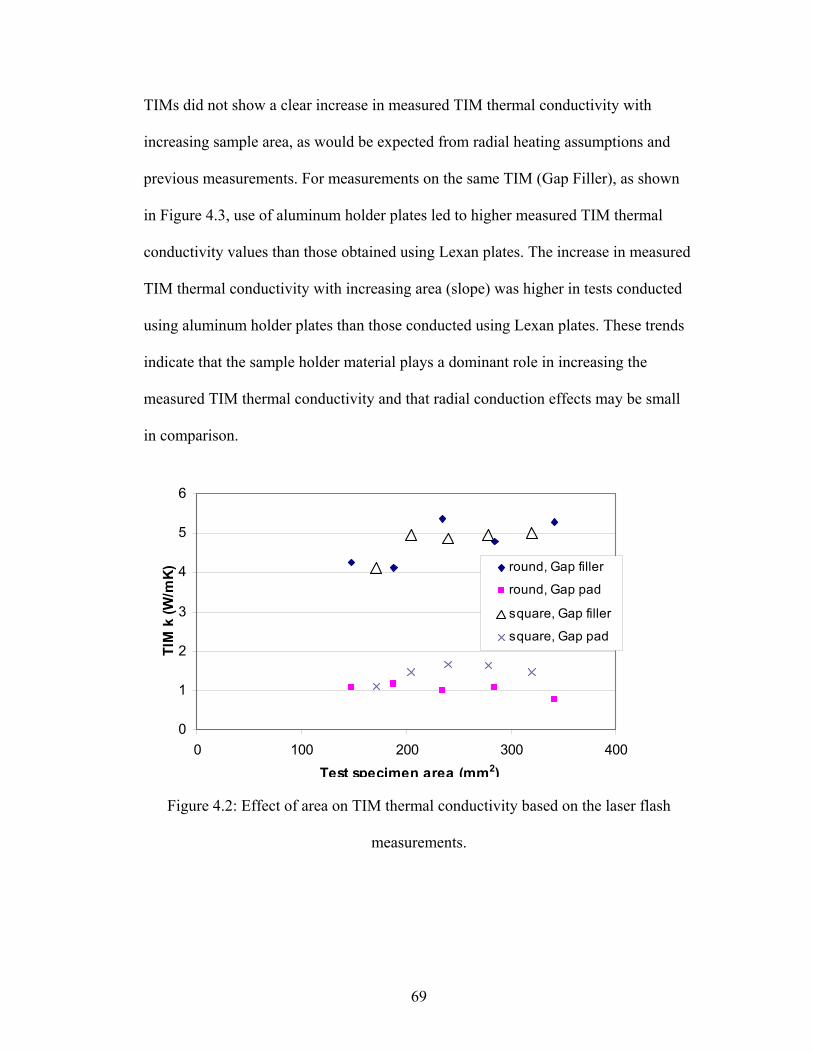
69
TIMs did not show a clear increase in measured TIM thermal conductivity with
increasing sample area, as would be expected from radial heating assumptions and
previous measurements. For measurements on the same TIM (Gap Filler), as shown
in Figure 4.3, use of aluminum holder plates led to higher measured TIM thermal
conductivity values than those obtained using Lexan plates. The increase in measured
TIM thermal conductivity with increasing area (slope) was higher in tests conducted
using aluminum holder plates than those conducted using Lexan plates. These trends
indicate that the sample holder material plays a dominant role in increasing the
measured TIM thermal conductivity and that radial conduction effects may be small
in comparison.
0
1
2
3
4
5
6
0 100 200 300 400Test specimen area (mm2)
TIM
k (W
/mK
) round, Gap filler
round, Gap pad
square, Gap filler
square, Gap pad
Figure 4.2: Effect of area on TIM thermal conductivity based on the laser flash
measurements.

70
0
1
2
3
4
5
6
7
8
0 100 200 300 400Test specimen area (mm2)
TIM
k (W
/mK
) round, Al plates
round, Lexan plates
square, Al plates
square, Lexan plates
Figure 4.3: Effect of area on TIM thermal conductivity based on the laser flash
measurements of Gap Filler.
Tests in which both Lexan and aluminum were used in combination for
sample holder plates during the same measurements yielded data used to distinguish
between the relative contributions of each plate in increasing the measured TIM
thermal conductivity values, as summarized in Table 4.2. Heat flow into the top and
bottom sample holder plates appears to have contributed equally to the increase in
apparent measured TIM thermal conductivity, suggesting that heating of both sample
holder plates led to increased measured TIM thermal conductivity values.
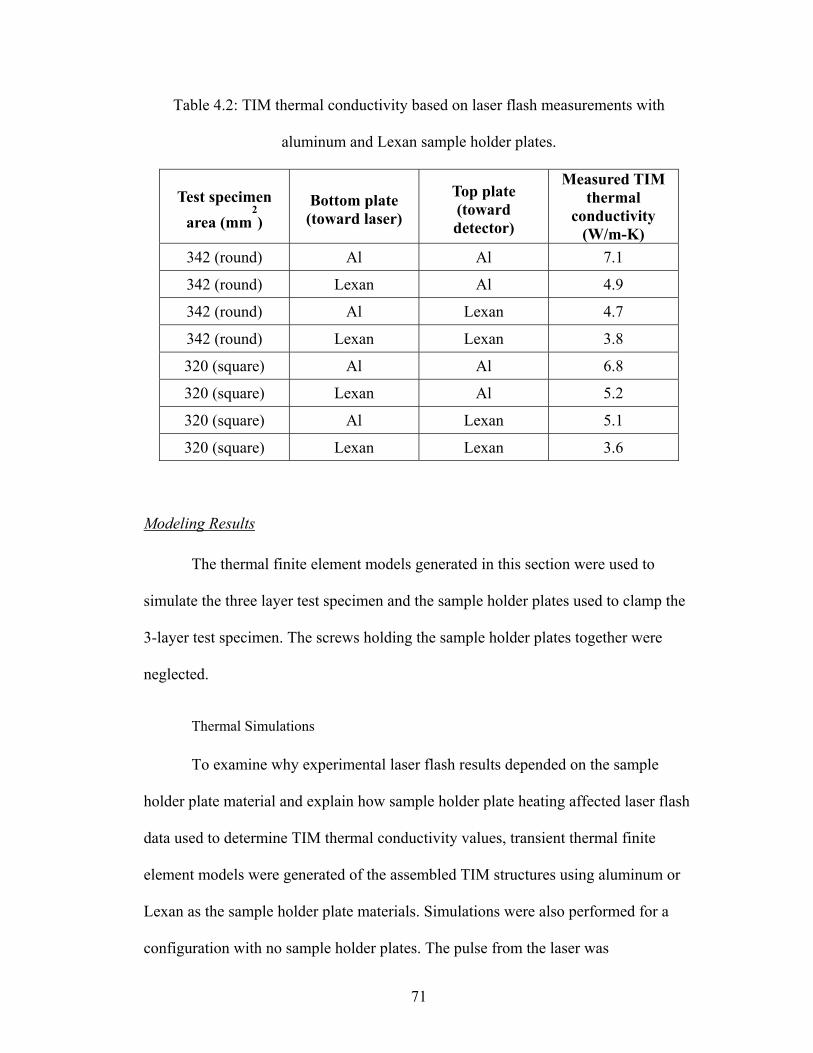
71
Table 4.2: TIM thermal conductivity based on laser flash measurements with
aluminum and Lexan sample holder plates.
Test specimen area (mm
2)
Bottom plate (toward laser)
Top plate (toward detector)
Measured TIM thermal
conductivity (W/m-K)
342 (round) Al Al 7.1
342 (round) Lexan Al 4.9
342 (round) Al Lexan 4.7
342 (round) Lexan Lexan 3.8
320 (square) Al Al 6.8
320 (square) Lexan Al 5.2
320 (square) Al Lexan 5.1
320 (square) Lexan Lexan 3.6
Modeling Results
The thermal finite element models generated in this section were used to
simulate the three layer test specimen and the sample holder plates used to clamp the
3-layer test specimen. The screws holding the sample holder plates together were
neglected.
Thermal Simulations
To examine why experimental laser flash results depended on the sample
holder plate material and explain how sample holder plate heating affected laser flash
data used to determine TIM thermal conductivity values, transient thermal finite
element models were generated of the assembled TIM structures using aluminum or
Lexan as the sample holder plate materials. Simulations were also performed for a
configuration with no sample holder plates. The pulse from the laser was
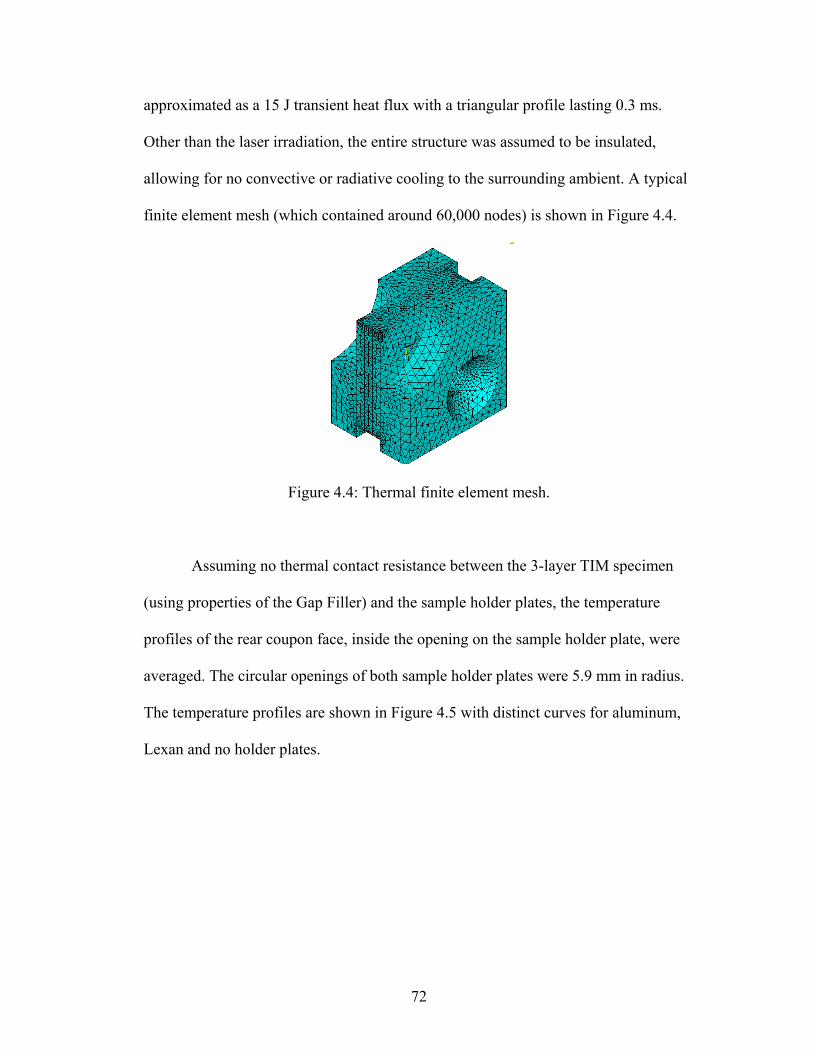
72
approximated as a 15 J transient heat flux with a triangular profile lasting 0.3 ms.
Other than the laser irradiation, the entire structure was assumed to be insulated,
allowing for no convective or radiative cooling to the surrounding ambient. A typical
finite element mesh (which contained around 60,000 nodes) is shown in Figure 4.4.
Figure 4.4: Thermal finite element mesh.
Assuming no thermal contact resistance between the 3-layer TIM specimen
(using properties of the Gap Filler) and the sample holder plates, the temperature
profiles of the rear coupon face, inside the opening on the sample holder plate, were
averaged. The circular openings of both sample holder plates were 5.9 mm in radius.
The temperature profiles are shown in Figure 4.5 with distinct curves for aluminum,
Lexan and no holder plates.
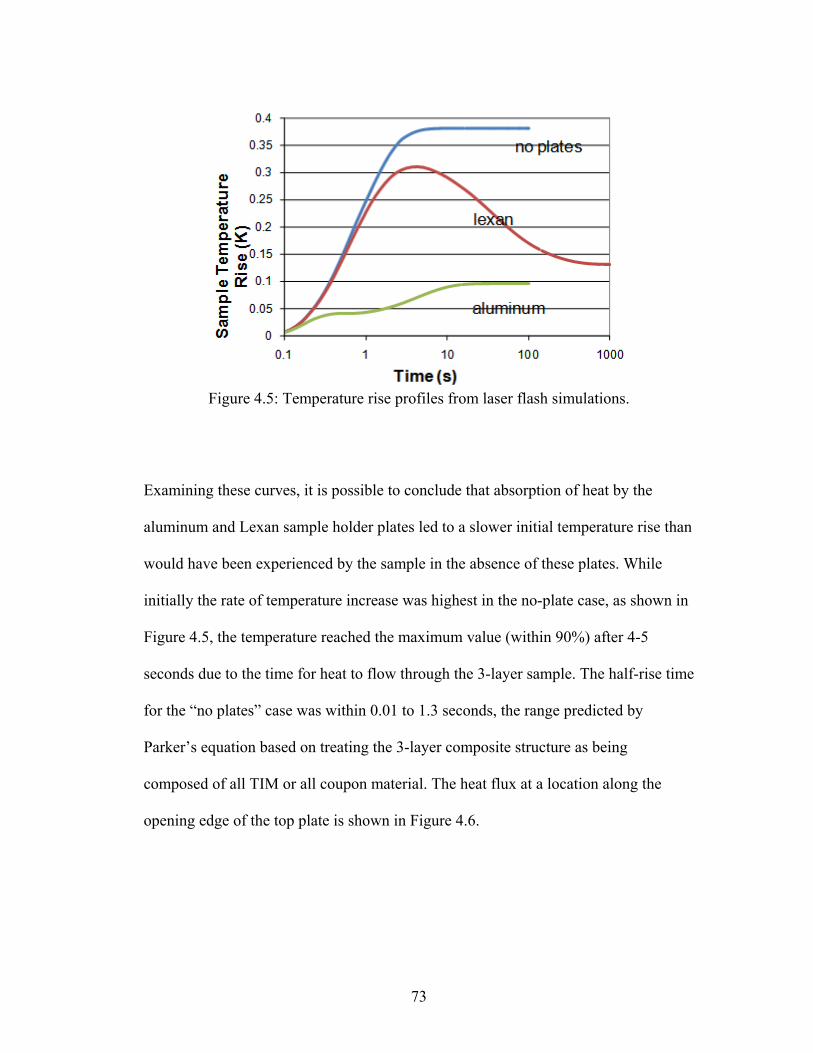
73
Figure 4.5: Temperature rise profiles from laser flash simulations.
Examining these curves, it is possible to conclude that absorption of heat by the
aluminum and Lexan sample holder plates led to a slower initial temperature rise than
would have been experienced by the sample in the absence of these plates. While
initially the rate of temperature increase was highest in the no-plate case, as shown in
Figure 4.5, the temperature reached the maximum value (within 90%) after 4-5
seconds due to the time for heat to flow through the 3-layer sample. The half-rise time
for the “no plates” case was within 0.01 to 1.3 seconds, the range predicted by
Parker’s equation based on treating the 3-layer composite structure as being
composed of all TIM or all coupon material. The heat flux at a location along the
opening edge of the top plate is shown in Figure 4.6.
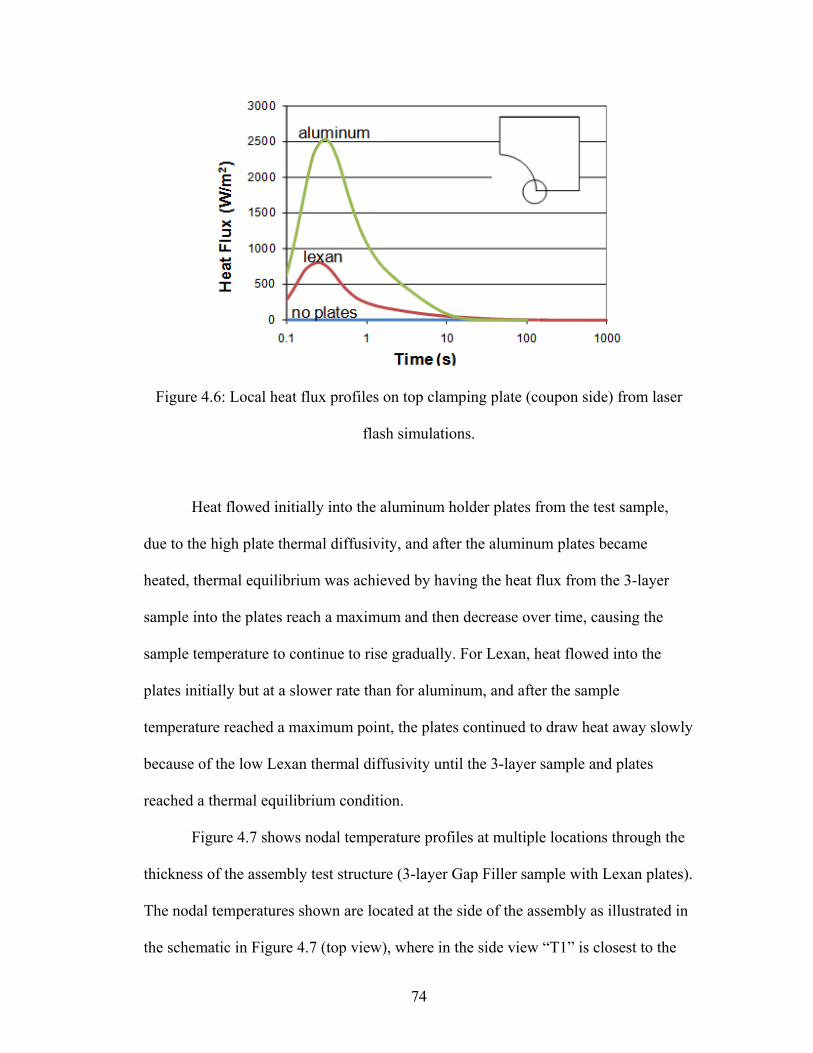
74
Figure 4.6: Local heat flux profiles on top clamping plate (coupon side) from laser
flash simulations.
Heat flowed initially into the aluminum holder plates from the test sample,
due to the high plate thermal diffusivity, and after the aluminum plates became
heated, thermal equilibrium was achieved by having the heat flux from the 3-layer
sample into the plates reach a maximum and then decrease over time, causing the
sample temperature to continue to rise gradually. For Lexan, heat flowed into the
plates initially but at a slower rate than for aluminum, and after the sample
temperature reached a maximum point, the plates continued to draw heat away slowly
because of the low Lexan thermal diffusivity until the 3-layer sample and plates
reached a thermal equilibrium condition.
Figure 4.7 shows nodal temperature profiles at multiple locations through the
thickness of the assembly test structure (3-layer Gap Filler sample with Lexan plates).
The nodal temperatures shown are located at the side of the assembly as illustrated in
the schematic in Figure 4.7 (top view), where in the side view “T1” is closest to the
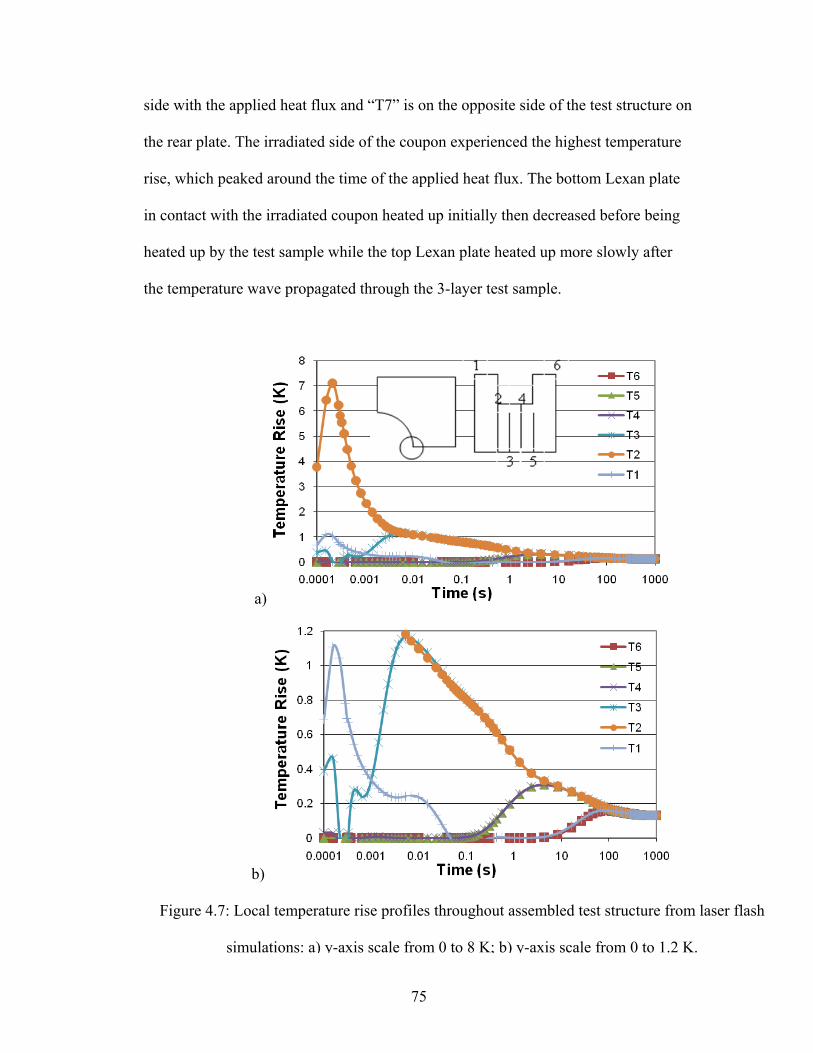
75
side with the applied heat flux and “T7” is on the opposite side of the test structure on
the rear plate. The irradiated side of the coupon experienced the highest temperature
rise, which peaked around the time of the applied heat flux. The bottom Lexan plate
in contact with the irradiated coupon heated up initially then decreased before being
heated up by the test sample while the top Lexan plate heated up more slowly after
the temperature wave propagated through the 3-layer test sample.
a)
b)
Figure 4.7: Local temperature rise profiles throughout assembled test structure from laser flash
simulations: a) y-axis scale from 0 to 8 K; b) y-axis scale from 0 to 1.2 K.
76
Since the entire simulated structure was insulated (except for the initial laser
pulse), the final temperature was above the initial temperature. The temperature rise
of the entire assembly at the steady-state condition (when the temperature no longer
changed with time) depended on the specific heat capacity values, with the lower
specific heat values corresponding to the higher steady-state temperatures. Using an
energy balance and treating the 3-layer sample and plates as a single system with no
heat loss, the steady-state temperature rises from the simulation were calculated to be
0.32, 0.12, and 0.09 K, for no plates, Lexan, and aluminum, respectively by summing
the heat capacity contributions from all materials and assuming lumped capacitance.
These values were within 15% of the steady-state values from the FE simulation,
which were 0.38, 0.13, and 0.09 K, respectively.
Using the thermal properties of the gap filler, which had a datasheet
thermal conductivity value of 2.8 W/m-K, simulations were performed with round
and square test specimens. No thermal contact resistance was assumed between the
TIM test sample and sample holder plates. Half-rise time values were based on the
early part of the temperature rise profile, which resulted primarily from heating of the
test specimen, rather than the sample holder plates. Due to the suppression of the
sample temperature rise by the holding plates, the increase in TIM thermal
conductivity was higher in the simulations with larger test specimens, which lead to a
larger area being in contact with the sample holder plates, and higher in the
simulations with aluminum plates compared to those with Lexan plates. The
discrepancy between measured and simulated results in tests using the aluminum

77
plate may have been largely due to the no contact resistance assumption.
Measurements with Lexan plates, however, showed a different trend, higher
measured values than simulated values, and this may have resulted from the actual
TIM thermal conductivity being higher than the datasheet value used for the input
value in the model. In addition, the Lexan plate samples may not have had the same
plate-to-sample contact resistance as the aluminum plate samples during laser flash
measurements. These results are summarized in Table 4.3.
Table 4.3: Calculated TIM thermal conductivity based on simulation of Gap Filler
assuming no contact resistance between the TIM test sample and sample holder
plates.
Test specimen area (mm
2)
Plate material
Measured TIM thermal conductivity
(W/m-K)
FEA TIM thermal
conductivity (W/m-K)
147 (round) Al 4.2 9.8
147 (round) Lexan 3.2 2.9
147 (round) None N/A 2.7
320 (square) Al 6.8 11.0
320 (square) Lexan 3.6 3.2
320 (square) None N/A 2.8
Adding the same level of simulated plate-to-sample contact resistance (0.2 or
0.5 W/m-K layer with a 0.5 mm thickness) had a greater impact on TIM thermal
conductivity values for the aluminum plate samples than for the Lexan plate samples,
as shown in Table 4.4. Since the aluminum plates were conductive, additional contact
resistance significantly reduced the calculated TIM thermal conductivities due to
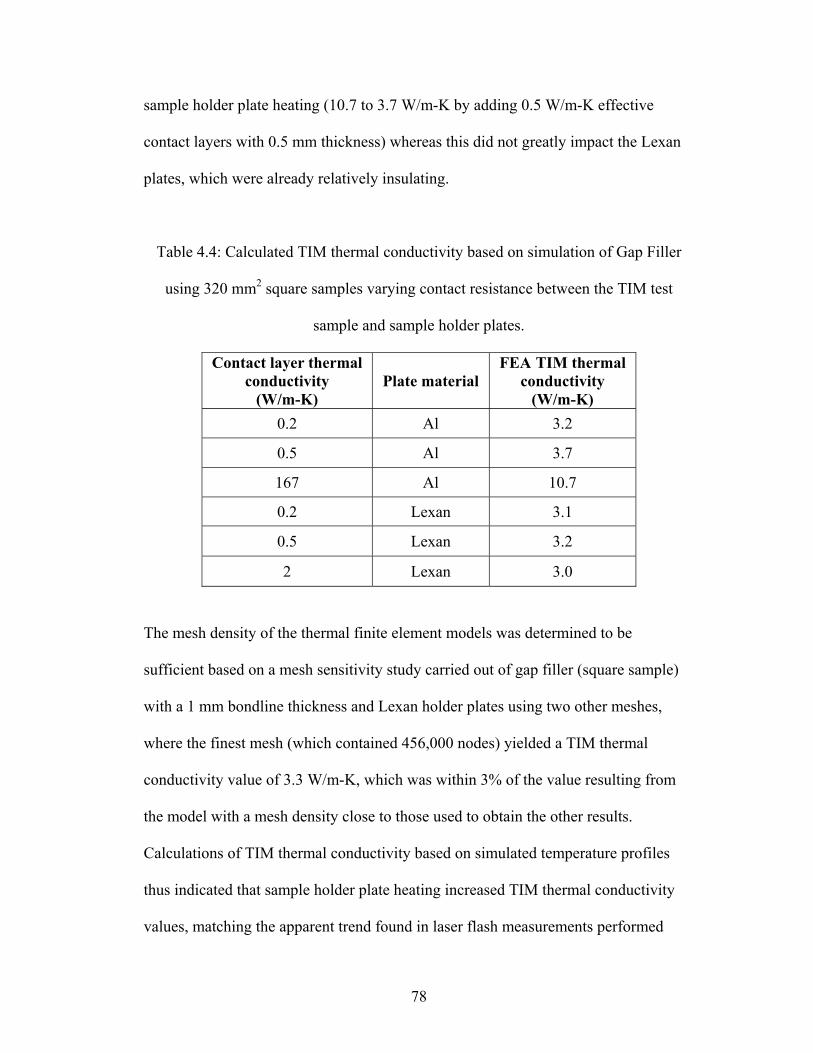
78
sample holder plate heating (10.7 to 3.7 W/m-K by adding 0.5 W/m-K effective
contact layers with 0.5 mm thickness) whereas this did not greatly impact the Lexan
plates, which were already relatively insulating.
Table 4.4: Calculated TIM thermal conductivity based on simulation of Gap Filler
using 320 mm2 square samples varying contact resistance between the TIM test
sample and sample holder plates.
Contact layer thermal conductivity
(W/m-K) Plate material
FEA TIM thermal conductivity
(W/m-K) 0.2 Al 3.2
0.5 Al 3.7
167 Al 10.7
0.2 Lexan 3.1
0.5 Lexan 3.2
2 Lexan 3.0
The mesh density of the thermal finite element models was determined to be
sufficient based on a mesh sensitivity study carried out of gap filler (square sample)
with a 1 mm bondline thickness and Lexan holder plates using two other meshes,
where the finest mesh (which contained 456,000 nodes) yielded a TIM thermal
conductivity value of 3.3 W/m-K, which was within 3% of the value resulting from
the model with a mesh density close to those used to obtain the other results.
Calculations of TIM thermal conductivity based on simulated temperature profiles
thus indicated that sample holder plate heating increased TIM thermal conductivity
values, matching the apparent trend found in laser flash measurements performed

79
with aluminum sample holder plates. This result was because the laser flash method
assumes that for thin test samples uniformly heated on one side, the half-rise time
(time to reach one-half the maximum value) associated with the temperature rise on
the opposite side, is inversely related to the thermal diffusivity, as described by
equation 2. Clamping the TIM specimens altered their temperature history
considerably from the ideal laser flash test specimen conditions, which allow for heat
flow through the 3-layer specimen only. This resulted in lower slopes and more
complex temperature rise profiles, and the equivalent half rise times for clamped
samples were highly dependent on the magnitude of the first local maximum
temperature (first inflection point in the temperature profile). The half rise time was
calculated using the first inflection point since the laser flash instrument likely used
the early part of the temperature rise profile to calculate thermal diffusivity. This
reference point was lower for configurations with a greater sample holder plate
heating effects. For samples with aluminum plates, using the second inflection point
in the temperature rise profile would have resulted in TIM thermal conductivity
values that were lower than those based on the first inflection point: 1.2 W/m-K
rather than 11.0 W/m-K for the square samples and 5.4 W/m-K rather than 9.8 W/m-
K for the round samples. Since lower half rise times resulted in higher thermal
diffusivities, the TIM thermal conductivity values based on three-layer thermal
diffusivity values were higher for samples experiencing a greater sample holder plate
heating effect. This has important consequences for reliability evaluation since
measured changes over time are experimentally determined as measured differences

80
in TIM thermal conductivity at different times, which would also be higher than
actual changes in TIM thermal conductivity over time.
Even though sample holder plate heating should be avoided, using a plate
design that reduces these effects may be difficult in some circumstances; for instance,
when environmental conditions in a given reliability test and structural considerations
also drive the plate material design and selection. Correcting for this effect requires
performing a series of simulations to establish the relationship between input TIM
thermal conductivity in the FE model, which corresponds to the actual value in a
realistic case, and output TIM thermal conductivity from the FE model, which would
be affected by sample holder plate heating. At least one accurate TIM thermal
conductivity measurement, obtained from a datasheet, an accurate alternative test
method, or laser flash data obtained using a low conductivity sample holder plate
material could be used as the input TIM thermal conductivity in the FE model. The
contact resistance between the test specimen and each plate can then be varied until
agreement is achieved between the TIM thermal conductivity calculated from the
finite element model and the value used in the model (assumed to be accurate). Using
this contact resistance value for a given TIM and loading condition, the input TIM
thermal conductivity values can then be varied to obtain the relationship between the
actual and calculated TIM thermal conductivity values. This fitting approach assumes
that the contact resistance between the test specimen and each plate does not change
over time. For example, in measurements of Putty B using aluminum plates, the plots
shown in Figure 4.8, which show results with a 0.5 mm-thick effective contact
resistance layer between the 3-layer test sample and each sample holder plate,
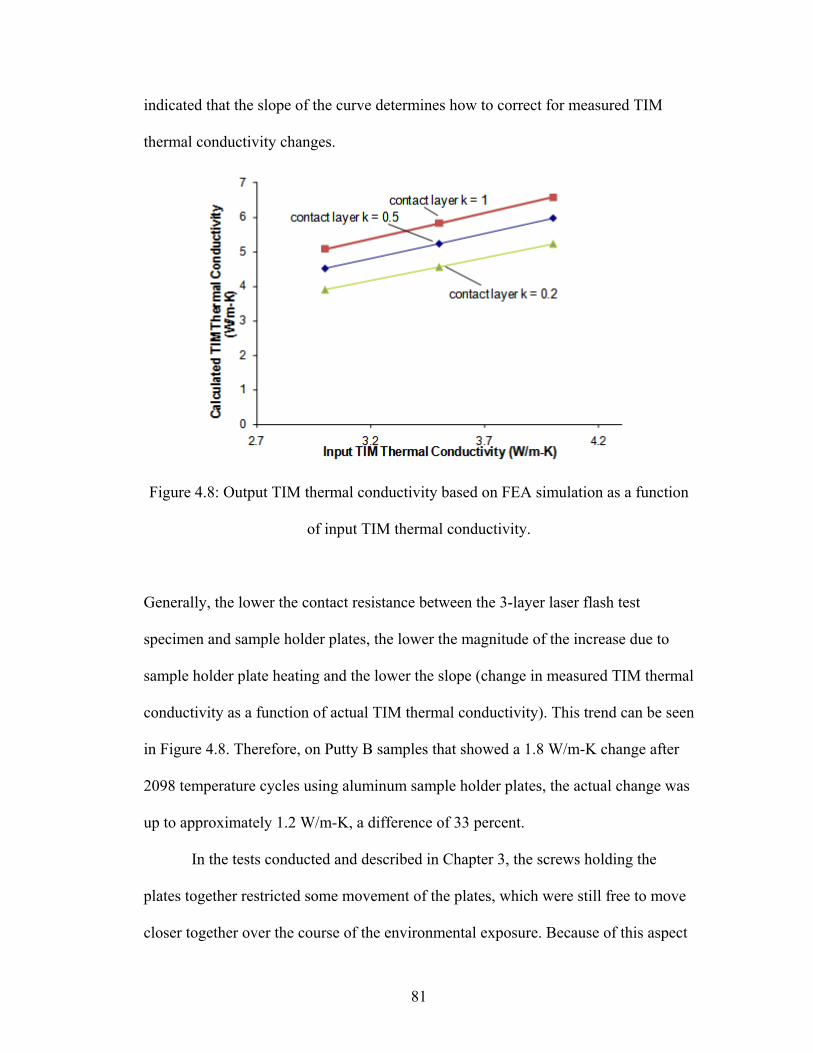
81
indicated that the slope of the curve determines how to correct for measured TIM
thermal conductivity changes.
Figure 4.8: Output TIM thermal conductivity based on FEA simulation as a function
of input TIM thermal conductivity.
Generally, the lower the contact resistance between the 3-layer laser flash test
specimen and sample holder plates, the lower the magnitude of the increase due to
sample holder plate heating and the lower the slope (change in measured TIM thermal
conductivity as a function of actual TIM thermal conductivity). This trend can be seen
in Figure 4.8. Therefore, on Putty B samples that showed a 1.8 W/m-K change after
2098 temperature cycles using aluminum sample holder plates, the actual change was
up to approximately 1.2 W/m-K, a difference of 33 percent.
In the tests conducted and described in Chapter 3, the screws holding the
plates together restricted some movement of the plates, which were still free to move
closer together over the course of the environmental exposure. Because of this aspect
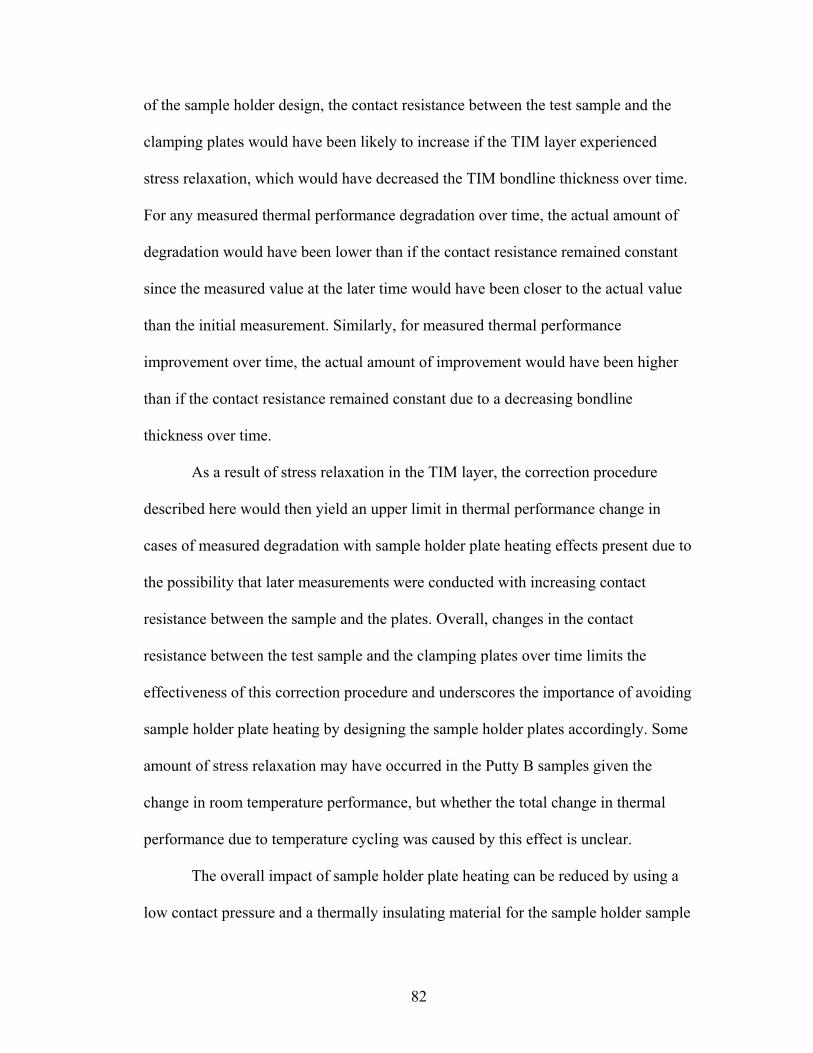
82
of the sample holder design, the contact resistance between the test sample and the
clamping plates would have been likely to increase if the TIM layer experienced
stress relaxation, which would have decreased the TIM bondline thickness over time.
For any measured thermal performance degradation over time, the actual amount of
degradation would have been lower than if the contact resistance remained constant
since the measured value at the later time would have been closer to the actual value
than the initial measurement. Similarly, for measured thermal performance
improvement over time, the actual amount of improvement would have been higher
than if the contact resistance remained constant due to a decreasing bondline
thickness over time.
As a result of stress relaxation in the TIM layer, the correction procedure
described here would then yield an upper limit in thermal performance change in
cases of measured degradation with sample holder plate heating effects present due to
the possibility that later measurements were conducted with increasing contact
resistance between the sample and the plates. Overall, changes in the contact
resistance between the test sample and the clamping plates over time limits the
effectiveness of this correction procedure and underscores the importance of avoiding
sample holder plate heating by designing the sample holder plates accordingly. Some
amount of stress relaxation may have occurred in the Putty B samples given the
change in room temperature performance, but whether the total change in thermal
performance due to temperature cycling was caused by this effect is unclear.
The overall impact of sample holder plate heating can be reduced by using a
low contact pressure and a thermally insulating material for the sample holder sample

83
holder plates with low thermal diffusivity and specific heat. TIM test coupons should
only be slightly larger than the openings of the sample holder plates, minimizing the
contact area between the holder plates and the test specimen such that the laser pulse
area nearly covers the entire test specimen on one side during the laser flash
measurement. If a high conductivity material like metal is needed for the sample
holder sample holder plates, a thin insulating layer could be added at the interface
between the test coupons and the sample holder plates. Other sample holder plate
shapes, such as a ring, may be possible as long as there is little contact between the
plates and the test specimen.
Structural Simulations
Structural finite element models simulated test samples as assembled for laser
flash measurements, in which the three layer samples were clamped using either
Lexan or aluminum sample holder plates. Putty B and Gap Pad A were selected as
representative TIMs to be modeled, and copper and alloy 42 were used as the
coupons in the 3-layer sandwich. To obtain the TIM shear modulus profiles, stress
relaxation tests were performed using dynamic mechanical analysis (DMA) in strain-
controlled transient mode at room temperature. DMA test specimens were 4 mm by 4
mm in area, and the initial thicknesses of the Putty B and Gap Pad A specimens were
1 mm and 0.55 mm, respectively, matching the initial thicknesses in the simulated
laser flash test structures.
The Prony series coefficients were generated in ANSYS based on the
measured shear modulus profiles, and the resulting values were used to determine
TIM material property inputs in the FEA model. In the finite element models, screws
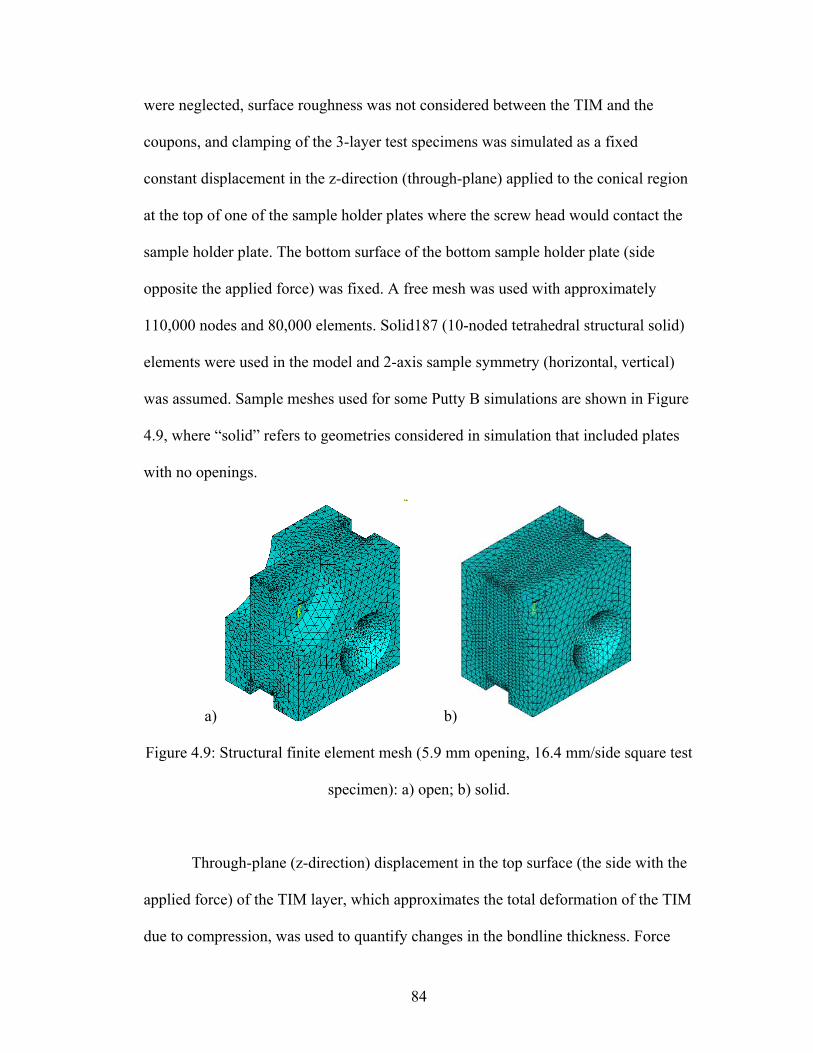
84
were neglected, surface roughness was not considered between the TIM and the
coupons, and clamping of the 3-layer test specimens was simulated as a fixed
constant displacement in the z-direction (through-plane) applied to the conical region
at the top of one of the sample holder plates where the screw head would contact the
sample holder plate. The bottom surface of the bottom sample holder plate (side
opposite the applied force) was fixed. A free mesh was used with approximately
110,000 nodes and 80,000 elements. Solid187 (10-noded tetrahedral structural solid)
elements were used in the model and 2-axis sample symmetry (horizontal, vertical)
was assumed. Sample meshes used for some Putty B simulations are shown in Figure
4.9, where “solid” refers to geometries considered in simulation that included plates
with no openings.
a) b)
Figure 4.9: Structural finite element mesh (5.9 mm opening, 16.4 mm/side square test
specimen): a) open; b) solid.
Through-plane (z-direction) displacement in the top surface (the side with the
applied force) of the TIM layer, which approximates the total deformation of the TIM
due to compression, was used to quantify changes in the bondline thickness. Force
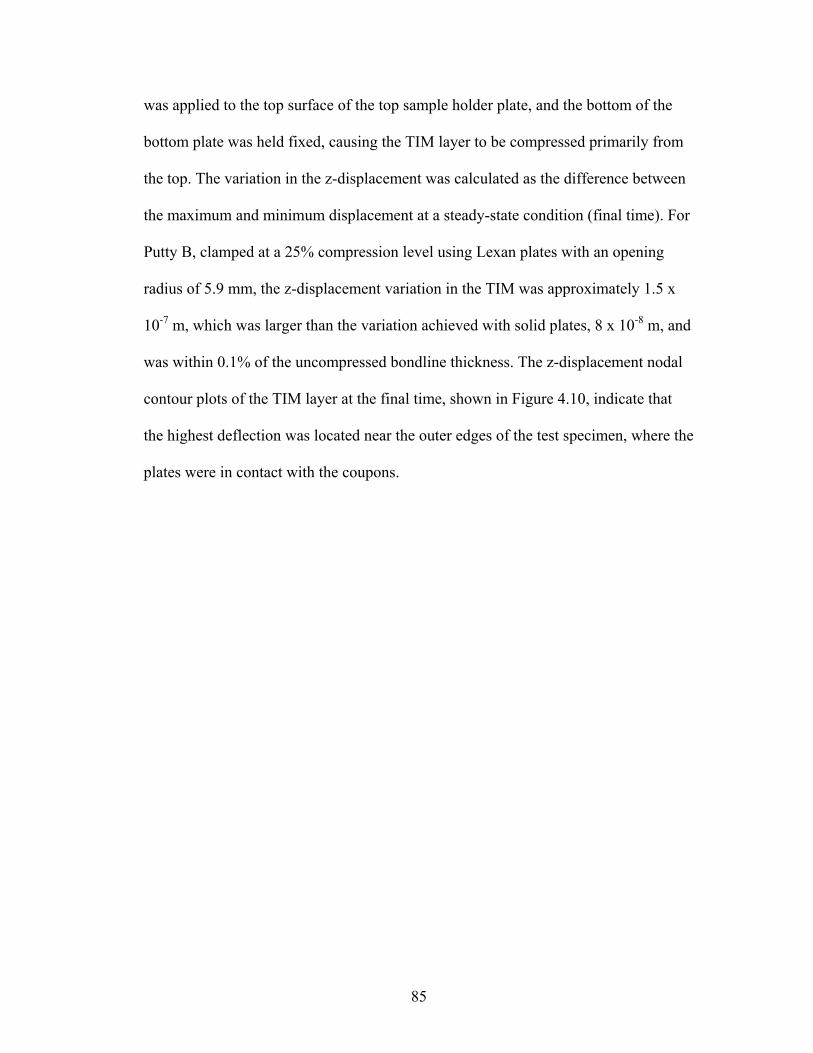
85
was applied to the top surface of the top sample holder plate, and the bottom of the
bottom plate was held fixed, causing the TIM layer to be compressed primarily from
the top. The variation in the z-displacement was calculated as the difference between
the maximum and minimum displacement at a steady-state condition (final time). For
Putty B, clamped at a 25% compression level using Lexan plates with an opening
radius of 5.9 mm, the z-displacement variation in the TIM was approximately 1.5 x
10-7 m, which was larger than the variation achieved with solid plates, 8 x 10⁻⁸ m, and
was within 0.1% of the uncompressed bondline thickness. The z-displacement nodal
contour plots of the TIM layer at the final time, shown in Figure 4.10, indicate that
the highest deflection was located near the outer edges of the test specimen, where the
plates were in contact with the coupons.
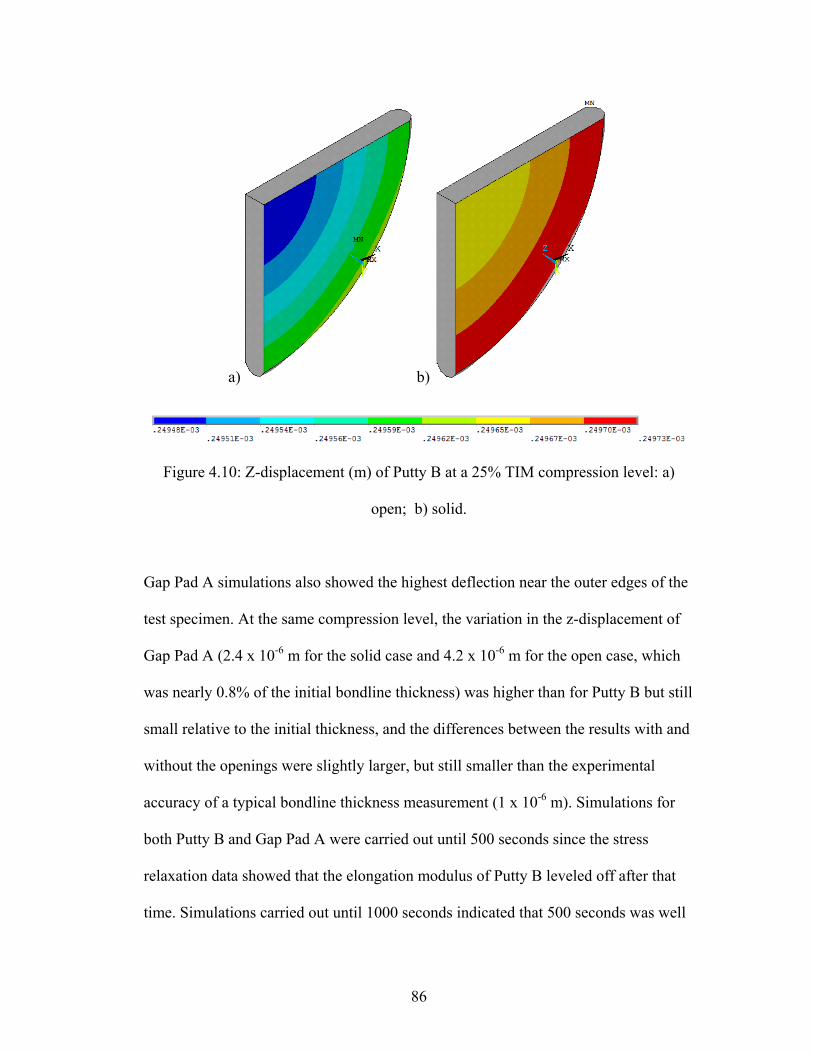
86
a) b)
Figure 4.10: Z-displacement (m) of Putty B at a 25% TIM compression level: a)
open; b) solid.
Gap Pad A simulations also showed the highest deflection near the outer edges of the
test specimen. At the same compression level, the variation in the z-displacement of
Gap Pad A (2.4 x 10⁻⁶ m for the solid case and 4.2 x 10⁻⁶ m for the open case, which
was nearly 0.8% of the initial bondline thickness) was higher than for Putty B but still
small relative to the initial thickness, and the differences between the results with and
without the openings were slightly larger, but still smaller than the experimental
accuracy of a typical bondline thickness measurement (1 x 10⁻⁶ m). Simulations for
both Putty B and Gap Pad A were carried out until 500 seconds since the stress
relaxation data showed that the elongation modulus of Putty B leveled off after that
time. Simulations carried out until 1000 seconds indicated that 500 seconds was well

87
within the steady-state range. The mesh density was determined to be sufficient based
on a mesh sensitivity study carried out using two other meshes. The finest mesh (with
444,000 nodes and 310,000 elements) for the Gap Pad A simulation for the solid case
at 25% compression level yielded a z-displacement variation of 3.7 x 10⁻⁶ m, which
was within 11% of the result obtained using the other mesh.
Nodal contour plots of the z-displacement showed similar distributions in the
TIM z-displacement at higher compression levels for both materials, and the
displacement variation increased with increasing compression level. Assembly
configurations for the open and solid cases matched each other well (within 1 x 10⁻⁶
m for Putty B, and 1 x 10⁻⁵ m for Gap Pad A) at multiple TIM compression levels
from 10% to 75% when comparing variation in TIM z-displacement, as summarized
in Table 4.5.
Table 4.5: Steady-state TIM z-displacement.
Through-plane displacement variation of TIM layer (m)
TIM % Compression(TIM layer) Open Solid
Putty B 10 5.20E-08 3.00E-08
Putty B 25 1.50E-07 8.00E-08
Putty B 50 2.60E-07 1.50E-07
Putty B 75 4.70E-07 2.90E-07
Gap Pad A 10 1.85E-06 1.20E-06
Gap Pad A 25 4.20E-06 2.44E-06
Gap Pad A 50 9.34E-06 6.10E-06
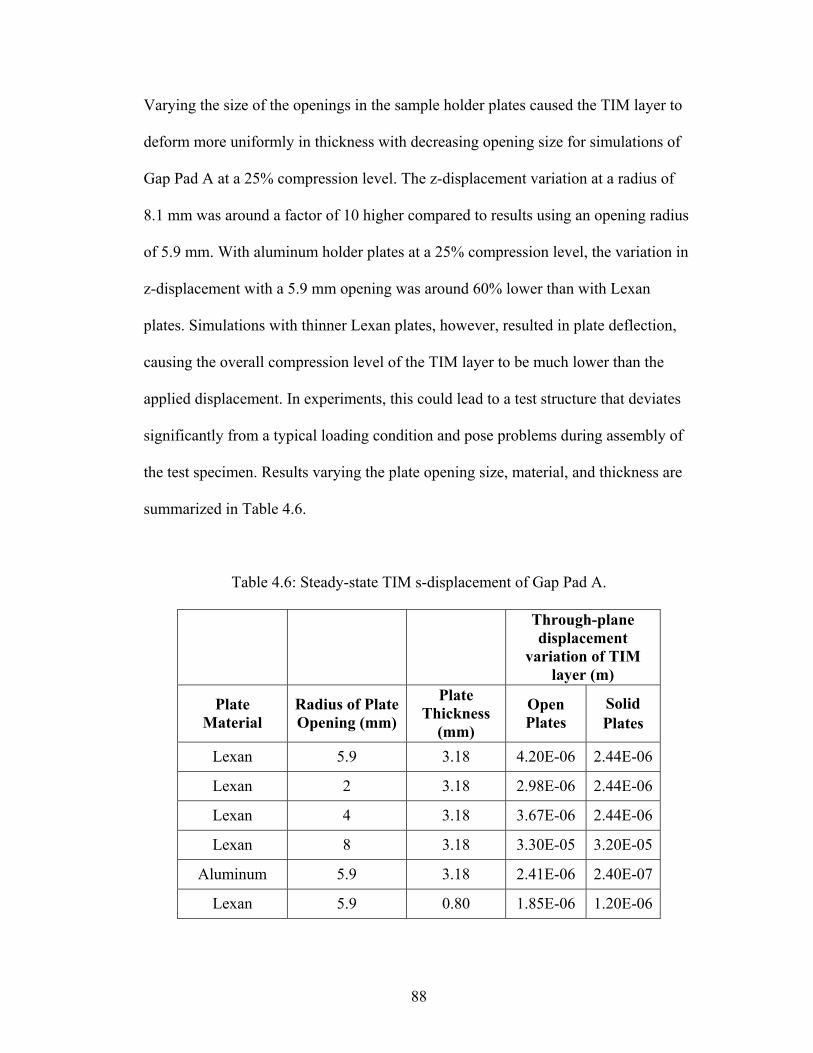
88
Varying the size of the openings in the sample holder plates caused the TIM layer to
deform more uniformly in thickness with decreasing opening size for simulations of
Gap Pad A at a 25% compression level. The z-displacement variation at a radius of
8.1 mm was around a factor of 10 higher compared to results using an opening radius
of 5.9 mm. With aluminum holder plates at a 25% compression level, the variation in
z-displacement with a 5.9 mm opening was around 60% lower than with Lexan
plates. Simulations with thinner Lexan plates, however, resulted in plate deflection,
causing the overall compression level of the TIM layer to be much lower than the
applied displacement. In experiments, this could lead to a test structure that deviates
significantly from a typical loading condition and pose problems during assembly of
the test specimen. Results varying the plate opening size, material, and thickness are
summarized in Table 4.6.
Table 4.6: Steady-state TIM s-displacement of Gap Pad A.
Through-plane displacement
variation of TIM layer (m)
Plate Material
Radius of Plate Opening (mm)
Plate Thickness
(mm)
Open Plates
Solid Plates
Lexan 5.9 3.18 4.20E-06 2.44E-06
Lexan 2 3.18 2.98E-06 2.44E-06
Lexan 4 3.18 3.67E-06 2.44E-06
Lexan 8 3.18 3.30E-05 3.20E-05
Aluminum 5.9 3.18 2.41E-06 2.40E-07
Lexan 5.9 0.80 1.85E-06 1.20E-06

89
Given these trends, a configuration with a large opening and coupon area, low
stiffness plates, and a high stiffness TIM layer would be expected to result in the most
nonuniform deformation in the TIM. For a Gap Pad A sample compressed at 50% of
the initial thickness and clamped using Lexan plates with an 8 mm radius opening,
the variation in displacement of the TIM layer was found to be 3.3 x 10⁻⁵ m, still
within 6 % of the uncompressed bondline thickness. Even in this extreme case, the
TIM remained relatively uniform in thickness, indicating that TIM specimens of
similar dimensions, geometries, and moduli would also be suitable for laser flash
measurements, assembled in clamped 3-layer structures. These results indicate that
laser flash test structures can approximate typical TIM loading conditions that
produce uniform bondline thicknesses.
Comparison of Laser Flash Data with Steady-State Data
Steady-state thermal conductivity measurements were performed to validate
the capability of laser flash measurements to accurately measure TIM thermal
resistance (magnitude) and to accurately capture TIM thermal conductivity changes
over time. Generally, steady-state measurements are a more commonly accepted
method of evaluating TIM thermal performance than the laser flash method.
Steady-State Tester Design
The steady-state tester design was intended to use test specimens that
approximates TIM specimens as assembled in laser flash test structures. Heat was
applied using a Kapton film heater attached to a copper block and the temperature
90
difference across the TIM specimen was measured using thermocouples embedded in
aluminum blocks, which were in contact with the test specimen on both sides. Each
thermocouple was fed in through the side, midway through the thickness, with the
bead located at the center of each aluminum block. An active heat sink was used to
cool the top of the tester. Thermal insulation in contact with the heater on the bottom
was a woven ceramic layer. Thermal grease was used to improve the thermal contact
between solid surfaces. Figure 4.11 shows the steady-state tester.
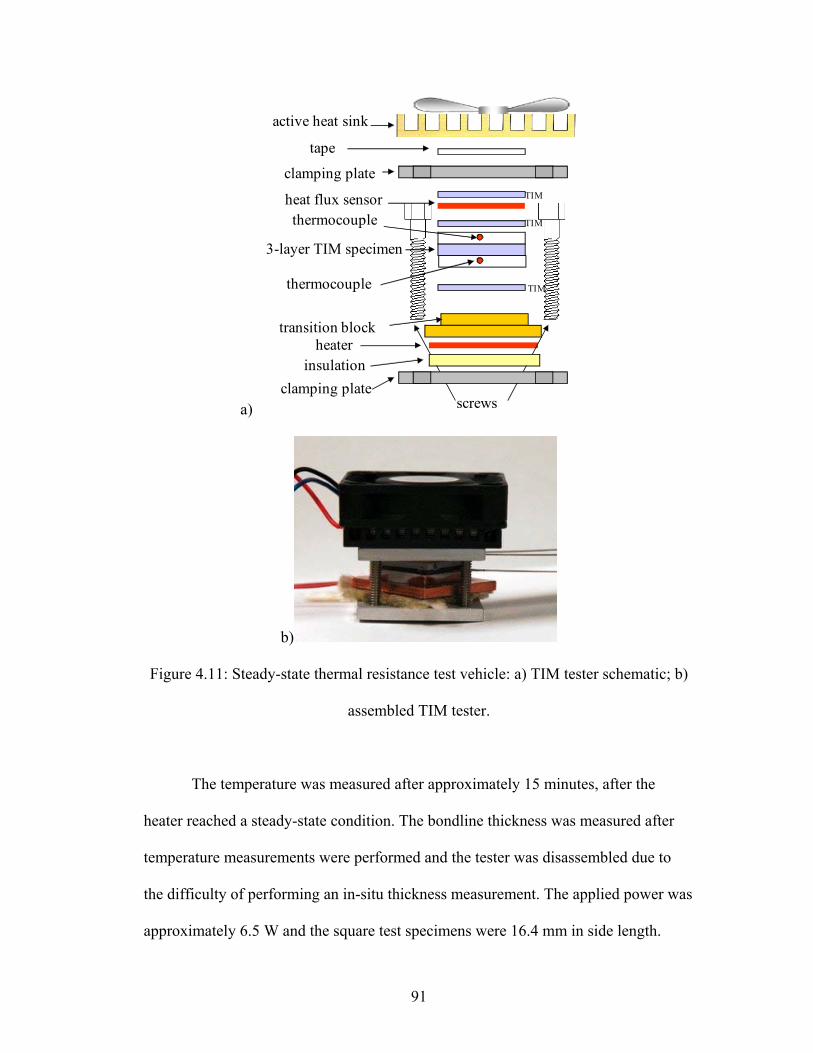
91
a)
tape
heat flux sensor
screwsclamping plate
insulation
3-layer TIM specimen
active heat sink
clamping plate
transition blockheater
TIM
TIM
TIM
thermocouple
thermocouple
b)
Figure 4.11: Steady-state thermal resistance test vehicle: a) TIM tester schematic; b)
assembled TIM tester.
The temperature was measured after approximately 15 minutes, after the
heater reached a steady-state condition. The bondline thickness was measured after
temperature measurements were performed and the tester was disassembled due to
the difficulty of performing an in-situ thickness measurement. The applied power was
approximately 6.5 W and the square test specimens were 16.4 mm in side length.

92
Time-Dependent Steady-State Measurements of Gel Samples
Gel samples were cured at 80 oC for 1 hour. Samples were then held at room
temperature and the effective thermal conductivity of two samples were measured
over time using the laser flash method and two additional samples measured using a
steady-state technique. Over the course of 13 days, the thermal conductivity of the
samples increased due to crosslinking in the polymer, but the overall change in
thermal conductivity of the steady-state samples was about 50% lower on average
than that of the laser flash samples, as shown in Figure 4.12. Variability in sample
assembly and preparation and sample holder plate heating may have contributed to
discrepancies between laser flash and steady-state data in the initial measurement
since agreement in the thermal conductivity values after 13 days was within 0.1 W/m-
K on average.

93
Figure 4.12: Measured gel thermal conductivity after high temperature cure.
Absolute Steady-State Thermal Conductivity Comparison
Comparisons of multiple TIMs generally showed good agreement in absolute
thermal conductivity values (within x %) with laser flash measurements and vendor
data. Laser flash tests used 8 mm diameter round copper coupons on both sides of
each test specimen with Lexan samples holder plates. All measurements were
performed at a room ambient temperature and are summarized in Table 4.7. In
instances where the laser flash values differed considerably from vendor values, such
as the gel and Putty A, the steady-state values showed better agreement with laser
flash values. This may have been largely due to differences in contact pressure and
time in the high temperature cure.
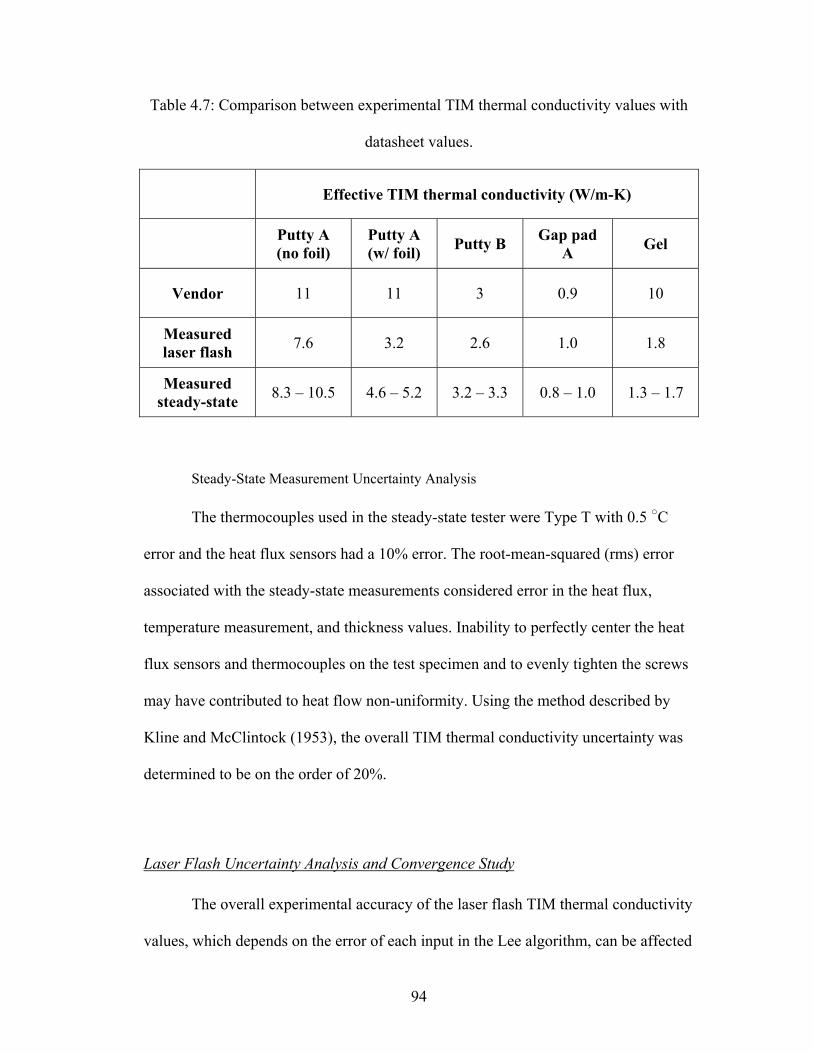
94
Table 4.7: Comparison between experimental TIM thermal conductivity values with
datasheet values.
Effective TIM thermal conductivity (W/m-K)
Putty A (no foil)
Putty A (w/ foil) Putty B Gap pad
A Gel
Vendor 11 11 3 0.9 10
Measured laser flash 7.6 3.2 2.6 1.0 1.8
Measured steady-state 8.3 – 10.5 4.6 – 5.2 3.2 – 3.3 0.8 – 1.0 1.3 – 1.7
Steady-State Measurement Uncertainty Analysis
The thermocouples used in the steady-state tester were Type T with 0.5 ○C
error and the heat flux sensors had a 10% error. The root-mean-squared (rms) error
associated with the steady-state measurements considered error in the heat flux,
temperature measurement, and thickness values. Inability to perfectly center the heat
flux sensors and thermocouples on the test specimen and to evenly tighten the screws
may have contributed to heat flow non-uniformity. Using the method described by
Kline and McClintock (1953), the overall TIM thermal conductivity uncertainty was
determined to be on the order of 20%.
Laser Flash Uncertainty Analysis and Convergence Study
The overall experimental accuracy of the laser flash TIM thermal conductivity
values, which depends on the error of each input in the Lee algorithm, can be affected
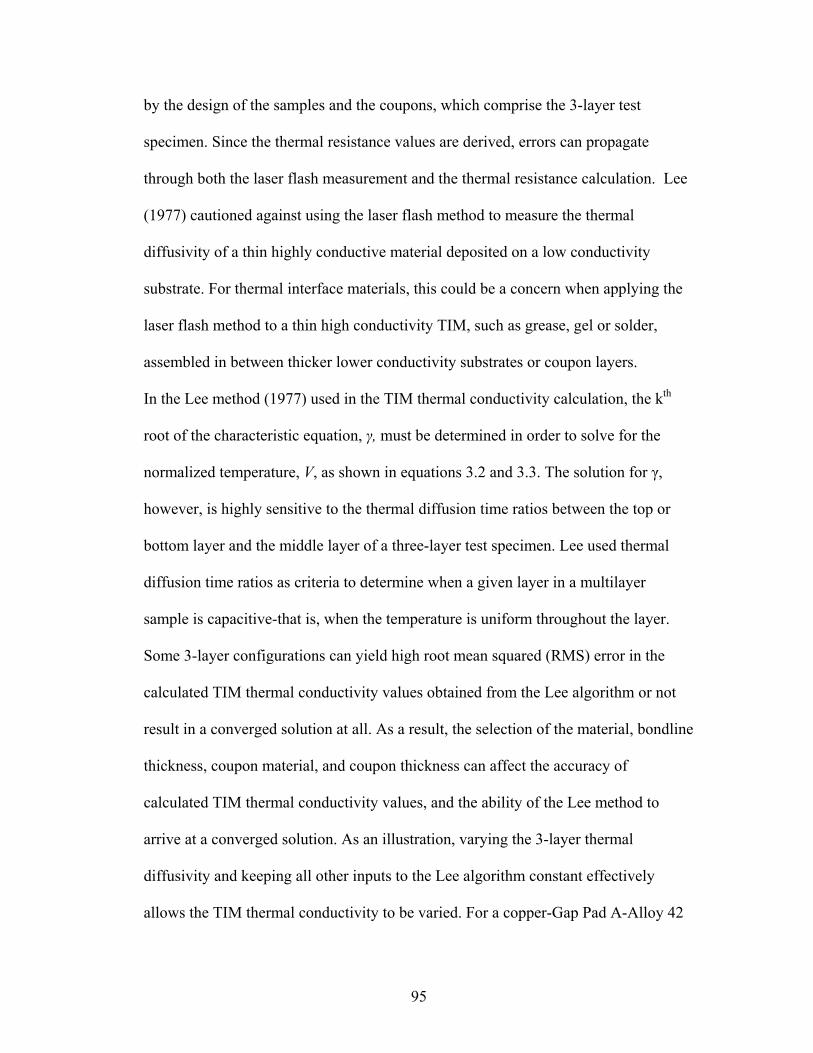
95
by the design of the samples and the coupons, which comprise the 3-layer test
specimen. Since the thermal resistance values are derived, errors can propagate
through both the laser flash measurement and the thermal resistance calculation. Lee
(1977) cautioned against using the laser flash method to measure the thermal
diffusivity of a thin highly conductive material deposited on a low conductivity
substrate. For thermal interface materials, this could be a concern when applying the
laser flash method to a thin high conductivity TIM, such as grease, gel or solder,
assembled in between thicker lower conductivity substrates or coupon layers.
In the Lee method (1977) used in the TIM thermal conductivity calculation, the kth
root of the characteristic equation, γ, must be determined in order to solve for the
normalized temperature, V, as shown in equations 3.2 and 3.3. The solution for γ,
however, is highly sensitive to the thermal diffusion time ratios between the top or
bottom layer and the middle layer of a three-layer test specimen. Lee used thermal
diffusion time ratios as criteria to determine when a given layer in a multilayer
sample is capacitive-that is, when the temperature is uniform throughout the layer.
Some 3-layer configurations can yield high root mean squared (RMS) error in the
calculated TIM thermal conductivity values obtained from the Lee algorithm or not
result in a converged solution at all. As a result, the selection of the material, bondline
thickness, coupon material, and coupon thickness can affect the accuracy of
calculated TIM thermal conductivity values, and the ability of the Lee method to
arrive at a converged solution. As an illustration, varying the 3-layer thermal
diffusivity and keeping all other inputs to the Lee algorithm constant effectively
allows the TIM thermal conductivity to be varied. For a copper-Gap Pad A-Alloy 42

96
composite test specimen, small changes in the η ratios lead to increasingly larger
changes in the calculated TIM thermal conductivity values as the η ratios increase,
and above around 190 W/m-K, the Lee algorithm does not result in a converged
solution for a step size of 1 x 10⁻⁶, as shown in Figure 4.13.
0
20
40
60
80
100
120
140
160
180
200
0 1 2 3 4 5 6 7 8 9ηi/j
Cal
cula
ted
TIM
ther
mal
co
nduc
itivt
y (W
/m-K
)
η 1/2
η 3/2
Figure 4.13: Calculated TIM thermal conductivity as a function of thermal diffusion
time ratios of 3-layer copper-Gap Pad A-alloy 42 test specimen.
For measured samples in this study, this effect led to varying levels of RMS error,
calculated using the method described by Kline and McKlintock (1953) and Moffat
(1988).
RMS error in calculated TIM thermal conductivity values reached 37% for the
gel, which was the thinnest material with the highest in conductivity in the group
when assembled with 1 mm copper and alloy 42 coupons, as shown in Table 4.8. By
varying assumed hypothetical values of the 3-layer thermal diffusivity and using all
the same inputs used in measurements, the calculated maximum ηcoupon/TIM values (the
97
maximum values beyond which the Lee method produced nonconverged solutions for
TIM thermal conductivity) was determined for each of the two coupon-TIM
combinations per samples as summarized in Table 4.8. The maximum value for each
η ratio pair varied from less than 4 to over 26, and values that led to converged
solutions for one material did not result in converged solutions for others. While
configurations with low η ratios may be more suitable for applying Lee algorithm, the
results suggest that acceptable η ratios may be material dependent and that η ratios
alone may not be sufficient for use as definitive criteria to determine suitability of
applying the Lee algorithm for all TIM types.
Table 4.8: Comparison of laser flash measurements with vendor values.
Gap Filler Putty B Gel Adhesive Gap
Pad A Experimental
TIM thermal
conductivity ± rms error (W/m-K)
6.5 ± 0.9 3.9 ± 0.4 6.7 ± 2.5 2.1 ± 0.7 2.1 ± 0.3
Experimental rms error (%) 14 10 37 34 16
Experimental η
1/2 0.2 0.1 1.5 0.3 0.2
Experimental η
3/2 1.0 0.5 8.2 1.7 0.9
Calculated maximum η
1/2 0.9 0.7 4.9 1.6 2.7
Calculated maximum η
3/2 4.7 3.5 26.4 8.3 14.6
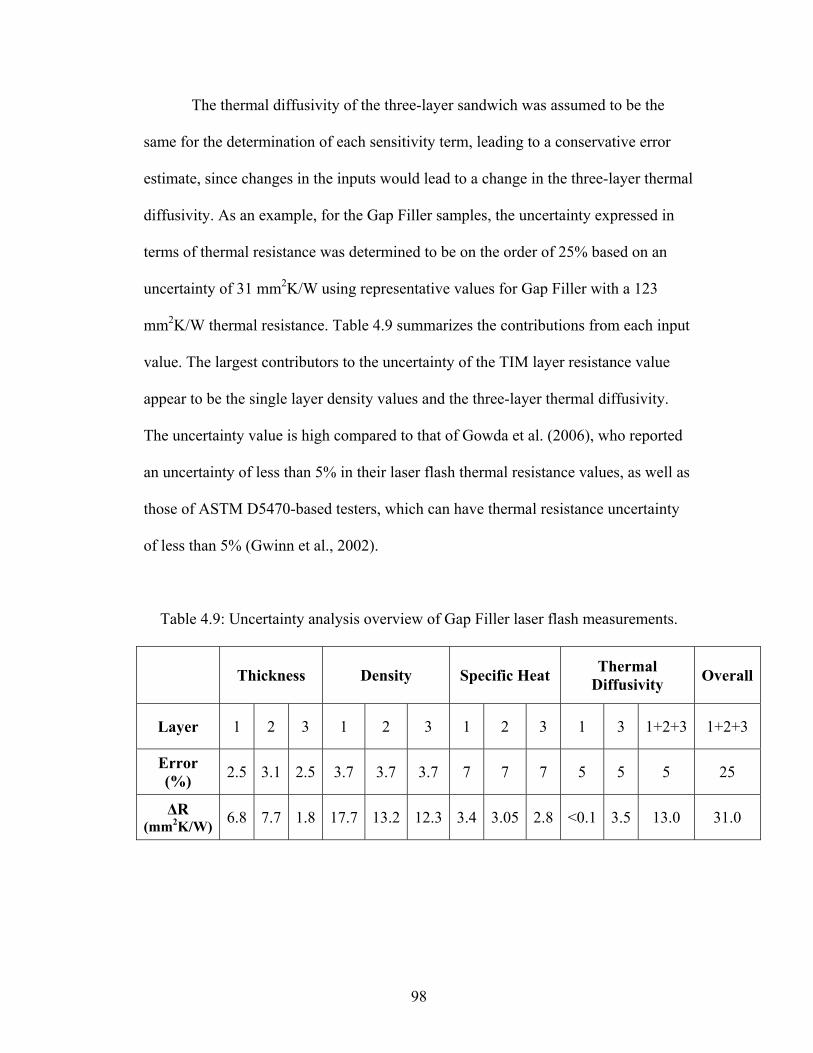
98
The thermal diffusivity of the three-layer sandwich was assumed to be the
same for the determination of each sensitivity term, leading to a conservative error
estimate, since changes in the inputs would lead to a change in the three-layer thermal
diffusivity. As an example, for the Gap Filler samples, the uncertainty expressed in
terms of thermal resistance was determined to be on the order of 25% based on an
uncertainty of 31 mm2K/W using representative values for Gap Filler with a 123
mm2K/W thermal resistance. Table 4.9 summarizes the contributions from each input
value. The largest contributors to the uncertainty of the TIM layer resistance value
appear to be the single layer density values and the three-layer thermal diffusivity.
The uncertainty value is high compared to that of Gowda et al. (2006), who reported
an uncertainty of less than 5% in their laser flash thermal resistance values, as well as
those of ASTM D5470-based testers, which can have thermal resistance uncertainty
of less than 5% (Gwinn et al., 2002).
Table 4.9: Uncertainty analysis overview of Gap Filler laser flash measurements.
Thickness Density Specific Heat Thermal Diffusivity Overall
Layer 1 2 3 1 2 3 1 2 3 1 3 1+2+3 1+2+3
Error (%) 2.5 3.1 2.5 3.7 3.7 3.7 7 7 7 5 5 5 25
ΔR (mm2K/W) 6.8 7.7 1.8 17.7 13.2 12.3 3.4 3.05 2.8 <0.1 3.5 13.0 31.0
99
Chapter 5: Conclusions and Recommendations
Conclusions
TIM degradation can affect the ability of electronic devices to perform
reliably. Since interfacial thermal resistance from the chip to the heat sink is
becoming a significant fraction of the total junction-to-ambient thermal resistance in
many applications, understanding the causes of degradation can help prevent
thermally-induced malfunctions or failure. Although advances have been made
experimentally and in understanding the conditions leading to degradation for some
TIMs, there is a need for improved experimental techniques to obtain accurate
degradation data. The primary goal of the proposed research was to examine
degradation for select polymer TIMs and in validating laser flash data obtained from
reliability tests, address a few of the outstanding issues associated with applying the
laser flash method to TIM reliability characterization.
TIM Reliability Study
With the exception of Gap Pad A and Putty B, the selected environmental
conditions examined in this study were not found to degrade the thermal performance
of the TIMs under test. Silicones, which represent many of the TIMs examined in
this study, are known for their inherent stability due to their high dissociation bond
energies which allowed them to remain stable over the course of the environmental
100
exposure tests. Little change or a reduction in thermal resistance was observed
throughout temperature cycling tests conducted on filled polymer TIMs using two
temperature profiles (-40 to 125 oC for 760 cycles and -55 to 125 oC for 2098 cycles)
that conformed to the manufacturer’s recommended operating temperatures with one
exception. Gap Pad A experienced a 6 percent overall thermal resistance increase and
appeared to show delamination occurring at the TIM-copper coupon interfaces.
Temperature cycling also led to thermal expansion of some putty samples and the
formation of cracks that were visible in SAM images. Silicone extraction, which can
reduce thermal contact resistance by filling in gaps and asperities, may have caused
thermal performance to improve slightly over time for some gap filler and putty
samples.
Crosslinking most likely contributed to improvement in thermal performance
of the epoxy adhesive and gel over time. Bulk changes in Putty B led to over a 50%
decrease in thermal performance at the more extreme temperature cycling profile (-55
to 125 oC) after 765 cycles, indicating that silicone elastomer TIMs are susceptible to
thermal performance degradation if subjected to temperature cycling conditions with
temperatures near the glass transition temperature. The repeated changes in the
material (from a glassy to rubbery state) over time caused the material to lose
integrity. Elevated temperature/humidity tests (85ºC/85% RH) performed up to 2173
hours did not lead to a substantial increase (greater than 10%) in thermal resistance
for the samples in this study.
101
Laser Flash Method Study
The laser flash method has been well studied and has been applied to TIM
thermal characterization. Measurements for some thermal interface materials,
however, presents additional challenges beyond the thermal diffusivity measurement
if the goal is to capture changes in thermal performance over time while
simultaneously maintaining clamping to simulate a typical application loading
condition.
Potential errors in conducting laser flash measurements of TIM specimens
assembled in 3-layer sandwich structures and clamped using sample holder plates
were examined. It was found that sample holder plates can distribute loading over
clamped 3-layer sandwich structures, resulting in relatively uniform bondline
thicknesses (usually within 1% variation in the initial thickness for typical TIM
compression levels) that approximate as-assembled TIMs in many typical
applications. However, heat from the laser pulse can flow into the plates during the
laser flash measurement, which can increase the calculated TIM thermal conductivity
values obtained from thermal diffusivity data. To avoid this problem, low
conductivity materials should be used for the sample holder plates and test specimens
should be sized to match the opening of the sample holder plates. In addition, since
higher thermal diffusion time ratios between the TIM layer and the coupon layer
appeared to lead to high overall error and problems with nonconvergence in TIM
thermal conductivity calculations, thin, conductive coupon layers (<1 mm) should be
used when laser flash measurements are performed on thin, high conductivity TIMs,
such as gels or solder.

102
Contributions
The primary contributions from this study were as follows:
1) Explained for the first time physical processes leading to thermal
performance degradation in putty and gap pad TIMs.
While this study confirmed that TIMs in pad form, which remain relatively
unexplored in the literature, perform reliably under the temperature cycling and
elevated temperature/humidity conditions (which match commonly used accelerated
stress test conditions used for SMT components) and durations tested, this study led
to the first instance of degradation reported in the literature for TIMs in pad form,
which are generally considered to be among the most reliable TIMs on the market.
For these TIMs that exhibited degraded performance, the change in thermal resistance
was attributed to physical changes in the bulk of the TIM or the contact interface. The
temperature cycling test results suggest that silicone-free pads may be more
susceptible to delamination than silicone ones under the conditions tested.
Furthermore, exceeding the recommended operating temperature at the low extreme
may result in problems due to repeated changes near the Tg, which can have
consequences for uprating of TIMs. Demonstrating good stability of gels under the
environmental conditions considered is also of practical significance because many of
the best thermally performing conventional TIMs on the market, greases and solders,
often exhibit poor reliability under high temperature or temperature cycling
conditions.
103
2) Concluded that sample holder plate heating, an effect previously
unreported in the literature, can lead to error (up to a factor of 3 increase for test
conditions in this study) in experimentally determined laser flash thermal
conductivity values.
This study examined the interaction between the laser flash sample holder and
the TIM test sample, which has not been explored in the literature since most
previous laser flash studies of TIMs examined bonded or cured specimens, which
don’t require clamping. This is important because the sample holder can affect the
temperature profiles obtained in a laser flash measurement used to determine thermal
conductivity. Furthermore, structural differences between the sample holder clamping
plate with typical TIM application conditions may limit the usefulness of laser flash
TIM degradation data, however accurate it may be. Identification of sample holder
plate heating as a problem was a key finding since this issue can lead to considerable
error in the calculated TIM thermal conductivity values but has not yet been
described in the literature. Tradeoffs arise since the ability to withstand the conditions
in the reliability test may factor in heavily to the selection of the material of the
sample holder plates. This study also sheds light on the limitations and potential
sources of error of the laser flash method. For TIM users and manufacturers, this can
be useful for product selection, material development, surface engineering, and
assembly process development.
3) Developed a method based on FEA and experiments to correct laser
flash data for sample holder heating effects.
104
A semi-empirical methodology was proposed to reduce the increase in TIM
thermal conductivity values resulting from these effects. While it was demonstrated
that sample holder plate heating can exaggerate measured changes over the course of
a reliability test based on laser flash data, these effects can be corrected using a
combination of finite element simulation results and at least one accurate thermal
conductivity value of a non-degraded test specimen. This procedure assumes that the
contact resistance between the 3-layer test sample and the clamping plates remains
constant over time.
4) Verified that clamped test specimens, despite the presence of openings
on the top and bottom of the sample holder plates needed for laser flash
measurements, have uniform bondline thicknesses (variation within 10% of the total
thickness), thus approximating realistic TIM mechanical loading conditions.
An investigation into how well the laser flash test structures mechanically
simulate realistic TIM loading conditions confirmed initial expectations that clamped
test specimens have uniform bondline thicknesses, which was an important finding
since typical applications result in uniform bondline thicknesses (Dean and Gettings,
1998). This result also suggested that tradeoffs between reducing sample holder
heating and achieving a uniform bondline thickness, which can affect the sample
holder plate thickness and opening size, may not be difficult to overcome.
It was also found that the potential for a nonconverged solution in the TIM
thermal conductivity calculation can complicate the selection of suitable materials for
the coupon layer and the TIM for highly conductive TIMs with a low bondline
thickness. If metals such as copper are used as the coupons materials (with

105
thicknesses similar to those used for the tests in this study), the laser flash method
would be more suitable for TIMs in pad form rather than dispensed TIMs, which can
also have high error due to the difficulty in measuring the bondline thickness.
Taken together, the findings from this study combined with existing
knowledge in the literature clarify how the laser flash method, given its strengths and
weaknesses with respect to currently available techniques, would be useful in realistic
product development environments. The outcomes also include guidelines on how to
apply the laser flash method to obtaining thermal performance data of clamped test
specimens, which has not been previously described in the literature. This affects the
design of the coupons, clamping plates, and suitable TIMs and thicknesses. While
precautions must be taken to avoid sample holder plate heating and error due to
thermal diffusivity differences in the 3-layer test sample, the laser flash method can
accommodate a wide range of TIM-coupon material combinations, surface
roughnesses, and specimen sizes that match common die sizes in TIM applications. In
addition, as a technique for reliability evaluation, the laser flash method may be an
attractive alternative to steady-state ASTM D5470-based approaches (2006) due to
the non-contact nature of the measurement, which allows the TIM specimens to
remain undisturbed after being removed from an environmental chamber to be
measured in a laser flash instrument. This makes it particularly useful for detecting
contact interface effects, such as delamination, which other techniques may not
capture. Overall, the laser flash method has value as a technique that uses material
test specimens (rather than the actual package), yet can capture important aspects that
govern degradation, such as a realistic CTE and Tg properties of the TIM and

106
contacting surfaces and surface characteristics. In the product development cycle, the
laser flash method could be of value early on in the TIM selection process as a means
of screening out TIMs based on their degradation behavior. A more detailed
evaluation, as needed for product qualification, could then involve use of thermal test
vehicles. Despite the potential for high error in TIM thermal conductivity data
compared to ASTM D5470 (2006) data, the laser flash method may hold promise as a
tool to evaluate end of life TIM thermal performance, particularly for TIMs in pad
form. In general, experimental progress in improving the laser flash method and other
TIM thermal conductivity measurement techniques should facilitate developments in
TIM degradation models, which could be validated using accurate degradation data.
Recommendations for Future Work
Future work should focus on two main areas: improving the laser flash test
sample holder design and validating the laser flash data using alternative thermal
conductivity measurement techniques.
One aspect of the laser flash sample holder design not explored in-depth in
this study was how the plates were held in relation to the 3-layer test specimen. The
screws, when tightened, provided an upper limit to how much the 3-layer can expand
in thickness, but the TIM can relax (decrease in thickness) throughout the
environmental exposure test. In a typical TIM 1 application, the gap distance for the
TIM layer should be essentially fixed (barring any warpage), and in a TIM 2
application, there may be a stop, preventing movement below a certain gap distance.
Examination of typical TIM applications conditions would be needed to fully explore

107
this issue. In a typical application with a fixed gap distance, stress relaxation in the
TIM could lead to lower bondline thicknesses or create additional contact resistance
at the top TIM-substrate interface. One consequence is that laser flash TIM specimens
using the current design may experience lower stresses and strains than in realistic
applications, resulting in lower levels of TIM degradation than in the actual
application. In addition, the impact of using larger square sample areas should be
better understood to ensure that the laser flash test specimens properly capture
warpage effects encountered in typical applications. Not addressing this potential
concern would also lead to lower levels of measured TIM degradation than in the
actual application.
Future additional validation studies should include comparisons of laser flash
data to data obtained using other techniques, including thermal test vehicles. While
the steady-state data presented in this study were used to validate the ability of a laser
flash method-based approach to capturing bulk changes over time, the ability to
capture the effects of degradation caused by physical processes originating at the
contact interface should also be verified and may better reflect realistic TIM
applications. The thermal test vehicle would be a simplified approximation of a
realistic application of a TIM and consist of a nonfunctional chip package, TIM, and
heat sink. Among currently available thermal conductivity measurement techniques,
thermal test vehicles are believed to approximate actual TIM applications well
thermomechanically. Comparison studies could clarify which types of degradation are
detectable using the laser flash method and which ones would present difficulties.
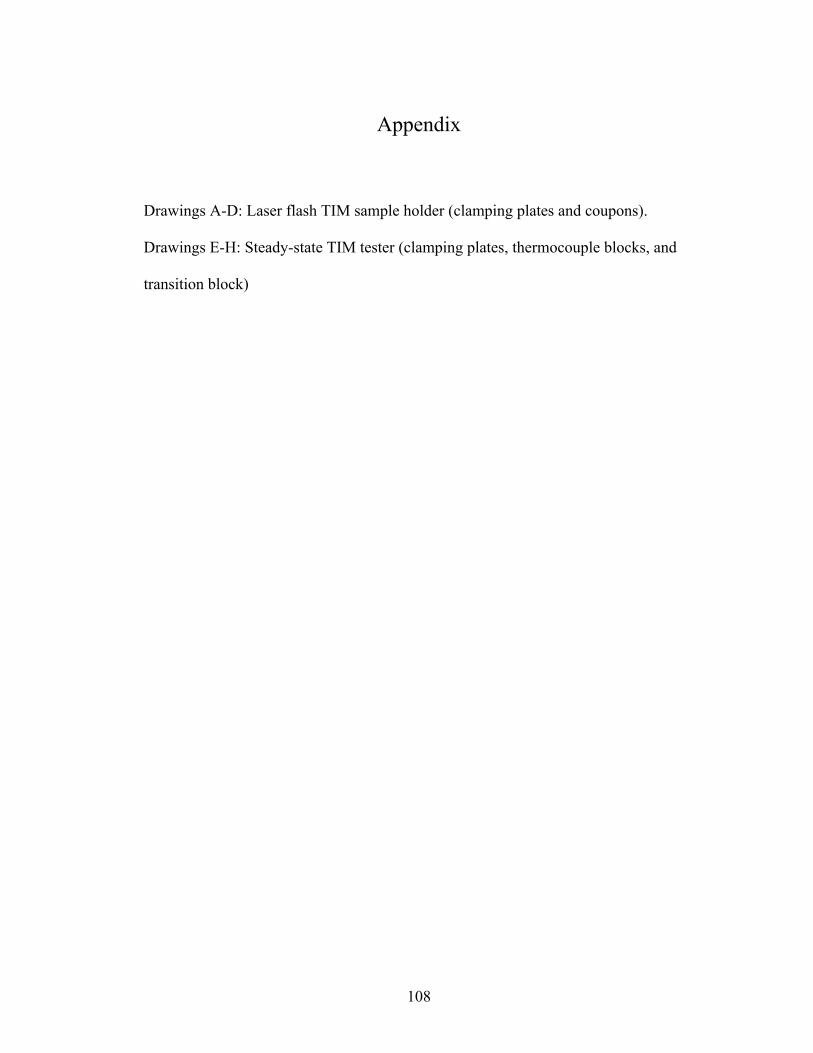
108
Appendix
Drawings A-D: Laser flash TIM sample holder (clamping plates and coupons).
Drawings E-H: Steady-state TIM tester (clamping plates, thermocouple blocks, and
transition block)
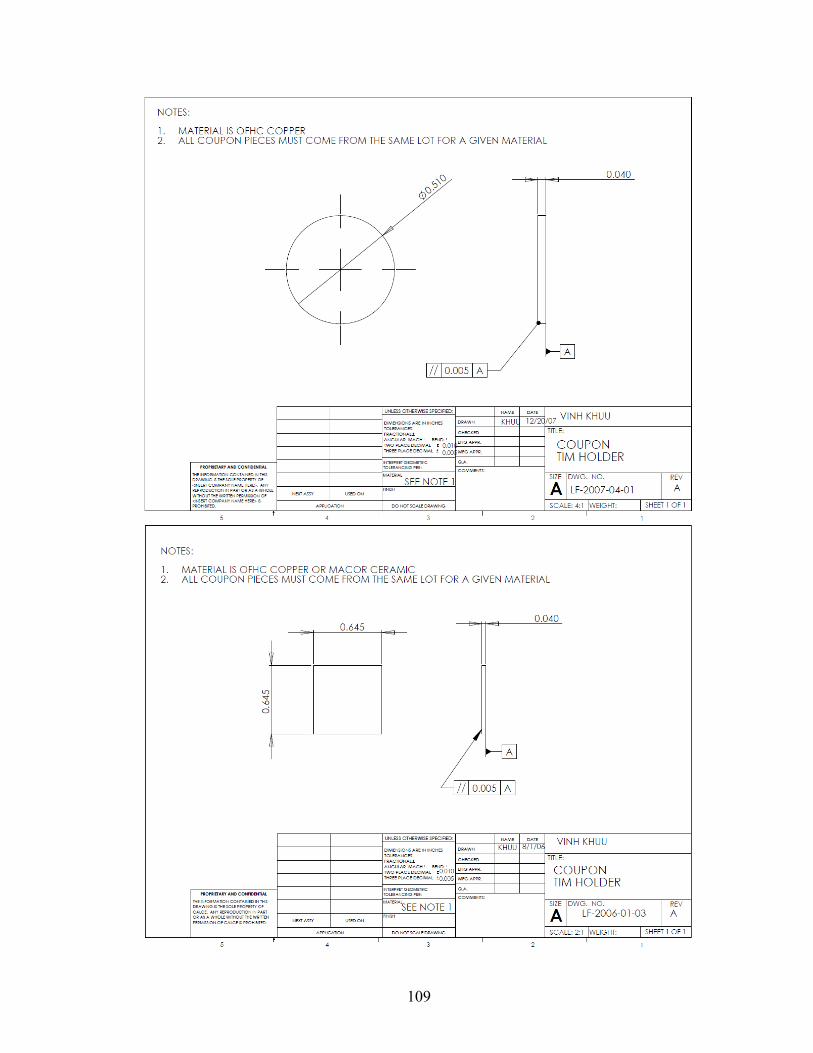
109
110

111

112

113
Bibliography
Abadi, P. S. S., Leong, C, Chung, D. D. L., “Factors That Govern the Performance of Thermal Interface Materials,” Journal of Electronic Materials, Vol. 38, Issue 1, pp. 175-192, 2009. Analysis Tech, Inc., Wakefield, Massachusetts, http://www.analysistech.com/, retrieved August 30, 2009. Aoyagi, Y., “Antioxidant-Based Phase-Change Thermal Interface Materials with High Thermal Stability.” Journal of Electronic Material, 2008, Vol. 37, No. 4, pp. 448-461, 2008. Application Note 056: Note on Gap Pad Silicone Extraction. The Bergquist Company, Baba, T., Ono, A., “Improvement of the Laser Flash Method to Reduce Uncertainty in Thermal Diffusivity Measurements,” Meas. Sci. Technol., Vol. 12., pp. 2046-2057, 2001. Bharatham, L., Fong, W.S., Leong, C.J., Chiu, C-P., “A Study of Application Pressure on Thermal Interface Material Performance and Reliability on FCBGA Package,” International Conference on Electronic Materials and Packaging, (EMAP 2006), pp. 1-7, 11-14 Dec. 2006. Bharatham, L., Fong, W. S., Torresola, J., Koang, C.-C., “Qualification of Phase Change Thermal Interface Material for Wave Solder Heat Sink on FCBGA Package,” Proceedings of 7th Electronic Packaging Technology Conference (EPTC 2005), Vol. 2, pp. 6, 7-9 Dec. 2005. Bosch, E.G.T., and C.J.M. Lasance, “Accurate Measurement of Interface Thermal Resistance by Means of a Transient Method,” Proc. SEMITHERM XVI, San Jose, CA, pp. 167-173, 2000. Brunschwiler, T., Kloter, U., Linderman, R.J., Rothuizen, H., Michel, B., "Hierarchically Nested Channels for Fast Squeezing Interfaces With Reduced Thermal Resistance," IEEE Transactions on Components and Packaging Technologies, Vol.30, No.2, pp. 226-234, June 2007. Campbell, R. C., Smith, S.E., and Dietz, R.L. “Laser Flash Diffusivity Measurements of Filled Adhesive Effective Thermal Conductivity and Contact Resistance Using Multilayer Methods,” Thermal Conductivity 25, pp. 191-202, 2000. Campbell, R.C., Smith, S.E., and Dietz, R.L., "Measurements of Adhesive Bondline Effective Thermal Conductivity and Thermal Resistance Using the Laser Flash Method", Proceedings of SEMITHERM XV, pp. 83-97, 1999.

114
Chen, C.I., Ni, C.Y., Pan, H.Y., Chang, C.M., Liu, D.S., “Practical Evaluation for Long-term Stability of Thermal Interface Material,” Experimental Techniques, Vol. 33, no. 1, pp. 28-32, 2009. Chiu, C.-P, Chandran, B., Mello, M., Kelley, K., “An Accelerated Reliability Test Method to Predict Thermal Grease Pump-Out in Flip-Chip Applications,” Proceedings of 51th Electronic Components & Technology Conference, Orlando, FL, pp. 91-97, May/June 2001. Chiu, C.-P., Maveety, J.G., and Tran, Q.A., “Characterization of Solder Interfaces Using Laser Flash Metrology,” Microelectronics Reliability, Vol. 42, Iss. 1, pp. 93-100, January 2002. Chu, H., Selvakumar, A., “Performance Characterization of Pressure Sensitive Adhesive Thermal Interface Materials,” Semiconductor Thermal Measurement and Management Symposium, 2009. SEMI-THERM 2009. 25th Annual IEEE , pp. 299-303, 15-19 March 2009. Clark, L. M. and Taylor, R. E., “Radiation Loss in the Flash Method for Thermal Diffusivity.” Journal of Applied Physics, Vol. 46, Issue 2, 1975, pp. 714-719. Clarson, S.J., and Semlyen, J.A., “Depolymerization, Degradation and Thermal Properties,” in Siloxane Polymers, PTR Prentice Hall, Englewood Cliffs, New Jersey, 1993. Cowan, R. D., “Pulse Method of Measuring Thermal Diffusivity at High Temperatures,” Journal of Applied Physics, Vol. 34, Iss. 4, Part 1, pp. 926 – 927, 1963. Culham, J., Teerstra, O., Savija, I., Yovanovich, M., “Design, Assembly and Commissioning of a Test Apparatus for Characterizing Thermal Interface Materials,” Proceedings ITHERM 2002, San Diego, California, USA, pp. 128-134, May 30-June 1, 2002. Cunnington, G., R., “Thermal Conductance of Filled Aluminum and Magnesium Joints in a Vacuum Environment,” ASME Winter Annual Meeting, New York, 1964. Dal, S. “Degradation Mechanisms of Siloxane-Based Thermal Interface Materials Under Reliability Stress Conditions,” 2004 IEEE International Reliability Physics Symposium Proceedings, Phoenix AZ, pp. 537-542, 25-29 April 2004. Dani, A., Matayabas, J., and Koning, P., “Thermal Interface Material Technology Advancements and Challenges: An Overview,” ASME Conf. Proc. 2005, 511, 2005.

115
Dasgupta, A., “Thermomechanical Analysis and Design,” Handbook of Electronic Package Design, Ed. Michael Pecht, M., Marcel Dekker, Inc., 1991. Dean, N.F. and Gettings, A.L., “Experimental Testing of Thermal Interface Materials on Non-Planar Surfaces”, Proceedings of SEMITHERM XIII, San Diego, CA, 1998, pp. 88-94. Deppisch, C., Fitzgerald, T., Raman, A., Hua, F., Zhang, C., Liu, P., Miller, M., “The Material Optimization and Reliability Characterization of an Indium-solder Thermal Interface Material for CPU Packaging,” JOM, Vol. 58, No. 6, pp. 67-74, June 2006. Dias, R., “Investigation of Interfaces with Analytical Tools,” Device and Materials Reliability, IEEE Transactions on, Vol. 3, No. 4, pp. 179-183, Dec. 2003. Emerson, J., Rightley, M., Galloway, J., Huber, D., Rae, D., Cotts, E. “Minimizing the Bondline Thermal Resistance in Thermal Interface Materials Without Affecting Reliability,” International Workshop on Thermal Investigation on ICs and Systems, Belgirate Lake Maggiore, Italy, pp. 106-111,27-30 Sep 2005. Eveloy, V., Rodgers, P. and Pecht, M., “Reliability of Pressure-Sensitive Adhesive Tapes for Heat Sink Attachment in Air-Cooled Electronic Assemblies,” IEEE Transactions on Device and Materials Reliability, Vol. 4, No. 4, pp. 650-657, 2004. Ferry, J.D., Viscoelastic Properties of Polymers, 3rd. ed., Wiley, New York, 1980. Fleischer, A. S., Chang, L-H., Johnson, B.C., “The Effect of Die Attach Voiding on the Thermal Resistance of Chip Level Packages,” Microelectronics and Reliability, Vol. 46, Iss. 5-6, pp. 794-804, May-June 2006. Galloway, J., Kanuparthi, S., “BLT Control and Its Impact on FCBGA Thermal Performance," Thermal and Thermomechanical Phenomena in Electronic Systems, 2008. ITHERM 2008. 11th Intersociety Conference on , pp.388-394, 28-31 May 2008. Gektin, V., “Thermal Management of Voids and Delamination in TIMs,” Proceedings of IPACK2005, San Francisco, CA, July, 2005. Gektin, V., Bar-Cohen, A., Witzman, S., “Coffin-Manson Based Fatigue Analysis of Underfilled DCAs,” Components, Packaging, and Manufacturing Technology, Part A, IEEE Transactions on, Vol. 21, No. 4, pp. 577-584, Dec 1998. Goel, N., Bhattacharya, A., Cervantes, J.A., Mongia, R.K., Machiroutu, S.V., Lin, H., Huang, Y., Fan, K., Denq, B., Liu, C., Lin, C., Tien, C., Pan, J., “Technical Review of Characterization Methods for Thermal Interface Materials (TIM),” Electronics Packaging Technology Conference, 2008. EPTC 2008. 10th, pp. 1461-1471, 9-12 Dec. 2008.

116
Gomatam, R., and Sancaktar, E., “Fatigue and Failure Behavior of Silver-Filled Electronically-Conductive Adhesive Joints Subjected to Elevated Temperatures,” Journal of Adhesion Science and Technology, Vol. 18, No. 15-16, pp. 1833-1848, 2004. Gowda, A., Esler, D., Paisner, S., Tonapi, S., Nagarkar, K., “Reliability Testing of Silicone-Based Thermal Grease,” Proceedings of SEMITHERM XXI, San Jose, California, pp. 64-71, March 2005. Gowda, A., Esler, D., Tonapi, S., Nagarkar, K., Srihari, K., “Voids in Thermal Interface Material Layers and Their Effect on Thermal Performance,” Electronics Packaging Technology Conference, 2004. EPTC 2004. Proceedings of 6th , pp. 41-46, 8-10 Dec. 2004 Gowda, A., Esler, D., Tonapi, S., Zhong, A., Srihari, K., Schattenmann, F., “Micron and Submicron-Scale Characterization of Interfaces in Thermal Interface Material Systems,” Journal of Electronic Packaging, Vol. 128, Iss. 2, pp. 130-136, June 2006. Gowda, A., Zhong, A., Esler, D., David, J., Tonapi S., Srihari, K., Schattenmann, F., “Design of a High Reliability and Low Thermal Resistance Interface Material for Microelectronics,” Electronics Packaging Technology, 2003 5th Conference (EPTC 2003) , pp. 557-562, 10-12 Dec. 2003. Gowda, A., Zhong, A., Esler, D., David, J., Tonapi, S.S., Schattenmann, F., and Srihari, K., “In-Situ Performance of Silicone Thermal Interface Materials: Influence of Filler Characteristics,” Proceedings of Polytronic 2003, Switzerland, pp. 177-182, October 2003. Graebner, J., “Measuring Thermal Conductivity and Diffusivity,” Thermal Measurements in Electronics Cooling, Ed. Azar, K., Boca Raton, FL: CRC Press LLC, 1997. Gupta, A., Liu, Y., Zamora, N., Paddock, T., “Thermal Imaging for Detecting Thermal Interface Issues in Assembly and Reliability Stressing,” Thermal and Thermomechanical Phenomena in Electronics Systems, 2006. ITHERM '06. The Tenth Intersociety Conference on, pp. 942-945, May 30 2006-June 2 2006. Gwinn, J., Saini, M., Webb, R., “Apparatus for Accurate Measurement of Interface Resistance of High Performance Thermal Interface Materials,” Proceedings ITHERM 2002, pp. 644-650. Gwinn, J.P., Webb, R.L, “Performance and Testing of Thermal Interface Materials,” Microelectronics Journal, Vol. 34, No. 3, pp. 215-222, March 2003.
117
Han, B, “Optical Measurement of Flip-chip Package Warpage and its Effect on Thermal Interfaces,” Electronics Cooling, http://electronics-cooling.com/articles/2003/2003_february_a1.php, February 2003. Hanson, K., “ASTM D 5470 TIM Material Testing,” Semiconductor Thermal Measurement and Management Symposium, 2006 IEEE Twenty-Second Annual IEEE, pp. 50-53, 14-16 March 2006. Haque, S., Lu, G-Q., Goings, J., Sigmund, J., “Characterization of Interfacial Thermal Resistance by Acoustic Micrography Imaging,” Microelectronics Reliability, Vol. 40, No. 3, pp. 465-476, March 17, 2000. Hasselman, D. P. H., “Interfacial Thermal Resistance and Temperature Dependence of Three Adhesives for Electronic Packaging”, IEEE Trans.Components and Packaging Tech., Vol. 23, No. 4, pp. 633-637, 2000. He, Yi, “Rapid Thermal Conductivity Measurement with a Hot Disk Sensor: Part 1. Theoretical Considerations,” Thermochimica Acta, Vol. 436, Iss. 1-2, pp. 122-1291, October 2005. He, Yi, “Rapid Thermal Conductivity Measurement with a Hot Disk Sensor: Part 2. Characterization of Thermal Greases,” Thermochimica Acta, Vol. 436, Iss. 1-2, pp. 130-134, 1 October 2005. He, Yi, “DSC and DMTA Studies of a Thermal Interface Material for Packaging High Speed Microprocessors, Thermochimica Acta, Vol. 392-393, pp. 13-21, 15 September 2002. Hua, F., Deppisch, C., Fitzgerald, T., “Indium as Thermal Interface Material for High Power Devices,” Advancing Microelectronics, Vol. 33, No. 5, pp. 30-32, September/October 2006. Hu, J., M. Pecht and A. Dasgupta, “Design of Reliable Die Attach,” International J. Microcircuits and Electronic Packaging, Vol. 16, pp. 1-21, 1993. Hu, X., Jiang, L, Goodson, K.E., “Thermal Characterization of Eutectic Alloy Thermal Interface Materials with Void-like Inclusions,” Semiconductor Thermal Measurement and Management Symposium, 2004. Twentieth Annual IEEE, pp. 98-103, 9-11 Mar 2004. Islam, N., Lee, S. W., Jimarez, M., Lee, J.Y., Galloway, J., “TIM Degradation in Flip Chip Packages,” Thermal and Thermomechanical Phenomena in Electronic Systems, 2008. ITHERM 2008. 11th Intersociety Conference on, pp. 259-265, 28-31 May 2008.

118
Jarrett, R.N., Merritt, C.K., Ross, J.P., Hisert, J., “Comparison of Test Methods for High Performance Thermal Interface Materials,” Semiconductor Thermal Measurement and Management Symposium, 2007. SEMI-THERM 2007. Twenty Third Annual IEEE, pp. 83-86, 18-22 March 2007. Jung, H. H., Sai, A., Pecavar, S., and Jones, J., “Influence of Package-Sink Interface Materials on Die Performance and Reliability,” ASME Conf. Proc. InterPACK2003, 2003. Kearney, A., Li, L., Sanford, S., “Interaction Between TIM1 and TIM2 for Mechanical Robustness of Integrated Heat Spreader,” Semiconductor Thermal Measurement and Management Symposium, 2009. SEMI-THERM 2009. 25th Annual IEEE, pp. 293-298, 15-19 March 2009. Kearns, D., “Improving Accuracy and Flexibility of ASTM D 5470 for High Performance Thermal Interface Materials,” Semiconductor Thermal Measurement and Management Symposium, 2003. Ninteenth Annual IEEE , pp. 129-133, 11-13 March 2003. Kline, S. J., McClintock, F.A., “Describing Uncertainties in Single-Sample Experiments,” Mech. Eng., pp. 3, January 1953. Kohli, P., Sobczak, M, Bowin, J., Matthews, M., “Advanced Thermal Interface Materials for Enhanced Flip Chip BGA,” Proceedings - Electronic Components and Technology Conference, pp. 564-570, 2001. Koski, J. A., “Improved Data-Reduction Methods for Laser Pulse-Diffusivity Determination with the Use of Minicomputers,” Intern. Joint Conf. on Thermophys. Properties, Gaithersburg, Md., pp 94-103, 15 June 1981. Lall, P., Pecht, M.G., Hakim. E.B., Influence of Temperature on Microelectronics and System Reliability, Boca Raton: CRC Press, 1997. Lasance, C., “The Urgent Need for Widely Accepted Test Methods for Thermal Interface Materials,” Proceedings of SEMITHERM XIX, San Jose, pp. 123-128, March 2003. Lasance, C., Lacaze, C., “A Transient Method for the Accurate Measurement of Interface Thermal Resistance,” Proc. SEMITHERM XII, Austin, TX, pp.43-45, 1996. Lasance, C., Murray, T., Saums, D., Rencz, M., “Challenges in Thermal Interface Material Testing,” Proceedings of the 22nd IEEE Semi-therm Symposium, Dallas, TX, USA, pp. 42–49, 2006. Lee, H.J., Purdue University Ph.D. Thesis, “Thermal Diffusivity in Layered and Dispersed Composites,” University Microfilms International, 1975.
119
Lee, T.R., Purdue University Ph.D. Thesis, “Thermal Diffusivity of Dispersed and Layered Composites,” University Microfilms International, 1977. Lee, T.Y.R., and Taylor, R.E., “Thermal Diffusivity of Dispersed Materials,” J. Heat Transfer, Vol. 100, pp. 720-724, Nov. 1978. Lee, Y. J., “Thermally Conductive Adhesive Tapes: A Critical Evaluation and Comparison,” Advanced Packaging, May 2007. Li, L., Nagar, M., Jie, X., “Effect of Thermal Interface Materials on Manufacturing and Reliability of Flip Chip PBGA and SiP Packages,” Electronic Components and Technology Conference, 2008. ECTC 2008. 58th, pp. 973-978, 27-30 May 2008. Li, Yuan, “Accurate Predictions of Flip Chip BGA Warpage,” Electronic Components and Technology Conference, 2003. Proceedings. 53rd, pp. 549-553, May 27-30, 2003. Lim, T., Velderrain, M., “Calculated Shear Stress Produced by Silicone and Epoxy Thermal Interface Materials (TIMs) During Thermal Cycling,” Electronics Packaging Technology Conference, 2007. EPTC 2007. 9th , pp. 914-916, 10-12 Dec. 2007. Linderman, R., Brunschwiler, T., Smith, B., Michel, B., “High-Performance Thermal Interface Technology Overview,” Thermal Investigation of ICs and Systems, 2007. THERMINIC 2007. 13th International Workshop on , pp.129-134, 17-19 Sept. 2007. Liu, J., Michel, B., Rencz, M., Tantolin, C., Sarno, C., Miessner, R., Schuett, K.-V., Tang, X., Demoustier, S., Ziaei, A., “Recent Progress of Thermal Interface Material Research - an Overview,” Thermal Investigation of ICs and Systems, 2008. THERMINIC 2008. 14th International Workshop on, pp.156-162, 24-26 Sept. 2008. Luo, X., Chugh, R., Biller, B. C., Hoi, Y. M., Chung, D.D.L., “Electronic Applications of Flexible Graphite,” Journal of Electronic Materials, Vol. 31, No. 5, pp. 535-544, 1 May 2002. Luo, X., Xu, Y., and Chung, D. D. L. “Thermal Stability of Thermal Interface Pastes, Evaluated by Thermal Contact Conductance Measurement,” J. Electron. Packag, Vol. 123, pp. 309-311, 2001. Madhusudana, C.V., Thermal Contact Conductance, Springer, New York, 1995. Maguire, L, Behnia, M. and Morrison, G., “Systematic Evaluation of Thermal Interface Materials—A Case Study in High Power Amplifier Design,” Microelectronics Reliability, Vol. 45, pp. 711-725, 2005.
120
Marotta, E.E.; LaFontant, S.; McClafferty, D.; Mazzuca, S., “The Effect of Interface Pressure on Thermal Joint Conductance for Flexible Graphite Materials: Analytical and Experimental Study,” Thermal and Thermomechanical Phenomena in Electronic Systems, 2002. ITHERM 2002. The Eighth Intersociety Conference on, pp. 663-670, 2002. Matayabas, J.C., and LeBonheur, V., “Silicone Gel Thermal Interface Materials for High Heat Dissipation and Thermo-Mechanical Stress Management for Good Reliability Performance,” Proceedings of I-Pack 2005, San Francisco, CA, pp. 1863-1873, July 17-22. Mathis, N., “New Instrument for Thermal Management,” Design, Proc. Int. Symp. On Packaging Systems, San Diego, CA, 1999. Moffat, R., “Describing the Uncertainties in Experimental Results,” Experimental Thermal and Fluid Science. Vol. 1, pp. 3-17, Jan. 1988. Mukadam, M.; Schake, J.; Borgesen, P.; Srihari, K., “Effects of Assembly Process Variables on Voiding at a Thermal Interface,” Thermal and Thermomechanical Phenomena in Electronic Systems, 2004. ITHERM '04. The Ninth Intersociety Conference on, Vol. 1, pp. 58-62, 1-4 June 2004. Nakayama, W., and Bergles, A., “Thermal Interfacing Techniques for Electronic Equipment-A Perspective,” Journal of Electronic Packaging, Vol. 125, pp. 192-199, 2003. Nnebe, I. M. and Feger, C., “Drainage-Induced Dry-Out of Thermal Greases,” Advanced Packaging, IEEE Transactions on, Vol. 31, Iss. 3, pp. 512-518, Aug. 2008. Parker, W., Jenkins, R., Butler, C., and Abbott, G., “Flash Method of Determining Thermal Diffusivity, Heat Capacity, and Thermal Conductivity,” Journal of Applied Physics, Vol. 32, No. 9, pp. 1679-1684, Sept. 1961. Prabhakumar, A., Zhong, A., Tonapi, S., Sherman, D., Cole, H., Schattenmann, F., Srihari, K., “Comparison of the Adhesion Strength of Epoxy and Silicone Based Thermal Interface Materials," Electronic Components and Technology Conference, 2003. Proceedings. 53rd, pp. 1809-1814, May 27-30, 2003. Prasher, R., “Surface Chemistry and Characteristics Based Model for Thermal Contact Resistance of Fluidic Interstitial Thermal Interface Materials,” Journal of Heat Transfer, Vol. 123, 2001. Prasher, R. “Thermal Interface Materials: Historical Perspective, Status, and Future Directions,” Proceedings of the IEEE, Vol. 94, Iss. 8, pp. 1571-1586, Aug. 2006.

121
Prasher, R., Matayabas, J., “Thermal Contact Resistance of Cured Gel Polymeric Thermal Interface Material,” IEEE Transactions on Components and Packaging Technology, Vol. 27, No. 4, pp. 702-709, 2004. Prasher, R., Shipley, J., Prstic, S., Koning, P., and Wang, J-L, "Thermal Resistance of Particle Laden Polymeric Thermal Interface Materials," Journal of Heat Transfer, Vol. 125, December 2003. Refai-Ahmed, G., He, Z., Hejan, E., Vincent, R., Rude, T., Van Heerden, D., “Comparison of Thermal Performance of Current High-End Thermal Interface Materials”, INTERPACK 2007, Vacouver BC, Canada, July 8-12. Rodgers, P., Eveloy, V., Pecht, M., “Limits of Air-Cooling: Status and Challenges,” IEEE Twenty First Annual - Semiconductor Thermal Measurement and Management Symposium, pp. 116-124, March 15-17, 2005. Rodgers, P., Eveloy, V., Rahim, E., Morgan, D., “Thermal Performance and Reliability of Thermal Interface Materials: A Review,” Proceedings of EuroSIME 2006, Milan, Italy, April 23-26, 2006. Samson, E. C., Machiroutu, S. V., Chang, J. Y., Santos, I., Hermerding., J., Dani, A., Prasher, R., Song, D.W., “Interface Material Selection and a Thermal Management Technique in Second-Generation Platforms Built on Intel Centrino Mobile Technology,” Intel Technology Journal, Vol. 9, Iss. 1, Feb. 17, 2005. Sarvar, F., Whalley, D.C., Conway, P.P., “Thermal Interface Materials - A Review of the State of the Art,” Electronics Systemintegration Technology Conference, 2006. 1st, Vol. 2, pp. 1292-1302, Sept. 2006. Savija, I., Culham, J.R. Yovanovich, M.M., “Effective Thermophysical Properties of Thermal Interface Materials: Part I, Definitions and Models,” InterPACK2003-35088, International Electronic Packaging Technical Conference and Exhibit, Maui, Hawaii, July 6-11, 2003. Shaw, D., Goldsmith, L. A., Little, A., “Suitability of the Flash Method for Measuring the Thermal Diffusivity of Cracked Specimens,” Journal of Physics D: Applied Physics, Vol. 2, Iss. 4, pp. 597-604, 1969. Sheikh, M.A, Taylor, S.C., Hayhurst, D.R., and Taylor, R., “Measurement of Thermal Diffusivity of Isotropic Materials Using a Laser Flash Method and its Validation by Finite Element Analysis,” J. Phys. D: Appl. Phys., Vol. 33, pp. 1536-1550, 2000. Sikka, K.K., Toy, H.T., Edwards, D.L., Iruvanti, S., Ingalls, E.M. and DeHaven, P.W., “Gap-reduced Thermal Paste Package Design for Cooling Single Flip-Chip Electronic Modules,” Proc. IEEE Inter Soc. Conf. Thermal Phenom., 2002, pp. 651–657.
122
Sim, L.C., Ramanan, S.R., Ismail, H., Seetharamu, K.N., Goh, T.J., “Thermal Characterization of Al2O3 and ZnO Reinforced Silicone Rubber as Thermal Pads for Heat Dissipation Purposes,” Thermochimica Acta, Vol. 430, Iss. 1-2, pp. 155-165, June 2005. Singhal, V., Siegmund, T., Garimella, S.V., “Optimization of Thermal Interface Materials for Electronics Cooling Applications,” Components and Packaging Technologies, IEEE Transactions on, Vol. 27, No. 2, pp. 244-252, June 2004. Smith, B., Brunschwiler, T., Michel, B., “Comparison of Transient and Static Test Methods for Chip-to-sink Thermal Interface Characterization,” Microelectronics Journal, in press, 2008. Smith, R.A., Culharn, R.J., “In-situ Thickness Method of Measuring Thermo-Physical Properties of Polymer-like Thermal Interface Materials,” Semiconductor Thermal Measurement and Management Symposium, 2005 IEEE Twenty First Annual IEEE, pp. 53-63, 15-17 March 2005. Solbrekken, G.L., Chiu, C.P., Byers, B., Reichebbacher, D., “The Development of a Tool to Predict Package Level Thermal Interface Material Performance,” Thermal and Thermomechanical Phenomena in Electronic Systems, 2000. ITHERM 2000. The Seventh Intersociety Conference on, Vol. 1, pp. 54, 2000. Somasundaram, S., Tay, A., Kandasamy, R., “Evaluation of Thermal Resistance of TIMs in Functional Packages Using a Thermal Transient Method,” Electronics Packaging Technology Conference, 2008. EPTC 2008. 10th, 9-12 Dec. 2008, pp. 1479-1485. Stern, M.B., Gektin, V., Pecavar, S., Kearns, D., Chen, T., “Evaluation of High Performance Thermal Greases for CPU Package Cooling Applications,” Semiconductor Thermal Measurement and Management Symposium, 2005 IEEE Twenty First Annual IEEE, pp. 39-43, 15-17 March 2005. Stern, M.B., Jhoty, G., Kearns, D., Ong, B., “Measurements of Mechanical Coupling of Non-Curing High Performance Thermal Interface Materials,” Semiconductor Thermal Measurement and Management Symposium, 2006 IEEE Twenty-Second Annual IEEE, pp. 37-41, 14-16 March 2006. Stern, M.B, Kearns, D., Gektin, V., Jhoty, G., “A Methodology for Thermal Evaluation of Strongly Bonded Packaging Materials,” Thermal and Thermomechanical Phenomena in Electronics Systems, 2006. ITHERM '06. The Tenth Intersociety Conference on, pp. 505-511, May 30 2006-June 2 2006. Sundararajan, R., McCluskey, P., Azarm, S., "Semi-Analytic Model for Thermal Fatigue Failure of Die Attach in Power Electronic Building Blocks," High
123
Temperature Electronics Conference, 1998. HITEC. 1998 Fourth International, pp. 94-102, 14-18 Jun 1998. Szekely, V., Ress, S., Poppe, A., Torok, S., Magyari, D., Benedek, Z., Torki, K., Courtois, B., and Rencz, M., “New Approaches in the Transient Thermal Measurements,” Microelectron. J., Vol. 31, Iss. 9–10, 2000, pp. 727–734. Taylor, R. E., “Critical Evaluation of Flash Method for Measuring Thermal Diffusivity,” Revue Int. Hautes Temp. Refract., Vol. 12, pp. 141–5, 1975. Test Method D5470-06, “Standard Test Method for Thermal Transmission Properties of Thin, Thermally Conductive Solid Electrical Insulation Materials,” American Society for Testing and Materials, Annual Book of ASTM Standards, Vol. 10.02, 2006. Test Method E1461-01, “Standard Test Method for Thermal Diffusivity of Solids by the Flash Method,” American Society for Testing and Materials, Annual Book of ASTM Standards, Vol. 14.02, 2001. Test Method E1530-06, “Standard Test Method for Evaluating the Resistance to Thermal Transmission of Materials by the Guarded Heat Flow Meter Technique,” American Society for Testing and Materials, Annual Book of ASTM Standards, Vol. 14.02, 2006. Too, S. S., Hayward, J., Master, R., Tan, T. S, Keok, K. H. ”Effects of Organic Package Warpage on Microprocessor Thermal Performance,” Electronic Components and Technology Conference, 2007. ECTC '07. Proceedings. 57th, pp. 748-754, May 29 2007-June 1 2007. Tummala, R.R., Rymaszewski, E. J., Microelectronics Packaging Handbook. New York, N.Y.: Van Nostrand Reinhold, 1989. Tzeng, J.J.-W., Weber, T.W., Krassowski, D.W., “Technical Review on Thermal Conductivity Measurement Techniques for Thin Thermal Interfaces,” Semiconductor Thermal Measurement and Management Symposium, 2000. Sixteenth Annual IEEE, pp.174-181, 2000. Viswanath, R., Wakharkar, V., Watwe, A., Lebonheur, V., “Thermal Performance Challenges from Silicon to Systems,” Intel Technology Journal. Vol. Issue 2, May 16, 2002. Yovanovich, M.M., “Four Decades of Research on Thermal Contact, Gap, and Joint Resistance in Microelectronics,” Components and Packaging Technologies, IEEE Transactions on, Vol. 28, Iss. 2, pp. 182-206, June 2005.
124
Wang, J., “Shear Modulus Measurement for Thermal Interface Materials in Flip Chip Packages,” Components and Packaging Technologies, IEEE Transactions on, Vol. 29, No. 3, pp. 610-617, Sept. 2006. Wei, X., Marston, K., Sikka, K., “Thermal Modeling for Warpage Effects in Organic Packages,” Thermal and Thermomechanical Phenomena in Electronic Systems, 2008. ITHERM 2008. 11th Intersociety Conference on, pp. 310-314, 28-31 May 2008. Wunderle, B., Kleff, J., Mrossko, R., Abo Ras, M., May, D., Schacht, R., Oppermann, H., Keller, J., Michel, B., “In-situ Measurement of Various Thin Bond-line-thickness Thermal Interface Materials with Correlation to Structural Features,” Thermal Investigation of ICs and Systems, 2008. THERMINIC 2008. 14th International Workshop on, pp. 112-117, 24-26 Sept. 2008. Yang, Y., Zhang Z., Touzelbaev, M., “Impact of Temperature-Dependent Die Warpage on TIM1 Thermal Resistance in Field Conditions,” Semiconductor Thermal Measurement and Management Symposium, 2009. SEMI-THERM 2009. 25th Annual IEEE, pp. 285-292, 15-19 March 2009. Zhang, H., “Thermal-Mechanical Decoupling by a Thermal Interface Material,” http://www.arlon-std.com, Retrieved 8/20/09. Zheng, J., Jadhav, V., Wakil, J., Coffin, J., Iruvanti, S., Langlois, R., Yarmchuk, E., Gaynes, M., Liu, H., Sikka, K., Brofman, P., “Delamination Mechanisms of Thermal Interface Materials in Organic Packages During Reflow and Moisture Soaking,” Electronic Components and Technology Conference, 2009. ECTC 2009. 59th, pp. 469-474, 26-29 May 2009. Zhou, P. and Goodson, K. E., “Modeling and Measurement of Pressure-Dependent Junction-Spreader Thermal Resistance for Integrated Circuits,” Proc. ASME Int. Mechanical Engineering Congr. And Exposition, pp. 51–67, 2001. Zou, W., Coffin, J., Arvelo, A., “Reliability Analysis on Epoxy Based Thermal Interface Subjected to Moisture Environment,” Thermal and Thermomechanical Phenomena in Electronics Systems, 2006. ITHERM '06. The Tenth Intersociety Conference on, pp. 1082-1087, May 30 2006-June 2 2006.