Embed Size (px)
Citation preview

DO I NEED FERTILIZER? -ASK THE PLANT!
Roland D. Meyer. Daniel B. Marcum and Jerry L. SchmiererI
ABSTRACT
Growers, PCA's and others involved in producing alfalfa often ask the question, "Do I needfertilizer and if so how much?" Can soil tests or plant tissue tests be used to indicate whatfertilizers should be applied? It is the objective of this presentation to give some guidelines asto how plant tissue samples can be taken and used effectively to indicate the kinds and amountsof fertilizers to apply to alfalfa to maintain or improve yields and quality.
Key Words: alfalfa, fertilizers, soil tests, plant sampling, plant tissue tests, monitoringnutrient status, fertility management.
INTRODUCTION
As the title suggests, this presentation will focus on the alfalfa plant to determine what,if any fertilizer nutrients should be applied to increase the growth and yield of one of the mostimportant forage crops in the Western United States. Perhaps the first thing that comes to mindwhen the comment "ask the plant" is made concerns what the plant or a field of alfalfa lookslike. Is it a good green color? Is it slightly yellow or is it very dark green, even bluish darkgreen suggesting stunted growth? Certainly the visual appearance is the first impression thatwe use to assess the status of growing plants. Unfortunately, visual symptoms are not specificenough to identify the particular nutrient or nutrients that may be deficient or the symptomscaused by other factors-insect injury , diseases, restricted root growth. The other problem withusing visual observation of plant symptoms to diagnose nutrient deficiencies is that significantyield losses may have already occurred by the time the symptoms appear. Always confirmvisual diagnosis with chemical analysis in the laboratory or test strips with selected fertilizers.Many times it is discovered after the seeding is made that yes we should have taken a soil test,perhaps it would have helped avoid the problem we are now confronting. Yes, asking the plantcan be a very effective tool to diagnose what fertilizer nutrient, seed treatment or soilamendment is necessary to provide the best growing situation for the alfalfa crop.
DISCUSSION
If an alfalfa field shows visual color differences or the grower wishes to set up amonitoring program to assure optimum crop growth, plant sampling and laboratory analysis fornutrient evaluation offers considerable benefit. Taking samples representing the areas of goodand poor growth is usually the most desirable when these differences can be observed.For setting up long-term crop monitoring/sampling locations, it is most beneficial to select
'Roland D. Meyer is Extension Soils Specialist, LA WR Dept., University of Catifomia, One Shields Ave., Davis,CA 95616, Daniel B. Marcum is Farm Advisor, Shasta-Lassen Counties. P. 0. Box 9, McArthur, CA 96056, andJerry L. Schmierer is Farm Advisor, Colusa County, P. 0. Box 180, Colusa, CA 95932. Published In:Proceedings 28th Califomia/Nevada Alfalfa Symposium, December 3-4, 1998, Reno Hilton, Reno, NV.
59
(-areas in fields based on crop productivity levels. Nearly every field will have a 2 to 3 fold yielddifference between the lowest yielding 10% and the highest yielding 10% of the field. It issuggested that benchmark areas of 50 feet by 50 feet in size be located in the lowest,intermediate and highest yielding parts of the field from which soil and plant tissue sampleswill be taken. T o ensure that you will be able to find each benchmark area again, describe it inrelation to measured distances to specific landmarks on the edge of the field. By using thismethod to collect soil and plant tissue samples, you will be able to compare areas of the fieldwith different production levels, develop appropriate management responses, and track changesover the years.
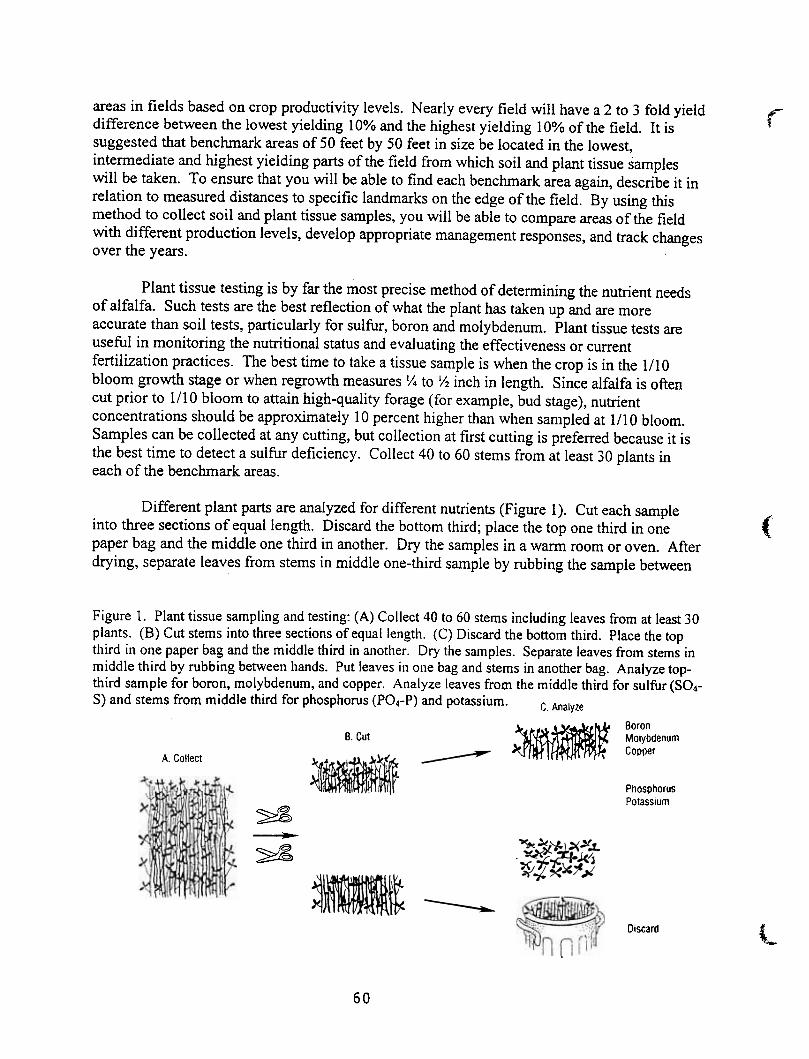
Plant tissue testing is by far the most precise method of determining the nutrient needsof alfalfa. Such tests are the best reflection of what the plant has taken up and are moreaccurate than soil tests, particularly for sulfur, boron and molybdenum. Plant tissue tests areuseful in monitoring the nutritional status and evaluating the effectiveness or currentfertilization practices. The best time to take a tissue sample is when the crop is in the 1/10bloom growth stage or when regrowth measures ~ to Y2 inch in length. Since alfalfa is oftencut prior to 1/10 bloom to attain high-quality forage (for example, bud stage), nutrientconcentrations should be approximately 10 percent higher than when sampled at I/lO bloom.Samples can be collected at any cutting, but collection at first cutting is preferred because it isthe best time to detect a sulfur deficiency. Collect 40 to 60 stems from at least 30 plants ineach of the benchmark areas.
(Different plant parts are analyzed for different nutrients (Figure 1). Cut each sample
into three sections of equal length. Discard the bottom third; place the top one third in onepaper bag and the middle one third in another. Dry the samples in a warm room or oven. Afterdrying, separate leaves from stems in middle one-third sample by rubbing the sample between
Figure 1. Plant tissue sampling and testing: (A) Collect 40 to 60 stems including leaves from at least 30plants. (8) Cut stems into three sections of equal length. (C) Discard the bottom third. Place the topthird in one paper bag and the middle third in another. Dry the samples. Separate leaves from stems inmiddle third by rubbing between hands. Put leaves in one bag and stems in another bag. Analyze top-third sample for boron, molybdenum, and copper. Analyze leaves from the middle third for sulfur (SO4-S) and stems from middle third for phosphorus (PO4-P) and potassium. C Analyze
~ .BoronB. Cut Molybdenum
\ CopperA. Collect
Phosphorus
Potassium
~..
~
\'-Discard
60

your hands. Put leaves and stems into separate bags. Figure 1 lists the analyses that should beperformed on the three sample sections. Table 1 gives guidelines for interpreting plant tissue-test results. Entire plant samples or baled hay samples are not recommended because they canonly detect extreme nutrient deficiencies.
Table 1. Interpretation of test results for alfalfa plant tissue samples taken at 1/10 bloom.lMidstems Midstem leaves Top 1/3 ofQlant
Response Phosphorus Potassium Sulfur Boron MolybdenumCategory2 (PO4-P) (Total K) (~04-S) ~ (~
-cppm) (%) (ppm) (ppm) (ppm)
<500 <0.65 <400Deficient <15
Critical 500 -800 0.65 -0.80 400 -800 15- 20 0.3-0.9
800- 1500 0.80- ,50 800 -1200Adequate 20 -40
High >1500 >1.50 >1200 >2003 5- 104
2. An economic yield response to fertilizer application is very likely for values below the deficient level,somewhat likely for values in the critical level, and unlikely for values over the adequate level.
3. A concentration over 200 may cause reduced growth and vigor .4. A concentration over 10 maycausemolybdenosis in ruminant animals.
Tissue tests can determine only the single most limiting nutrient affecting plantgrowth-the concentration of other nutrients may actually increase due to reduced growth.Therefore, correct the most severe deficiency with a fertilizer application first. After it iscorrected, take new plant tissue samples to determine if other nutrients are deficient. Also, lowconcentrations of a nutrient in plants may not always indicate a deficiency in the soil.Remember that plant analysis reflects nutrient uptake by the plant: a problem affecting roots,such as nematodes, can affect nutrient uptake as well.
Field Trial Results to Illustrate Plant Tissue Analysis-Alfalfa Yield Relationships
The first trial to be discussed was conducted in the Intermountain Region where bothphosphorus and potassium were limiting the yield potential. The experiment was establishedwith several rates of applied phosphorus and potassium alone and in combination. Fertilizertreatments were applied on the soil surface in June after the first harvest and only slight yieldincreases were measured by the third cutting in early September. Figure 2A illustrates thedramatic yield increase to applied phosphorus the first cutting of the following year, but little orno yield increase to applied potassium (Figure 2B). Figure 2A also shows that as phosphorusfertilizer rates were increased, yields increased as did midstem phosphorus levels but potassiumlevels in the plant tissue were decreased slightly. Likewise, phosphorus tissue levels and yieldsstayed the same or increased slightly as midstem potassium levels increased when rates of
16

Figure 2. Alfalfa yield. midstem PO4-P and midstem K response to applied
phosphorus (A) and applied potassium (8).(Shasta County. Daniel 8. Marcum and Roland D. Meyer)
Yield, Tons/A-.-Midstem pa 4-P
---Midstem K
(A)/2.5 2.51000
~(/)c0
1-
-0(])
~rn'+-rn
~«
2.02.0~ o
~
E
1.52(/)
-0
~
~1.5
1.0 1.0
900E0.0.
800a.Iv
O
700a.
EQ)-
600 U)
-0
:?:
500-
0.5 400 0.50 50 100 150 200 250 300 350
Applied Phosphorus, Ibs P 205 /A
400
2.5 2.51000
~00
c:
o
.-
""0
<1>
~
ro'4-
ro'4-
<
2.02.0~ o
~
E
1.52fn
""0'.-
:?:
1.5
1.0 1.0
500
0.5 400 0.5100 200 300
Applied Potassium, Ibs K2O/A
0 400
162
0.
800~~
00..
700E(1)
U)
600~
~

Figure 3. Alfalfa yield, midstem PO 4-P and midstem K response to applied
phosphorus with low rates of potassium (A) and high rates of potassium (8)(Shasta County, Daniel 8. Marcum and Roland a. Meyer).
2.5 2.51000
900&Q.
0..800 I~
O0..
700EQ)
cn
600~
~
~U)c0
1--
-0
(1)
>-
~
ro"+-
«
2.02.0~ o
~
E
1.52(/)
""0'.-
:?:
1.5
1.0 1.0
500
0.5 400 0.50 25050 100 150 200
Applied Phosphorus, Ibs P 205 IA
2.5 2.51000
gooE 0,.0,.
800q.~
O0-
700E(])00
600~:?:
~U>co
1-
-0
Q)
~
ro'+-
ro'+-
~
2.02.0~ o
~
E
1.5200
-0.-
~
1.5
1.0 1.0
500
0.5 400 0.5a 25050 100 150 200
Applied Phosphorus, Ibs P 205 /A
163

applied potassium fertilizer were increased (Figure 2B). Figure 3A shows that whenphosphorus was combined with low rates of potassium (0, 50, 100 and 200 Ibs K20/ A), yieldsand midstem phosphorus levels increased but potassium tissue concentrations remained nearlythe same. It required higher rates of applied potassium (50, 100,200 and 400 Ibs K2O/A) alongwith the phosphorus to increase yield, midstem phosphorus and midstem potassium (Figure3B).
Many growers have asked the question, "when I need phosphorus, what rate and how oftenshould I apply it?" To develop an answer to this question an experiment was initiated on a siteknown to be phosphorus deficient based on plant tissue samples. Table 2 gives the rates andtimes when phosphorus was applied on the soil surface in the winter of each year. Alfalfa yieldresponses to the different treatments are given in Table 3. Note the large yield response duringthe first year (three cuttings in 1989) after the application of phosphorus in the winter of 1988.The 50 Ibs P20s/A treatment resulted in a 2.47 tons/A increase in alfalfa yield with the 400 IbsP20S/ A treatment giving a 5.71 tons/ A increase. It can be observed that by the third year( 1991) the single 200 Ibs P20S/ A application (treatment #4) did not record as high a yield aseither the three annual 50 Ibs P20S/ A applications (treatment #2) or the two applications of lOOIbs P20s/A (treatment #3). Nearly the same result occurred for treatments 5,6 and 7. Duringthe fourth year, both of the treatments receiving annual phosphorus applications (#2 & 5)recorded higher yields than either the single application (treatments #4 & 7) or the two-everyother year treatments (#3 & 6).
Table 2. Rates and times of phosphorus application on the soil surface to an established standof alfalfa. (Lassen County, Jerry L. Schmierer and Roland D. Meyer)
Rate & No.
of
Ap~~s-
Treatment
Number
Phosphorus applied(lbs P20s1 A)
~ 1W ~ 1221 IQml
12,34
567
0 0 o50oo
0 o50oo
~
I ~~~
! 200
5OX4lOO x 2200 x 1
50100200
50
loo
0
100 x 4
200 x 2
400 x I
100200400
lob
O
O
-100
200
0
100
0
0
400400400
(
164

Table 3. Alfalfa yield response to phosphorus (11-52-0) applied on the soil surface in thewinter prior to each year of harvest indicated. (Lassen County , Jerry L. Schmierer and RolandD. Meyer).
Figure 4 illustrates the alfalfa yields for three cuttings per year--1989 through 1992 along withthe midstem PO4-P levels in the first cutting of each year in response to the phosphorustreatments 400, 200, or 0 Ibs P2Os1 A applied the winter of 1988. Note the decline in both thealfalfa yields and the midstem PO4-P levels over the 4-year period. Also note that the midstemPO4-P levels for the 0 and 200 Ibs P2Os1 A treatments are well below the desired 800 ppm levelin the first cutting of 1990 and that even the 400 lbs P2Os1 A treatment had a midstem PO4-Plevel only slightly greater than 800 ppm. Even with slightly higher midstem PO4-P levels thefirst cutting of 1991 the yields and midstem PO4-P levels decline in 1992. Figure 5 shows thealfalfa yields for three cuttings per year--1989 through 1992, and midstem PO4-P levels in thefirst cutting each year in response to phosphorus applied as 400 1bs P2Os/ A the first year onlyand lOO Ibs P2Os1 A annually for four years. Note first of all that the data given for the 400 lbsP2Os1 A the first year only treatment is the same as in Figure 4. Observe that in the first cuttingof 1991, the midstem PO4-P level for the 3 annual applications of lOO Ibs P20s1 A treatment issubstantially higher than for the 400 1bs P2Os1 A the first year only treatment and that yields aresimilar for the two treatments in the second and third cuttings of 1991. During 1992, whenboth treatments had received a total of 400 lbs P2OsIA, the yields and midstem PO4-P level aremuch higher for the lOO lbs P2Os1 A annually for four years treatment than for the singleapplication of 400 lbs P2OsIA in the winter of 1988. Noting the low midstem PO4-P level inthe first cutting of 1990, a grower would probably have chosen to apply additional phosphorusduring the 1990 growing season even though 400 Ibs P2OS/ A was applied a year earlier so thatoptimum yields would have been maintained.
165

Figure 4. Alfalfa yields for three cuttings per year 1989-1992, and midstem PO4-P levels in thefirst cutting each year in response to phosphorus (400, 200, or 0 Ibs P2QsI A) applied the winterof 1988. (Lassen County, Jerry L. Schmierer and Roland D. Meyer).
,.~
3.5 1400
3.01200
E0.
1 000 ~0..
I-q-
800 O0..
E
6002 cn-0
:?:400
2.5
2.0
~(/)co
1-
"'0(],)
~
~ro'+-
«
.,..,/ \ .~1.5
-~
""1.0
~
A~
.--"'~~0.5
t0.0 20089-1 2 3 90-1 2 3 91-1 2 3 92-1
Alfalfa Cuttings from 1989 to 1992
2 3
SUMMAR y
Tips when using plant tissue sampling and analysis to guide fertilizer applications:.Establish pemlanent benchmark areas (50 ft. by 50 ft. in size) for sampling
in the lowest, intemlediate and highest yielding portions of the field-.Conduct plant tissue sampling early (first cutting) so that fertilizer
applications can be made mid to late season and sample mid season to guidewinter-early spring fertilizer applications.
.Expect alfalfa growth response to phosphorus and potassium applied on thesoil surface 60 to 90 days after fertilizer application.
Apply fertilizer to correct nutrient deficiencies detected with plant tissue analysis aftercareful consideration of the amount of nutrients removed by alfalfa, the yield potential of thefield, current soil-test levels, and historical responses to fertilization. Consult the publication"Intemlountain Alfalfa Management" University of California, Division of Agriculture andNatural Resources Publication #3366 Chapter 5 for a more comprehensive discussion of alfalfafertilization.
6.'-
166

Figure 5. Alfalfa yields for three cuttings per year 1989-1992, and midstem PO4-P levels in thefirst cutting each year in response to phosphorus applied as 400 Ibs P20S/ A the first year onlyor 100 Ibs P20S/ A annually for four years. (Lassen County , Jerry L. Schmierer and Roland D.Meyer). -
3.5 1400
3.0
2.5
\ ,',\
.~.
~(/)c:O
~
""0(1)
~
~ro
~«
2.0 \,
'w° 0\ .
v'\
~
,.L;..-
1.5~
1.0
0.5 40089-1 2 3 90-1 2 3 91-1 2 3 92-1
Alfalfa Cuttings from 1989 to 1992
2 3
167
0..
0-1000 "O:t
O0-
800 ~00
"'0
600 :;?: