Embed Size (px)
Citation preview


Abstract
Cooperative Employee Compensation
Beverly L. RotanAgricultural Cooperative ServiceU.S. Department of Agriculture
This study looks at how education, cooperative function, and geographyinfluence patterns in compensating cooperative employees. Generally, coopera-tive respondents in the West reported employees had the highest mediansalaries.
Job responsibility, decisionmaking, and performance were the three mostimportant factors for setting salaries according to respondents in a survey con-ducted for this study. Bonuses were given across job categories. Bonuses weretied to a variety of factors but most reported were financial performance, sales,and performance. Health, life, and disability insurance were the most commonlypaid benefits across all geographic areas, all sizes (sales) of cooperatives, andall cooperative function.
Keywords: Salaries, compensations, benefits, cooperative.
ACS Research Report No. 114
March 1993
Preface
This study was conducted after receiving many requests from cooperativesfor information on cooperative employee compensation. It is anticipated that thisinformation will be used as a general guide for newly organized cooperativesand as a source of comparison for established cooperatives.
The report takes a comprehensive look at salaries and fringe benefits thatcooperatives offer to their mid- to upper-level employees. Data for this reportwere obtained in 1991 from a random sample of 400 cooperatives with sales ofat least $1.8 million. Cooperatives included in the sample were marketing andfarm supply cooperatives, as classified by Agricultural Cooperative Service’sStatistics and Technical Services Staff.
Thirty percent of the active cooperatives in the sample responded to thesurvey. As in any questionnaire, some questions were not answered or wereonly partly answered. Therefore, this information may not adequately addressall of the unique requirements, skills, or risks associated with a given position orcooperative.

Contents
Highlights ....................................................................................................... iiiGeneral Survey Background .......................................................................... 1General Survey Results ................................................................................. 2Overall Results ............................................................................................... 2
Education ............................................................................................... 2Compensation ........................................................................................ 2Benefits .................................................................................................. 8
Cooperative Type ........................................................................................... 9Salary, by Cooperative Type .................................................................. 9Bonuses and Basis, by Cooperative Type.. ......................................... 12Financing Benefits, by Cooperative Type ............................................ 12Other Benefits Offered, by Cooperative Type ...................................... 15
Regional Differences.. .................................................................................. 15Education ............................................................................................. 15Regional Salary.. .................................................................................. 15Regional Salary Ranking ..................................................................... 17Region and Bonuses............................................................................ 17How Benefits Are Paid ......................................................................... 17Other Benefits, by Region .................................................................... 20
Differences in Employee Factors, by Sales Range.. .................................... 20Educational Differences, by Sales Range ........................................... 24Salary and Sales Range ...................................................................... 24Ranking Factors for Salary, by Sales Range ....................................... 24Bonuses and Their Basis, by Sales Range ......................................... 28Relationship Between Sales and How ted .......................................... 28Other Benefits and Sales ..................................................................... 30
Changes.. ..................................................................................................... 32Summary ...................................................................................................... 32Appendix ...................................................................................................... 34
Definitions ............................................................................................ 34References ........................................................................................... 34Sample questionnaire .......................................................................... 35
ii

Highlights
Employees are the lifeblood of any organization. One of the objectives of acooperative is to attract and keep competent and productive employees.Although salaries, perquisites (perks), and benefits are not the only inducementto employment, they play a big part.
Retirement; health, life, and disability insurance; bonuses (performancebased); and educational assistance were some of the benefits that cooperativesoffered their employees. These benefits were paid for by the cooperative, by theemployee, or shared by both. Perquisites or “perks” are benefits paid by coop-eratives that increase employees’ compensation packages. Perks includedvacations, holidays, and sick days; use of company car; or payment for mileage(private car) when doing cooperative business.
Some of the significant findings from this survey:l The largest percentage of employees in specified job categories, with
the exception of sales representative, were college educated.l Generally, cooperatives paid for all specified benefits or shared in the
cost of retirement benefits for their general managers, office managers, andfield representatives.
l Salaries of other firms in the area was the least important factor in set-ting salaries for cooperative employees.
l Forty-eight percent of division managers and sales representativesreceived bonuses.
l Although fruit and vegetable cooperatives had sales that were the sec-ond highest compared to other cooperatives, the mean and median salaries oftheir employees were higher than other cooperatives.
l More general and division managers in the Corn Belt, East/SouthCentral, and West had college degrees than those in other geographic areas.
l Generally, as sales volume increased, the median salaries increased forall job categories.
l The basis for bonuses for general managers, office managers, and divi-sion managers throughout the United States was financial performance andsales levels; while sales and sales growth were the primary factors for field andsales representatives.
111

Cooperative Employee Compensation
Beverly L. RotanEconomist, Cooperative Services Division
A major challenge for all cooperatives isattracting and keeping productive people.Cooperatives must offer employees compensationcommensurate with their experience and skills ifthey are to meet this challenge. Compensation canbe both direct (e.g., salaries, wages) and indirect(benefits). It is important to provide a proper mixof direct and indirect compensations to attract andkeep competent employees. Competent employeescan enhance margins and membership savings forcooperatives.
Although there are no universal norms toguide the choice of what to pay any particularemployee, some internal and external factorsshould be considered. Cost management (sales,operating expenses); job responsibilities; employ-ee’s educational background, experience and/orskills; and the number of employees needed aresome of the internal factors that may influencesalaries and benefits for employees. External fac-tors include Federal and State Government policiesand regulations, the labor market, and geographi-cal location.
GENERALSURVEYBACKGROUND
Data for this report were obtained in 1991from a random sample of 400 cooperatives withsales of at least $1.8 million. Cooperatives includedin the sample were marketing and farm supplycooperatives, as classified by AgriculturalCooperative Service’s Statistics and TechnicalServices Staff. There were 116 surveys returned or30 percent of the active cooperatives in the sample.
Thirty-one percent of them were grain, 26 percentfarm supply, 19 percent fruit and vegetable, and 17percent dairy cooperatives. The remaining 7 per-cent were “other” marketing cooperatives.
Questions regarding educational background,salaries, benefits offered, principal products mar-keted or sold, sales, and any changes that occurredin the past 5 years were included in the survey.The results were grouped into four categories: 1)general; 2) by function of cooperative; 3) by region;and 4) by sales. There were five job categories inthis study. Because each cooperative may have dif-ferent titles for jobs with the same duties, the cate-gories follow with brief general descriptions.
1. The chief executive officer (CEO), president, orgeneral manager: execute policies established by theboard to achieve the cooperative’s objective.
2. The office manager, accountant, or con troller:keep timely and accurate records of cooperative’sfinancial standing and, in some cases, carry outpolicies set forth by the CEO or cooperative board.
3. The division manager: carry out and supportpolicies and objectives, as they apply to their par-ticular division.
4. The field representative: use expertise on howbest to cultivate land through soil testing and othertools and recommend appropriate products andinnovative technological trends to improve farmoperations.
5. The sales representative: keep abreast of newproducts on the market and meet with farmers totake orders and inform them of new products.Some sales representatives also make deliveries.

For purposes of this report, general managerrefers to CEO/president/general manager. Officemanager will indicate office manager/accoun-tant/controller.
GENERALSURVEYRESULTS
This report looks at overall responses. Theyare broken down by overall results, cooperativefunction, region, and sales groupings. The break-down by cooperative function is limited to salariesand benefits for the five job categories.
OVERALL RESULTS
Education
The survey sought the educational level ofemployees in each job category. Levels of educationincluded high school, some college, college gradu-ate with bachelor, associate, master’s, or doctoraldegree.
Through all job categories, the trend foremployees to be college educated was similarexcept for sales representatives. Twice as manygeneral managers had bachelor or associatedegrees compared with those who completed theirformal education in high school (table 1). Sixty per-cent of respondents (those with high school and
some college) indicated sales representatives hadnot completed college. Respondents also reportedthat the percentage of general and office managerswho completed college were more than twice thepercentage of those that completed high school. Itis interesting to note that 10 sales representatives(17 percent) had doctoral degrees, while only 7 (8percent) of the general managers had the advanceddegrees.
Compensation
Compensation for employees came in indirectand direct forms. Indirect compensation includedbenefits that ranged from paid vacations to educa-tional assistance. Direct compensation includedmost exclusively salary, wages, pay, and bonuses. Itshould be noted that the questionnaire did not askrespondents to differentiate between base salaryand additional bonuses. Some salaries probablyincluded bonuses.
Salary
Salaries are usually affected by longevity. Forthis reason, some respondents reported a salaryrange rather than the current salary for each oftheir positions. When the salary range was given,the average of the high and low was used to pro-duce a single observation for aggregating the data.
Table i-Educational background of employees
Level of Generaleducation manager
Off icemanager
Divisionmanager
Fieldrepre-
sentative
Salesrepre-
sentative
Percent
High school 23 25 28 30 40
Some college 20 24 28 23 20
College graduate
Bachelor or Associate Degree 45 39 39 44 36
Master’s Degree 10 12 5 3 2
Doctoral Degree 2 0 0 0 2
2

In a few instances, it appears that respondentsreported salaries for part-time or seasonal employ-ment. This distorted the data for reporting the low-est salaries in each job category; therefore, the low-est salaries are not included in table 2. Reportingpart-time employment makes the averages lowerthan they would be otherwise. In this case, themedian or midpoint is a more reliable indicator ofwhat most cooperatives are paying employeesbecause unlike the average, it is not affected byobservations that might be clustered at one extremeor the other. Table 2 includes the following descrip-tive statistics for salaries: high, median, mean oraverage, and the number of observations aboveand below the average or mean. The data areskewed as indicated by this latter measure and bythe difference between the mean and the median.In table 2, the means are larger than the mediansand more observations fell below the meansbecause of a few relatively high salaries.
As expected, the general manager had thehighest median salary. It is interesting to note thatthe division manager’s median salary was higherthan the office manager’s salary. It is assumed thatrespondents may have substituted division manag-er for assistant manager. The office manager, fieldrepresentative, and sales representative’s mediansalaries were the same or close.
Salary Ranking
Respondents were asked to rank specific fac-tors that contribute to setting salaries. Rankingswere from 1 to 6, with 1 being the most important.Evidently, more explanation in the survey’sinstructions may have been needed because manyrespondents used the 1 to 6 as a measure of impor-tance for each factor separately, rather than indi-cate each factor’s order of importance. As a result,two or more factors were often given the samerank.
Also, some factors were assigned no rank, pre-sumably because respondents considered these ashaving no impact on salary determination. To pro-vide comparable percentages, a mark of 7 wasgiven to each blank or unranked factor and addedto the priority ordering.
Job responsibilities, decisionmaking capabili-ties, performance, experience, education, and theimpact of other firms in the area were the rankingfactors. Table 3 reports the order of importance butnot the composite scores. Since some respondentsreported a 1 to 6 rating, rather than a priorityordering from 1 to 6, an analysis of variance tech-nique was used to obtain composite scores for eachfactor’s importance. The survey had listed thesefactors in the expected order of importance for
Table P-Summary of annual salary by employee category
Job category
General manager
Office manager
Division manager
Field representative
Sales representative
Salary range1
High Median Mean
__________________________________Dollars________________________________
300,000 45,000 62,904
114,024 28,000 36,715
127,500 33,500 41,371
74,200 25,000 28,401
108,120 25,000 30,915
Responsesabove/below
mean
Number
30175
35170
31152
26142
12/39
lRespondents gave salary information for full- and part-time employees. Also, not every respondent answered for all job or salary ranges.
3

Figure l- Number of Respondents Reporting Salary-Setting Factors
General Manager 106 Respondents
Responsibility
Decisions
Performance
Experience
Education
Other firms
Office Manager 102 Respondents
Responsibility
Decisions
Performance
Experience
Education
Other firms
Division Manager 73 Respondents
Responsibility
Decisions
Performance
Experience
Education
Other firms
I
0I
70
.I
2 0 3 0N u m b e r
I4 0 5 0 6 0
4

Figure 1 Continued- Number of Respondents Reporting Salary-Setting Factors
Field Representatives 63 Respondents
Responsibility
Decisions
Performance
Experience
Education
Other firms
Sales Representatives 52 Respondents
Responsibility
Decisions
Performance
Experience
Education
Other firms
0 70
R a n k
20 30 40 50 60N u m b e r
5

Table 3-Order of importance of factors for selected job categories
Factor General Officemanager manager
Divisionmanager
Fieldrepresen-
tative
Salesrepresen-
tative
Ranking
Job responsibility 1 1 1 1 2
Decisionmaking capabilities 2 3 3 3 3
Performance (co-oplemployee) 3 2 2 2 1
Experience 4 4 4 4 4
Education 5 5 5 5 6
Other firms in area 6 6 6 6 5
most jobs, and the results generally reflected thispattern. Some bias seem to have occurred, but criti-cal factor differences did show up. For example, jobresponsibility was ranked 1 by a majority ofrespondents for all job categories except sales rep-resentative. For the latter job, the third listed factor,performance, is the most important.
This may reflect that it is more feasible tomonitor a sales representative by using sales per-formance, than using sales to measure a manager’sperformance. It is also interesting to find that deci-sionmaking capabilities were ranked third mostimportant for all job categories except general man-ager. Decisionmaking capability was a key factorfor general management, and respondents rankedit just slightly less than job responsibility.
Figure 1 shows the basis for these compositescores where, for instance, more respondents rateda manager’s decisionmaking with a relatively high2 and 3 than reported for job responsibility. Whatother firms in the area are paying is regarded as theleast important factor in all job categories exceptsales representative.
The survey also asked if performance was afactor in setting salaries, how was performanceevaluated/measured, and by whom. Most respon-dents indicated that the cooperative’s financial and
6
employee’s job performance were the basis forevaluating most employees. Table 4 shows somevariations of these basic measurements, includingpreferred personality traits. The frequency of coop-eratives that reported use of these measures arealso listed in table 4.
Several methods of evaluating performanceand their frequency are reported in table 4. Mostrespondents indicated that predetermined goalsand objectives were used to evaluate performance.Formal reviews, management by objectives, yearlyevaluation, department measures by reports, con-tinued monitoring, mutual discussions, history,and informal evaluations were other methods ofevaluating performance.
Bonuses
Bonuses are used to reward the outcome ofperformance of the employee and can be viewed asan added benefit and/or salary. Respondents wereasked if bonuses/commissions were given toemployees. In total, 40 percent of the respondentsreported that their cooperative gave bonuses in alljob categories. Division managers and sales repre-sentatives had the highest percentage of respon-

Table 4-Frequency of performance measurement
Measurement Frequency
Direct elements (115 respondents)
Financial performance ................................................................................................ .30
Job performance.. ....................................................................................................... .15
Sales (previous year). ................................................................................................... .6
Other firms/market pay ranges ..................................................................................... .5
Equity/rebate paid to members/returns to grower ........................................................ .4
Profit per department.. .................................................................................................. .4
Annual performance appraisals using job description.. ................................................ .4
Cooperative performance.. ........................................................................................... .3
Increase in volume ....................................................................................................... .2
Member feedback.. ....................................................................................................... .2
Cost effectiveness ........................................................................................................ .2
Innovation ..................................................................................................................... .2
Decisionmaking ............................................................................................................ .2
Keep within budget.. ..................................................................................................... .2
Financial strength ......................................................................................................... .2
Maintain status in the market through sales and cost containment.. ............................ .2
Other’ .......................................................................................................................... 16
Personality traits (52 respondents)
Attitude toward customers, members, co-workers, growers.. ..................................... .10
Knowledge and being able to communicate knowledge.. ............................................. .4
Neatness ...................................................................................................................... .4
Accuracy.. ..................................................................................................................... .4
Dependability.. .............................................................................................................. .2
Timeliness .................................................................................................................... .2
Ambition ......................................................................................................................... 2
Ability to follow instruction ............................................................................................ .2
Common sense ............................................................................................................ .2
Other2 .......................................................................................................................... 10
Method (31 respondents)
Preagreed goals and objectives ................................................................................. .l 1Formal review.. ............................................................................................................. .4
Management by objectives.. ......................................................................................... .3
Yearly evaluation .......................................................................................................... .3
Department measures by reports.. ............................................................................... .2
Other3 ............................................................................................................................ 4
‘The 16 miscellaneous responses included volume handled, sales increase, productivity, number of units sold, operation smoothness, staffingquality, service, market share, etc.ZTen responses included knowledge of sources, honesty, effectiveness, efficiency, attendance, willing to give little extra, etc.3Four responses included mutual discussion, history, continued monitoring, and informal evaluation.
7

Figure 2- Bonuses Given Across Specified Job Categories
General Manager
Office Manager
Division Manager
Field Representative
Sales Representative
0 5 70 1 5 2 0 2 5 3 0 3 5 4 0 4 5P e r c e n t
5 0
dents who were given bonuses, both with 48 per-cent (figure 2).
The basis for receiving bonuses includedfinancial performance factors (margins, net earn-ings, income, savings), gross volume/sales, per-centage of top quality product, performance, newprocurement, units sold, sales growth, and other.Some respondents indicated that bonuses werepaid but they did not indicate the basis and wereplaced in the “other” category.
Table 5 shows, in some instances, that job cate-gory revealed the reason a bonus was given.General managers, office managers, division man-agers, and field representatives were more likely tobe given bonuses based on financial performancefactors. Sales representatives were more likely to begiven bonuses based on gross volume or sales.New procurements were the third most importantbasis for giving bonuses to field representatives.
Benefits
Benefits such as retirement; health, life, anddisability insurance; and educational assistance canbe paid for by the cooperative, the employee, or
both parties. It is assumed that educational assis-tance may range from paid seminars to collegecourses. Most benefits across all job categories wereeither paid by the cooperative or shared by both.Seventy-one to 73 percent of respondents indicatedthat disability insurance for general managers,office managers, division managers, and field rep-resentatives was paid by the cooperative (table 6).
When asked what formula was used for retire-ment/pension plans, most respondents (24) report-ed “no formula.” The next largest number (22)reported that the cooperative paid all retirementplan costs under a defined program (table 7). Fivecooperatives paid all retirement plan costs under aconditional program. When the cooperative andemployees shared the cost of retirement benefits, avariety of formulas was used. These formulasincluded: “cooperative matches,” “cooperativepays percentage,” “profit sharing (percentage ofnet profit/wages),” and “cooperative pays 0.7 per-cent and employee pays 1 percent of wages. Thesewere the most frequent “formulas” used for retire-ment benefits.
For other cooperatives, pension plans such asthe 40X plan were used. These were either paid

exclusively by employees or by both the coopera-tive and the employee.
Other Benefits
Other benefits were “perks” or extras that anorganization may offer to employees. Respondentswere asked if their cooperative offered paid vaca-tions/holidays and sick days, use of company car,social club membership, health club membership,first-class travel, and mileage (private car).Responses indicated that paid vacations/holidays,sick days, mileage (private car), and use of compa-ny car were more widely made available toemployees across the five job categories (table 8).The percentage ranged from 99 to 0. First-classtravel was high on the list for general managers,with an ESpercent response rate. Few respondentsindicated cooperatives offered membership insocial and/or health clubs.
COOPERATIVE TYPE
Of 116 respondents, 31 percent were graincooperatives, 26 percent were farm supply coopera-tives, 19 percent were fruit and vegetable coopera-tives, and 17 percent were dairy cooperatives. Therest (7 percent) were “other” marketing coopera-tives.
Salary, by Cooperative Type
Table 9 shows high, median, average salaries,and the number of observations above and belowthe average or mean, by cooperative function. Thelow end of the salary ranges is not reportedbecause there were instances of seasonal employ-ment. In table 9, the mean is larger than the medianin each instance, and more observations fell belowthe mean because of a few relatively high salaries.
Table S-Basis for bonuses for all job categories
Factor General Officemanager manager
Divisionmanager
Fieldrepre-
santative
Salesrepre-
sentative
Financial performance’ 66 65 63 33 25
Gross volume/sales 12 13 10 29 46
New procurement2 0 3 3 15 0
Percent (top quality) 2 0 2 4 0
Performance (cooperative/employee) 12 13 14 11 14
Sales growth 0 0 0 4 4
Units sold 0 0 2 0 4
Other3 8 6 6 4 7
Total
Percent
100 100 100 100
‘Margin, net earnings, income, profits, and savings.*Varied responses such as agriculture’s national average prices paid to farmers, or no standard was given.3Members recruited, new contracts, and grower signup.
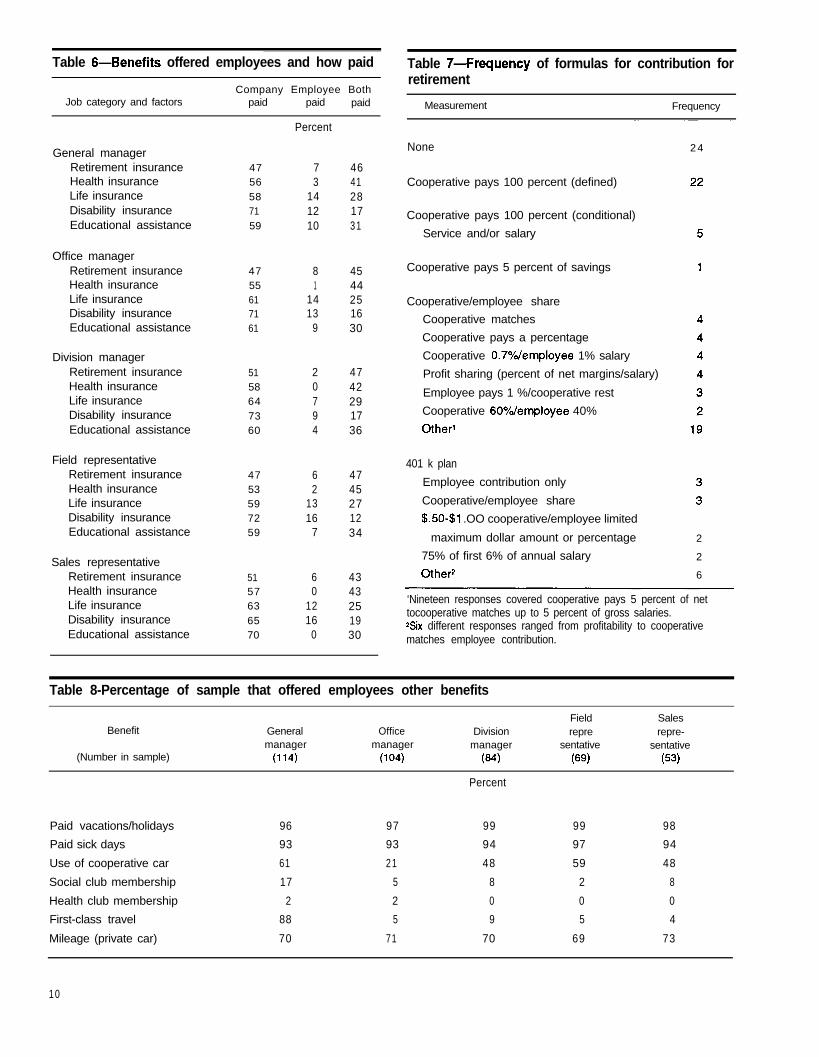
Table g-Benefits offered employees and how paid
Job category and factorsCompany Employee Both
paid paid paid
General managerRetirement insuranceHealth insuranceLife insuranceDisability insuranceEducational assistance
Office managerRetirement insuranceHealth insuranceLife insuranceDisability insuranceEducational assistance
Division managerRetirement insuranceHealth insuranceLife insuranceDisability insuranceEducational assistance
Field representativeRetirement insuranceHealth insuranceLife insuranceDisability insuranceEducational assistance
Sales representativeRetirement insuranceHealth insuranceLife insuranceDisability insuranceEducational assistance
47 7 4656 3 4158 14 2871 12 1759 10 31
47 8 4555 1 4461 14 2571 13 1661 9 30
51 2 4758 0 4264 7 2973 9 1760 4 36
47 6 4753 2 4559 13 2772 16 1259 7 34
51 6 4357 0 4363 12 2565 16 1970 0 30
Percent
Table 7-Frequency of formulas for contribution forretirement
Measurement Frequency
None
Cooperative pays 100 percent (defined)
Cooperative pays 100 percent (conditional)
Service and/or salary
Cooperative pays 5 percent of savings
Cooperative/employee share
Cooperative matches
Cooperative pays a percentage
Cooperative 0.7%/employee 1% salary
Profit sharing (percent of net margins/salary)
Employee pays 1 %/cooperative rest
Cooperative 60%femployee 40%
Other’
401 k plan
Employee contribution only
Cooperative/employee share
$.50-$1 .OO cooperative/employee limited
maximum dollar amount or percentage
75% of first 6% of annual salary
Other2
2 4
2
2
6
‘Nineteen responses covered cooperative pays 5 percent of nettocooperative matches up to 5 percent of gross salaries.ZSix different responses ranged from profitability to cooperativematches employee contribution.
Table 8-Percentage of sample that offered employees other benefits
Benefit
(Number in sample)
General Office Divisionmanager manager manager
(114) (104) 034)
Field Salesrepre repre-
sentative sentative(6% (53)
Percent
Paid vacations/holidays 96 97 99 99 98
Paid sick days 93 93 94 97 94
Use of cooperative car 61 21 48 59 48
Social club membership 17 5 8 2 8
Health club membership 2 2 0 0 0
First-class travel 88 5 9 5 4
Mileage (private car) 70 71 70 69 73
10

Table O-Summary of annual salary for employee category, by cooperative type
Job category andcooperative function*
High
Salary range’
Median Mean
Responsesabove/below
mean
Dairy
General manager
Off ice manager
Division manager
Field representative
Sales representative
Fruit and Vegetable
General manager
Office manager
Division manager
Field representative
Sales representative
Grain
General manager
Off ice manager
Division manager
Field representative
Sales representative
Farm Supply
General manager
Off ice manager
Division manager
Field representative
Sales representative
Other3
General manager
Off ice manager
Division manager
Field representative
Sales representative
_____ __________ _____ ___________ ____ Dollars ______________________________ Number
158,144 47,500 59,422 5/l 3
89,500 28,000 32,670 12l8
110,000 47,500 53,410 415
32,500 25,250 25,253 717
54.754 44.000 40.601 312
225,000 58,400 73,388 6/l 4
114,024 39,200 51,026 8/l 2
127,500 50,000 53,666 5/l 0
46,000 35,000 36,169 516
65.000 42,500 39.346 614
175,000 42,000 48,805 9127
98,750 26,000 28,264 13118
98,750 32,000 32,943 11/15
74,200 24,000 27,704 4115
30.000 23,250 22.995 919
163,000 42,000 50,419 812 1
80,000 22,250 29,473 8120
70,000 26,250 30,435 6/l 8
50,000 24,000 25,684 4/l 5
28,000 22,500 22,833 718
150,000 47,500 123,750 2l2
104,000 79,500 83,333 2/4
91,520 88,450 84,903 4/2
45,000 42,500 41,250 2l2
108,120 60,000 72,707 l/2
‘Respondents gave salary information for full- and part-time employees. Also, not every respondent answered for all job or salary ranges.ZAs classified by Agricultural Cooperative Service’s Statistic and Technical Services Staff.30ther includes marketing cooperatives with low responses.

Table 1 O-Percentage of respondents that givebonuses to employees
Job categorieslPercentgiven
Dairy (20 cooperatives)
General manager
Off ice manager
Division manager
Field representative
Sales representative
Fruit and Vegetable (22 cooperatives)
General mkager
Off ice manager
Division manager
Field representative
Sales representative
Grain (36 cooperatives)
General manager
Off ice manager
Division manager
Field representative
Sales representative
Farm Supply (22 cooperatives)
General manager
Office manager
Division manager
Field representative
Sales representative
Other (8 cooperatives)2
General manager
Office manager
Division manager
Field representative
Sales representative
29
12
44
36
50
37
40
38
33
45
42
36
45
58
54
34
37
54
43
53
43
43
43
20
29
‘Number of respondents varied by job category. According to the survey, a larger percentage ofZMarketing cooperatives with low responses. respondents of dairy cooperatives reported that they
Consequently, the median is a more representativemeasure of cooperative salaries.
The median and mean salaries for generalmanagers, office managers, division managers, andfield representatives in fruit and vegetable coopera-tives were highest, ranging from $36,169 to $73,388for the mean and from $35,000 to $58,400 for themedian salary. It is interesting to note that althoughfruit and vegetable cooperatives had the secondhighest sales, they had the highest median andmean salaries. Statistically, the number of respon-dents reporting may have affected the averages.There were many more respondents in farm supplyand grain cooperatives. Responses to salary infor-mation by the “other” marketing cooperatives weresmall. Therefore, salary data for this group will notbe considered but are represented in the table forformat consistency.
Bonuses and Basis, by Cooperative Type
Although most respondent cooperatives didnot give bonuses, those that did generally gave toall of the five job categories. However, distributionof bonuses to job categories varied by type of coop-erative. For example, more sales representativesreceived bonuses than field representatives in alltypes of cooperatives except grain cooperatives(table 10). Dairy cooperatives were also distinctivein that less than one-third of them gave bonuses togeneral and office managers.
As a rule, bonuses were tied to the job func-tions. For example, sales representatives’ bonuseswere based more on sales. Financial and employeeperformance and sales were the most commonlyindicated factors for basing bonuses for other jobcategories. Generally, bonuses for all job categoriesfor dairy, fruit and vegetable, and grain coopera-tives were evenly distributed and based on finan-cial performance and /or performance and sales(table 11). This trend was evident throughout thereport.
Financing Benefits, by Cooperative Type
12

Table 11-Basis for bonuses for employees
cooperativefunction and
factorGeneral Office Divisionmanager manager manager
Field Salesrepre- repre-
sentative sentative
1
0
1
1
1
0
2
1
2
0
13 7
0 1
0 0
0 0
0 0
0 1
10 9 14
2 2 2
0 0 2
0 0 1
0 0 0
1 1 0
1 1 1
1 1 1
1 1 1
Number of respondents
Dairy
Financial performance1
Gross volume/sales
Percent of top quality
Performance
New procurement2
Other3
Fruit and Vegetable
Financial performance’
Gross volume/sales
Performance
New procurement*
Grain
Financial performance’
Gross volume/sales
Performance
Units sold
Sales growth
Other3
Farm Supply
Financial performance’
Gross volume/sales
Performance
Units sold
Sales growth
Other3
Othep
Financial performance’
Performance
Other3
7
13
4
1
1
3
4 5
4 6
1 1
0 1
1 0
0 0
0 0
1 0
0 1
‘Margin, net earnings, income, profits, and savings.*Members recruited, new contracts, and grower signup.Waned responses such as agriculture’s national average prices paid to farmers, or no standard was given.aMarketing cooperatives with low responses.
13

Table 12-Benefits offered and how paid, by cooperative function
Cooperative functionand job category
Retirement Health Lifeinsurance insurance insurance
C E S C E S C E S
Disability Educationalinsurance assistance
C E S C E S’
Dairy
General manager 50 7 43
Office manager 47 13 40
Division manager 46 9 55
Field representative 39 15 46
Sales representative 50 13 37
Fruit and Vegetable
General manager 75 12 13
Off ice manager 72 14 14
Division manager 82 0 18
Field representative 78 0 22
Sales representative 75 12 13
Grain
General manager 40 3 57
Office manager 40 3 57
Division manager 46 0 54
Field representative 28 5 67
Sales representative 31 0 69
Farm Supply
General manager 32 7 61
Off ice manager 36 8 56
Division manager 35 9 56
Field representative 37 10 53
Sales representative 40 13 47
Other2
General manager 86 0 14
Off ice manager 86 0 14
Division manager 86 0 14
Field representative 80 0 20
Sales representative 100 0 0
‘C = cooperative; E = employee paid; and S = shared by both.2Marketing cooperatives with low responses.
63 5 32 73 20 7 75 8 17 56 11 33
68 0 32 80 20 0 7 7 1 5 8 67 11 22
54 0 46 73 9 18 67 11 22 56 11 33
57 0 43 75 17 8 70 10 20 71 0 29
50 0 50 75 12 13 63 12 25 67 0 33
48 9 43 59 18 23 67 13 20 33 17 50
47 5 48 57 14 29 7 2 7 2 1 27 18 55
57 0 43 64 0 36 82 0 18 25 0 75
60 0 40 53 0 37 88 0 12 33 0 67
70 0 30 83 0 17 83 0 17 33 0 67
71 0 29 53 9 38 75 12 13 76 12 12
63 0 37 48 11 41 68 21 11 79 7 14
72 0 28 67 4 29 7 5 1 9 6 77 8 15
59 6 35 59 8 43 75 12 13 75 25 0
80 0 20 50 14 36 57 14 29 89 0 11
39 0 61 52 15 33 55 15 30 53 6 41
39 0 61 54 17 29 59 18 23 50 6 44
36 0 64 50 18 32 56 19 25 50 6 44
38 0 62 56 22 22 62 23 15 50 6 44
36 0 64 57 21 22 60 30 10 58 0 42
43 0 57 86 0 14 86 0 14 83 0 17
43 0 57 86 0 14 86 0 14 83 0 17
43 0 57 86 0 14 86 0 14 83 0 17
60 0 40 100 0 0 100 0 0 75 0 25
50 0 50 67 0 33 67 0 33 100 0 0
Percent
14

were more apt to pay for health, life, and disabilityinsurance, and educational assistance for specifiedemployees. Cooperatives paid retirement insurancefor general managers, office managers, and salesrepresentatives for most of the respondents. Morerespondents indicated that division managers andfield representatives shared the cost of retirementbenefits in dairy cooperatives (table 12).
Respondents indicated more grain, farm sup-ply, and “other” marketing cooperatives paid forlife and disability insurance and educational assis-tance for all employees in the survey. Educationalassistance in fruit and vegetable cooperatives wasalso shared by the employee and the cooperative.Retirement and health insurance were also sharedby more employees in farm supply cooperatives.
Other Benefits Offered, by Cooperative Type
Table 13 shows other benefits offered employ-ees by cooperative function. It should be notedhere that the number of observations/responses isincluded in the table and, in some cases, responseswere small.
One fifth or more respondents of dairy, grain,farm supply, and “other” marketing cooperativesoffered paid vacations and sick days, along withfirst-class travel, company car, and mileage reim-bursement (private car) for general managers,office managers, and in some cooperatives, divisionmanagers and field representatives. Respondentsindicated few health and social club membershipswere offered by cooperatives.
REGIONAL DIFFERENCES
The United States was divided into five geo-graphic regions-Corn Belt, Lake States, NorthernPlains, West (Pacific & Mountain regions), andEast/South Central (the Southeast, Northeast, &South Central regions). These regions weregrouped in this manner to maintain anonymitydue to insufficient data and for statistical analysis.In this section, results of questionnaires are pre-sented by region (figure 3). Most respondents werein the West and Lake States, 27 and 21 percent; fol-lowed by the East/South Central, 19 percent; Corn
Belt, 18 percent; and finally the Northern Plains, 15percent.
Education
All regions, except the Lake States, had thelargest percentage of general managers with bache-lor/associate and master’s degrees (50 to 69 per-cent, table 14). Thirty-six percent of respondents inthe Northern Plains and 32 percent of respondentsin the Lake States said the general managers werehigh school graduates. The Lake States also had thelargest percentage of general managers who had“some college” education. Office managers in theEast/South Central area had the highest percentage(43 percent) of employees with a high school edu-cation. More than 50 percent of respondents indi-cated that division managers were college gradu-ates with either a bachelor, associate, or master’sdegree in three regions-Corn Belt, 56 percent;East/South Central, 55 percent; and the West, 52percent.
Field representatives with college degreeswere highest in the Corn Belt, Northern Plains, andWest regions. The highest percentage of sales repre-sentatives with high school diplomas were foundin the East/South Central, Northern Plains, andWest regions. Most sales representatives with eithera bachelor or associate degree in the Corn Belt andLake States.
Regional Salary
Table 15 shows a breakdown of salary data forthe five geographic regions. The high, median, andmean are reported for each category. The lowsalary was not reported because some respondentsreported part-time salaries. It caused large spreadsbetween the high and low salaries. With this typeof data, the median is a more representative mea-sure than the mean.
Regional differences are significant. The Westhad the largest median salary in all job categorieswith only two exceptions. The Corn Belt averagefor general managers and the East/South Centralaverage for sales representatives are higher, at
15

Table 13-Other benefits offered and paid for by cooperative, by cooperative function
Cooperative function Paid Paid Cooperative Social Health 1st class Mileageandjobcategory vacations sick days car club club travel (private car)
DairyGeneral managerOffice managerDivision managerField representativeSales representative
TotalObservations (number)
Fruit and VegetableGeneral managerOff ice managerDivision managerField representativeSales representative
TotalObservations (number)
GrainGeneral managerOffice managerDivision managerField representativeSales representative
TotalObservations (number)
Farm SupplyGeneral managerOffice managerDivision managerField representativeSales representative
TotalObservations (number)
Other 1General managerOffice managerDivision managerField representativeSales representative
TotalObservations (number)
25 2425 2417 1722 2311 12- -
100 10064 58
30 3024 2420 2013 1413 12- -
100 10070 66
2823211513
100126
2723201614-
100122
25 2523 2321 2117 1714 14- -
100 100120 120
252525169-
10032
252525169
loo32
316
242415-
10033
0000
0
00
3416182111-
10038
57142900
1007
34 5010 1721 1721 814 8
loo loo62 12
385
211917
loo42
2622221713-
10023
1000000-
1001
5020100
20
loo10
Percent
0
0
000-00
000
0
0-00
1000000-
1001
10000
00-
1001
5050000-
1002
38 2025 3225 1712 200 11- -
100 08 35
75 250 26
25 190 140 16- -
100 1004 57
36 3018 2118 2018 1410 15- -
100 10011 94
1000000-
1001
2427211612
loo42
252525
025-
1004
252525178
loo
12
1 Marketing cooperativeswithlow responses.
16

Figure 3- Regional Breakdown
$52,500 and $44,000, than the respective medians inthe West, at $42,000 and $44,000.
Regional Salary Ranking
Geographic regions did not exhibit a signifi-cant difference in the way respondents ranked thefactors-job responsibility, decisionmaking, perfor-mance, experience, education, and the impact ofother firms in the area. Subsequently, no analysiswas done.
Region and Bonuses
Three regions-the Corn Belt, Lake States, andWest-had responses of 40 percent or more in threeof the five job categories (table 16). Four of the
regions reported a relatively high percentage, giv-ing bonuses to sales representatives, while theNorthern Plains reported the lowest percentage forthis category over all job categories. Table 17 showsthe distribution bases for determining bonuses foreach job category by region. Respondents by regionindicated that general, office, and division man-agers’ basis for bonuses were on financial perfor-mance factors. More respondents in the Corn Beltand Northern Plains based bonuses for sales repre-sentatives on sales.
How Benefits Are Paid
Benefits are paid either by the cooperative,employees, or shared by both (table 18). Mostrespondents indicated that retirement, health, life,
17

Table 14-Highest educational background of specified job categories, by region
Region
Job category and educational level Corn Lake NorthernBelt States Plains West
East/SouthCentral
General managerHigh schoolSome collegeCollege graduate
Bachelor or Associate DegreeMaster’s DegreeDoctoral Degree
Total
Office managerHigh schoolSome collegeCollege graduate
Bachelor or Associate DegreeMaster’s DegreeDoctoral Degree
Total
Division managerHigh schoolSome collegeCollege graduate
Bachelor or Associate DegreeMaster’s DegreeDoctoral Degree
Total
Field representativeHigh schoolSome collegeCollege graduate
Bachelor or Associate DegreeMaster’s DegreeDoctoral Degree
Total
Sales representativeHigh schoolSome collegeCollege graduate
Bachelor or Associate DegreeMaster’s DegreeDoctoral Degree
Total
14 32 36 25 1014 40 14 12 19
5414
4-100
28 20 31 23 4322 40 31 10 22
4460
100
33 33 30 21 2811 41 40 27 17
50
60
100
31 40 0 25 466 30 50 15 27
6300
100
29 3621 9
43
07
100
28 360 140 0
loo loo
5013
0-100
5710
4
100
32 38 44 268 0 23 90 0 0 0
loo loo loo loo
26 20 45 500 10 7 50 0 0 0
loo loo loo loo
30 38 55 270 12 5 00 0 0 0
100 100 loo loo
5020
2010
0
loo
45 5625 33
5500
loo
3000
loo
1100
loo
Percent
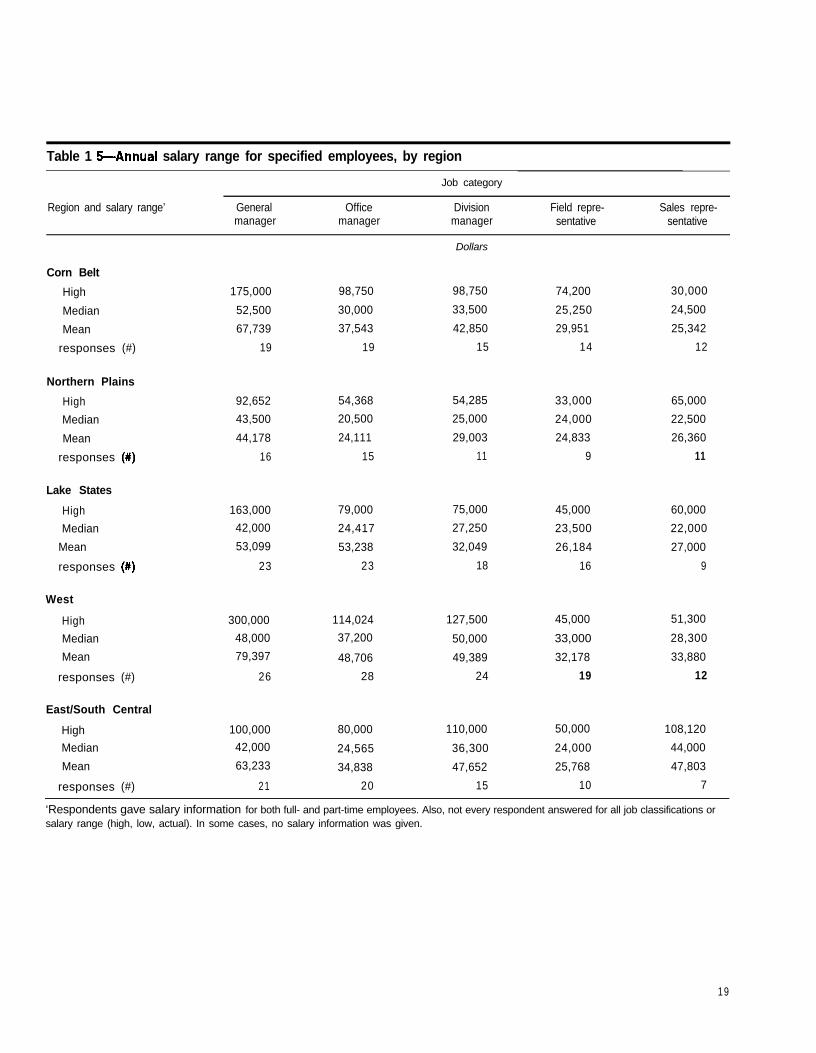
Table 1 !+Annual salary range for specified employees, by region
Job category
Region and salary range’ General Officemanager manager
Divisionmanager
Field repre-sentative
Sales repre-sentative
Dollars
Corn Belt
High 175,000 98,750 98,750
Median 52,500 30,000 33,500
Mean 67,739 37,543 42,850
responses (#) 19 19 15
Northern Plains
High
Median
Mean
responses (#)
92,652 54,368 54,285 33,000 65,000
43,500 20,500 25,000 24,000 22,500
44,178 24,111 29,003 24,833 26,360
16 15 11 9 11
Lake States
High 163,000 79,000 75,000
Median 42,000 24,417 27,250
Mean 53,099 53,238 32,049
responses (#I) 23 23 18
74,200 30,000
25,250 24,500
29,951 25,342
14 12
45,000 60,000
23,500 22,000
26,184 27,000
16 9
West
High 300,000 114,024 127,500 45,000 51,300
Median 48,000 37,200 50,000 33,000 28,300
Mean 79,397 48,706 49,389 32,178 33,880
responses (#) 26 28 24 19 12
East/South Central
High 100,000 80,000 110,000 50,000 108,120
Median 42,000 24,565 36,300 24,000 44,000
Mean 63,233 34,838 47,652 25,768 47,803
responses (#) 21 20 15 10 7
‘Respondents gave salary information for both full- and part-time employees. Also, not every respondent answered for all job classifications orsalary range (high, low, actual). In some cases, no salary information was given.
19

Table 16-Percentage of cooperatives that gavebonuses, by region
Region, job category, and Percent ofnumber in sample’ cooperatives
Corn Belt (21)
General manager
Off ice manager
Division manager
Field representative
Sales representative
Lake States (24)
General manager
Off ice manager
Division manager
Field representative
Sales representative
Northern Plains (17)
General manager
Off ice manager
Division manager
Field representative
Sales representative
West (32)
General manager
Office manager
Division manager
Field representative
Sales representative
East/South Central (22)
General manager
Off ice manager
Division manager
Field representative
Sales representative
42
35
57
46
64
29
32
67
53
64
27
29
29
31
21
47
46
55
40
50
27
30
25
50
56
‘Number of respondents varied in each job category
and disability insurance for general managers,office managers, and division managers were paidby the cooperative in the Corn Belt and Westregions. For all job categories, more respondents inall regions reported that educational assistance waspaid by the cooperative.
Finally, the cost of some benefits was sharedby both the employee and the cooperative. TheEast/South Central was the only region wherehealth insurance for general managers, office man-agers, and division managers was shared by boththe cooperative and the employee. Retirement ben-efits in the Lake States and Northern Plains wereshared by cooperatives and employees in all jobcategories except general managers in the LakeStates.
Other Benefits
Other benefits or “perks” were paid primarilyby the cooperative. Of the cooperatives that offeredperks, table 19 shows those benefits most offered.The largest percentage of respondents in all regionsreported offering all employees paidvacations/holidays and sick days. Mileage (privatecar) or use of the company car was the next largestpercentage, i.e., most common benefit given byrespondents throughout all regions and for all jobcategories. Social and health club memberships andfirst-class travel were uncommon benefits in allregions.
DIFFERENCES IN EMPLOYEE FACTORS,BY SALES RANGE
Many of the previously reported employmentfactors for the 116 respondent cooperatives can begrouped and compared by sales range categories.Out of the 116 cooperative respondents, 115 gavesales information. Of these, 16 cooperatives were inthe smallest sales range, $1.8-2.8 million; 41 cooper-atives were in the $2.9-8.8 million sales range; 33cooperatives were in the $8.9-98.8 million salesrange; and 25 cooperatives were in the $99 millionor more sales range. Differences in the size of coop-eratives, as measured by sales, have an affect onemployment factors.
20

Table I’/-Basis for bonuses for specified employees, by region
Job category and basis Corn Belt Lake States Northern Plains w e s t East/South Central
General managerFinancial performance’Gross volume/salesPercent of top qualityPerformance (co-op/employee)Other2
Total
Office managerFinancial performance’Gross volume/salesPerformance (co-op/employee)Other2
Total
Division managerFinancial performance’Gross volume/salesPercent of top qualityPerformance (co-op/employee)New procurement3Units soldOther2
Total
Field representativeFinancial performance’Gross volume/salesPercent of top qualityPerformance (co-op/employee)New procurement3Units soldOther2
Total
Sales representativeFinancial performance1Gross volume/salesPerformance (co-op/employee)Units soldOther2
Total
67
1 30
00
1 0 0
6 6
1 4
00
1 0 0
6 02 0
00
0
0
0
1 0 0
3 3
3 3
1 7
0
0
0
1 7
1 0 0
2 5 4 5 3 3 0 0
6 2 3 3 5 0 5 0 3 40 11 1 7 5 0 3 4
0 11 0 0 0
1 3 0 0 0 3 2
loo 1 0 0 1 0 0 loo 1 0 0
3 7
3 69
99-
1 0 0
80 6 3 7 20 1 2 0
0 0 0
2 0 2 5 1 40 0 1 4
1 0 0 1 0 0 1 0 0
6 3 1 0 0 56 6 6
2 5 0 1 4 0
1 2 0 2 8 1 7
0 0 0 1 7
1 0 0 loo 1 0 0 loo
5 777
1 5
77
0
1 0 0
1 0 000
0
0
0
0
loo
5 7
1 40
2 9
0
0
0
loo
5 700
2 9
00
1 4
1 0 0
2 3
3 3
0
2 2
2 20
0__1 0 0
2 5 6 0 3 4
5 0 2 0 3 3
0 0 0
2 5 0 3 3
0 2 0 00 0 0
0 0 0
1 0 0 1 0 0 1 0 0
Percent
‘Margin, net earnings, income, profits, and savings.*Varied responses such as agriculture’s national average prices paid to fanners or no standard was given.3Members recruited, new contracts, and grower signup.
21

Table 1 &-Percentage of benefits paid for by cooperative and/or employee, by region
Northern East/SouthCorn Belt LakeStates Plains west Central
Jobcategoryandbenefit C E S C E S C E S C E S C E S'
General managerRetirement insurance
Health insurance
Life insurance
Disability insurance
Educatibnal assistance
Office manager
Retirement insurance
Health insurance
Life insurance
Disability insuranceEducational assistance
Division manager
Retirement insurance
Health insurance
Life insurance
Disability insurance
Educational assistance
Field representative
Retirement insurance
Health insurance
Life insurance
Disability insurance
Educational assistance
Sales representative
Retirement insurance
Health insurance
Life insurance
Disability insurance
Educational assistance
55 5 40 45 15 40 19 6 75 60 4 36 50 0 50
58 0 42 63 4 33 71 0 29 56 6 38 32 0 68
53 la 29 71 19 10 53 12 35 57 la 25 53 0 47
79 21 0 al 19 0 75 0 25 70 13 17 53 0 47
57 7 36 46 27 27 71 0 29 55 10 35 78 0 22
50 10 40 38 19 43 23 0 77 61 4 35 57 0 43
56 0 44 55 5 40 57 0 43 59 0 41 39 0 61
47 24 29 78 17 5 50 21 29 63 13 24 63 0 37
71 29 0 75 19 6 57 14 29 77 9 14 63 0 37
57 7 36 50 30 20 67 0 33 61 6 33 78 0 22
60 0 40 41 12 47 27 0 73 60 0 40 57 0 43
57 0 43 58 0 42 73 0 27 68 0 32 31 0 69
50 21 29 76 6 la 73 0 27 65 10 25 53 0 47
70 30 0 86 7 7 80 0 20 a0 10 lo 53 0 47
54 a 38 56 11 33 60 0 40 56 0 44 78 0 22
53 7 40 33 13 54 22 0 78 65 0 35 50 12 38
46 0 54 50 0 50 56 0 44 63 0 37 44 12 44
38 31 31 71 7 21 63 0 37 67 13 20 56 11 33
60 40 0 a4 a a 67 0 33 74 13 13 67 11 2259 a 33 63 12 25 67 0 33 62 0 38 40 20 40
46 0 54 50 25 25 la 9 73 69 0 31 a3 0 1750 0 50 38 0 63 70 0 30 64 0 36 57 0 43
58 17 25 74 13 13 50 10 40 66 17 17 67 0 33
50 38 12 86 14 0 50 0 50 66 17 17 67 0 33
73 0 27 60 0 40 67 0 33 64 0 36 75 0 25
Percent
‘C = paid by cooperative; E = paid by employee; and S = shared by both.
22

Table 19-Percentage of other benefits offered employees and paid by cooperative, by region
Job category and benefit Corn Belt Lake States Northern Plains West EastLSouthCentral
General managerPaid vacations/holidaysPaid sick daysUse of company carSocial club membershipHealth club membershipFirst-class travelMileage (private car)Number of responses
Office managerPaid vacations/holidaysPaid sick daysUse of company carSocial club membershipHealth club membershipFirst-class travelMileage (private car)Number of responses
Division managerPaid vacations/holidaysPaid sick daysUse of company carSocial club membershipHealth club membershipFirst-class travelMileage (private car)Number of responses
Field representativePaid vacations/holidaysPaid sick daysUse of company carSocial club membershipHealth club membershipFirst-class travelMileage (private car)Number of responses
Sales representativePaid vacations/holidaysPaid sick daysUse of company carSocial club membershipHealth club membershipFirst-class travelMileage (private car)Number of responses
100 100 94 97 90100 100 88 91 8650 52 59 71 6718 9 18 21 210 5 0 3 0
13 9 13 11 1676 77 71 66 63
#18 #23 #16 #27 #18
100 96 94 96 95100 96 88 96 8911 23 59 31 250 5 18 4 130 0 0 4 06 0 13 0 13
88 14 71 71 72#18 #23 #16 #27 #18
100 100 90 100 100100 100 80 96 8850 39 30 63 500 6 10 10 140 0 0 0 0
17 6 10 5 1473 74 60 78 56
#14 #20 #9 #24 #16
100 100 100 95 100100 100 100 100 8069 53 44 68 500 0 11 0 00 0 0 0 09 6 13 0 0
73 63 67 58 60#13 #18 #9 #18 #lO
100 100 91 100 100100 100 91 92 8658 50 36 43 570 10 18 0 170 0 0 0 09 0 0 0 17
82 50 64 93 57#12 #lO #lO #13 #7
Percent
23

Educational Differences, by Sales Range
Cooperatives were grouped in four salesranges in order to compare differences in employ-ees’ education levels. In most cases, there is a pat-tern of cooperatives with larger sales havingemployees with higher educational attainment.
Cooperatives with sales volume in the lowestrange, $1.8-2.8 million, had the largest percentageof office managers, division managers, and fieldrepresentatives who ended their formal educationat the high school level (table 20). However, 69 per-cent of general managers in the lowest sales rangehad bachelor, associate, or higher degrees, while inthe next sales range, $2.9-8.8 million, only 39 per-cent of general managers had bachelor degrees orhigher. The pattern of cooperative size and employ-ee education is also contradicted by the secondlowest sales range, with 80 percent completing for-mal education in high school, while the lowestsales range had 67 percent in that category.However, cooperatives in the second sales rangecategory had the highest percentage, but not themost, of field representatives with bachelor or asso-cia te degrees (table 20).
In the $8.9-98.8 million sales range, roughlyhalf of the employees in all job categories hadeither some college or bachelor/associate degrees.In the more than $99 million sales range, all otherjob categories, except sales representatives, had asubstantial majority with bachelor or associatedegrees. Of a total of 18 doctoral degrees, the high-est sales range had 13 and the next highest salesrange had the remainder of 5.
Salary and Sales Range
Salaries tend to be higher on average for coop-eratives with higher sales ranges. There are a fewexceptions between the lowest and the next highestrange with regard to mean salaries but less so withregard to median salaries. This may have occurredbecause there were 62 responses in the $1.8-2.8 mil-lion sales range as compared to 115 responses inthe $2.9-8.8 million sales range. In some cases,respondents had more than one employee in aspecified job category.
The mean and median are the key summarystatistics reported (table 21) to provide measures ofdistribution. Salaries for general managers tend todiffer significantly between large and small cooper-atives, whereas salaries for more narrowly focusedjobs are more similar regardless of the size of anorganization’s total sales.
Ranking Factors for Salary, by Sales
Table 22 shows the ordering factors thatrespondents indicated were most important in set-ting salaries by sales range. Some of the factorsreceived the same rank. As a result, two or morefactors were often given the same rank, for exam-ple, three l’s and three 6’s. Another example, whilesales representatives in the $1.8-2.8 million salesrange had a majority of respondents ranking jobresponsibility and decisionmaking capabilities as 1,experience for general and division managers alsowas ranked as 1. Again, more explanation in thesurvey’s instructions may have been neededbecause many respondents used the 1 to 6 as ameasure of importance for each factor separately,rather than indicate each factor’s order of impor-tance.
Another explanation may be needed. It isassumed that there are no division managers in thesmaller cooperatives (those with sales from $1.8 to$2.8 million). Therefore, it is also assumed thatrespondents may have substituted assistant man-agers for division managers in this sales size.
Also, some factors were assigned no rank, pre-sumably because respondents considered these ashaving no impact on salary determination. To pro-vide comparable percentages, a mark of 7 wasadded to the priority ordering and given to eachblank or unranked factor.
In the other sales ranges and for all job cate-gories, respondents ranked job responsibility, deci-sionmaking, and performance either 1,2, or 3. Inmost instances when setting salaries, other firms inarea and education were the least important factor,with a rank of 5 or 6. The exceptions were in the$1.8-$2.8 million sales range for division managers,field representatives, and sales representatives. Incontrast, respondents in these job categories felt
24

Table 20-Educational background of specified employee, by sales range
Sales, educationallevel (number in each
sales range)General Office Divisionmanager manager manager
Field Salesrepre- repre-
sentative sentative
Observations (number)$1.8-2.8 million
(16 cooperatives)High schoolSome collegeCollege graduate
Bachelor or Associate DegreeMaster’s DegreeDoctoral Degree
Observations (number)$2.9-8.8 million
(41 cooperatives)High schoolSome collegeCollege graduate
Bachelor or Associate DegreeMaster’s DegreeDoctoral Degree
Observations (number)’$8.9-98.8 million
(33 cooperatives)High schoolSome collegeCollege graduate
Bachelor or Associate DegreeMaster’s DegreeDoctoral Degree
Observations (number)’Over $99 million
(25 cooperatives)High schoolSome college
College graduate
Bachelor or Associate DegreeMaster’s DegreeDoctoral Degree
16 16 14 8 9
12 38 43 63 6719 31 36 25 22
65 31 214 0 00 0 0
13
0
0
11
0
0
39 34 24 15 5
38 38 42 27 8023 35 38 13 0
36 24 21 53 203 3 0 7 00 0 0 0 0
31 29 34 26 21
26 28 26 27 2423 21 32 27 24
3913
0
4110
0
42 434 50 5
25 27
08
29120
31
1013
7430
25 19
24 4224 21
6420
8
07
5933
0
52 320 00 5
Percent
‘In some cases, the number of observations were more than number of cooperatives in specified sales range because there were more thanone employee in that job category.
25

Table 21-Annual salary for specified employees, by sales
Sales range and job categoryMean
Salary range’
Median High
Responsesabove/below
mean
Dollars
$1.8-2.8 million
General manager 43,241 30,000 63,000 2l12Off ice manager 21,682 19,250 69,000 5/l 1Division manager 21,000 21,000 52,500 516Field representative 23,492 20,974 35,000 315Sales representative 24,651 21,000 27,500 2l5
$2.9-8.8 millionGeneral managerOff ice managerDivision managerField representativeSales representative
37,290 37,500 61,800 2011923,012 22,029 42,500 1412025,867 25,000 52,000 711423,204 24,000 33,000 8l721,900 21,000 27,500 515
$8.9-98.8 millionGeneral managerOff ice managerDivision managerField representativeSales representative
60,966 52,500 155,000 10121
33,608 30,000 79,000 12/1836,889 33,950 75,000 8118
26,899 24,500 45,000 8/l 631,389 25,000 65,000 5/l 4
Over $99 millionGeneral managerOff ice managerDivision managerField representative
Sales representative
128,305 120,000 300,000 911268,121 71,400 114,024 13112
67,379 64,000 127,500 1111436,129 35,000 74,200 8/l 441,123 30,000 108,120 718
‘Respondents gave salary information for both full- and part-time employees. Also, not every respondent answered for all job classifications orsalary range (high, low, actual). In some cases, no salary information was given.
26

Table 22-Percentage of ranked factors used for setting salaries for specified employees, by side
Factors General Off ice Divisionsales range manager manager manager
Fieldrepresen-
tative
Salesrepresen-
tative
Rank
$1.8-2.8 millionResponsibility 3 1 3 2 1Decisionmaking 4 3 2 1 1Performance 2 2 4 3 3Experience 1 4 1 3 2Education 6 6 5 5 4Other firms 5 5 2 3 2
$2.9-8.8 millionResponsibility 1 1 1 1 2Decisionmaking 2 3 3 2 3Performance 3 2 2 1 1Experience 4 4 4 3 4Education 5 5 5 4 5Other firms 6 6 6 5 6
$8.9-98.8 million
Responsibility 2 1 1 1 2Decisionmaking 1 3 3 3 3Performance 3 2 2 2 1Experience 4 4 4 4 2Education 5 5 6 6 5Other firms 6 6 5 5 4
Over $99 millionResponsibilityDecisionmakingPerformanceExperienceEducationOther firms
2 1 1 1 23 3 2 2 41 2 1 1 14 4 3 4 35 5 5 5 66 6 4 3 5
27

other firms in the area was a key factor for settingsalaries.
Table 23-Percentage of specified employeesreceiving bonuses, by sales ranges
Bonuses and Their Basis, by Sales Range Job category and Percent receivingsalary range’ bonuses
Respondents with sales in the $8.9-98.8 mil-lion and $99 million or more ranges reported thelargest percentages of bonuses given, 50 and 51percent, respectively. Respondents with sales of$2.9-8.8 million had the lowest percentage thatgave bonuses. Respondents in the $1.8-2.8 millionsales range reported a relatively high percentagefor field representatives, sales representatives, anddivision managers (table 23).
Table 24 shows what factors determinedbonuses. In the first sales level, more respondentsreported financial performance as the basis forbonuses for employees in all job categories.
In the next sales category, $2.9-8.8 million,financial performance as the basis for bonuses forgeneral managers, office managers, and divisionmanagers again had the largest number of respon-dents. For field representatives, bonuses werebased equally on financial performance, sales, andsales growth. Bonuses that were given to sales rep-resentatives based on sales and units sold wereequally important.
Again in the $8.9-98.8 million and the $99 mil-lion or more sales level, the financial performancewas most important to general, office, and divisionmanagers. More cooperative respondents withsales of $8.9-98.8 million reported gross sales/vol-ume was the basis for bonuses for field representa-tives while respondents in the $99 million or moresales range reported that bonuses were based onfinancial performance, new procurement, and salesequally. Respondents indicated that sales represen-tatives in the last two sales levels gave bonusesbased on gross volume/sales.
Relationship Between Salesand How Financed
$1.8-2.8 million(16 cooperatives)General managerOffice managerDivision managerField representativeSales representative
All categories
$2.9-8.8 million(41 cooperatives)General managerOffice managerDivision managerField representativeSales representative
All categories
$8.9-98.8 million(33 cooperatives)General managerOff ice managerDivision managerField representativeSales representative
All categories
Over $99 million(25 cooperatives)General managerOff ice managerDivision managerField representativeSales representative
All categories
20
36
45
56
56
40
27
17
38
21
17
25
46
42
57
44
64
50
52
48
50
47
60
51
‘Number of respondents varied in each job category.
Cooperatives in all sales ranges paid for lifeand disability insurance for employees in the fivejob categories (table 25). Payment of health insur-ance and/or retirement insurance was more likely
28

Table 24-Frequency of basis for bonuses for specified employees, by sales ranges
Sales and bonus Generalfactor manager
Off icemanager
Divisionmanager
Fieldrepre-
santative
Salesrepre-
sentative
$1.8-2.8 millionFinancial performance’Gross sales/volumePerformance (coop./employee)New procurement2Others
$2.9-8.8 millionFinancial petformancelGross sales/volumePercent of top qualityPerformance (coop./employee)Units soldSales growth
$8.9-98.8 millionFinancial performance’Gross sales/volumePercent of top qualityPerformance (coop./employee)New procurement*Other3
Over $99 millionFinancial performance’Gross volume/salesPercent of top qualityPerformance (coop./employee)New procurement2Other3
1030200
Number
‘Margins, net earnings, income, profits, and/or savings,*Number of farmers recruited, grower sign up, and/or new contracts procured.3Varied responses such as agriculture’s national average prices paid to farmers, or no standard was given.
29

Table 25-Percentage of benefits paid for by cooperative and/or employee, by sales ranges
Sales and benefits
Field SalesGeneral Office Division repre- repre-manager manager manager sentative sentative
C E S C E S C E S C E S C E S’
$1.8-2.8 millionRetirement insuranceHealth insuranceLife insuranceDisability insuranceEducational assistance
$2.9-8.8 millionRetirement insuranceHealth insuranceLife insuranceDisability insuranceEducational assistance
$8.9-98.8 millionRetirement insuranceHealth insuranceLife insuranceDisability insuranceEducational assistance
Over $99 millionRetirement insuranceHealth insuranceLife insuranceDisability insuranceEducational assistance
33 9 58 36 9 55 38 12 50 38 12 50 43 14 4347 6 47 47 0 53 55 0 45 33 0 67 29 0 7150 36 14 62 31 8 78 22 0 71 29 0 57 43 078 11 11 80 10 10 86 14 0 80 20 0 66 17 1763 0 37 63 0 37 50 0 50 60 40 0 50 0 50
30 13 57 27 23 50 38 6 56 25 25 50 22 11 6762 5 33 59 3 38 68 0 32 57 7 36 60 0 4047 19 34 48 26 26 61 6 33 44 27 27 38 12 5058 15 27 57 24 19 64 7 29 56 33 11 60 20 2047 29 24 46 31 23 50 10 40 45 22 33 57 0 43
53 4 43 54 0 46 52 0 48 46 0 54 55 5 4063 0 37 63 0 37 67 0 33 67 0 33 74 0 2676 10 14 79 11 11 72 12 16 68 14 18 78 11 1180 15 5 77 14 9 76 14 10 79 16 5 69 23 871 0 29 79 0 21 71 0 29 82 0 18 82 0 18
69 0 31 65 0 35 64 0 36 65 0 35 67 0 3344 56 0 40 0 60 40 0 60 42 0 58 47 0 5356 0 44 52 0 48 52 0 48 53 0 47 60 0 4077 5 18 73 4 23 73 4 23 71 5 24 62 7 3159 5 36 59 5 36 59 5 36 50 6 44 50 6 44
Percent
‘C = paid by cooperative; E = paid by employee; and S = shared by both.
shared by employees and cooperatives in the lowertwo sales ranges, while in the next two higher salesranges these benefits were paid for by the coopera-tive. There was an exception. Office managers,division managers, field representatives, and salesrepresentatives in the $99 million or more salesrange shared payment of health insurance benefitswith the cooperative. The percentage range of ben-efits paid by cooperatives was from 43 percent to86 percent. Retirement was the benefit most oftenshared by both the cooperative and the employee
in the first two sales levels for general managers,office managers, and division managers.
Other Benefits and Sales
Most respondents indicated that other bene-fits-paid vacations and sick days, and mileage ofprivate car-were offered to employees by cooper-atives in every sales range (table 26). Ten out of 23cooperatives in the over $99 million sales rangeoffered social club membership.
30

Table 26-Frequency of specified employees receiving other benefits, by sales’
Benefits and General Office Divisionsales range manager manager manager
Fieldrepre
sentative
Salesrepre-
sentative
$1.8-2.8 million(16 cooperatives)
Paid vacation/holidaysPaid sick daysUse of cooperative carSocial club membershipHealth club membershipFirst-class travelMileage (private car)
$2.9-8.8 million(41 cooperatives)
Paid vacation/holidaysPaid sick daysUse of cooperative carSocial club membershipHealth club membershipFirst-class travelMileage (private car)
$8.9-98.8 million(33 cooperatives)
Paid vacation/holidaysPaid sick daysUse of cooperative carSocial club membershipHealth club membershipFirst-class travelMileage (private car)
16 16 1016 16 10
9 2 51 0 01 0 0
11 0 011 11 8
393517
202
30
30 30 27 25 1929 27 25 23 1921 5 13 13 19
5 2 2 1 190 1 0 0 04 2 2 2 0
18 19 17 14 18
3130
2100
22
Number
2219
5101
13
1515
7000
11
11111111111011
Over $99 million(25 cooperatives)Paid vacation/holidaysPaid sick daysUse of cooperative carSocial club membershipHealth club membershipFirst-class travelMileage (private car)
25 24 24 19 1425 24 24 19 1421 12 17 16 1510 2 3 0 15
1 1 0 0 05 3 4 1 15
14 20 17 13 15
‘Number of responses varied in each job category.
31

CHANGES
The most substantial change in the last 5years, according to respondents, was increasedsalaries. Salaries were increased to keep up withinflation (table 27). Although, survey results indi-cated that “other firms in the area” had little to dowith influencing a cooperative in setting salaries, insome instances it is likely that changes in somebenefits were made to keep up with other firms inthe area.
Other changes were in the form of additionsor changes in the benefits being offered to employ-ees. There were a number of additions made in thelast 5 years of which the 401k retirement plan wasthe mostsignificant. Respondents also indicatedthat cafeteria plan, merit pay, and disability insur-ance were important additions to their benefits.Others were health insurance, personal leave, andprofit-sharing pension plans.
The most important change was a greatershare of health insurance premiums paid byemployees. Higher contribution to 401k, perfor-mance and training based more on accountability,and upgraded pension benefit were the next mostfrequently reported changes.
SUMMARY
There are no set guidelines for cooperatives toset salaries and benefits. They should be sufficientto attract the type of workers that the cooperativeneeds and should provide incentives for qualityperformance.
There are certain factors any business mustconsider. These factors may be the result of externalinfluences, Federal and State government policiesand regulations, competitive background and geo-graphical locations or internal factors, the educa-tional background of employee, skill, physical abil-ity (required by job), and experience. of theemployee.
Job evaluation is one of the tools available fordeveloping equitable pay structures. Job evalua-tions may be developed through several methods-ranking, classification, factor comparison, and
Table 27-Cooperatives reporting changes insalary and benefit package in last 5 years
Change Frequency
Number of responses’
ChangesInflation/cost of livingChange in share of health premiumHealth insurance coverage decreasedCooperative pays l/2 deductibleIncreased for employees’ share of health
packagePerformance and training more based on
accountabilityUpgraded pension benefitHigher contribution to 401 kBe more competitive with “like” companies
For job performance
Freeze on salary
Other2
Added
401 k planCafeteria plan (section 125)Merit payDisability insuranceRetirement plan (3 yrs service)Profit-sharing pension planPersonal leave daysHealth insurance and paid vacationDental under healthExecutive bonus planDeferred compensation programHealth care rebate programMedical plan/health insuranceIncrease in sick leave
Other3
2
2
2
2
2
2
2
13
13
6
4
4
3
3
3
2
2
2
2
2
2
2
‘Some respondents gave more than one response.*Thirteen different responses included life insurance made optional,cumulative sick days, self dental funding, etc.‘Nine responses included bonus program, HMO, incentive payemphasis, additional holidays, etc.
32

point. Each of these methods have advantages anddisadvantages.
Benefit plans must also be evaluated. Benefitplanners should consider employee needs andexpectations, cost escalation, tax considerations,benefit quality, and actions of competitors. Thereare other questions that the cooperative mustanswer. What benefits should be offered and howwill they be ted? What conditions must be metbefore an employee is eligible for benefits? Thesequestions can be answered through interviews ofemployees, monitoring benefit activities of otherbusinesses in the area, government agencies, andreading various benefit publications.
“Perks” were offered to most employees. Paidvacations, holidays and sick days, use of companycar, and mileage reimbursement (private car) weremore widely made available to employees in all jobcategories. Membership in social and health clubswas not so widely available to employees of coop-eratives.
According to respondents, employees hadsome college education or a college degree.Cooperative sales further defined the educationalbackground of selected employees. In the largestsales level, more than $99 million, all selectedemployees with the exception of sales representa-tives were college graduates with a bachelor orassociate degree.
Performance, job responsibility, and decision-making capabilities were the most importantsalary-setting elements. Throughout all job cate-gories, generally education and other firms in thearea were the least important factor in settingsalaries. The methods for evaluating performancevaried. The largest percentage of the respondentsindicated that preagreed goals and objectives wereused. Less than half of the respondents reportedthat bonuses were given to employees based onfinancial performance factors such as margins, netearnings, income, savings.
There were minor regional differences in ben-efits, ranking factors for setting salaries, “perks,”and educational levels of cooperatives. Salary washighest in the West region in all job categories,except for field representatives in the Corn Belt,and sales representatives in the East/South
Central, Northern Plains, and Lake States. Mostbonuses were based on financial performance fac-tors in all regions and job categories with theexception of general managers in the Lake States,field representatives in all regions except theNorthern Plains, and sales representatives in allregions.
Most respondents indicated that retirementplans for general, office, and division managersand field representatives in the West were paid bytheir cooperative.
As cooperative sales volume increased, so didsalaries of job categories except for general man-agers in the smallest sales level.
Cooperative leaders must look at internal andexternal influences when setting salaries and bene-fits and use all available resources such as job eval-uations, Government agencies, other firms in thearea, and employee interviews in developing anequitable salary structure and maintaining a bal-ance between needs of the employee and the coop-erative. Finally, cooperatives must be ready toadapt their salaries and benefits to remain competi-tive.
33

APPENDIX References
Definitions
Cafeteria Plan-Is the official term used in Section125 of the Internal Revenue Code which describes aflexible benefits program between taxable and non-taxable benefits that the Federal Government rec-ognizes. It is an individual combination of benefitsto each employee, rather than a standard programthat covers all employees the same way.
Perquisites (“perks”)-Additional benefitsdesigned not only to increase size of a compensa-tion package, but also to compensate for the stress-es and strains of employment. These benefits arepaid by organization.
Section 40Zk (cash or deferred)-The InternalRevenue Code that permits employees to choosebetween currently taxable cash compensation andnot currently taxable contributions to certain quali-fied plans. Therefore, an employee can electwhether their employer will make contributions ontheir behalf to a qualified profit-sharing plan(including thrift plan), or a qualified stock bonusplan, or the pre-Employment Retirement IncomeSecurity Act (ERISA) money purchase pensionplan; or instead pay the amount to the employeesas cash compensation, without having contribu-tions elected to be made to the qualified plan con-sidered as currently taxable income to the employ-ees under the constructive receipt doctrine.
DeCenzo, David A. and Stephen I? Robbins.Personnel/Human Resource Management.Prentice Hall. Englewood Cliffs, NJ 07632.1983.
Foster, Jr., Ronald M. The Manager’s Guide toEmployee Benefits. Facts on File Publications,New York, NY. Oxford, England. 1986.
Henneman, Herbert G., Donald I? Schwab, John AFossum, and Lee D. Dyer. Personnel/HumanResource Management, Richard D. Irwin, Inc.,Homewood, IL 60430.1983
Rosenbloom, Jerry S. and G. Victor Hallman.Employee Benefit Planning. Prentice-Hall,Englewood Cliffs, NJ 07632. Second Edition.1986.
Wald, Robert M. “Compensation at Cooperatives.”The Cooperative Accountant, Vol. XLII,Number 4, Winter, pp. 16,17, and 18.1989.
34

Sample Questionnaire
DEFINITIONS OF JOB CATEGORIES:
CHIEF EXECUTIVE OFFICER AND OWNER/PRESIDENT/GENERAL MANAGER - The decisionmakingelement of the cooperative-role is toformulate, execute policies, and to obtain cooperative’s objective.
ACCOUNTANT/CONTROLLER/OFFICE MANAGER -- Role is to keep timely and accurate records of cooperative’sfinancial standing.
DIVISION MANAGERS -- Carry out and support policies, objectives of the cooperative and the Chief ExecutiveOficer/President/General Manager.
FIELD REPRESENTATIVE/CONSULTANT -- Uses expertise on how best to cultivate land through soil testing andother tools, and recommends appropriate products and innovative technological trends to improve farm operations.
SALES REPRESENTATIVE -- Keeps abreast of new product on market. Meets withfarmers to take orders and informfarmers of new products. Some sales representatives also make deliveries.
1. How was employee found andultimately hired? (Throughmedia, advertisementreference, word of mouth etc.)
2. How many employees do youemploy?
3. What is educationalbackground? Use followingcodes for: High School = HS,GED; Some College = SC (nodegree); College = ES (2 yrsor 4 yrs); MS; PhD
4. If specific salaryinformation is confidential orif there is more than oneemployee in job category pleaseuse high or low salaryExample: General Manager
$15,000 (low)$25,000 (high)
What is present annual salary foreach job category?
Chief Executive#ficer/President/
GeneralManager
Accountant/Controller/
OfficeManager
DivisionManagers
FieldLepresentativel
Consultant
SalesRepresen-
tative

5. How is salary derived?
Circle the factors--rate in order of importance,1 to 6, with 1 being mostimportant, 6 being leastimportant.
Job responsibilitiesDecision making capabilitiesPerformance (see question no. 13)ExperienceEducationOther agribusiness firmsin area (competitive
6. Does your cooperative givecommissions?
If yes, what are thebonuses and commissionsbased on ? (if no, go to question 7)
7. How are the followingbenefits/perks paid? Enter
c - companye - employee payss - if shared by both
Retirement’Health insuranceLife insuranceDisability insuranceProfit-sharingStock optionsEducational assistance
8. Are the followingbenefits/perks offered?(Circle (Y-Yes) and (N-No)
Paid vacations/holidaysPaid sick leaveUse of company carSocial club membershipsHealth club membershipsFirst class travelMileage (private car)
Chief Executive Accountant/Xficer/President/ Controller/
General OfficeManager Manager
1 2 3 4 5 6 1 2 3 4 5 6 1 2 3 4 5 6 1 2 3 4 5 6 1 2 3 4 5 61 2 3 4 5 6 1 2 3 4 5 6 1 2 3 4 5 6 1 2 3 4 5 6 1 2 3 4 5 61 2 3 4 5 6 1 2 3 4 5 6 1 2 3 4 5 6 1 2 3 4 5 6 1 2 3 4 5 61 2 3 4 5 6 1 2 3 4 5 6 1 2 3 4 5 6 1 2 3 4 5 6 1 2 3 4 5 61 2 3 4 5 6 1 2 3 4 5 6 1 2 3 4 5 6 1 2 3 4 5 6 1 2 3 4 5 6
1 2 3 4 5 6 1 2 3 4 5 6 1 2 3 4 5 6 1 2 3 4 5 6 1 2 3 4 5 6
(
I(
I(
YYYYYYY
1
;
!;
NNNNNNN
Y NY NY NY NY NY NY N
DivisionManagers
( 1
I i( )
I 1( )
Y NY NY NY NY NY NY N
Field SalesLepresentative, Represen-
Consultant tative
(
III
YYYYYYY
!;i
NNNNNNN
Y NY NY NY NY NY NY N
’ If your organization has any written policies on pension/retirement plans/formulas, bonuses/commission, or related compensation/benefit packages you may wishto send a copy of policies.

9. If retirement/pension is shared by employee and cooperative, what is formula for contribution? Example:Cooperative matches employee’s contribution or cooperative pays 75 percent into retirement/pension plans,cooperative pays percentage according to salary, years of service, etc.
10. What changes, if any, have occurred in your organization’s salary and benefit package in the LAST 5 years?Please give a brief description.
11.
12.
13.
What is principal product sold or marketed?
What were your total sales for 1990?
If performance is a factor in question 5, how is it evaluated or measured by the board of directors and how does theCEO, in turn, evaluate performance of key staff members?
Contact Person (Optional)
NAME PHONE

U.S. Department of AgricultureAgricultural Cooperative Service
P.O. Box 96576Washington, D.C. 20090-6576
Agricultural Cooperative Service (ACS) provides research, management, andeducational assistance to cooperatives to strengthen the economic position offarmers and other rural residents. It works directly with cooperative leaders andFederal and State agencies to improve organization, leadership, and operationof cooperatives and to give guidance to further development.
The agency (1 ) helps farmers and other rural residents develop cooperatives toobtain supplies and services at lower cost and to get better prices for productsthey sell; (2) advises rural residents on developing existing resources throughcooperative action to enhance rural living; (3) helps cooperatives improveservices and operating efficiency; (4) informs members, directors, employees,and the public on how cooperatives work and benefit their members and theircommunities; and (5) encourages international cooperative programs.
ACS publishes research and educational materials and issues FarmerCooperatives magazine. All programs and activities are conducted on anondiscriminatory basis, without regard to race, creed, color, sex, age, maritalstatus, handicap, or national origin.