Embed Size (px)
Citation preview
ABSTRACT
Vaswani, Sudeep. Development of Models for Calculating the Life Cycle Inventory of
Methanol by Liquid Phase and Conventional Production Processes. (Under the direction
of Drs. Morton A. Barlaz and H. Christopher Frey).
This study deals with the development of an ASPEN PLUS process model for the
liquid phase methanol (LPMEOH) process, which is in the demonstration phase at
Eastman Chemical Company, TN. The model will ultimately be integrated with MSW
gasification model being modeled separately and used in an integrated gasification
combined cycle (IGCC) system to co-produce methanol and power from syngas obtained
from MSW gasification. The LPMEOH process uses syngas as a starting material for
methanol production. Model results for an example case are presented and the life cycle
inventory (LCI) of methanol has been calculated starting from syngas.
When methanol is produced from the LPMEOH process, its production by
conventional processes is avoided. Thus, an EXCEL spreadsheet model of methanol
production using conventional process has also been developed. This model calculates
the LCI of methanol from conventional process which is used to calculate the emissions
avoided per kg of methanol produced by the LPMEOH process.
For LPMEOH process model, it is found that the performance of the model is
dependent on syngas conversion in methanol reactor. Syngas conversion is a function of
reactor pressure, syngas space velocity in methanol reactor, molar ratio of recycle gases
to fresh syngas feed, and H2/CO molar ratio in syngas feed. The syngas composition
mainly depends on the source from which it is obtained (e.g. coal gasification, MSW
gasification). LPMEOH process model has the capability to process syngas of varying
compositions.
Sensitivity analysis of LPMEOH process model has been presented. Based on the
sensitivity analysis, it is shown that for syngas compositions limited in hydrogen content,
the reactor pressure of or higher than 750 psig must be used. Further it is shown that
recycling the unreacted gases has an advantage of more methanol production compared to
the case with no recycle. It is also shown that the syngas feed with low H2/CO ratio has
lower methanol production than syngas with higher H2/CO ratio. It therefore
recommended that the syngas with low H2/CO ratio be adjusted via water-gas shift
reaction such that the H2/CO ratio increases thereby resulting in a higher methanol
production. It is also learnt that net steam demand in the LPMEOH process increases as
the syngas becomes limited in its hydrogen content. This is expected to have some
implications when the LPMEOH process is combined with an IGCC system.
The LCI of methanol produced by LPMEOH process varies widely with change
in syngas composition and process conditions such as reactor pressure, space velocity in
methanol reactor, and recycle ratio. The main contribution to the LCI occurs from the
combustion of purge gases to produce steam in a boiler. The steam generated offsets the
emissions from other contributors of the LCI. The sensitivity analysis of the LCI of
methanol production from LPMEOH reveals that the methanol LCI is quite sensitive to
the changes in syngas composition, reactor pressure, syngas space velocity and the
recycle ratio.
The sensitivity analysis of conventional methanol production has also been
discussed. It is found that the LCI of conventional process is not very sensitive to changes
in natural gas composition, which is used as a raw material for methanol production. The
change in syngas conversion in methanol reactor also does not cause the overall LCI of
methanol to change significantly.
The ultimate objective of the study is to compare the LCI of methanol produced
by conventional process with that by LPMEOH process to determine if there is any
advantage to methanol production by using LPMEOH technology on syngas derived
from MSW gasification. The effect of an LPMEOH process on a gasification system
would be an incremental increase in fuel use. Because of the incremental fuel use there
would be an increase in elemental sulfur recovered, slag production, and some pollutant
emissions. However, an overall LCI of methanol for LPMEOH process would require the
calculation of the LCI associated with gasification.
DEVELOPMENT OF MODELS FOR CALCULATING THE LIFE CYCLE INVENTORY OF METHANOL BY LIQUID PHASE AND CONVENTIONAL
PRODUCTION PROCESSES
by
SUDEEP VASWANI
A thesis submitted to the Graduate Faculty of
North Carolina State University
in partial fulfillment of the
requirements for the Degree of
Master of Science
DEPARTMENT OF CIVIL ENGINEERING
Environmental Engineering and Water Resources
Raleigh, NC
2000
APPROVED BY:
____________________________ _______________________________ Co-chair of Advisory Committee Co-chair of Advisory Committee
____________________________
ii
BIOGRAPHY
Sudeep Vaswani was born on 31st August 1975 in Mumbai (Bombay), India. He
earned a Bachelor of Engineering degree in Chemical Engineering from University of
Roorkee (UOR), India in November 1998. His areas of interest upon graduation included
Process Modeling and Simulation of Chemical Processes, Air Pollution Control, Air
Quality and Process Thermodynamics.
He joined Marine, Earth and Atmospheric Science (MEAS) department at North
Carolina State University in August 1998 to pursue an M.S. in Air Quality. In January
1999, he transferred to Civil Engineering department at NC State to pursue an M.S. in
Environmental Engineering. Drs. Morton A. Barlaz and H. Christopher Frey advised him.
He pursued a minor in Chemical Engineering along with his major in Environmental
Engineering. He completed his M.S. thesis research in June 2000.

iii
ACKNOWLEDGEMENTS
I would like to express my deepest appreciation to my advisors, Drs. Morton
Barlaz and Christopher Frey, for their invaluable guidance, support, and sincere help
throughout my graduate study at North Carolina State University. Special thanks to the
United States Environmental Protection Agency (U.S. EPA) and National Science
Foundation (NSF) for funding the project. I would like to thank Dr. Michael Overcash,
who provided help in this research project. I would like to thank my roommates,
Ravindra, Madhur, and Manoj for being ever supportive and understanding on every
front. I would also like to thank my project partner, Matt, who helped me learn ASPEN
PLUS fast and was always ready to help solve the project related problems that I had.
Thanks are also due to my officemate and friend, Dan, for being very nice to me and
extending his help whenever I needed it. I would like to thank my friend and officemate,
Sachin, who was always helpful in every regard. I spent really nice “take it EZ” time with
him in my office and out.
I would like to express my deep gratitude to my parents who have always helped,
supported, taught and encouraged me. I would like to thank my brother, Rakesh, and my
sister, Neelam, for always being supportive. In the end I would like to thank my fiancée,
Aakanksha, who is always on my side.
iv
TABLE OF CONTENTS
LIST OF FIGURES…………………………………………………………………….xi
LIST OF TABLES……………………………………………………………………...xv
1.0 INTRODUCTION AND BACKGROUND INFORMATION .........................1
1.1 MOTIVATING QUESTIONS ..................................................................................3
1.2 OVERVIEW OF MSW MANAGEMENT .................................................................4
1.3 GASIFICATION SYSTEMS AND MSW GASIFICATION TECHNOLOGY .....................6
1.4 METHANOL PRODUCTION..................................................................................7
1.5 LIFE CYCLE INVENTORY ANALYSIS OF CHEMICALS ...........................................8
1.6 OBJECTIVES......................................................................................................9
2.0 LIFE CYCLE INVENTORY OF STEAM .....................................................11
2.1 BACKGROUND ................................................................................................12
2.2 SYSTEM BOUNDARIES AND DESIGN BASIS .......................................................15
2.3 CALCULATION OF THE LCI OF STEAM .............................................................21
2.3.1 Pre-combustion Emissions from the Fuels Fired.........................................21
2.3.2 Combustion of Coal to Generate Steam......................................................27
2.3.3 Combustion of Fuel Oil for the Generation of Steam ..................................30
2.3.4 Combustion of Natural Gas for Generation of Steam..................................33
2.3.5 Overall Weighted Emission Factors from Boilers Generating Steam ..........35
v
2.3.6 LCI of Lime consumed for the Removal of SO2 in a Spray Dryer ................38
2.3.7 LCI Associated with Boiler Feed Water (BFW) Pretreatment .....................41
2.3.8 Overall LCI of Steam production................................................................45
3.0 LIFE CYCLE INVENTORY OF ELECTRICITY ........................................51
3.1 DESIGN BASIS AND SYSTEM BOUNDARIES .......................................................52
3.2 ELECTRIC GRID DEFINITION............................................................................53
3.3 GENERATION EFFICIENCIES OF ELECTRICITY GENERATION ..............................54
3.4 FUEL HEATING VALUES ..................................................................................54
3.5 FUEL PRE-COMBUSTION ENERGY....................................................................55
3.6 TOTAL FUEL EMISSIONS AND LCI CALCULATION.............................................56
4.0 LIQUID PHASE METHANOL PROCESS....................................................59
4.1 OVERVIEW OF METHANOL PRODUCTION..........................................................60
4.1.1 The ICI Low-Pressure Methanol Synthesis Process ....................................65
4.1.2 The Lurgi Low-Pressure Methanol Synthesis Process.................................69
4.1.3 The MGC Low-Pressure Process................................................................72
4.1.4 Liquid Phase Methanol Process .................................................................73
4.1.5 Water-gas Shift Reaction............................................................................78
4.2 COMMERCIAL STATUS OF LIQUID PHASE METHANOL (LPMEOHTM)
TECHNOLOGY .................................................................................................80
4.3 MODELING PROCESS FLOWSHEETS IN ASPENPLUS........................................87
4.4 TECHNICAL DESCRIPTION OF THE LIQUID PHASE METHANOL (LPMEOHTM)
vi
PROCESS.........................................................................................................89
4.4.1 LPMEOHTM Process Description ...............................................................89
4.4.2 Process Chemistry of Methanol Synthesis...................................................94
4.4.3 Catalyst Activity .........................................................................................95
4.4.4 Major Process Equipment ..........................................................................96
4.5 MAJOR PROCESS SECTIONS IN THE LPMEOHTM PROCESS MODEL IN
ASPENPLUS...............................................................................................104
4.5.1 Guard Bed................................................................................................104
4.5.2 Feed-Recycle Mixer .................................................................................104
4.5.3 Economizer ..............................................................................................109
4.5.4 LPMEOHTM Reactor ................................................................................109
4.5.5 Cyclone Separator....................................................................................118
4.5.6 Oil Separator ...........................................................................................118
4.5.7 Pre-Methanol Separator Condensers........................................................119
4.5.8 Pre-Methanol Separator Flash Valve .......................................................119
4.5.9 Methanol Separator .................................................................................120
4.5.10 Recycle and Purge Gas Splitter ................................................................120
4.5.11 Pre-Distillation Pressure Relief Valve......................................................121
4.5.12 Methanol Distillation and Purification Section.........................................121
4.5.13 Distillation Column Reboiler....................................................................122
4.5.14 Recycle Gas Compressor..........................................................................123
4.5.15 Reactor’s Internal Heat Exchanger ..........................................................123
vii
4.5.16 Fresh and Recycle Syngas Mixer..............................................................124
4.5.17 Purge Mixer .............................................................................................124
4.6 DESIGN SPECIFICATION AND FORTRAN BLOCKS USED IN LPMEOH PROCESS
MODEL.........................................................................................................127
4.7 CONVERGENCE SEQUENCE OF LPMEOH PROCESS MODEL............................128
4.8 LPMEOH PROCESS MODEL VERIFICATION AND VALIDATION .......................134
4.8.1 Comparison of the Model Results with the Actual Plant Results ...............134
4.8.2 Sensitivity Analysis on the LPMEOH Process Model................................135
4.9 APPLICATION OF THE LIQUID PHASE METHANOL (LPMEOH) PROCESS MODEL
TO A BASE CASE. ..........................................................................................135
4.9.1 Input Assumptions ....................................................................................136
4.9.2 Running the Model and Model Results .....................................................137
4.10 LIFE CYCLE INVENTORY OF LPMEOH PROCESS ...........................................144
4.10.1 System Boundaries and Design Basis .......................................................144
4.10.2 Calculation of LPMEOH Process LCI......................................................146
4.11 SENSITIVITY ANALYSIS OF LPMEOH PROCESS MODEL IN ASPEN PLUS .....164
4.11.1 Syngases Considered in the Sensitivity Analysis .......................................165
4.11.2 Sensitivity Analysis on Texaco Syngas used at LPMEOH Process
Demonstration Facility at Kingsport ........................................................167
4.11.3 Sensitivity Analysis on Syngas Produced by British Gas and Lurgi (BGL)
Gasifier Fired with Coal ..........................................................................180
4.11.4 Sensitivity Analysis on Syngas Produced by Municipal Solid Waste (MSW)
viii
Fired British Gas and Lurgi (BGL) Gasifier.............................................190
4.11.5 Comparison of Sensitivity Results Among Various Syngas Compositions
Considered...............................................................................................198
4.11.6 Sensitivity Analysis of the LCI of Methanol...............................................203
5.0 LIFE CYCLE INVENTORY OF METHANOL PRODUCED BY
CONVENTIONAL PROCESS......................................................................217
5.1 OVERVIEW OF METHANOL PRODUCTION BY CONVENTIONAL PROCESS...........218
5.1.1 Natural Gas Compression and Steam Supply............................................222
5.1.2 Syngas Generation ...................................................................................222
5.1.3 Waste Heat Boiler (WHB) ........................................................................223
5.1.4 Water Removal and Knock-out Drum .......................................................224
5.1.5 Syngas Compressor..................................................................................224
5.1.6 Methanol Reactor.....................................................................................224
5.1.7 Syngas Feed/Methanol Product Heat Exchanger (Feed-Preheater) ..........226
5.1.8 Methanol Condenser ................................................................................227
5.1.9 Pre-Flash Drum Pressure Relief Valve.....................................................227
5.1.10 Flash Drum for Removal of Uncondensed Gases......................................227
5.1.11 DME Distillation......................................................................................228
5.1.12 Pre-Methanol Distillation Pressure Relief Valve ......................................228
5.1.13 Methanol Distillation ...............................................................................229
5.2 OVERVIEW OF LCI MODEL ...........................................................................229
ix
5.2.1 Mass Balance Sub-Model .........................................................................231
5.2.2 Energy Balance Sub-Model ......................................................................231
5.2.3 Physical Property Sub-Model...................................................................231
5.2.4 Purge Emissions Sub-Model.....................................................................234
5.2.5 Fugitive Emissions Sub-Model .................................................................234
5.2.6 LCI of Steam Sub-Model ..........................................................................234
5.2.7 LCI of Electricity Sub-Model....................................................................235
5.2.8 Pre-Combustion Sub-Model .....................................................................235
5.2.9 Overall LCI of Methanol Model ...............................................................236
5.3 LCI OF METHANOL PRODUCTION..................................................................236
5.3.1 Mass Balance across the Conventional Methanol Process........................237
5.3.2 Energy Balance Across the Conventional Methanol Process ....................253
5.3.3 Calculation of the LCI of Methanol Production from a Conventional Process
................................................................................................................276
5.4 SENSITIVITY ANALYSIS OF THE CONVENTIONAL METHANOL PROCESS MODEL
....................................................................................................................294
5.4.1 Sensitivity of Methanol LCI to Natural Gas Composition .........................294
5.4.2 Sensitivity of Methanol LCI to Methane Conversion in the Steam Reformer....
................................................................................................................304
5.4.3 Sensitivity of Methanol LCI to CO and CO2 Conversion in Methanol Reactor
................................................................................................................308
5.4.4 Sensitivity of Methanol LCI to Purge Gas Combustion Efficiency.............313

x
6.0 CONCLUSIONS............................................................................................315
7.0 REFERENCES ..............................................................................................323
8.0 APPENDICES................................................................................................333
xi
LIST OF FIGURES
Figure 4-1. Methanol Converter Types .........................................................................64
Figure 4-2. The ICI Low Pressure Process ....................................................................68
Figure 4-3. The Lurgi Low Pressure Process ................................................................71
Figure 4-4. Simplified Process Flowsheet for Liquid Phase Methanol (LPMEOH™)
Process .......................................................................................................76
Figure 4-5. Simplified Process Diagram (LPMEOH™ Process Demonstration Facility,
Kingsport)...................................................................................................93
Figure 4-6. LPMEOH™ Reactor and Reaction Schematics...........................................97
Figure 4-7. LPMEOH™ Process Flowsheet as Modeled in ASPEN PLUS .................108
Figure 4-8. Graph of (H2+CO) Conversion Predicted by Equation 4-13 versus Actual
(H2+CO) Conversion as in Table 4-6 ........................................................114
Figure 4-9. (H2+CO) Conversion From Actual Plant Data Compared with that Obtained
by Using Equation (4-13) and Equation (4-14)..........................................117
Figure 4-10. Convergence Sequence for the LPMEOH™ Process Model in ASPEN
PLUS........................................................................................................133
Figure 4-11. Results of Sensitivity of Reactor Pressure on Methanol Production, Steam
Production, Steam Consumption, and Net Steam Consumption for Texaco
Syngas Being Used at Kingsport. ..............................................................173
Figure 4-12. Results of Sensitivity of Reactor Pressure on Electricity Consumption in
Recycle Gas Compressor and Purge Gas Flowrate for Texaco Syngas Being

xii
Used at Kingsport. ....................................................................................173
Figure 4-13. Results of Sensitivity of Syngas Space Velocity on Methanol Production,
Steam Production, Steam Consumption, and Net Steam Consumption for
Texaco Syngas Being Used at Kingsport...................................................176
Figure 4-14. Results of Sensitivity of Syngas Space Velocity on Electricity Consumption
in Recycle Gas Compressor and Purge Gas Flowrate for Texaco Syngas
Being Used at Kingsport ...........................................................................176
Figure 4-15. Results of Sensitivity of Recycle Ratio on Methanol Production, Steam
Production, Steam Consumption, and Net Steam Consumption for Texaco
Syngas Being Used at Kingsport ...............................................................179
Figure 4-16. Results of Sensitivity of Recycle Ratio on Electricity Consumption in
Recycle Gas Compressor and Purge Gas Flowrate for Texaco Syngas Being
Used at Kingsport .....................................................................................179
Figure 4-17. Results of Sensitivity of Reactor Pressure on Methanol Production, Steam
Production, Steam Consumption, and Net Steam Consumption for the Syngas
Obtained from Coal Fired BGL Gasifier ...................................................184
Figure 4-18. Results of Sensitivity of Reactor Pressure on Electricity Consumption in
Recycle Gas Compressor and Purge Gas Flowrate for the Syngas Obtained
from Coal Fired BGL Gasifier ..................................................................184
Figure 4-19. Results of Sensitivity of Syngas Space Velocity on Methanol Production,
Steam Production, Steam Consumption, and Net Steam Consumption for the
Syngas Obtained from Coal Fired BGL Gasifier .......................................186
xiii
Figure 4-20. Results of Sensitivity of Syngas Space Velocity on Electricity Consumption
in Recycle Gas Compressor and Purge Gas Flowrate for the Syngas Obtained
from Coal Fired BGL Gasifier ..................................................................186
Figure 4-21. Results of Sensitivity of Recycle Ratio on Methanol Production, Steam
Production, Steam Consumption, and Net Steam Consumption for the Syngas
Obtained from Coal Fired BGL Gasifier ...................................................189
Figure 4-22. Results of Sensitivity of Syngas Recycle Ratio on Electricity Consumption
in Recycle Gas Compressor and Purge Gas Flowrate for the Syngas Obtained
from Coal Fired BGL Gasifier ..................................................................189
Figure 4-23. Results of Sensitivity of Reactor Pressure on Methanol Production, Steam
Production, Steam Consumption, and Net Steam Consumption for the Syngas
Obtained from MSW Fired BGL Gasifier .................................................193
Figure 4-24. Results of Sensitivity of Reactor Pressure on Electricity Consumption in
Recycle Gas Compressor and Purge Gas Flowrate for the Syngas Obtained
from MSW Fired BGL Gasifier.................................................................193
Figure 4-25. Results of Sensitivity of Syngas Space Velocity on Methanol Production,
Steam Production, Steam Consumption, and Net Steam Consumption for the
Syngas Obtained from MSW Fired BGL Gasifier .....................................195
Figure 4-26. Results of Sensitivity of Reactor Pressure on Electricity Consumption in
Recycle Gas Compressor and Purge Gas Flowrate for the Syngas Obtained
from MSW Fired BGL Gasifier.................................................................195
Figure 4-27. Results of Sensitivity of Recycle Ratio on Methanol Production, Steam
xiv
Production, Steam Consumption, and Net Steam Consumption for the Syngas
Obtained from MSW Fired BGL Gasifier .................................................197
Figure 4-28. Results of Sensitivity of Syngas Recycle Ratio on Electricity Consumption
in Recycle Gas Compressor and Purge Gas Flowrate for the Syngas Obtained
from MSW Fired BGL Gasifier.................................................................197
Figure 4-29. Comparison of Methanol Production, Stream Production, Steam
Consumption, Net Steam Consumption for: (1) Texaco Syngas (Kingsport);
(2) MSW Fired BGL Gasifier Syngas; and (3) Coal Fired BGL Gasifier
Syngas ......................................................................................................199
Figure 4-30. Comparison of Electricity Consumption and Purge Gas Production for: (1)
Texaco Syngas (Kingsport); (2) MSW Fired BGL Gasifier Syngas; and (3)
Coal Fired BGL Gasifier Syngas...............................................................199
Figure 5-1. Simplified Flowsheet for the Production of Methanol by a Conventional
Process (e.g., Lurgi Low Pressure Process) ...............................................221
Figure 5-2. Design on Spreadsheet for Conventional Methanol LCI Calculation.........232
xv
LIST OF TABLES
Table 2-1. Boiler Population Distribution by Heat-transfer Configuration.....................14
Table 2-2. Relative Distribution by Capacity of the Three Types of Industrial Boilers ..15
Table 2-3. Percentage of Installed Capacity of Various Fuel Type Watertube Boilers in
2.9 MWt to 29.3 MWt Heat-input Category (U.S. EPA, 1982).....................18
Table 2-4. Ultimate Analysis and Heating Values of Fuels Used in Developing the
Emission Factors (Pechtl and Chen, 1992; Perry, 1997; U.S. EPA, 1982)....18
Table 2-5. Code of Federal Regulations Emissions Limit for Boilers Heat Rate in the
Range of 2.9 MWt to 29 MWt (from 40 CFR Part 60 – As revised on July
1999) ..........................................................................................................19
Table 2-6. Pre-Combustion Emissions per 1000 Units of Fuel (Dumas, 1998) ..............23
Table 2-7. Pre-Combustion Emissions for 1 MJ of Steam Produced..............................25
Table 2-8. Emission Factors of Various Pollutants After APC for Different Coal Fired
Boilers Firing Bituminous Coal...................................................................29
Table 2-9. Emission Factors for Various Pollutants After APC Equipment for Distillate
and Residual Oil Fired Industrial Boilers.....................................................32
Table 2-10. Emission Factors for Various Pollutants After APC Equipment for Natural
Gas fired Industrial Boilers .........................................................................34
Table 2-11. Emissions from Various Boilers (units: lb/MMBtu heat input). ..................36
Table 2-12. Emissions From Various Boilers Based on Steam Allocation for the
Production of 1 MJ Steam (units: kg/MJ Steam Produced). .........................37
xvi
Table 2-13. LCI of Lime Associated with Removal of SO2 for 1MJ Steam Production .40
Table 2-14. LCI of BFW Treatment for 1 MJ Steam Generation...................................43
Table 2-15. LCI of Steam (Units: kg/MJ of steam) .......................................................47
Table 2-16. LCI of Steam (Units: lb/MMBtu of steam).................................................49
Table 3-1. National Electric Generation by Fuel Type (Dumas, 1998) ..........................53
Table 3-2. National Grid Generation Efficiencies (Dumas, 1998) .................................54
Table 3-3. National Grid Fuel Heating Values (Dumas, 1998) ......................................55
Table 3-4. Fuel Pre-Combustion Energy (Dumas, 1998)...............................................56
Table 3-5. Emissions produced per kWh of Electricity generated (LCI of Electricity)a..58
Table 4-1. Processes and Feedstocks for Methanol Production .....................................60
Table 4-2. Chem Systems Inc, Bench-scale Testing of LPMEOH PDU ........................82
Table 4-3. LPMEOHTM PDU, LaPorte, Texas ..............................................................84
Table 4-4. Commercial Scale Demonstration of LPMEOHTM Process, Kingsport (260
TPD Plant)..................................................................................................86
Table 4-5 Description of Stream Numbers Used in the Process Flowsheet of LPMEOH
Process as Modeled in ASPEN PLUS (Figure 4-7)....................................106
Table 4-6. Data Set Used in Regression Analysis to Develop a (H2+CO) Conversion
Model (C) for the LPMEOH Reactor as a Function of Pressure, P, Space
Velocity, SV, and H2/CO ratio, R..............................................................112
Table 4-7. Results of Regression Analysis on Data in Table 4-6 Applied to the 3 Models
Considered................................................................................................113
Table 4-8. Comparison of (H2+CO) Conversion from Actual Plant Data with that
xvii
Obtained From Equation 4-13 (before modification) and Equation 4-14 (after
modification). ...........................................................................................116
Table 4-9. LPMEOHTM Process Unit Operation Block Description for ASPEN PLUS
Model .......................................................................................................125
Table 4-10. Convergence Blocks and the Methods used for Convergence...................131
Table 4-11. Summary of Convergence Sequence ........................................................131
Table 4-12. Temperature, Pressure and Composition of Fresh Syngas Feed Used in the
Base Case (Air Products and Chemicals, Inc., 1997) .................................140
Table 4-13. Summary of Selected Base Case Input Values for the LPMEOH Process (Air
Products and Chemicals, Inc., 1997) .........................................................141
Table 4-14. Summary of the Results Produced by LPMEOH Model in ASPEN PLUS for
the Base Case............................................................................................142
Table 4-15. Comparison of Simulation Results of the Same Base Case with Two
Different Values of ‘A’ in Equation (4-16)................................................143
Table 4-16. LCI Parameters considered in the LCI of LPMEOH Process....................146
Table 4-17. LCI of Steam in LPMEOH Process for the Base Case..............................149
Table 4-18. LCI of Electricity for LPMEOH Process Base Case.................................152
Table 4-19. Composition of Purge Gas for the Base Case ...........................................154
Table 4-20. LCI of Purge Gas for the Base Case.........................................................155
Table 4-21. Fugitive Emissions from LPMEOH Process.............................................157
Table 4-22. Emissions from Storage Tanks.................................................................158
Table 4-23. Emissions Associated With BOD Removal from Wastewater ..................159
xviii
Table 4-24. Overall Emissions Due to BOD Removal Including the Emissions from
Electricity Generation (LCI of Electricity) ................................................160
Table 4-25. Overall LCI of Methanol (LPMEOH Process Base Case, in kg/kg of
methanol produced) ..................................................................................162
Table 4-26. Temperature and Composition of Texaco Gasifier Syngas (Air Products and
Chemicals, Inc., 1997) ..............................................................................166
Table 4-27. Results of Sensitivity Analysis for Varying Pressure, Space Velocity, and
Recycle Ratio in LPMEOH Process Operating on Texaco Syngas Being Used
at Kingsport ..............................................................................................169
Table 4-28. Results of Sensitivity Analysis for Varying Pressure, Space Velocity, and
Recycle Ratio in LPMEOH Process Operating on Syngas Obtained from
Coal Fired BGL Gasifier ...........................................................................181
Table 4-29. Results of Sensitivity Analysis for Varying Pressure, Space Velocity, and
Recycle Ratio in LPMEOH Process Operating on Syngas Obtained from
MSW Fired BGL Gasifier .........................................................................191
Table 4-30. Sensitivity Results for Texaco Syngas on per kg of Methanol Produced Basis
for Reactor Pressure of 750 psig and 1000 psig. ........................................205
Table 4-31. The LCI of Methanol for Reactor Pressures of 750 psig and 1000 psig in
LPMEOH Process Using Texaco Syngas ..................................................206
Table 4-32. Sensitivity Results for Texaco Syngas on per kg of Methanol Produced Basis
for Syngas Space Velocities of 4000 standard liters/kg-hr and 8000 standard
liters/kg-hr ................................................................................................208
xix
Table 4-33. The LCI of Methanol for Syngas Space Velocities of 4000 Sl/kg-hr and 8000
Sl/kg-hr in LPMEOH Process Using Texaco Syngas.................................209
Table 4-34. Sensitivity Results for Texaco Syngas on per kg of Methanol Produced Basis
for Recycle Ratios of 2 moles recycle/moles fresh feed and 3 moles
recycle/moles fresh feed............................................................................211
Table 4-35. The LCI of Methanol for Recycle Ratios of 2 moles recycle gas/moles fresh
feed and 3 moles recycle gas/moles fresh feed in LPMEOH Process Using
Texaco Syngas..........................................................................................212
Table 4-36. Sensitivity Results for Different Syngas Compositions on per kg of
Methanol Produced Basis for Reactor Pressure of 750 psig, Syngas Space
Velocity of 8827 standard liters/kg-hr and Recycle Ratio of 3.22 moles
recycle gas/moles fresh syngas feed ..........................................................214
Table 4-37. The LCI of Methanol for Different Syngas Compositions Using Reactor
Pressure of 750 psig, Syngas Space Velocity of 8827 standard liters/kg-hr
and Recycle Ratio of 3.22 moles recycle gas/moles fresh syngas feed.......215
Table 5-1. Typical Natural Gas Compositions ............................................................222
Table 5-2. Physical Properties of Compounds used in Physical Property Sub-Model ..233
Table 5-3. Default Input Values of Process Variables Used for Conventional Methanol
Production ................................................................................................249
Table 5-4. Mass Balance Across Methanol Production Process (All flowrates are in
kmol/hr)....................................................................................................251
Table 5-5. Energy Balance Results of Process Units that Affect the LCI of Methanol
xx
(28,500 kg/hr of Methanol Production) .....................................................275
Table 5-6. LCI of Steam Used in the Conventional Methanol Synthesis Process.........279
Table 5-7. LCI of Electricity used in the Conventional Methanol Synthesis Process ...282
Table 5-8. LCI for Fugitive Emissions from Conventional Methanol Synthesis Process
.................................................................................................................283
Table 5-9. Emissions Associated with Purge Gas Combustion....................................285
Table 5-10. Uncontrolled and Controlled Emissions from Fired Heaters Firing Natural
Gas (AP-42, US EPA, 1998) .....................................................................287
Table 5-11. Emissions due to Natural Gas Combustion in Steam Reformer Furnace ...288
Table 5-12. Pre-Combustion Emissions due to Natural Gas Use in Methanol Process.290
Table 5-13. Overall LCI of Methanol Using Conventional Process (kg/kg methanol
produced)..................................................................................................292
Table 5-14. Natural Gas Compositions from Various U.S. Fields (Babcock and Wilcox,
1972) ........................................................................................................295
Table 5-15. Selected Model Results for Various Natural Gas Compositions Given in
Table 5-14 ................................................................................................296
Table 5-16. Selected Model Results for Various Natural Gas Compositions Given in
Table 5-14 on per kg of Methanol Produced Basis ....................................296
Table 5-17. LCI of Methanol for the Base Case Natural Gas Composition (Units: kg/kg
of methanol produced) ..............................................................................300
Table 5-18. The LCI of Methanol for the Pennsylvania Natural Gas Composition and
Percentage Difference With Respect to the Base Case LCI (Units: kg/kg of

xxi
methanol produced) ..................................................................................301
Table 5-19. LCI of Methanol based on Various Natural Gas Compositions as in Table 5-
14 .............................................................................................................303
Table 5-20. Model Results for Various CH4 Conversions in the Steam Reformer .......305
Table 5-21. Model Results for Various CH4 Conversions in the Steam Reformer on per
kg of Methanol Produced Basis.................................................................305
Table 5-22. Overall LCI of Methanol for Different CH4 Conversions and the Percentage
Difference With Respect to the Base Case (Units: kg/kg of methanol) ......307
Table 5-23. Model Results for Various CO and CO2 Conversions in the Methanol
Reactor .....................................................................................................309
Table 5-24. Model Results for Various CO and CO2 Conversions in the Methanol
Reactor on per kg of Methanol Produced Basis .........................................309
Table 5-25. LCI of Methanol for Various CO and CO2 Percent Conversions in Methanol
Reactor (Units: kg/kg of methanol produced) ............................................312
Table 5-26. Comparison of the Overall LCI of Methanol with 99 Percent and 99.99
Percent Purge Gas Combustion Efficiency in Steam Reformer Furnace.....313
Table A-1. EXCEL Spreadsheet used to Calculate Natural Gas Compositiona ............335
1
1.0 INTRODUCTION AND BACKGROUND INFORMATION
Management of municipal solid waste (MSW) continues to be a high priority
issue for many communities as we enter the new century. Landfilling has been the most
common method of solid waste management in the U.S. (Tchobanoglous, 1993). As the
space available for landfilling MSW continues to shrink, alternative methods for its
management are being sought. Another popular way of treating MSW is by thermal
processing. Thermal processing is used both for volume reduction and energy recovery.
The two most focused ways of thermal processing are incineration and gasification of
MSW. Due to recently demonstrated benefits of gasification over incineration, as
described in the following paragraph, gasification technology is under great attention
(Simbeck et al., 1983; Stiegel, 2000).
Gasification can be defined as the process of partial combustion in which a fuel
(e.g. MSW) is partially combusted with less than stoichiometric air (Tchobanoglous,
1993). The product gas, referred to as synthesis gas or syngas, consists mainly of
hydrogen (H2), carbon monoxide (CO), and carbon dioxide (CO2). After cleaning, this
synthesis gas can be split and used for the production of wide variety of chemicals such
as methanol, hydrogen, ammonia, sulfuric acid, formaldehyde, and others or saturated
with water and combusted in a gas turbine for power production. The main advantage of
gasification over incineration is that gasification allows for the conversion of a wide-
range of fuels such as coal, petroleum cokes, natural gas, heavy oils, biomass and wastes
into a product gas that can be used for power generation or as a feed stock for the
2
production of chemicals. Also, gasification technology, when used in an integrated
gasification combined cycle (IGCC) system, has higher thermal efficiency and lower
pollutant production compared to conventional power generation systems (Frey and
Rubin, 1992; Stiegel, 2000).
The work described here is a part of a larger project that will develop novel
assessment methodologies for evaluation of the risks and potential pay-offs of new
technologies that avoid pollutant production. The methodology will be demonstrated via
a detailed case study of one promising new pollution prevention technology – gasification
of MSW for the production of syngas to generate power and produce chemicals (e.g.,
methanol). The approach will utilize process simulation and optimization in ASPEN
PLUS to simulate the chosen technology. Life cycle analysis will then be applied leading
to the development of a life cycle inventory (LCI) of chemicals produced by MSW
gasification technology. A parallel LCI will also be developed to calculate the benefits of
chemical production via gasification relative to conventional production process.
This study deals with developing models for calculating the LCI of methanol
produced by a conventional method and the liquid phase methanol (LPMEOHTM)
process. The model for conventional production of methanol has been developed in MS
EXCEL and that of LPMEOH process has been developed in ASPEN PLUS in
conjunction with EXCEL. Since the LCI of methanol uses the LCI of steam and
electricity, they are also described.
3
While LCI of steam was developed in this project, the LCI of electricity was
directly used from the electric energy process model developed by Dumas (1998).
The following subsection presents the motivating questions of this study. An
overview of MSW management is presented next followed by the commercial status of
gasification systems and MSW gasification technology. Production of methanol is then
described. Information on LCI analysis and its need is presented next. Objectives of the
study are then presented.
1.1 Motivating Questions
In order to evaluate the risks and potential pay-offs of a new technology, the
LPMEOH process, there is a need to develop a systematic approach for its assessment.
The performance and emissions of the technology need to be characterized on a basis
such that comparison can be made with conventional methanol technology. The current
study deals with the development of models for calculating the LCI of methanol
production from LPMEOH and conventional process and has following motivating
questions:
1. What are the methanol production rates and the emissions from LPMEOH process
using the synthesis gas obtained from various sources (e.g. coal gasification, MSW
gasification)?
4
2. What are the emissions from the alternative conventional process of methanol
production for calculation of emission offsets?
3. What are the key design variables that affect the performance of LPMEOH process
and the LCI associated with it?
4. What is the sensitivity of LPMEOH process model and conventional process model
LCI to changes in key design variables?
5. How does the LCI of methanol obtained from LPMEOH process compare with that
obtained from conventional process?
6. What are the main issues/key parameters involved in combining the LPMEOH
process with an IGCC system for coproduction of methanol with power?
The following section presents an overview of MSW management.
1.2 Overview of MSW Management
Solid waste management may be defined as the discipline associated with the
control of generation, storage, collection, transfer and transport, processing, and disposal
of solid wastes in a manner that is in accord with the best principles of public health,
economics, engineering, conservation, aesthetics, and other environmental considerations
(Tchobanoglous, 1993). Ultimate disposal of solid waste is one of the most important
aspects of solid waste management. Historically, landfills have been the most economical
and environmentally acceptable method for the disposal of solid wastes, both in the U.S.
and throughout the world (Tchobanoglous, 1993).
5
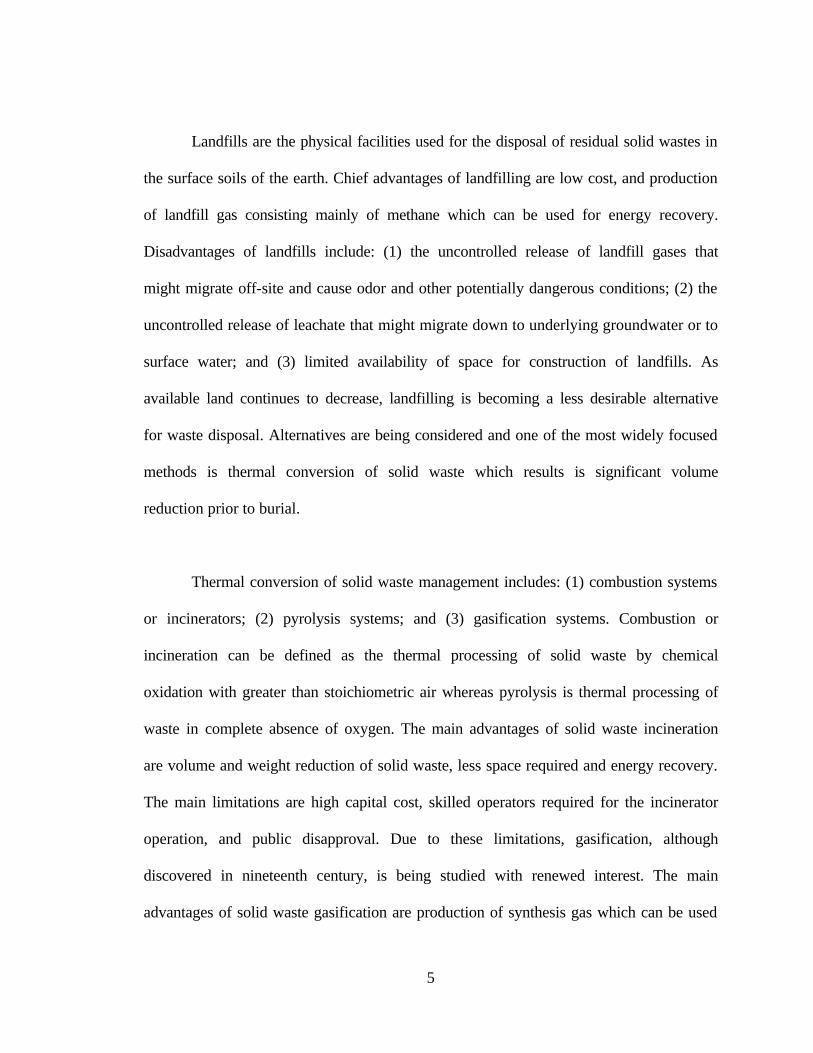
Landfills are the physical facilities used for the disposal of residual solid wastes in
the surface soils of the earth. Chief advantages of landfilling are low cost, and production
of landfill gas consisting mainly of methane which can be used for energy recovery.
Disadvantages of landfills include: (1) the uncontrolled release of landfill gases that
might migrate off-site and cause odor and other potentially dangerous conditions; (2) the
uncontrolled release of leachate that might migrate down to underlying groundwater or to
surface water; and (3) limited availability of space for construction of landfills. As
available land continues to decrease, landfilling is becoming a less desirable alternative
for waste disposal. Alternatives are being considered and one of the most widely focused
methods is thermal conversion of solid waste which results is significant volume
reduction prior to burial.
Thermal conversion of solid waste management includes: (1) combustion systems
or incinerators; (2) pyrolysis systems; and (3) gasification systems. Combustion or
incineration can be defined as the thermal processing of solid waste by chemical
oxidation with greater than stoichiometric air whereas pyrolysis is thermal processing of
waste in complete absence of oxygen. The main advantages of solid waste incineration
are volume and weight reduction of solid waste, less space required and energy recovery.
The main limitations are high capital cost, skilled operators required for the incinerator
operation, and public disapproval. Due to these limitations, gasification, although
discovered in nineteenth century, is being studied with renewed interest. The main
advantages of solid waste gasification are production of synthesis gas which can be used

6
for wide variety of applications and potential to achieve low air pollution emissions with
simplified air pollution control devices (Tchobanoglous, 1993). The following section
briefly describes gasification technology.
1.3 Gasification Systems and MSW Gasification Technology
Gasification is an energy efficient technique for reducing the volume of solid
waste and for recovery of energy. The process involves partial combustion of
carbonaceous fuel to generate a combustible gas rich in CO, H2, and some saturated
hydrocarbons, principally methane. The combustible fuel gas can then be combusted in
an internal combustion engine, gas turbine, or boiler under excess-air conditions. One
method of utilizing gasification to produce power is an integrated gasification combined
cycle (IGCC) system. Besides the production of electricity, a gasification plant can also
produce several chemicals such as methanol, hydrogen, ammonia, sulfuric acid,
formaldehyde, and others (Simbeck et al., 1983)
MSW gasification is a relatively new concept. There are several research projects
investigating the process. Various demonstration plants using solid waste gasification
technology include Thermoselect (Italy), ThermoChem (Ontario, CA), Proler (Houston,
TX), and Lurgi/Shwarze Pumpe (Dresden, Germany) (Niessen et al., 1996). The only
commercially demonstrated IGCC system fueled by solid waste is the Shwarze Pumpe
plant near Dresden, Germany. The Dresden plant processes wastes including plastics,
sewage sludge, rubber, auto waste, contaminated wood, residues of paint, household
7
waste and coal. The plant produces 120,000 tons per year of grade AA methanol (>99.85
percent purity by weight) and 75 MW electricity. The following section briefly describes
the production of methanol starting from synthesis gas.
1.4 Methanol Production
There are 18 methanol production plants in the United States with a total annual
capacity of over 2.6 billion gallons per year (American Methanol Institute, 1998).
Worldwide, over 90 methanol plants have the capacity to produce over 11 billion gallons
of methanol annually. The typical feedstock used in the production of methanol is natural
gas. Methanol also can be made from renewable resources such as wood, municipal solid
wastes and sewage. In either case the starting material is syngas. In syngas, CO, CO2 and
H2 react over a copper-based catalyst to produce methanol, which is then condensed and
finally refined in a distillation column.
Various methanol production technologies are available for production of
methanol from syngas. The most popular of these technologies are ICI low-pressure and
Lurgi low-pressure processes. Both these conventional technologies require the H2/CO
ratio near 2 to 2.1 for optimum methanol production. Most methanol plants built all over
the world use natural gas for generation of syngas to produce methanol (American
Methanol Institute, 1998; Cheng and Kung, 1994).

8
The current thrust in the methanol process industry is to produce methanol using a
syngas that is obtained from wastes i.e. MSW. The Lurgi Shwarze Pumpe plant described
in the previous section is one example, where methanol is being produced using syngas
obtained from solid waste. Syngas produced by dirty fuels such as coal and MSW is high
in CO content and requires a shift conversion to achieve an H2/CO ratio near two in order
for the conventional methanol plant to operate optimally (Cheng and Kung, 1994). A new
technology of methanol production, the liquid phase methanol (LPMEOH) process,
currently undergoing demonstration at Eastman Chemical Company, TN, is expected to
produce methanol from syngas richer in CO without having to perform a shift reaction.
This technology is therefore expected to perform well on the syngas produced by MSW
gasification. Other advantages of this process over conventional processes (ICI and
Lurgi) are described in Chapter 4.
The following section presents a brief description of the need to develop the LCI
of chemicals.
1.5 Life Cycle Inventory Analysis of Chemicals
Life cycle is defined as consecutive and interlinked stages of a system that extend
from raw material acquisition or generation of natural resources to final disposal. Life
cycle analysis involves compilation and evaluation, according to systematic procedure, of
the inputs and outputs of materials and energy and the associated environmental impacts
directly attributable to the function.

9
A complete life cycle study consists of three complementary components: (1)
inventory analysis, which is a compilation of all material and energy requirements
associated with each stage of product manufacture, use and disposal; (2) impact analysis,
a process in which the effects of the inventory on the environment are assessed; and (3)
improvement analysis, which is aimed at reducing the product impact on the environment
(Pistikopulos et al., 1994). LCI can be used in process analysis, material selection,
product evaluation, product comparison, and policy making.
1.6 Objectives
The objectives of the current work are:
1. To develop the models for calculating the LCI of methanol from LPMEOH
and conventional production technologies.
2. To perform the sensitivity analysis on models developed in (1) to understand
the key parameters affecting their performance and the LCI of methanol.
3. To compare the LCI of methanol produced by the LPMEOH and conventional
production technologies.
Chapter 2 presents the methodology for calculating the LCI of steam, which is
used in calculating the overall LCI of methanol production, both for the LPMEOH and
conventional processes. Chapter 3 presents the methodology for calculating the LCI of
electricity to be used in calculating the overall LCI of methanol production, both for the
LPMEOH and conventional process. Chapter 4 elaborates on various methods of
methanol production with their advantages and disadvantages. It also presents the
10
methodology to model LPMEOH process in ASPEN PLUS, the model results for the
base case and calculation of the LCI of methanol from the results. Chapter 5 describes the
development of an EXCEL spreadsheet to calculate mass and energy balances of a
conventional process of methanol production. The spreadsheet model also calculates the
LCI of methanol produced by a conventional process based on its mass and energy
balance. Chapter 6 presents the conclusions of this study.

11
2.0 LIFE CYCLE INVENTORY OF STEAM
The objective of this chapter is to present a methodology to calculate the life cycle
inventory (LCI) of steam. Steam is used in many process industries as a heating medium,
in the process itself or for the generation of electricity. Production of nearly all the
chemicals in a process industry requires the use of steam in some manner (Babcock and
Wilcox, 1972). Thus, in order to develop an overall LCI of a particular chemical, the LCI
of steam is typically required as a key component. The methodology described in this
section considers emissions that result from fuel combustion in a boiler for the generation
of steam. Pre-combustion emissions associated with fuel production such as surface and
underground mining, transportation, fugitive emissions and others are also included.
Emission factors are calculated for particulate matter (PM), SO2, NOx, CO, hydrocarbons
(HC), CH4, HCl, VOCs and trace metals. Water emissions and solid waste generation as a
result of boiler feed water pretreatment and use of materials in air pollution control
equipment are also considered. Emission factors are calculated in units of kg pollutant
per MJ of steam produced and lb pollutant per million Btu (MMBtu) of steam produced.
The next section presents background information on steam and its generation in
boilers, followed by Section 2.2, which presents the design basis for developing the LCI
of steam and key assumptions, made therein. The methodology used to calculate the LCI
parameters is then described in Section 2.3. Finally, the values of LCI parameters
associated with generation of steam based on design assumptions are presented in Section
2.3.8.
12
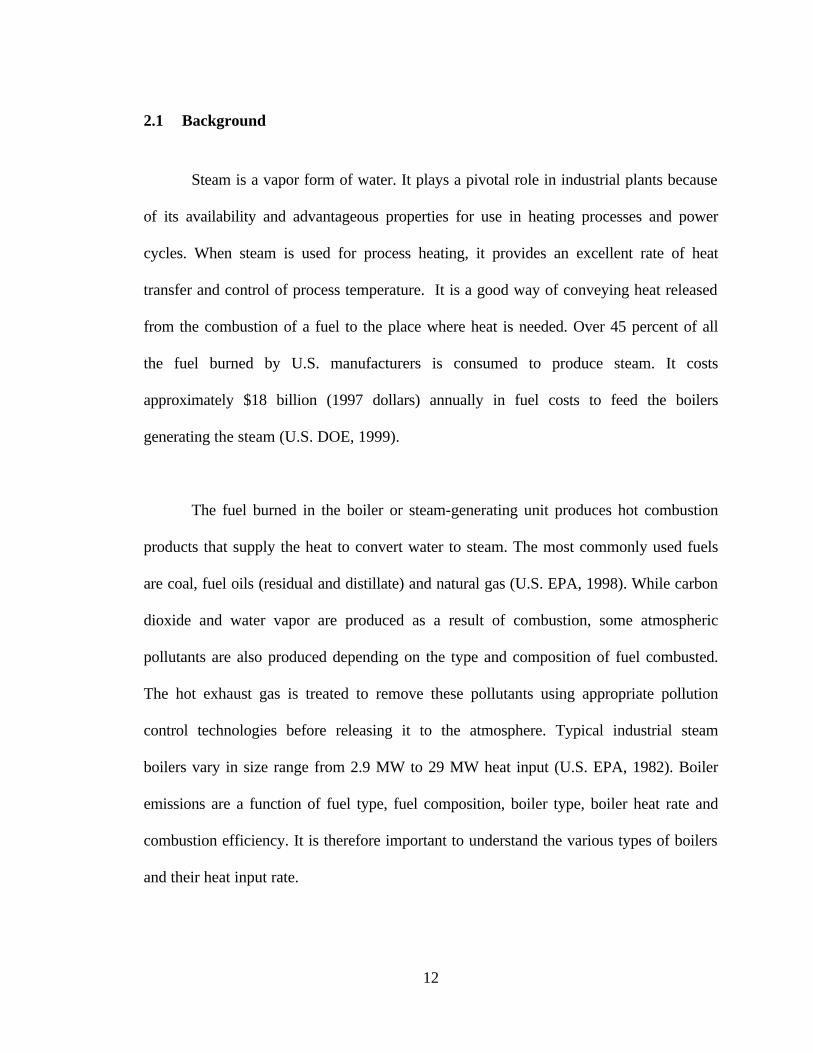
2.1 Background
Steam is a vapor form of water. It plays a pivotal role in industrial plants because
of its availability and advantageous properties for use in heating processes and power
cycles. When steam is used for process heating, it provides an excellent rate of heat
transfer and control of process temperature. It is a good way of conveying heat released
from the combustion of a fuel to the place where heat is needed. Over 45 percent of all
the fuel burned by U.S. manufacturers is consumed to produce steam. It costs
approximately $18 billion (1997 dollars) annually in fuel costs to feed the boilers
generating the steam (U.S. DOE, 1999).
The fuel burned in the boiler or steam-generating unit produces hot combustion
products that supply the heat to convert water to steam. The most commonly used fuels
are coal, fuel oils (residual and distillate) and natural gas (U.S. EPA, 1998). While carbon
dioxide and water vapor are produced as a result of combustion, some atmospheric
pollutants are also produced depending on the type and composition of fuel combusted.
The hot exhaust gas is treated to remove these pollutants using appropriate pollution
control technologies before releasing it to the atmosphere. Typical industrial steam
boilers vary in size range from 2.9 MW to 29 MW heat input (U.S. EPA, 1982). Boiler
emissions are a function of fuel type, fuel composition, boiler type, boiler heat rate and
combustion efficiency. It is therefore important to understand the various types of boilers
and their heat input rate.

13
Boilers can be classified by type, fuel, and method of construction. Boiler types
are identified by heat transfer method (watertube, firetube, or cast iron), the arrangement
of heat transfer surfaces (horizontal, vertical, straight or bent tube), and in the case of
coal, the fuel feed system (pulverized or stoker). The major distinguishing characteristic
of a boiler is its heat transfer mechanism. Based on this classification, boilers can be
divided into 3 major groups (U.S. EPA, 1982): (1) watertube boilers; (2) firetube boilers;
and (3) cast iron boilers. Each is described in the following sections.
(1) Watertube boilers: Watertube boilers are used in a variety of applications ranging
from supplying large amounts of process steam to providing space heat for
industrial facilities. In these types of boilers, water passes through the inside of
heat transfer tubes while the outside of the tube is heated by direct contact with
hot combustion gases. This process results in generation of high pressure, high
temperature steam. Watertube boilers are available, as packaged or field-erected
units, in capacities ranging from less than 2.9 MW to over 200 MW (10 x 106
Btu/hr to 700 x 106 Btu/h) thermal input. Industrial watertube boilers can burn
coal, residual oil, distillate oil, natural gas, liquefied petroleum gas and other
fossil and nonfossil fuels.
(2) Firetube boilers: Firetube boilers are used primarily for heating systems, industrial
process steam, and portable power boilers. Essentially all firetube boilers are
packaged units with some being portable rather than stationary. In these types of
boilers, the hot gas flows through the tubes and the water being heated circulates
14
outside of the tubes. Firetube boilers are usually limited in size to less than 5.9
MW (20 x 106 Btu/h) thermal input. Most of the installed capacity of firetube
units is oil- and gas-fired.
(3) Cast Iron boilers: In cast iron boilers, the hot gas is contained inside the tubes and
the water being heated circulates outside the tubes. The units are constructed of
cast iron rather than steel. Cast iron boilers are used to produce either low-
pressure steam or hot water. Generally, boiler capacity ranges from 0.001 MW to
2.9 MW (0.003 x 10⁶ Btu/h to 10 x 106 Btu/h) thermal input with pressure ratings
up to 690 kPa (100 psi) for hot water units and 100 kPa (15 psi) for steam units.
Thus, cast iron boilers are most commonly used in domestic or small commercial
application.
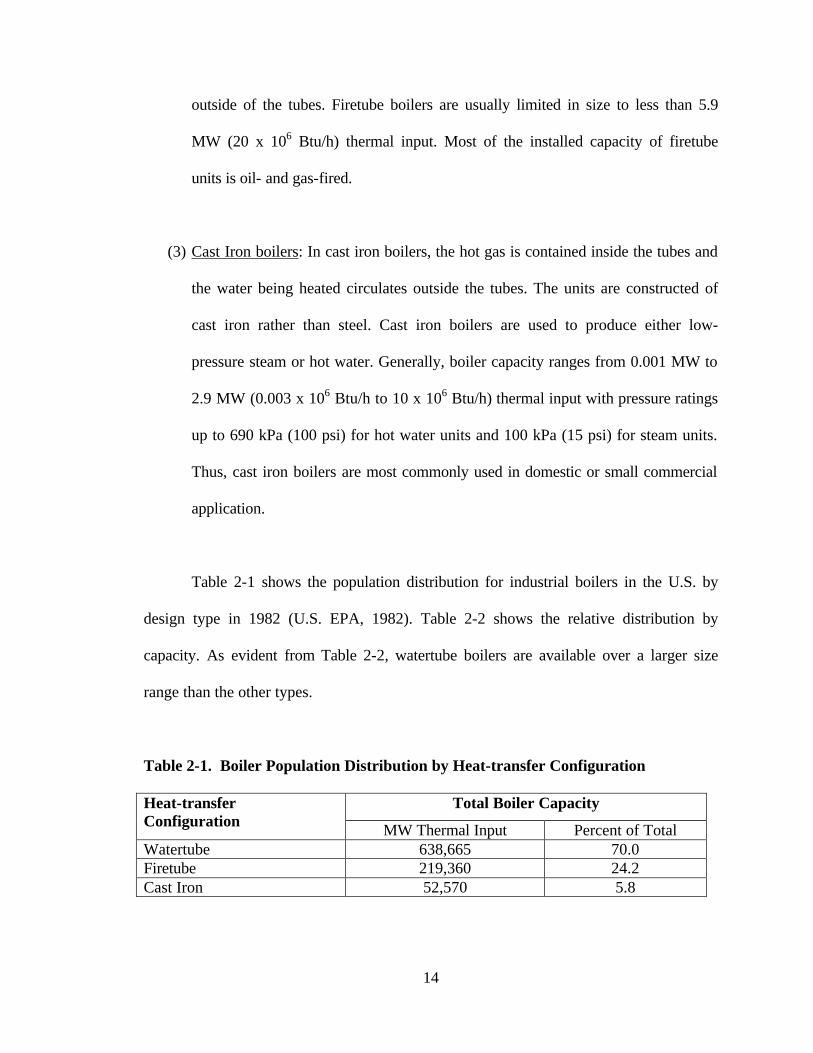
Table 2-1 shows the population distribution for industrial boilers in the U.S. by
design type in 1982 (U.S. EPA, 1982). Table 2-2 shows the relative distribution by
capacity. As evident from Table 2-2, watertube boilers are available over a larger size
range than the other types.
Table 2-1. Boiler Population Distribution by Heat-transfer Configuration
Total Boiler Capacity Heat-transfer Configuration
MW Thermal Input Percent of Total Watertube 638,665 70.0 Firetube 219,360 24.2 Cast Iron 52,570 5.8
15
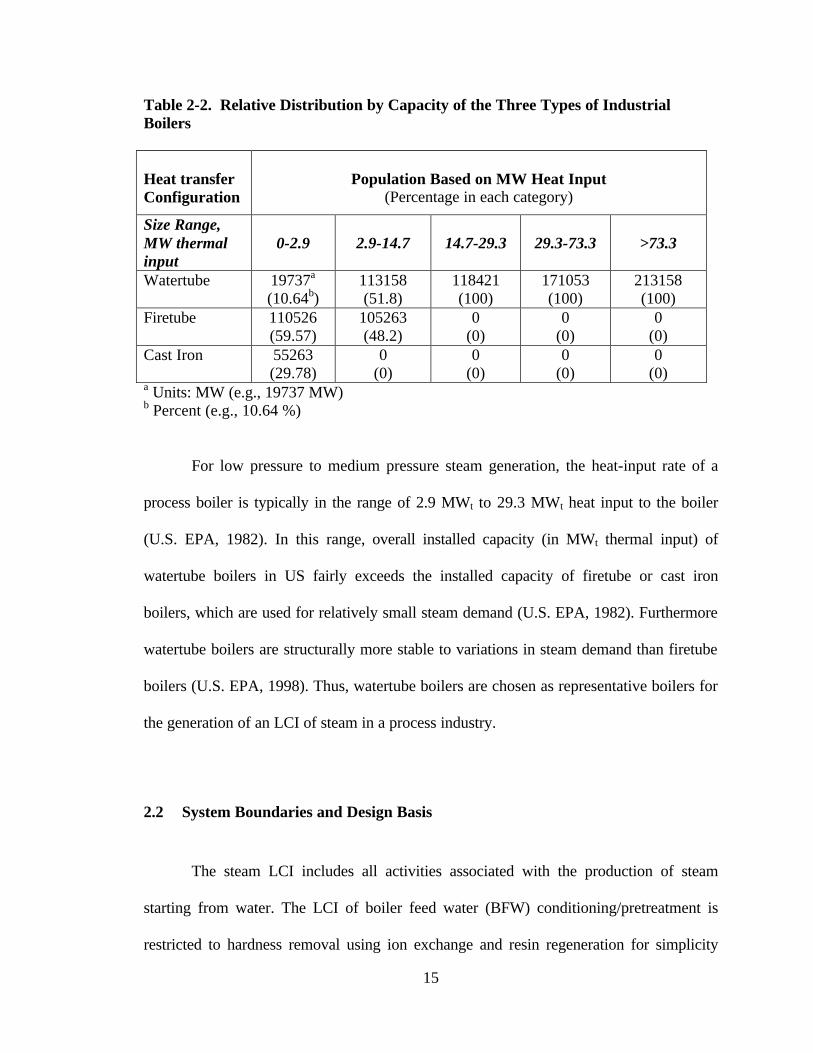
Table 2-2. Relative Distribution by Capacity of the Three Types of Industrial Boilers Heat transfer Configuration
Population Based on MW Heat Input
(Percentage in each category)
Size Range, MW thermal input
0-2.9
2.9-14.7
14.7-29.3
29.3-73.3
>73.3
Watertube 19737a (10.64b)
113158 (51.8)
118421 (100)
171053 (100)
213158 (100)
Firetube 110526 (59.57)
105263 (48.2)
0 (0)
0 (0)
0 (0)
Cast Iron 55263 (29.78)
0 (0)
0 (0)
0 (0)
0 (0)
a Units: MW (e.g., 19737 MW) b Percent (e.g., 10.64 %)
For low pressure to medium pressure steam generation, the heat-input rate of a
process boiler is typically in the range of 2.9 MWt to 29.3 MWt heat input to the boiler
(U.S. EPA, 1982). In this range, overall installed capacity (in MWt thermal input) of
watertube boilers in US fairly exceeds the installed capacity of firetube or cast iron
boilers, which are used for relatively small steam demand (U.S. EPA, 1982). Furthermore
watertube boilers are structurally more stable to variations in steam demand than firetube
boilers (U.S. EPA, 1998). Thus, watertube boilers are chosen as representative boilers for
the generation of an LCI of steam in a process industry.
2.2 System Boundaries and Design Basis
The steam LCI includes all activities associated with the production of steam
starting from water. The LCI of boiler feed water (BFW) conditioning/pretreatment is
restricted to hardness removal using ion exchange and resin regeneration for simplicity
16
(Gonzalez and Overcash, 1999). LCI parameters associated with removal of other trace
impurities and contaminants from BFW are insignificant, and are not considered
(Gonzalez and Overcash, 1999).
One Mega-joule (MJ) of steam produced has been used as a basis for the
calculation of LCI parameters. It is assumed that saturated steam at 100 psia is generated
from water entering the boiler at 50oC. Raw water is typically available at 20 oC. During
BFW treatment, the raw water is heated to 50 oC for the removal of dissolved gases to
avoid boiler corrosion (Nunn, 1997). The energy used in raising a kg of water from 20 oC
to 50 oC is less than five percent of the energy carried by a kg of 100-psia saturated steam
produced, therefore, the energy associated with BFW treatment is neglected.
The amount of saturated steam generated at 100-psia is calculated to be 0.392 kg
for 1 MJ steam demand using Equation (2-1).
)( lv
SteamSteam hh
Hm
−∆
= (2-1)
where: mSteam = Mass of steam produced (kg)
∆HSteam = Enthalpy associated with steam (= 1 MJ).
hv = Enthalpy per kg of 100 psia steam (= 2.76 MJ/kg).
hl = Enthalpy per kg of 50 oC BFW (= 0.209 MJ/kg)
Amount of steam generated is determined to calculate the LCI associated with
BFW treatment. It will be demonstrated later that the LCI associated with BFW is quite
small and therefore as the flowrate of steam changes for the same total enthalpy due to

17
changing pressure, there is almost no effect on the overall LCI of steam. Thus only the
enthalpy associated with steam is required to determine the LCI associated with steam
use in a process.
The emissions from a fuel-fired boiler depend on fuel type, fuel composition,
boiler type, boiler heat rate, and combustion efficiency. As explained in the previous
section, a watertube boiler was selected as a model boiler for the development of an LCI
for steam.
Watertube boilers in the 2.9 MWt to 29.3 MWt heat-input category can be further
subdivided based on the fuel type used. Table 2-3 shows various categories, based on fuel
type, of watertube boilers and their installed capacity in the U.S (U.S. EPA, 1982). Only
coal, fuel oil (distillate and residual) and natural gas are considered here since they are
the only fuels used in the industrial steam boilers. Table 2-4 shows typical ultimate
analyses and heating values of coal, residual oil, distillate oil and natural gas used in
developing combustion emission factors (Pechtl and Chen, 1992; Perry, 1997; U.S. EPA,
1982). Pre-combustion emissions for coal, distillate oil, residual oil and natural gas have
been calculated for 1 MJ of steam production from the emission factors (given in per
1000 units of fuel basis) in an electric energy process model developed by Dumas (1998).
Pre-combustion emissions are presented in Table 2-6.
18
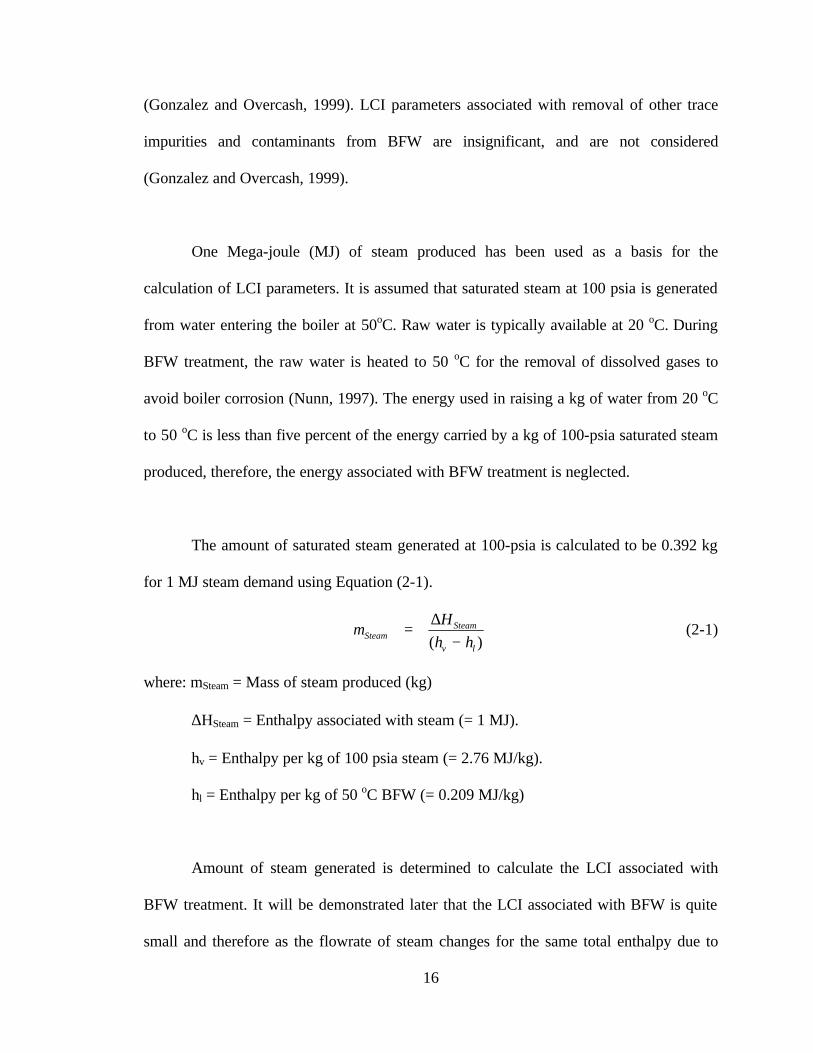
Table 2-3. Percentage of Installed Capacity of Various Fuel Type Watertube Boilers in 2.9 MWt to 29.3 MWt Heat-input Category (U.S. EPA, 1982) Fuel Type Percentage of Watertube Boilers
Pulverized coal 0 Spreader-stoker coal 4.2 Underfeed-stoker coal 12.16
COAL
Overfeed-stoker coal 3.07 Residual Oil 32.49 OIL Distillate Oil 4.87
NATURAL GAS 43.21 Total 100.00
Table 2-4. Ultimate Analysis and Heating Values of Fuels Used in Developing the Emission Factors (Pechtl and Chen, 1992; Perry, 1997; U.S. EPA, 1982) Fuel Coal
(Bituminous) Distillate Oil
(No. 2) Residual Oil
(No.6, Low sulfur) Natural
Gas Element Wt% Wt% Wt% Wt% C 73.21 87.3 87.26 69.28 H 4.94 12.6 10.49 22.67 N 1.38 0.006 0.28 8.05 O 4.85 0.04 0.64 Trace S 3.3 0.22 0.84 Trace Ash 12.23 Trace 0.04 0 Cl 0.09 - - - Heating Value
12350 Btu/lb
19500 Btu/lb
18500 Btu/lb
1020 Btu/ft3
Steam produced is distributed among watertube boilers based on the percentage of
their installed capacity as in Table 2-3. Thus, steam with total enthalpy of 1 MJ would be
divided as 0.4321 MJ being produced by natural gas fired, 0.0487 MJ being produced by
distillate oil fired, 0.3249 MJ being produced by residual oil fired, 0.0307 MJ being
produced by overfeed stoker coal fired, 0.1216 MJ being produced by underfeed stoker
coal fired, and 0.042 MJ being produced by spreader stoker coal fired watertube boilers.
19
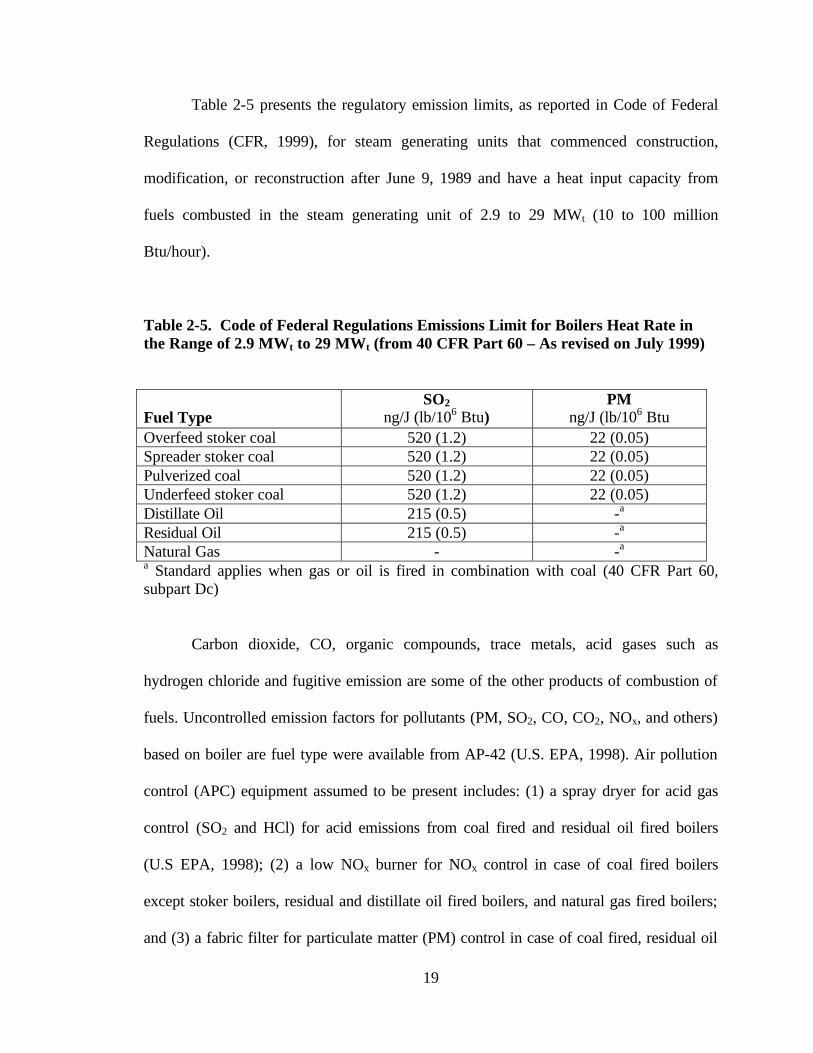
Table 2-5 presents the regulatory emission limits, as reported in Code of Federal
Regulations (CFR, 1999), for steam generating units that commenced construction,
modification, or reconstruction after June 9, 1989 and have a heat input capacity from
fuels combusted in the steam generating unit of 2.9 to 29 MWt (10 to 100 million
Btu/hour).
Table 2-5. Code of Federal Regulations Emissions Limit for Boilers Heat Rate in the Range of 2.9 MWt to 29 MWt (from 40 CFR Part 60 – As revised on July 1999)
Fuel Type
SO2
ng/J (lb/106 Btu) PM
ng/J (lb/106 Btu Overfeed stoker coal 520 (1.2) 22 (0.05) Spreader stoker coal 520 (1.2) 22 (0.05) Pulverized coal 520 (1.2) 22 (0.05) Underfeed stoker coal 520 (1.2) 22 (0.05) Distillate Oil 215 (0.5) -a Residual Oil 215 (0.5) -a Natural Gas - -a a Standard applies when gas or oil is fired in combination with coal (40 CFR Part 60, subpart Dc)
Carbon dioxide, CO, organic compounds, trace metals, acid gases such as
hydrogen chloride and fugitive emission are some of the other products of combustion of
fuels. Uncontrolled emission factors for pollutants (PM, SO2, CO, CO2, NOx, and others)
based on boiler are fuel type were available from AP-42 (U.S. EPA, 1998). Air pollution
control (APC) equipment assumed to be present includes: (1) a spray dryer for acid gas
control (SO2 and HCl) for acid emissions from coal fired and residual oil fired boilers
(U.S EPA, 1998); (2) a low NOx burner for NOx control in case of coal fired boilers
except stoker boilers, residual and distillate oil fired boilers, and natural gas fired boilers;
and (3) a fabric filter for particulate matter (PM) control in case of coal fired, residual oil
20
fired and distillate oil fired boilers. NOx control technology used for stoker coal fired
boilers is low excess air (LEA) technology. Spray dryer is used for the removal of acid
gases generated by low and medium sulfur fuels fired in steam generating industrial
boilers (U.S. EPA, 1998). Typical control efficiency of SO2 in a spray dryer ranges from
70 to 90 percent. A low NOx burner is a combustion modification technique commonly
used for controlling the NOx emissions in steam generating boilers. Low NOx burner has
a NOx reduction potential ranging from 35 to 55 percent. LEA technology typically has
NOx reduction potential of 25 percent for coal fired stoker boilers (U.S. EPA, 1998).
Fabric filters are commonly used for the removal of PM with a typical removal efficiency
ranging from 99 to 99.9 percent. After APC, the flue gas is released to the atmosphere.
The LCI parameters considered includes gaseous and liquid releases as well as
solid waste. Although it is assumed that there are no water releases or solid waste
production other than ash, these parameters are included because such releases are
associated with the fuel pre-combustion emissions, LCI of BFW pretreatment and that of
materials consumed in APC equipment.
For LCI of BFW conditioning, ionic exchange pretreatment is considered. A total
hardness of 100 mg Ca2+/liter and 155 mg Mg2+/ liter was assumed to be present in the
water to be pretreated (Gonzalez and Overcash, 1999).
21
One hundred percent hardness removal efficiency is assumed in calculations. The
regenerant for the ion exchange resin is sodium chloride.
2.3 Calculation of the LCI of Steam
The LCI of steam considers the emission associated with generation of steam
from various boilers based on fuel types, pre-combustion emissions associated with fuels,
the LCI of sodium chloride used in BFW pretreatment, and the LCI of lime used in spray
drying for the removal of acid gases. The overall LCI parameters considered include PM,
PM-10, SO2, SO3, NOx, CO, CO2, CH4, HCl, VOCs, hydrocarbons, NH3, 12 metals,
liquid emissions and solid waste. The methodology used to calculate and allocate
emissions is described in this section.
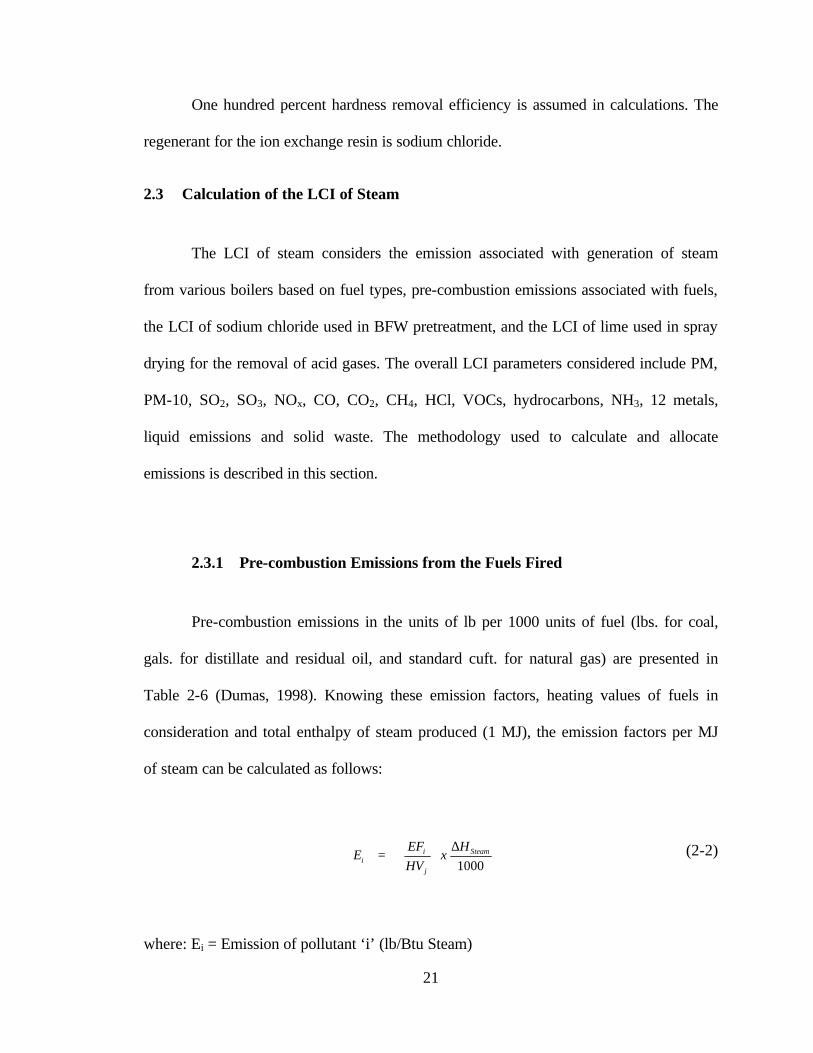
2.3.1 Pre-combustion Emissions from the Fuels Fired
Pre-combustion emissions in the units of lb per 1000 units of fuel (lbs. for coal,
gals. for distillate and residual oil, and standard cuft. for natural gas) are presented in
Table 2-6 (Dumas, 1998). Knowing these emission factors, heating values of fuels in
consideration and total enthalpy of steam produced (1 MJ), the emission factors per MJ
of steam can be calculated as follows:
1000Steam
j
ii
Hx
HV
EFE
∆
= (2-2)
where: Ei = Emission of pollutant ‘i’ (lb/Btu Steam)
22
EFi = Emission factor of pollutant ‘i’ (lb/1000 fuel units)
HVj = Heating value of the fuel (Btu/fuel unit)
Fuel unit = lb for coal, gal for residual and distillate oil, and standard. cuft. for
natural gas
∆HSteam = 1 MJ (in Btu’s)
The emission (Ei) calculated in above equation can be then converted to kg
emissions per MJ steam produced. Table 2-7 presents the calculated pre-combustion
emissions in kg per MJ of steam.
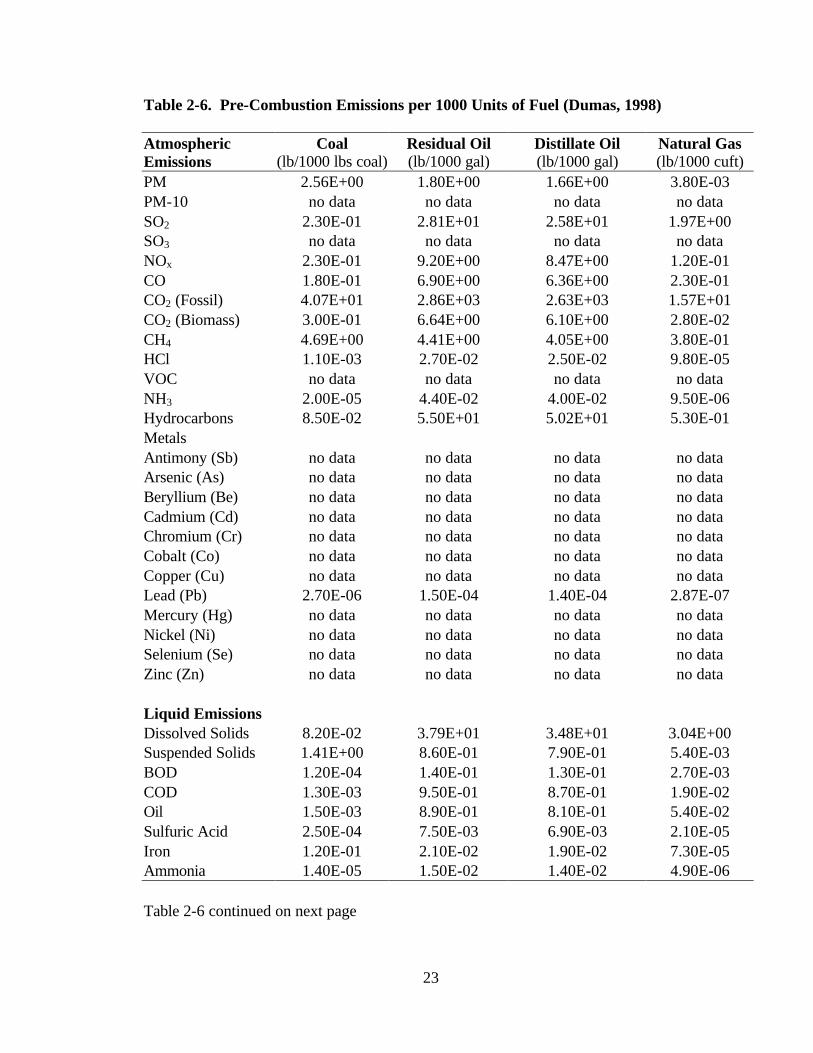
23
Table 2-6. Pre-Combustion Emissions per 1000 Units of Fuel (Dumas, 1998) Atmospheric Emissions
Coal (lb/1000 lbs coal)
Residual Oil (lb/1000 gal)
Distillate Oil (lb/1000 gal)
Natural Gas (lb/1000 cuft)
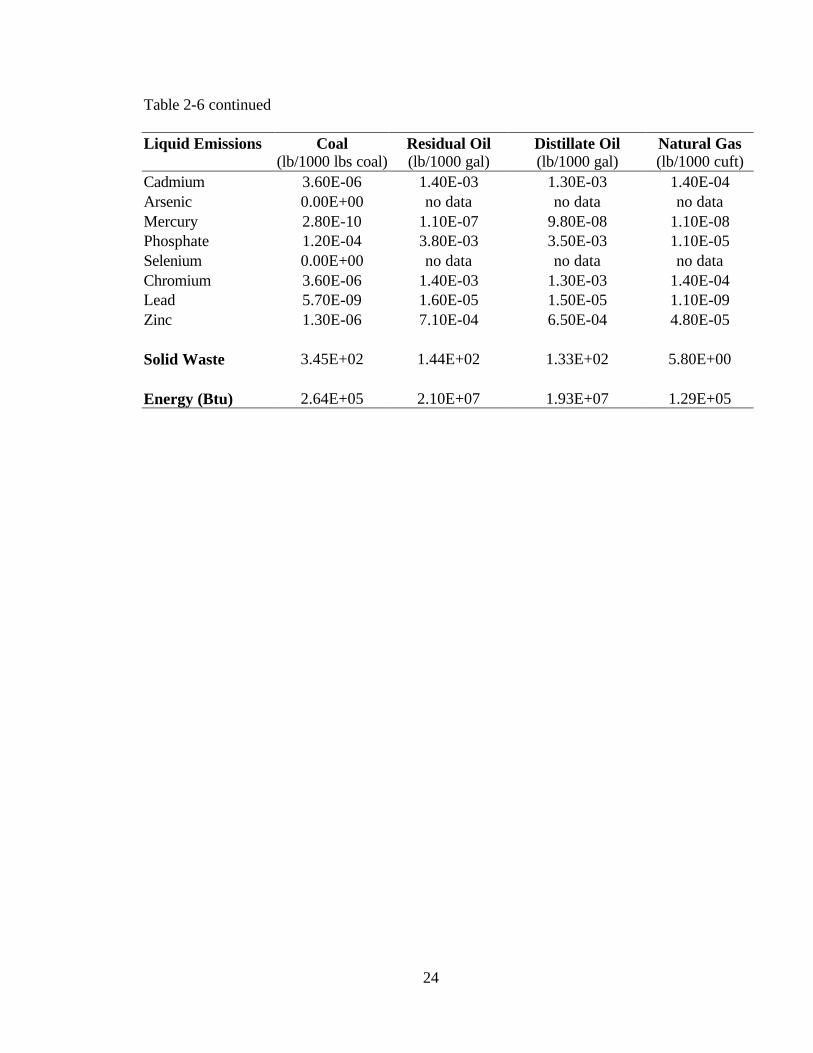
PM 2.56E+00 1.80E+00 1.66E+00 3.80E-03 PM-10 no data no data no data no data SO2 2.30E-01 2.81E+01 2.58E+01 1.97E+00 SO3 no data no data no data no data NOx 2.30E-01 9.20E+00 8.47E+00 1.20E-01 CO 1.80E-01 6.90E+00 6.36E+00 2.30E-01 CO2 (Fossil) 4.07E+01 2.86E+03 2.63E+03 1.57E+01 CO2 (Biomass) 3.00E-01 6.64E+00 6.10E+00 2.80E-02 CH4 4.69E+00 4.41E+00 4.05E+00 3.80E-01 HCl 1.10E-03 2.70E-02 2.50E-02 9.80E-05 VOC no data no data no data no data NH3 2.00E-05 4.40E-02 4.00E-02 9.50E-06 Hydrocarbons 8.50E-02 5.50E+01 5.02E+01 5.30E-01 Metals Antimony (Sb) no data no data no data no data Arsenic (As) no data no data no data no data Beryllium (Be) no data no data no data no data Cadmium (Cd) no data no data no data no data Chromium (Cr) no data no data no data no data Cobalt (Co) no data no data no data no data Copper (Cu) no data no data no data no data Lead (Pb) 2.70E-06 1.50E-04 1.40E-04 2.87E-07 Mercury (Hg) no data no data no data no data Nickel (Ni) no data no data no data no data Selenium (Se) no data no data no data no data Zinc (Zn) no data no data no data no data Liquid Emissions Dissolved Solids 8.20E-02 3.79E+01 3.48E+01 3.04E+00 Suspended Solids 1.41E+00 8.60E-01 7.90E-01 5.40E-03 BOD 1.20E-04 1.40E-01 1.30E-01 2.70E-03 COD 1.30E-03 9.50E-01 8.70E-01 1.90E-02 Oil 1.50E-03 8.90E-01 8.10E-01 5.40E-02 Sulfuric Acid 2.50E-04 7.50E-03 6.90E-03 2.10E-05 Iron 1.20E-01 2.10E-02 1.90E-02 7.30E-05 Ammonia 1.40E-05 1.50E-02 1.40E-02 4.90E-06 Table 2-6 continued on next page
24
Table 2-6 continued
Liquid Emissions Coal (lb/1000 lbs coal)
Residual Oil (lb/1000 gal)
Distillate Oil (lb/1000 gal)
Natural Gas (lb/1000 cuft)
Cadmium 3.60E-06 1.40E-03 1.30E-03 1.40E-04 Arsenic 0.00E+00 no data no data no data Mercury 2.80E-10 1.10E-07 9.80E-08 1.10E-08 Phosphate 1.20E-04 3.80E-03 3.50E-03 1.10E-05 Selenium 0.00E+00 no data no data no data Chromium 3.60E-06 1.40E-03 1.30E-03 1.40E-04 Lead 5.70E-09 1.60E-05 1.50E-05 1.10E-09 Zinc 1.30E-06 7.10E-04 6.50E-04 4.80E-05 Solid Waste 3.45E+02 1.44E+02 1.33E+02 5.80E+00 Energy (Btu) 2.64E+05 2.10E+07 1.93E+07 1.29E+05

25
Table 2-7. Pre-Combustion Emissions for 1 MJ of Steam Produceda
Atmospheric Emissions
Coal (kg/MJ Steam)
Distillate Oil (kg/MJ Steam)
Residual Oil (kg/MJ Steam)
Natural Gas (kg/MJ Steam)
Total (kg/MJ Steam)
PM 2.17E-05 3.19E-07 2.00E-06 8.66E-07 2.48E-05 PM-10 no data no data no data no data SO2 1.95E-06 4.95E-06 3.12E-05 4.49E-04 4.87E-04 SO3 no data no data no data no data NOx 1.95E-06 1.63E-06 1.02E-05 2.73E-05 4.11E-05 CO 1.52E-06 1.22E-06 7.67E-06 5.24E-05 6.28E-05 CO2 (Fossil) 3.44E-04 5.05E-04 3.18E-03 3.58E-03 7.61E-03 CO2 (Biomass) 2.54E-06 1.17E-06 7.38E-06 6.38E-06 1.75E-05 CH4 3.97E-05 7.78E-07 4.90E-06 8.66E-05 1.32E-04 HCl 9.31E-09 4.80E-09 3.00E-08 2.23E-08 6.64E-08 VOC no data no data no data no data NH3 1.69E-10 7.68E-09 4.89E-08 2.16E-09 5.89E-08 Hydrocarbons 7.19E-07 9.64E-06 6.11E-05 1.21E-04 1.92E-04 Metals Antimony (Sb) no data no data no data no data Arsenic (As) no data no data no data no data Beryllium (Be) no data no data no data no data Cadmium (Cd) no data no data no data no data Chromium(Cr) no data no data no data no data Cobalt (Co) no data no data no data no data Copper (Cu) no data no data no data no data Lead (Pb) 2.28E-11 2.69E-11 1.67E-10 6.54E-11 2.82E-10 Mercury (Hg) no data no data no data no data Nickel (Ni) no data no data no data no data Selenium (Se) no data no data no data no data Zinc (Zn) no data no data no data no data Liquid Emissions
Dissolved Solids
6.94E-07 6.68E-06 4.21E-05 6.93E-04 7.42E-04
Suspended Solids
1.19E-05 1.52E-07 9.56E-07 1.23E-06 1.43E-05
BOD 1.02E-09 2.50E-08 1.56E-07 6.15E-07 7.97E-07 COD 1.10E-08 1.67E-07 1.06E-06 4.33E-06 5.56E-06 Oil 1.27E-08 1.56E-07 9.89E-07 1.23E-05 1.35E-05 Sulfuric Acid 2.12E-09 1.33E-09 8.34E-09 4.78E-09 1.66E-08 Iron 1.02E-06 3.65E-09 2.33E-08 1.66E-08 1.06E-06 Ammonia 1.18E-10 2.69E-09 1.67E-08 1.12E-09 2.06E-08 Copper 0.00E+00 0.00E+00 0.00E+00 0.00E+00 0.00E+00 Table 2-7 continued on next page
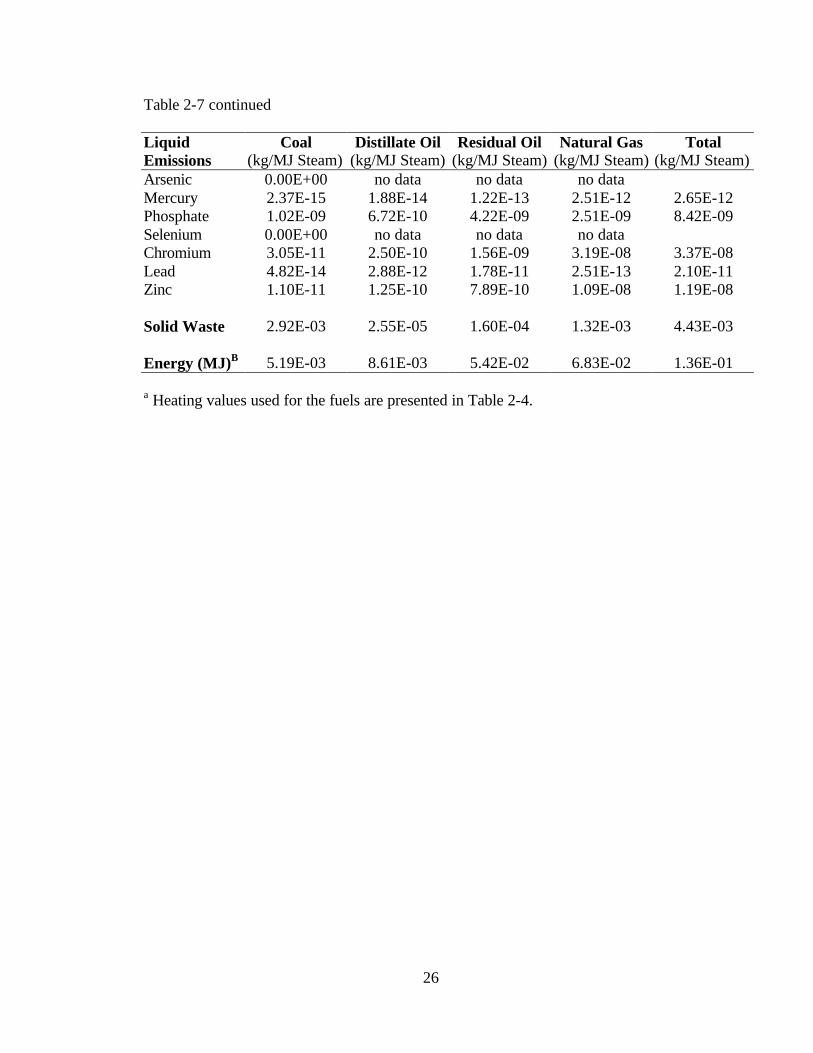
26
Table 2-7 continued
Liquid Emissions
Coal (kg/MJ Steam)
Distillate Oil (kg/MJ Steam)
Residual Oil (kg/MJ Steam)
Natural Gas (kg/MJ Steam)
Total (kg/MJ Steam)
Arsenic 0.00E+00 no data no data no data Mercury 2.37E-15 1.88E-14 1.22E-13 2.51E-12 2.65E-12 Phosphate 1.02E-09 6.72E-10 4.22E-09 2.51E-09 8.42E-09 Selenium 0.00E+00 no data no data no data Chromium 3.05E-11 2.50E-10 1.56E-09 3.19E-08 3.37E-08 Lead 4.82E-14 2.88E-12 1.78E-11 2.51E-13 2.10E-11 Zinc 1.10E-11 1.25E-10 7.89E-10 1.09E-08 1.19E-08 Solid Waste 2.92E-03 2.55E-05 1.60E-04 1.32E-03 4.43E-03 Energy (MJ)B 5.19E-03 8.61E-03 5.42E-02 6.83E-02 1.36E-01
a Heating values used for the fuels are presented in Table 2-4.
27
2.3.2 Combustion of Coal to Generate Steam
This section presents the emission factors of various pollutants associated with the
combustion of coal for the generation of steam in various types of boilers. Four types of
coal fired boilers, namely pulverized coal wall fired (dry bottom), spreader stoker,
overfeed stoker and underfeed stoker boilers are considered. The boilers are assumed to
fire bituminous coal (Bituminous high volatile – A), which is mainly used for the
generation of steam in industrial boilers (U.S. EPA, 1998). A typical ultimate analysis of
Bituminous coal is presented in Table 2-4. Thermal efficiency of these boilers is assumed
to be 80 percent, which is typical of coal fired boilers (U.S. EPA, 1982). AP-42 lists the
uncontrolled emission factors of PM, SO2, CO, NOx, CO2, CH4 and HCl in the units of lb
per ton of coal combusted for various boiler configurations firing bituminous coal. It also
lists the controlled emissions for 12 metals.
The spray dryer used in case of all coal fired boilers is assumed to operate with 90
percent SO2 removal efficiency as required by the Code of Federal Regulations (40 CFR
Part 60 subsection Dc, July 1999). A low NOx burner is assumed to have a NOx control
efficiency of 50 percent for all coal fired boilers except the coal fired stoker boiler (U.S.
EPA, 1998). LEA technology used for coal fired stoker boilers is assumed to have NOx
control efficiency of 25 percent (U.S. EPA, 1998). A fabric filter with 99 percent PM
removal efficiency is assumed for all coal fired boilers, as is typical of bag filters (U.S.
EPA, 1998).
28
Emission control factors are applied to uncontrolled SO2, NOx, and PM emission
factors. Emission control factors, defined by Equation (2-3), are the factors based on
control efficiency of APC by which uncontrolled emission factors are multiplied to get
controlled emission factors.
−=
1001 i
iECFη
(2-3)
where: ECFi = Emission control factor
ηi = Control Efficiency of APC equipment (e.g., 90 percent removal for SO2)
i. = Pollutant (e.g., SO2, NOx, etc.)
Metal emissions are controlled emissions as reported in AP-42 so they are
presented as such. CO and CH4 emissions are quite low and therefore no control factor is
applied to them. Table 2-8 presents the emission factors of various pollutants after APC
for all four kinds of boilers firing bituminous coal. The emission factors are reported in
lb/MMBtu heat input. It is assumed that no liquid emissions are generated. Bottom ash
and fly ash generated occur as a solid waste. Roughly, 80 percent of ash content of coal
occurs as fly ash and 20 percent as bottom ash (Frey, 2000). For LCI purposes, no
differentiation is made between bottom ash and fly ash (Harrison et al., 1999.). Ninety
nine percent of total fly ash (80 percent of total ash content) was assumed to be collected
as PM in APC. The collected PM was added to bottom ash (20 percent of total ash
content) to calculate the solid waste generated.
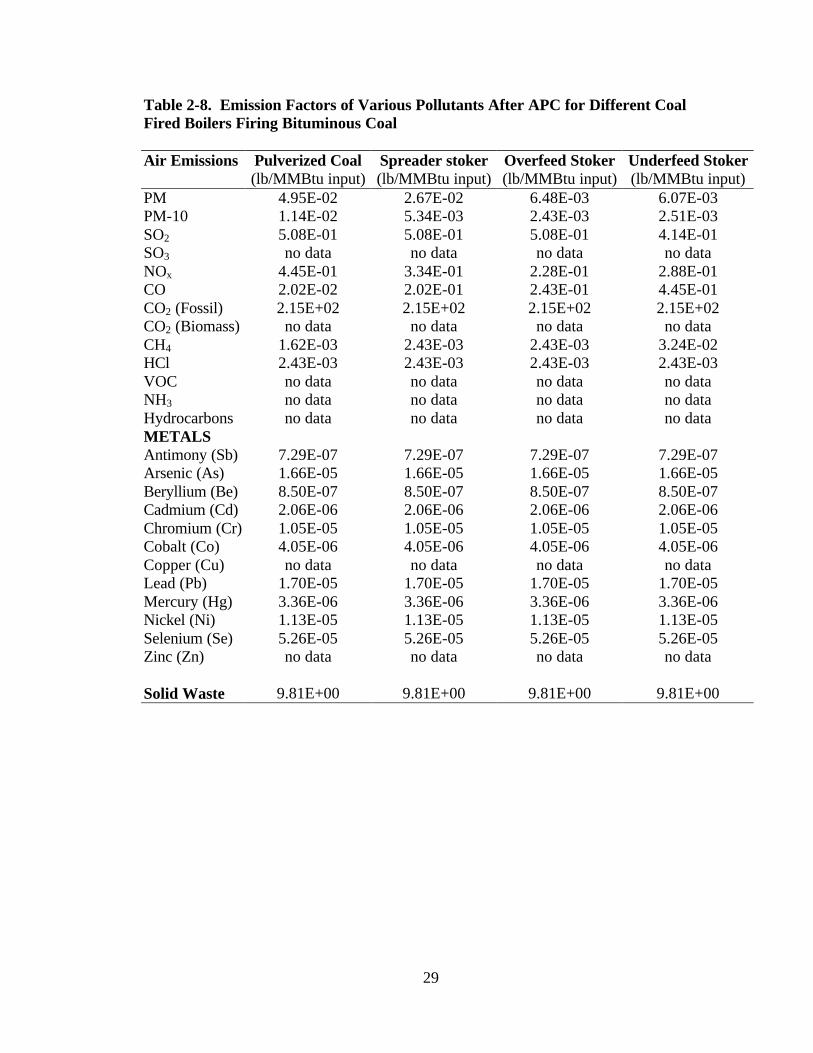
29
Table 2-8. Emission Factors of Various Pollutants After APC for Different Coal Fired Boilers Firing Bituminous Coal Air Emissions Pulverized Coal
(lb/MMBtu input) Spreader stoker (lb/MMBtu input)
Overfeed Stoker (lb/MMBtu input)
Underfeed Stoker (lb/MMBtu input)
PM 4.95E-02 2.67E-02 6.48E-03 6.07E-03 PM-10 1.14E-02 5.34E-03 2.43E-03 2.51E-03 SO2 5.08E-01 5.08E-01 5.08E-01 4.14E-01 SO3 no data no data no data no data NOx 4.45E-01 3.34E-01 2.28E-01 2.88E-01 CO 2.02E-02 2.02E-01 2.43E-01 4.45E-01 CO2 (Fossil) 2.15E+02 2.15E+02 2.15E+02 2.15E+02 CO2 (Biomass) no data no data no data no data CH4 1.62E-03 2.43E-03 2.43E-03 3.24E-02 HCl 2.43E-03 2.43E-03 2.43E-03 2.43E-03 VOC no data no data no data no data NH3 no data no data no data no data Hydrocarbons no data no data no data no data METALS Antimony (Sb) 7.29E-07 7.29E-07 7.29E-07 7.29E-07 Arsenic (As) 1.66E-05 1.66E-05 1.66E-05 1.66E-05 Beryllium (Be) 8.50E-07 8.50E-07 8.50E-07 8.50E-07 Cadmium (Cd) 2.06E-06 2.06E-06 2.06E-06 2.06E-06 Chromium (Cr) 1.05E-05 1.05E-05 1.05E-05 1.05E-05 Cobalt (Co) 4.05E-06 4.05E-06 4.05E-06 4.05E-06 Copper (Cu) no data no data no data no data Lead (Pb) 1.70E-05 1.70E-05 1.70E-05 1.70E-05 Mercury (Hg) 3.36E-06 3.36E-06 3.36E-06 3.36E-06 Nickel (Ni) 1.13E-05 1.13E-05 1.13E-05 1.13E-05 Selenium (Se) 5.26E-05 5.26E-05 5.26E-05 5.26E-05 Zinc (Zn) no data no data no data no data Solid Waste 9.81E+00 9.81E+00 9.81E+00 9.81E+00
30
2.3.3 Combustion of Fuel Oil for the Generation of Steam
This section presents the emission factors of various pollutants associated with the
combustion of fuel oil for the generation of steam in a boiler. Two major categories of
fuel oils are burned in steam generating boilers: distillate oils and residual oils. These oils
are further distinguished by grade numbers, with Numbers 1 and 2 being distillate oils
and Numbers 5 and 6 being residual oils. Number 2 oil is chosen to represent the
distillate oils and low sulfur Number 6 is chosen to represent the residual oil for LCI
purpose since they represent the distillate and residual oils, respectively, most commonly
used in industry (U.S. EPA, 1998). Typical ultimate analyses of distillate and residual
oils are presented in Table 2-4. Thermal efficiency of distillate oil fired boiler is assumed
to be 80 percent for steam generation and that of residual oil fired boiler is assumed to be
85 percent (U.S. EPA, 1982). AP-42 lists the uncontrolled emission factors of PM, SO2,
CO, NOx, CO2, CH4, HCl, and 12 metals in units of lb per 1000 gallons of fuel
combusted for boilers burning distillate oil and residual oil.
Sulfur dioxide control using a spray dryer is applied to SO2 emissions from
residual oil as they exceed code of federal regulation limit (215 ng/J heat input) where as
no control factor is applied to SO2 emissions from distillate oil because they are low.
Spray drier (in case of residual oil) is assumed to operate with 90 percent SO2 removal
efficiency as required by code of federal regulations (40 CFR Part 60 subpart Dc, July
1999).
31
Low NOx burner control technique is assumed to control 50 percent of NOx, both
in case of distillate and residual oil (U.S. EPA, 1998). A bag filter with 99 percent PM
removal efficiency is assumed as is typical of bag filters (U.S. EPA, 1998).
The control factors (as calculated by Equation 2-3) are applied to SO2, PM and
NOx emissions. CO and CH4 emissions are quite low and therefore no control factor is
applied to them. For metal emissions, it is assumed that the metals are removed with PM
in the APC equipment (bag filter), therefore 99 percent removal efficiency is used for
metal emissions. Ninety nine percent removal efficiency for metals is not a good
assumption as it ranges from 99 percent to 99.9 percent (U.S. EPA, 1998). Removal
efficiency of metals is a user input and can be changed if an accurate data is available.
For the residual and distillate oil fired boilers in the heat input range of 2.9 MWt to 29
MWt, there is no solid waste generation except the PM collected in APC equipment.
Solid waste generation because of PM collection is very low for Number 2 and Number 6
oils considered, and is neglected (U.S. EPA, 1982). Table 2-9 presents the emission
factors of various pollutants after APC equipment for boilers firing distillate and residual
oil.
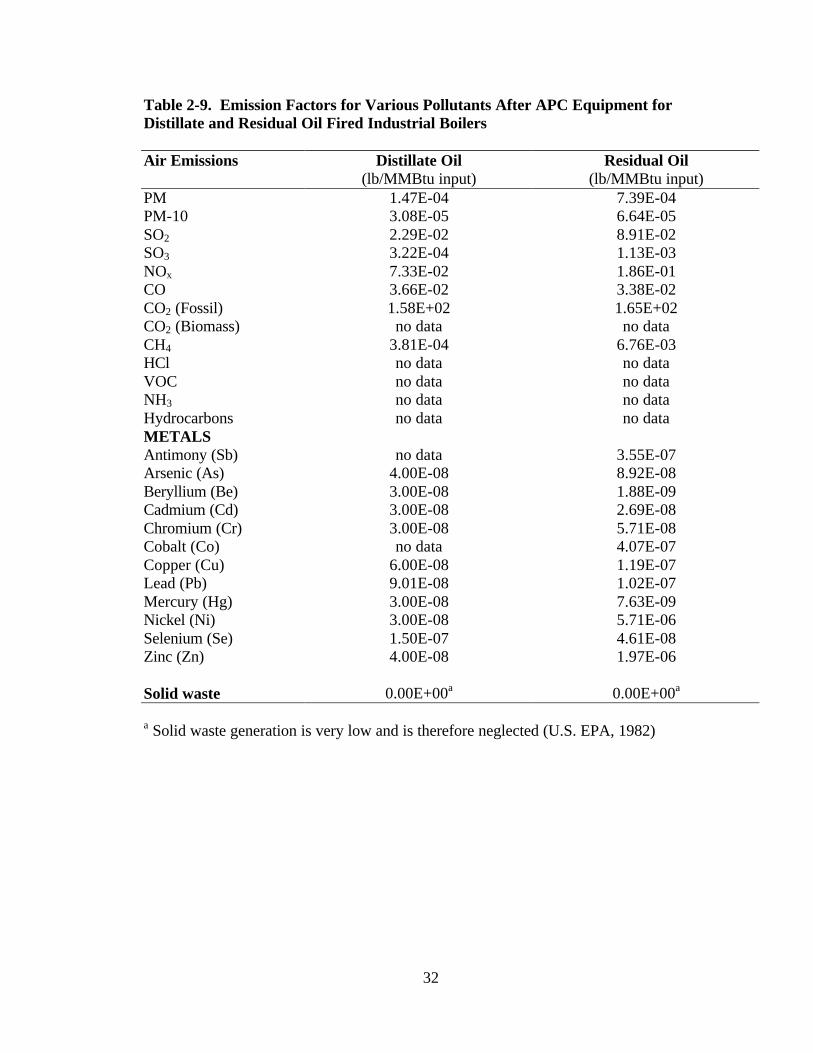
32
Table 2-9. Emission Factors for Various Pollutants After APC Equipment for Distillate and Residual Oil Fired Industrial Boilers Air Emissions Distillate Oil
(lb/MMBtu input) Residual Oil
(lb/MMBtu input) PM 1.47E-04 7.39E-04 PM-10 3.08E-05 6.64E-05 SO2 2.29E-02 8.91E-02 SO3 3.22E-04 1.13E-03 NOx 7.33E-02 1.86E-01 CO 3.66E-02 3.38E-02 CO2 (Fossil) 1.58E+02 1.65E+02 CO2 (Biomass) no data no data CH4 3.81E-04 6.76E-03 HCl no data no data VOC no data no data NH3 no data no data Hydrocarbons no data no data METALS Antimony (Sb) no data 3.55E-07 Arsenic (As) 4.00E-08 8.92E-08 Beryllium (Be) 3.00E-08 1.88E-09 Cadmium (Cd) 3.00E-08 2.69E-08 Chromium (Cr) 3.00E-08 5.71E-08 Cobalt (Co) no data 4.07E-07 Copper (Cu) 6.00E-08 1.19E-07 Lead (Pb) 9.01E-08 1.02E-07 Mercury (Hg) 3.00E-08 7.63E-09 Nickel (Ni) 3.00E-08 5.71E-06 Selenium (Se) 1.50E-07 4.61E-08 Zinc (Zn) 4.00E-08 1.97E-06 Solid waste 0.00E+00a 0.00E+00a a Solid waste generation is very low and is therefore neglected (U.S. EPA, 1982)
33
2.3.4 Combustion of Natural Gas for Generation of Steam
This section presents the emission factors of various pollutants associated with the
combustion of natural gas for the generation of steam in a boiler The emissions from
natural gas fired boilers include NOx, CO, CO2, CH4, VOCs, trace amounts of SO2,
particulate matter and metals. The ultimate analysis of natural gas is presented in Table 2-
4. Thermal efficiency of natural gas fired boiler is assumed to be 80 percent for steam
generation (U.S. EPA, 1982). AP-42 lists the uncontrolled emission factors of PM, SO2,
CO, NOx, CO2, CH4, HCl, and 12 metals in the units of lb per million standard cubic feet
of natural gas combusted. Because the SO2 and PM emissions are very low, no control
technology is applied. APC equipment commonly used for NOx control in natural gas
fired steam boilers is a low NOx burner. A typical NOx control efficiency for a low NOx
burner is 50 percent (U.S. EPA, 1998). Carbon monoxide, CH4, and VOC emissions
being small are not controlled. For metals, a removal efficiency of 99 percent is assumed
as a default as no data on the control efficiencies could be found for metal emissions from
natural gas fired boilers. The removal efficiency for metals is a user input and can be
altered if an accurate data is available. No liquid and solid wastes are generated (U.S.
EPA, 1982). Table 2-10 presents the emission factors of various pollutants after APC
equipment for boilers firing natural gas for the generation of steam. The emission factors
are reported in lb/MMBtu heat input.
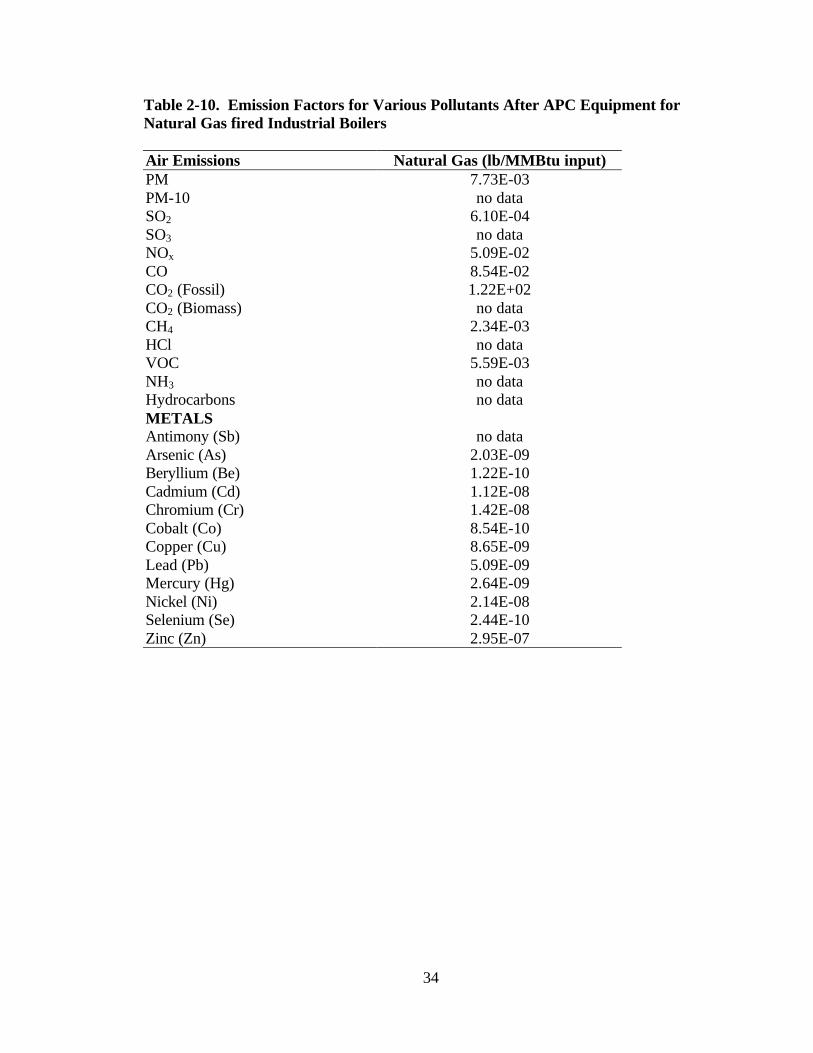
34
Table 2-10. Emission Factors for Various Pollutants After APC Equipment for Natural Gas fired Industrial Boilers Air Emissions Natural Gas (lb/MMBtu input) PM 7.73E-03 PM-10 no data SO2 6.10E-04 SO3 no data NOx 5.09E-02 CO 8.54E-02 CO2 (Fossil) 1.22E+02 CO2 (Biomass) no data CH4 2.34E-03 HCl no data VOC 5.59E-03 NH3 no data Hydrocarbons no data METALS Antimony (Sb) no data Arsenic (As) 2.03E-09 Beryllium (Be) 1.22E-10 Cadmium (Cd) 1.12E-08 Chromium (Cr) 1.42E-08 Cobalt (Co) 8.54E-10 Copper (Cu) 8.65E-09 Lead (Pb) 5.09E-09 Mercury (Hg) 2.64E-09 Nickel (Ni) 2.14E-08 Selenium (Se) 2.44E-10 Zinc (Zn) 2.95E-07

35
2.3.5 Overall Weighted Emission Factors from Boilers Generating Steam
As described in Section 2.2, the total enthalpy carried by steam was allocated to
various boiler types based on the percentage of installed boiler capacity given in Table 2-
3. The respective boiler heat inputs are then calculated by dividing the above-allocated
enthalpy by the boiler efficiency as described by Equation (2-4). Table 2-12 presents the
heat input to each boiler type.
jBoiler
jAllocated
jBoiler
HH
,
,
, η= (2-4)
where: HBoiler, j = Heat input to boiler ‘j’ (J/MJ steam)
HAllocated, j = Enthalpy allocated to boiler ‘j’ based on the boiler percentage (J/MJ
steam)
ηBoiler, j = Boiler thermal efficiency (fraction)
Finally, a particular emission for respective boiler types is calculated (Equation
2-5) and summed across.
jBoilerii HEFE ,⋅= (2-5)
where: Ei = Emission of pollutant ‘j’ per MJ steam produced (kg/MJ steam)
EFi = Emission factor of pollutant ‘j’ per J heat input (kg/J)
Table 2-11 presents the emission factors for various boilers in units of lb/MMBtu
heat input. Table 2-12 presents the respective boiler emissions for the generation of 1 MJ
of steam. Total emissions are calculated by summing across in Table 2-12.
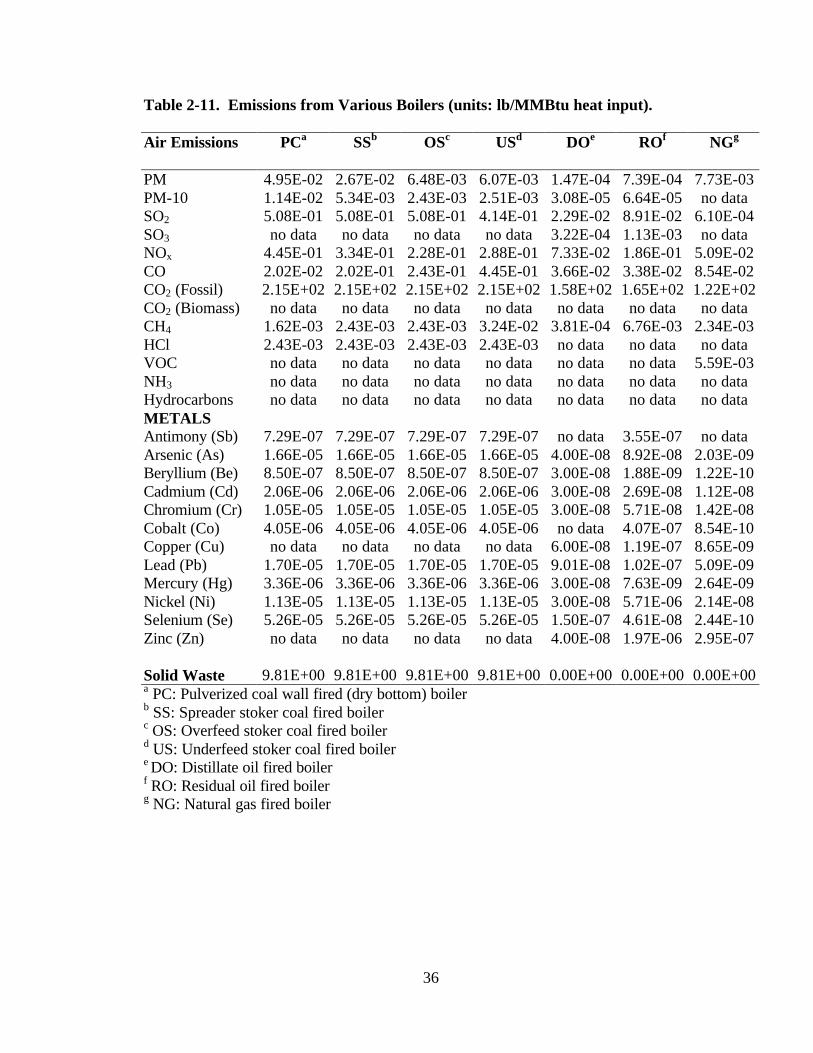
36
Table 2-11. Emissions from Various Boilers (units: lb/MMBtu heat input). Air Emissions PCa SSb OSc USd DOe ROf NGg
PM 4.95E-02 2.67E-02 6.48E-03 6.07E-03 1.47E-04 7.39E-04 7.73E-03 PM-10 1.14E-02 5.34E-03 2.43E-03 2.51E-03 3.08E-05 6.64E-05 no data SO2 5.08E-01 5.08E-01 5.08E-01 4.14E-01 2.29E-02 8.91E-02 6.10E-04 SO3 no data no data no data no data 3.22E-04 1.13E-03 no data NOx 4.45E-01 3.34E-01 2.28E-01 2.88E-01 7.33E-02 1.86E-01 5.09E-02 CO 2.02E-02 2.02E-01 2.43E-01 4.45E-01 3.66E-02 3.38E-02 8.54E-02 CO2 (Fossil) 2.15E+02 2.15E+02 2.15E+02 2.15E+02 1.58E+02 1.65E+02 1.22E+02 CO2 (Biomass) no data no data no data no data no data no data no data CH4 1.62E-03 2.43E-03 2.43E-03 3.24E-02 3.81E-04 6.76E-03 2.34E-03 HCl 2.43E-03 2.43E-03 2.43E-03 2.43E-03 no data no data no data VOC no data no data no data no data no data no data 5.59E-03 NH3 no data no data no data no data no data no data no data Hydrocarbons no data no data no data no data no data no data no data METALS Antimony (Sb) 7.29E-07 7.29E-07 7.29E-07 7.29E-07 no data 3.55E-07 no data Arsenic (As) 1.66E-05 1.66E-05 1.66E-05 1.66E-05 4.00E-08 8.92E-08 2.03E-09 Beryllium (Be) 8.50E-07 8.50E-07 8.50E-07 8.50E-07 3.00E-08 1.88E-09 1.22E-10 Cadmium (Cd) 2.06E-06 2.06E-06 2.06E-06 2.06E-06 3.00E-08 2.69E-08 1.12E-08 Chromium (Cr) 1.05E-05 1.05E-05 1.05E-05 1.05E-05 3.00E-08 5.71E-08 1.42E-08 Cobalt (Co) 4.05E-06 4.05E-06 4.05E-06 4.05E-06 no data 4.07E-07 8.54E-10 Copper (Cu) no data no data no data no data 6.00E-08 1.19E-07 8.65E-09 Lead (Pb) 1.70E-05 1.70E-05 1.70E-05 1.70E-05 9.01E-08 1.02E-07 5.09E-09 Mercury (Hg) 3.36E-06 3.36E-06 3.36E-06 3.36E-06 3.00E-08 7.63E-09 2.64E-09 Nickel (Ni) 1.13E-05 1.13E-05 1.13E-05 1.13E-05 3.00E-08 5.71E-06 2.14E-08 Selenium (Se) 5.26E-05 5.26E-05 5.26E-05 5.26E-05 1.50E-07 4.61E-08 2.44E-10 Zinc (Zn) no data no data no data no data 4.00E-08 1.97E-06 2.95E-07 Solid Waste 9.81E+00 9.81E+00 9.81E+00 9.81E+00 0.00E+00 0.00E+00 0.00E+00 a PC: Pulverized coal wall fired (dry bottom) boiler b SS: Spreader stoker coal fired boiler c OS: Overfeed stoker coal fired boiler d US: Underfeed stoker coal fired boiler e DO: Distillate oil fired boiler f RO: Residual oil fired boiler g NG: Natural gas fired boiler

37
Table 2-12. Emissions From Various Boilers Based on Steam Allocation for the Production of 1 MJ Steam (units: kg/MJ Steam Produced).
a PC: Pulverized coal wall fired (dry bottom) boiler b SS: Spreader stoker coal fired boiler c OS: Overfeed stoker coal fired boiler d US: Underfeed stoker coal fired boiler e DO: Distillate oil fired boiler f RO: Residual oil fired boiler g NG: Natural gas fired boiler
Watertube Firing Method & Fuel
SSb OSc USd DOe ROf NGg Total
Boiler Percentage, %
4.20 3.07 12.16 4.87 32.49 43.21 100
Typical Boiler Efficiency, %
80 80 80 80 85 80
Heat Input to Boiler (J)
5.24E+04 3.84E+04 1.52E+05 6.09E+04 3.82E+05 5.40E+05 1.23E+06
Air Emissions kg/MJ
Steam kg/MJ Steam
kg/MJ Steam
kg/MJ Steam
kg/MJ Steam
kg/MJ Steam
(kg/MJ Steam)
PM 6.03E-07 1.07E-07 3.97E-07 3.84E-09 1.21E-07 1.80E-06 3.03E-06 PM-10 1.21E-07 4.01E-08 1.64E-07 8.07E-10 1.09E-08 no data SO2 1.15E-05 8.39E-06 2.71E-05 6.00E-07 1.47E-05 1.42E-07 6.23E-05 SO3 no data no data no data 8.45E-09 1.87E-07 no data NOx 5.03E-06 2.51E-06 1.26E-05 1.92E-06 3.06E-05 1.18E-05 6.44E-05 CO 4.57E-06 4.01E-06 2.91E-05 9.60E-07 5.56E-06 1.99E-05 6.41E-05 CO2 (Fossil) 4.86E-03 3.56E-03 1.41E-02 4.13E-03 2.71E-02 2.84E-02 8.21E-02 CO2(Biomass) no data no data no data no data no data no data CH4 5.48E-08 4.01E-08 2.12E-06 9.99E-09 1.11E-06 5.44E-07 3.88E-06 HCl 5.48E-08 4.01E-08 1.59E-07 no data no data no data VOC no data no data no data no data no data 1.30E-06 NH3 no data no data no data no data no data no data Hydrocarbons no data no data no data no data no data no data METALS Antimony (Sb) 1.64E-11 1.20E-11 4.77E-11 no data 5.83E-11 no data Arsenic (As) 3.75E-10 2.74E-10 1.09E-09 1.05E-12 1.47E-11 4.73E-13 1.75E-09 Beryllium (Be) 1.92E-11 1.40E-11 5.56E-11 7.86E-13 3.09E-13 2.84E-14 9.00E-11 Cadmium (Cd) 4.66E-11 3.41E-11 1.35E-10 7.87E-13 4.42E-12 2.60E-12 2.24E-10 Chromium (Cr) 2.38E-10 1.74E-10 6.88E-10 7.87E-13 9.39E-12 3.31E-12 1.11E-09 Cobalt (Co) 9.14E-11 6.69E-11 2.65E-10 no data 6.69E-11 1.99E-13 Copper (Cu) no data no data no data 1.57E-12 1.96E-11 2.01E-12 Lead (Pb) 3.84E-10 2.81E-10 1.11E-09 2.36E-12 1.68E-11 1.18E-12 1.80E-09 Mercury (Hg) 7.58E-11 5.55E-11 2.20E-10 7.87E-13 1.26E-12 6.15E-13 3.54E-10 Nickel (Ni) 2.56E-10 1.87E-10 7.41E-10 7.87E-13 9.39E-10 4.96E-12 2.13E-09 Selenium (Se) 1.19E-09 8.70E-10 3.44E-09 3.94E-12 7.59E-12 5.67E-14 5.51E-09 Zinc (Zn) no data no data no data 1.05E-12 3.23E-10 6.86E-11 Solid Waste 2.21E-04 1.62E-04 6.42E-04 0.00E+00 0.00E+00 0.00E+00 1.02E-03
38
2.3.6 LCI of Lime consumed for the Removal of SO2 in a Spray Dryer
In lime spray drying, a lime slurry is sprayed into the absorption tower, and SO2 is
absorbed by the slurry, forming CaSO3/CaSO4. However, the liquid-to-gas ratio is such
that the water in the slurry evaporates before the slurry droplets reach the bottom of the
tower. The following equations represent the chemistry of lime spray drying process
(Cooper and Alley, 1994):
CaO + H2O → Ca (OH)2 (2-6)
SO2 + H2O ↔ H2SO3 (2-7)
H2SO3 + Ca (OH)2 → CaSO3⋅2H2O (2-8)
CaSO3⋅2H2O + ½ O2 → CaSO4⋅2H2O (2-9)
The overall equation therefore is:
CaO + SO2 + ½ O2 + 2H2O → CaSO4⋅2H2O (2-10)
From Equation 2-10, a minimum of 1 mole (56 gm) of lime is required in order to
remove 1 mole (64 gm) of SO2 removed. Therefore 0.875 kg of CaO is required for the
removal of 1 kg of SO2 from stoichiometry. It is assumed that 5 percent in excess of the
stoichiometric amount of CaO is needed for SO2 removal (Cooper and Alley, 1994). The
amount of SO2 removed can be calculated from controlled SO2 emissions occurring in
various boilers by multiplying the controlled emissions by 9 since 90 percent removal
efficiency was assumed. The CaO consumption rate (in kg) is then calculated by

39
multiplying total SO2 removal (kg) by 0.918 kg (5 percent excess of stoichiometric
amount, 0.875 kg per kg of SO2 removed). Further it is assumed that the only products of
SO2 removal reaction are calcium sulfate (CaSO4⋅2H2O) and unreacted CaO. The amount
of calcium sulfate produced is stoichiometrically equal to 2.687 kg per kg of SO2
removed. Table 2-13 presents the LCI associated with removal of SO2 using lime in a
spray dryer. The LCI of lime was obtained from Franklin Associates (1998).
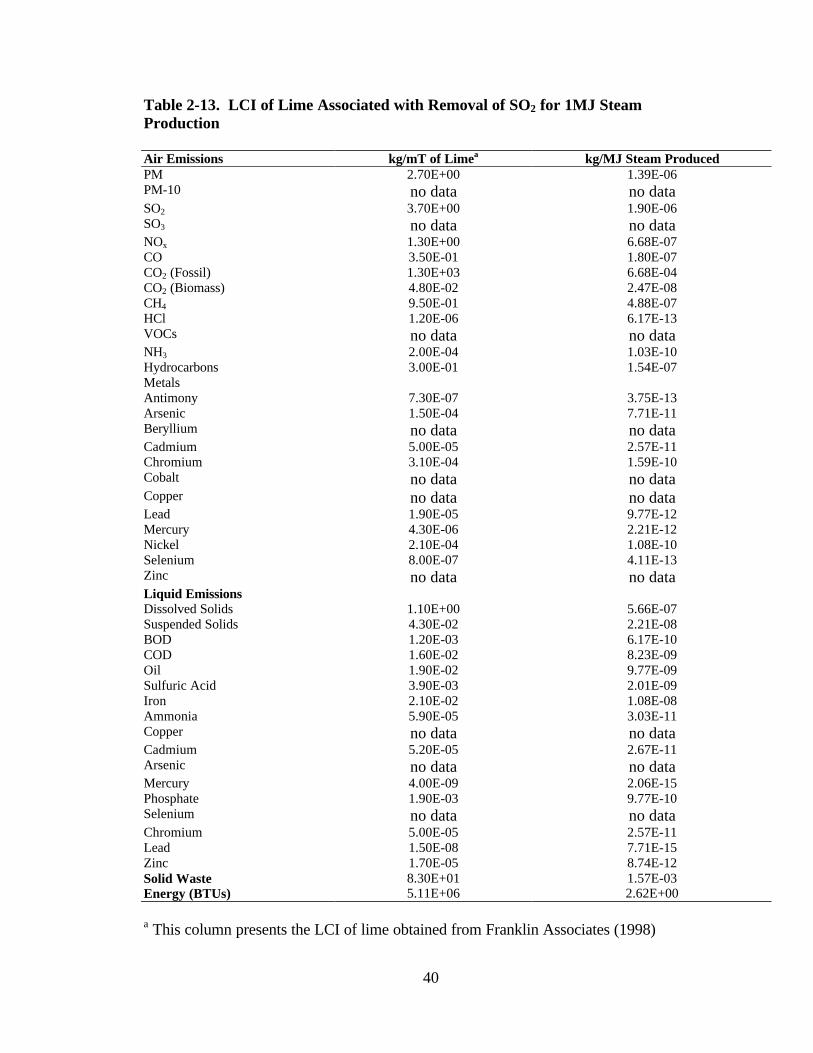
40
Table 2-13. LCI of Lime Associated with Removal of SO2 for 1MJ Steam Production Air Emissions kg/mT of Limea kg/MJ Steam Produced PM 2.70E+00 1.39E-06 PM-10 no data no data SO2 3.70E+00 1.90E-06 SO3 no data no data NOx 1.30E+00 6.68E-07 CO 3.50E-01 1.80E-07 CO2 (Fossil) 1.30E+03 6.68E-04 CO2 (Biomass) 4.80E-02 2.47E-08 CH4 9.50E-01 4.88E-07 HCl 1.20E-06 6.17E-13 VOCs no data no data NH3 2.00E-04 1.03E-10 Hydrocarbons 3.00E-01 1.54E-07 Metals Antimony 7.30E-07 3.75E-13 Arsenic 1.50E-04 7.71E-11 Beryllium no data no data Cadmium 5.00E-05 2.57E-11 Chromium 3.10E-04 1.59E-10 Cobalt no data no data Copper no data no data Lead 1.90E-05 9.77E-12 Mercury 4.30E-06 2.21E-12 Nickel 2.10E-04 1.08E-10 Selenium 8.00E-07 4.11E-13 Zinc no data no data Liquid Emissions Dissolved Solids 1.10E+00 5.66E-07 Suspended Solids 4.30E-02 2.21E-08 BOD 1.20E-03 6.17E-10 COD 1.60E-02 8.23E-09 Oil 1.90E-02 9.77E-09 Sulfuric Acid 3.90E-03 2.01E-09 Iron 2.10E-02 1.08E-08 Ammonia 5.90E-05 3.03E-11 Copper no data no data Cadmium 5.20E-05 2.67E-11 Arsenic no data no data Mercury 4.00E-09 2.06E-15 Phosphate 1.90E-03 9.77E-10 Selenium no data no data Chromium 5.00E-05 2.57E-11 Lead 1.50E-08 7.71E-15 Zinc 1.70E-05 8.74E-12 Solid Waste 8.30E+01 1.57E-03 Energy (BTUs) 5.11E+06 2.62E+00
a This column presents the LCI of lime obtained from Franklin Associates (1998)

41
2.3.7 LCI Associated with Boiler Feed Water (BFW) Pretreatment
For the LCI of BFW conditioning, ionic exchange pretreatment is considered.
Calcium and magnesium hardness can be removed by passing the water through a bed of
resin mixed with a natural mineral known as zeolite enabling the calcium or aluminum
base to be exchanged for sodium (Nunn, 1997):
CaCl2 + Na2Z (zeolite) → CaZ + 2 NaCl (2-11)
As a result of the above reaction, calcium and magnesium ions become bound and
the sodium ions are solubilized. The ion exchange reaction is nonselective and will
remove any soluble cations, including iron and manganese, and will remove
noncarbonate hardness as well as carbonate hardness. When the exchange material
becomes depleted of sodium ions, no further exchange of cations can occur until the
bound cations are replaced with sodium ions. The exchange material can be regenerated
by contact with brine solution according to the following reaction:
CaZ + 2 NaCl → Na2Z (regenerated zeolite) + CaCl2 (2-12)
The concentration of the brine is high enough to provide an excess of sodium
ions, so that all the cations are replaced by sodium ions. This so-called “sodium cycle”
can be repeated over and over again and is an economical method of softening because of
the low cost of salt brine.

42
A total hardness of 100 mg Ca2+/liter and 155 mg Mg2+/ liter was assumed in the
water to be pretreated. One hundred percent hardness removal efficiency is assumed in
calculations. Because ion exchange resin is regenerated, its replacement is ignored in the
life cycle inventory. Based on the above assumptions, 555 mg of NaCl is required per
liter of water treated. In addition, 4.92 g of sludge (consisting of 5.6 % w/w of CaCl2 and
4.4 % w/w of MgCl2) are produced per liter of water treated. The LCI of sodium chloride
is presented in Table 2-14 (Gonzalez and Overcash, 2000).
It is assumed that saturated steam at 100 psia is generated from water entering the
boiler at 50oC. Amount of saturated steam at 100-psia was calculated to be 0.392 kg
(Equation 2-1) for the 1 MJ steam, which is the basis of the LCI of steam. Assuming no
evaporation losses, the amount of steam generated is equal to the amount of BFW treated
and entering the boiler. Since 555 mg of NaCl is required for treating one liter of water,
the total NaCl consumption (0.217 gm) can be calculated using Equation 2-13.
1000
'BFWNaCl
NaCl
Vmm = (2-13)
where: mNaCl = Amount of NaCl consumed (gm)
m�NaCl = NaCl consumed per liter of BFW treated (= 555 mg/liter)
VBFW = Volume of BFW equivalent to 0.392 kg (= 0.392 liters approximately)
Table 2-14 presents the LCI associated with BFW treatment for producing steam
with 1 MJ total enthalpy.
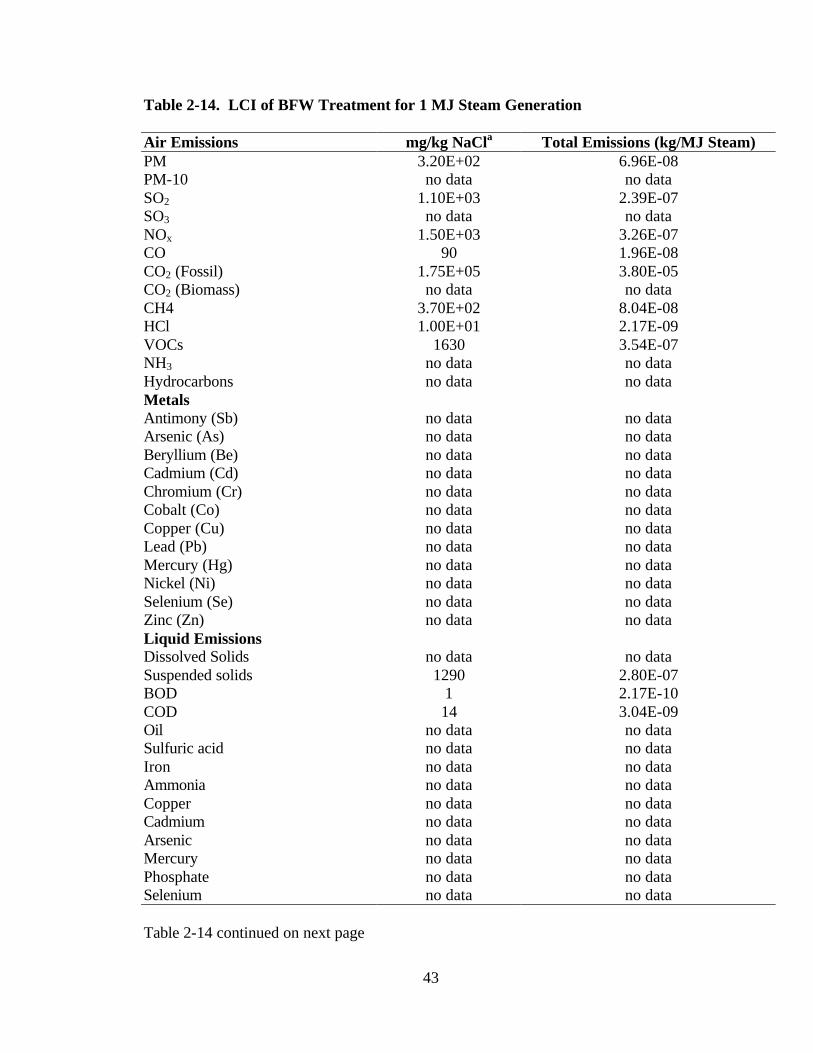
43
Table 2-14. LCI of BFW Treatment for 1 MJ Steam Generation Air Emissions mg/kg NaCla Total Emissions (kg/MJ Steam) PM 3.20E+02 6.96E-08 PM-10 no data no data SO2 1.10E+03 2.39E-07 SO3 no data no data NOx 1.50E+03 3.26E-07 CO 90 1.96E-08 CO2 (Fossil) 1.75E+05 3.80E-05 CO2 (Biomass) no data no data CH4 3.70E+02 8.04E-08 HCl 1.00E+01 2.17E-09 VOCs 1630 3.54E-07 NH3 no data no data Hydrocarbons no data no data Metals Antimony (Sb) no data no data Arsenic (As) no data no data Beryllium (Be) no data no data Cadmium (Cd) no data no data Chromium (Cr) no data no data Cobalt (Co) no data no data Copper (Cu) no data no data Lead (Pb) no data no data Mercury (Hg) no data no data Nickel (Ni) no data no data Selenium (Se) no data no data Zinc (Zn) no data no data Liquid Emissions Dissolved Solids no data no data Suspended solids 1290 2.80E-07 BOD 1 2.17E-10 COD 14 3.04E-09 Oil no data no data Sulfuric acid no data no data Iron no data no data Ammonia no data no data Copper no data no data Cadmium no data no data Arsenic no data no data Mercury no data no data Phosphate no data no data Selenium no data no data Table 2-14 continued on next page

44
Table 2-14 continued
Liquid Emissions mg/kg NaCla Total Emissions (kg/MJ Steam) Chromium no data no data Lead no data no data Zinc no data no data Solid waste 2.11E+04 1.93E-03b Energy (BTUs) 2.88E+03 6.26E-01
a LCI of NaCl production (Gonzalez and Overcash, 2000) b Includes the sludge produced as a result of BFW pretreatment (4.92 g/liter of water treated).
45
2.3.8 Overall LCI of Steam production
All the LCI parameters associated with different operations for the generation of
steam are finally summed up to yield the overall LCI of steam production. The emission
factors or the LCI parameters are based on 1 MJ steam produced (0.392 kg of saturated
steam at 100 psia). Table 2-15 presents the overall LCI of steam in kg of pollutant per MJ
of steam produced. Table 2-16 presents the overall LCI of steam in lb of pollutants per
MMBtu of steam produced.
Looking at Table 2-15, it is clear that the overall LCI of steam consists of PM,
SO2, NOx, CO, CO2, CH4, suspended solids, BOD, COD, and solid waste as the LCI
parameters which have quantitative information. Where no data was available for any one
component, the sum is not reported to emphasize that the absence of data does not
necessarily mean that the correct value is zero. Particulate matter, SO2, NOx are the most
important parameters since these are regulated in code of federal regulations (CFR,
1999). The most uncertain parameters seem to be PM, SO2, and NOx since they have
been calculated from uncontrolled emission factors based on assumed control efficiencies
as per guidelines in the literature (U.S. EPA, 1998).
As can be seen in Table 2-15, pre-combustion emissions associated with fuels
fired in the boilers contribute most to PM, SO2, CH4, suspended solids, BOD, COD and
solid waste in the total LCI of steam. NOx and CO contributions from boiler emissions
component are slightly higher in magnitude than the pre-combustion emissions
46
component. Carbon dioxide contribution from boiler emissions component is higher the
than pre-combustion emissions component by an order of magnitude. The LCI of lime
and BFW are very small contributors to the overall LCI of steam. In the overall LCI of
steam, both pre-combustion emissions and boiler emissions are significant and are both
important than lime and BFW LCI. The LCI of steam developed in this chapter can be
used as a component LCI in the LCI of other chemicals.
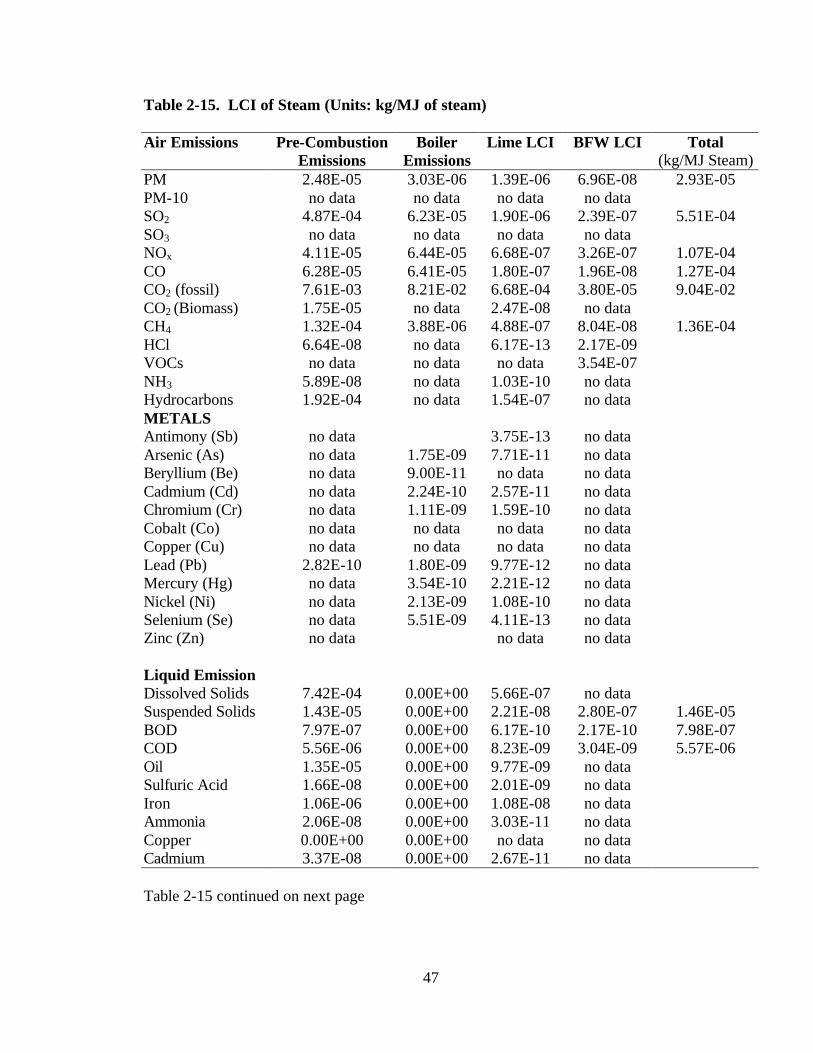
47
Table 2-15. LCI of Steam (Units: kg/MJ of steam) Air Emissions Pre-Combustion
Emissions Boiler
Emissions Lime LCI BFW LCI Total
(kg/MJ Steam) PM 2.48E-05 3.03E-06 1.39E-06 6.96E-08 2.93E-05 PM-10 no data no data no data no data SO2 4.87E-04 6.23E-05 1.90E-06 2.39E-07 5.51E-04 SO3 no data no data no data no data NOx 4.11E-05 6.44E-05 6.68E-07 3.26E-07 1.07E-04 CO 6.28E-05 6.41E-05 1.80E-07 1.96E-08 1.27E-04 CO2 (fossil) 7.61E-03 8.21E-02 6.68E-04 3.80E-05 9.04E-02 CO2 (Biomass) 1.75E-05 no data 2.47E-08 no data CH4 1.32E-04 3.88E-06 4.88E-07 8.04E-08 1.36E-04 HCl 6.64E-08 no data 6.17E-13 2.17E-09 VOCs no data no data no data 3.54E-07 NH3 5.89E-08 no data 1.03E-10 no data Hydrocarbons 1.92E-04 no data 1.54E-07 no data METALS Antimony (Sb) no data 3.75E-13 no data Arsenic (As) no data 1.75E-09 7.71E-11 no data Beryllium (Be) no data 9.00E-11 no data no data Cadmium (Cd) no data 2.24E-10 2.57E-11 no data Chromium (Cr) no data 1.11E-09 1.59E-10 no data Cobalt (Co) no data no data no data no data Copper (Cu) no data no data no data no data Lead (Pb) 2.82E-10 1.80E-09 9.77E-12 no data Mercury (Hg) no data 3.54E-10 2.21E-12 no data Nickel (Ni) no data 2.13E-09 1.08E-10 no data Selenium (Se) no data 5.51E-09 4.11E-13 no data Zinc (Zn) no data no data no data Liquid Emission Dissolved Solids 7.42E-04 0.00E+00 5.66E-07 no data Suspended Solids 1.43E-05 0.00E+00 2.21E-08 2.80E-07 1.46E-05 BOD 7.97E-07 0.00E+00 6.17E-10 2.17E-10 7.98E-07 COD 5.56E-06 0.00E+00 8.23E-09 3.04E-09 5.57E-06 Oil 1.35E-05 0.00E+00 9.77E-09 no data Sulfuric Acid 1.66E-08 0.00E+00 2.01E-09 no data Iron 1.06E-06 0.00E+00 1.08E-08 no data Ammonia 2.06E-08 0.00E+00 3.03E-11 no data Copper 0.00E+00 0.00E+00 no data no data Cadmium 3.37E-08 0.00E+00 2.67E-11 no data Table 2-15 continued on next page

48
Table 2-15 continued
Liquid Emission Pre-Combustion Emissions
Boiler Emissions
Lime LCI BFW LCI Total (kg/MJ Steam)
Mercury 2.65E-12 0.00E+00 2.06E-15 no data Phosphate 8.42E-09 0.00E+00 9.77E-10 no data Selenium 0.00E+00 no data no data Chromium 3.37E-08 0.00E+00 2.57E-11 no data Lead 2.10E-11 0.00E+00 7.71E-15 no data Zinc 1.19E-08 0.00E+00 8.74E-12 no data 0.00E+00 Solid Waste 4.43E-03 1.02E-03 1.57E-03 1.93E-03 8.95E-03 Energy (MJ) 1.36E-01 1.23E+00 2.76E-03 6.59E-04 1.37E+00
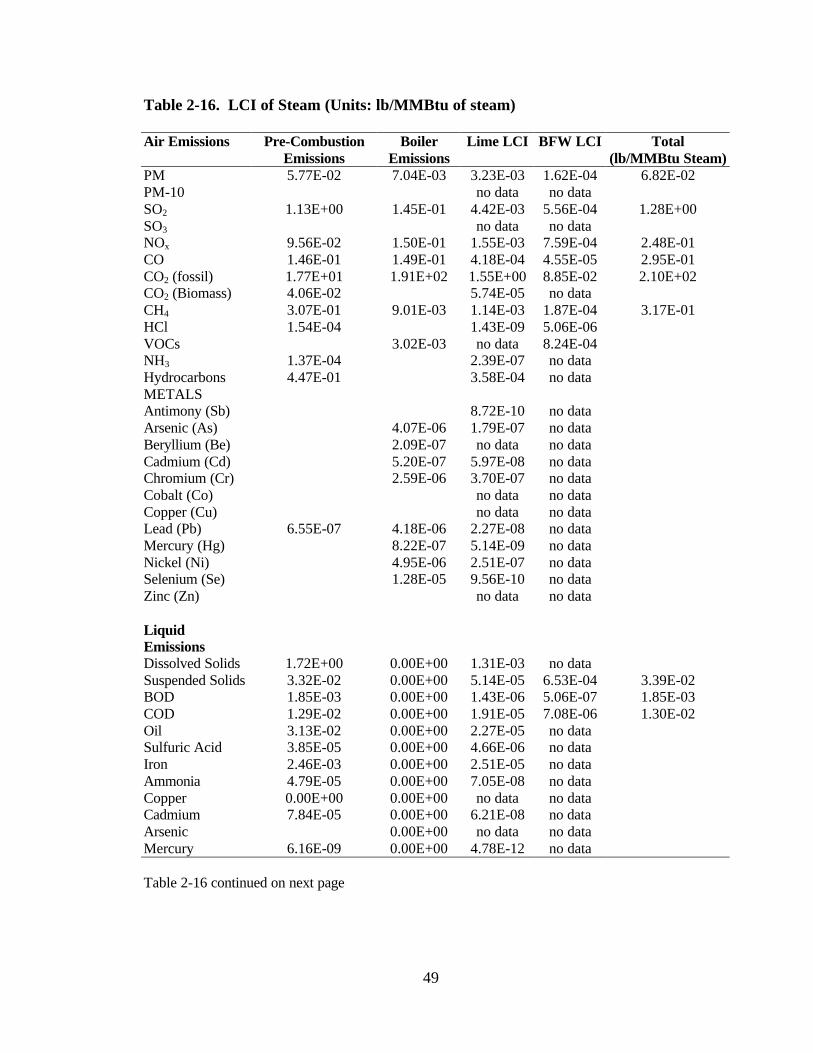
49
Table 2-16. LCI of Steam (Units: lb/MMBtu of steam) Air Emissions Pre-Combustion
Emissions Boiler
Emissions Lime LCI BFW LCI Total
(lb/MMBtu Steam) PM 5.77E-02 7.04E-03 3.23E-03 1.62E-04 6.82E-02 PM-10 no data no data SO2 1.13E+00 1.45E-01 4.42E-03 5.56E-04 1.28E+00 SO3 no data no data NOx 9.56E-02 1.50E-01 1.55E-03 7.59E-04 2.48E-01 CO 1.46E-01 1.49E-01 4.18E-04 4.55E-05 2.95E-01 CO2 (fossil) 1.77E+01 1.91E+02 1.55E+00 8.85E-02 2.10E+02 CO2 (Biomass) 4.06E-02 5.74E-05 no data CH4 3.07E-01 9.01E-03 1.14E-03 1.87E-04 3.17E-01 HCl 1.54E-04 1.43E-09 5.06E-06 VOCs 3.02E-03 no data 8.24E-04 NH3 1.37E-04 2.39E-07 no data Hydrocarbons 4.47E-01 3.58E-04 no data METALS Antimony (Sb) 8.72E-10 no data Arsenic (As) 4.07E-06 1.79E-07 no data Beryllium (Be) 2.09E-07 no data no data Cadmium (Cd) 5.20E-07 5.97E-08 no data Chromium (Cr) 2.59E-06 3.70E-07 no data Cobalt (Co) no data no data Copper (Cu) no data no data Lead (Pb) 6.55E-07 4.18E-06 2.27E-08 no data Mercury (Hg) 8.22E-07 5.14E-09 no data Nickel (Ni) 4.95E-06 2.51E-07 no data Selenium (Se) 1.28E-05 9.56E-10 no data Zinc (Zn) no data no data Liquid Emissions
Dissolved Solids 1.72E+00 0.00E+00 1.31E-03 no data Suspended Solids 3.32E-02 0.00E+00 5.14E-05 6.53E-04 3.39E-02 BOD 1.85E-03 0.00E+00 1.43E-06 5.06E-07 1.85E-03 COD 1.29E-02 0.00E+00 1.91E-05 7.08E-06 1.30E-02 Oil 3.13E-02 0.00E+00 2.27E-05 no data Sulfuric Acid 3.85E-05 0.00E+00 4.66E-06 no data Iron 2.46E-03 0.00E+00 2.51E-05 no data Ammonia 4.79E-05 0.00E+00 7.05E-08 no data Copper 0.00E+00 0.00E+00 no data no data Cadmium 7.84E-05 0.00E+00 6.21E-08 no data Arsenic 0.00E+00 no data no data Mercury 6.16E-09 0.00E+00 4.78E-12 no data Table 2-16 continued on next page
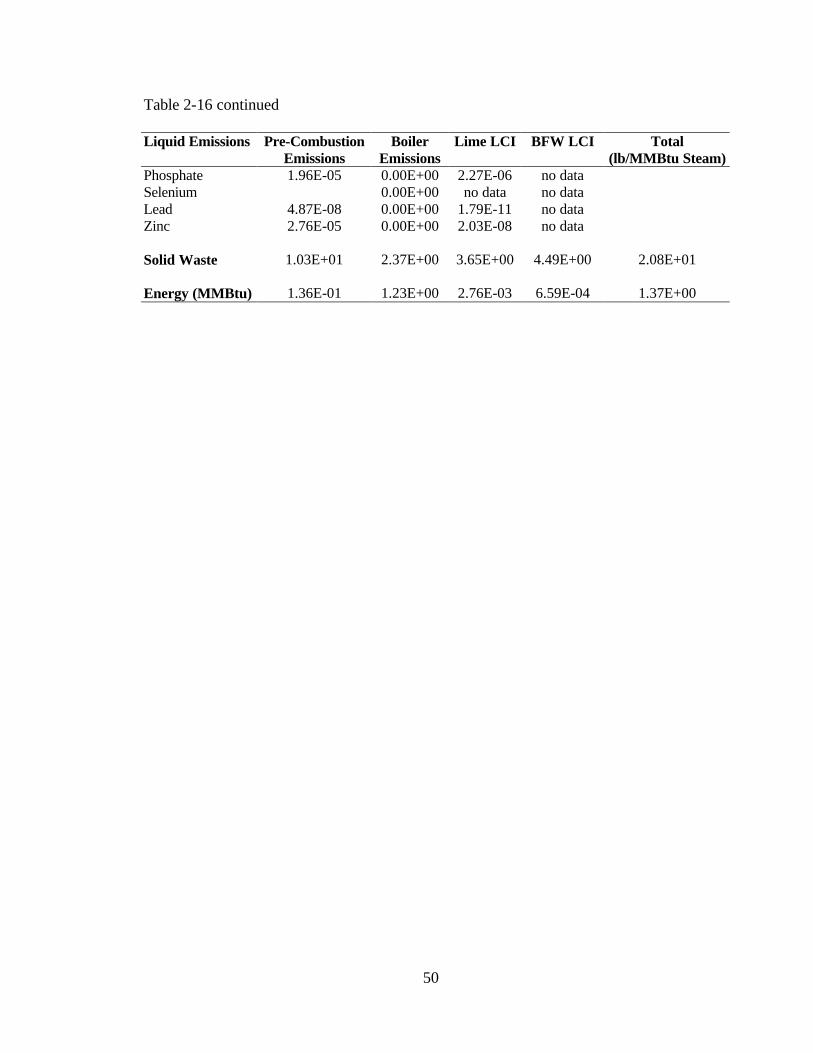
50
Table 2-16 continued
Liquid Emissions Pre-Combustion Emissions
Boiler Emissions
Lime LCI BFW LCI Total (lb/MMBtu Steam)
Phosphate 1.96E-05 0.00E+00 2.27E-06 no data Selenium 0.00E+00 no data no data Lead 4.87E-08 0.00E+00 1.79E-11 no data Zinc 2.76E-05 0.00E+00 2.03E-08 no data Solid Waste 1.03E+01 2.37E+00 3.65E+00 4.49E+00 2.08E+01 Energy (MMBtu) 1.36E-01 1.23E+00 2.76E-03 6.59E-04 1.37E+00
51
3.0 LIFE CYCLE INVENTORY OF ELECTRICITY
Electricity is one of our most widely used forms of energy. We get electricity,
which is a secondary energy source, from the conversion of other sources of energy, such
as coal, natural gas, oil, nuclear power and other natural sources, which are called
primary sources. Electricity is used in a process industry for a variety of functions such as
driving compressors and pumps, running process equipment, and many other applications
(EIA, 1995). Any life cycle evaluation in which electric energy is consumed must
consider the energy consumption and emissions associated with the production of
electrical energy.
An electric energy process model for calculating the life cycle inventory (LCI) of
electricity was developed by Dumas (1998). This section describes the methodology
developed by Dumas to calculate the LCI of electricity production. The section starts
with a brief description of the electric energy process model followed by energy
conversion processes involved in the production of electricity. Information concerning
electric grid definition and fuel usage, generation efficiencies, fuel heating values, fuel
pre-combustion energy, and total fuel energy is then presented. Finally emissions or LCI
parameters associated with generation of electricity are presented with the methodology
used for their calculations.
52
3.1 Design Basis and System Boundaries
This section presents the design basis for calculating the LCI of electricity. The
processes of energy conversion to electricity are briefly described including the types of
fuels considered. The national grid for the generation of electricity from various fuels is
described. Generation efficiencies are defined and described including the fuels heating
values. Pre-combustion and combustion energy consumption and emissions on a per unit
fuel basis are used in conjunction with unit efficiencies, transmission and distribution line
losses, and electric generation fuel usage percentages to allocate energy consumption and
emissions to the usage of an electric kilo-watt hour (kWh) based on the contribution to
the generation of that kWh by each fuel type (Dumas, 1998). Emissions and energy
consumption per kWh are calculated for national grid fuel mix. Regional grid fuel mix
are not considered since the primary purpose of LCI of electricity is to calculate burdens
or offsets associated with the production of a chemical which is assumed be produced at
several locations across the U.S., as opposed to in a particular region. The emissions and
energy consumption associated with facility construction are assumed to be negligible.
The majority of electrical energy in the U.S. is derived from seven major fuel
sources: coal, natural gas, residual oil, distillate oil, uranium, hydroelectric and wood
(Franklin Associates, 1998). Sources such as solar, wind, geothermal and other emerging
technologies make insignificant contributions. Thus seven major fuel types are
considered in the LCI of electricity.

53
Pre-combustion energy and emissions for each of the above fuels are associated
with surface and underground mining operations (coal and uranium), oil well operations
(natural gas and oil), pumping (oil and natural gas), fugitive emissions (coal, oil, natural
gas, uranium), cleaning (all fuels), transportation (all fuels) and production facilities. The
default assumption is that there are no pre-combustion emissions associated with
hydroelectric power generation and wood fuel. The following subsection defines the
electric grid considered for calculating the LCI of electricity.
3.2 Electric Grid Definition
To calculate the emissions associated with the generation of electricity it is
necessary to define fuel usage by type for the national grid. Table 3-1 presents the
national default generation percentages by fuel type (Dumas, 1998).
Table 3-1. National Electric Generation by Fuel Type (Dumas, 1998) Fuel Type Percent Coal 56.45 Natural Gas 9.75 Residual Oil 2.62 Distillate Oil 0.23 Nuclear 22.13 Hydro 8.58 Wood 0.24 Other - Total 100.00

54
The electric energy process model was imported into an electrical energy
spreadsheet. The above default percentage splits can be changed by the user in EXCEL
spreadsheet environment in which the LCI of electricity is implemented.
3.3 Generation Efficiencies of Electricity Generation
Generation weighted national efficiencies for each fuel type are based on Energy
Information Administration (EIA) data (EIA, 1995). Table 3-2 presents default electrical
generation efficiencies by fuel type on a national basis.
Table 3-2. National Grid Generation Efficiencies (Dumas, 1998) Fuel Type
Default National Unit Efficiency
Coal 0.325 Natural Gas 0.311 Residual Oil 0.326 Distillate Oil 0.260 Nuclear 0.314 Hydro 1.000 Wood 0.325 Other 0.325
3.4 Fuel Heating Values
Table 3-3 presents the heating values of various types of fuels used in electricity
generation (Franklin Associates, 1998). Hydroelectric power is unique from an LCI
standpoint in that there is no heating value associated with use of hydroelectric power.
The default energy consumption associated with the use of 1 kWh of hydroelectric power
is fixed at 3413 Btu/kWh.
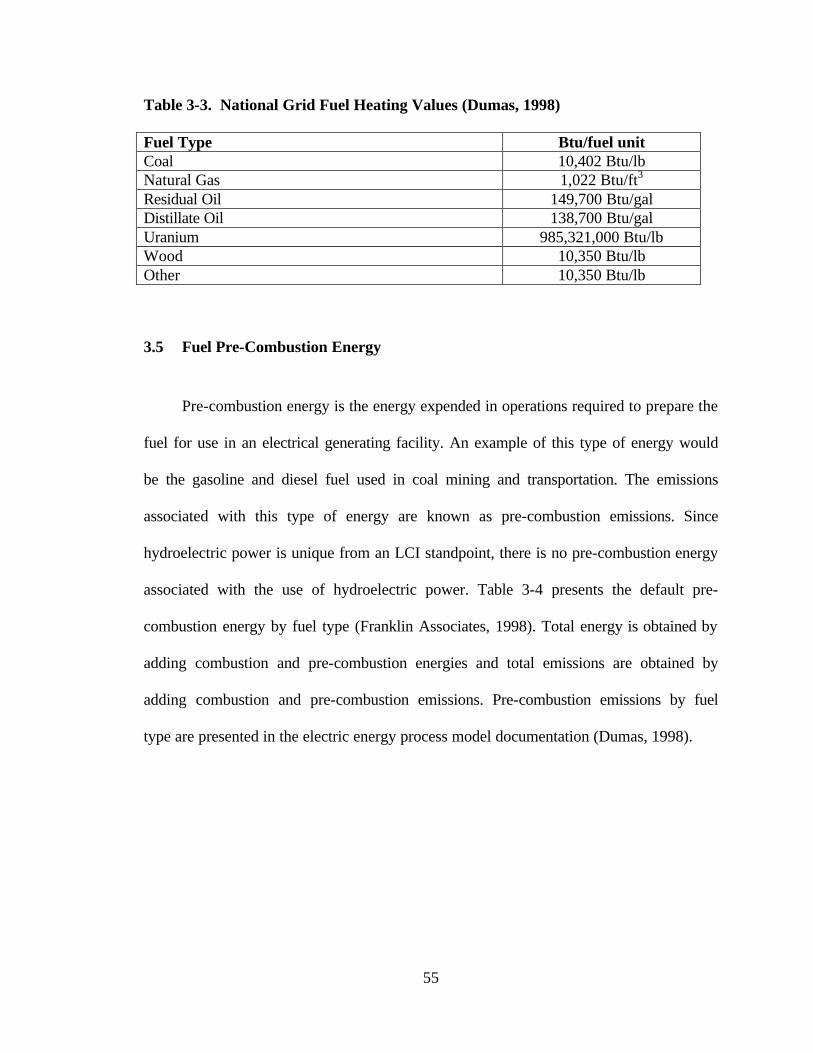
55
Table 3-3. National Grid Fuel Heating Values (Dumas, 1998) Fuel Type Btu/fuel unit Coal 10,402 Btu/lb Natural Gas 1,022 Btu/ft3 Residual Oil 149,700 Btu/gal Distillate Oil 138,700 Btu/gal Uranium 985,321,000 Btu/lb Wood 10,350 Btu/lb Other 10,350 Btu/lb
3.5 Fuel Pre-Combustion Energy
Pre-combustion energy is the energy expended in operations required to prepare the
fuel for use in an electrical generating facility. An example of this type of energy would
be the gasoline and diesel fuel used in coal mining and transportation. The emissions
associated with this type of energy are known as pre-combustion emissions. Since
hydroelectric power is unique from an LCI standpoint, there is no pre-combustion energy
associated with the use of hydroelectric power. Table 3-4 presents the default pre-
combustion energy by fuel type (Franklin Associates, 1998). Total energy is obtained by
adding combustion and pre-combustion energies and total emissions are obtained by
adding combustion and pre-combustion emissions. Pre-combustion emissions by fuel
type are presented in the electric energy process model documentation (Dumas, 1998).
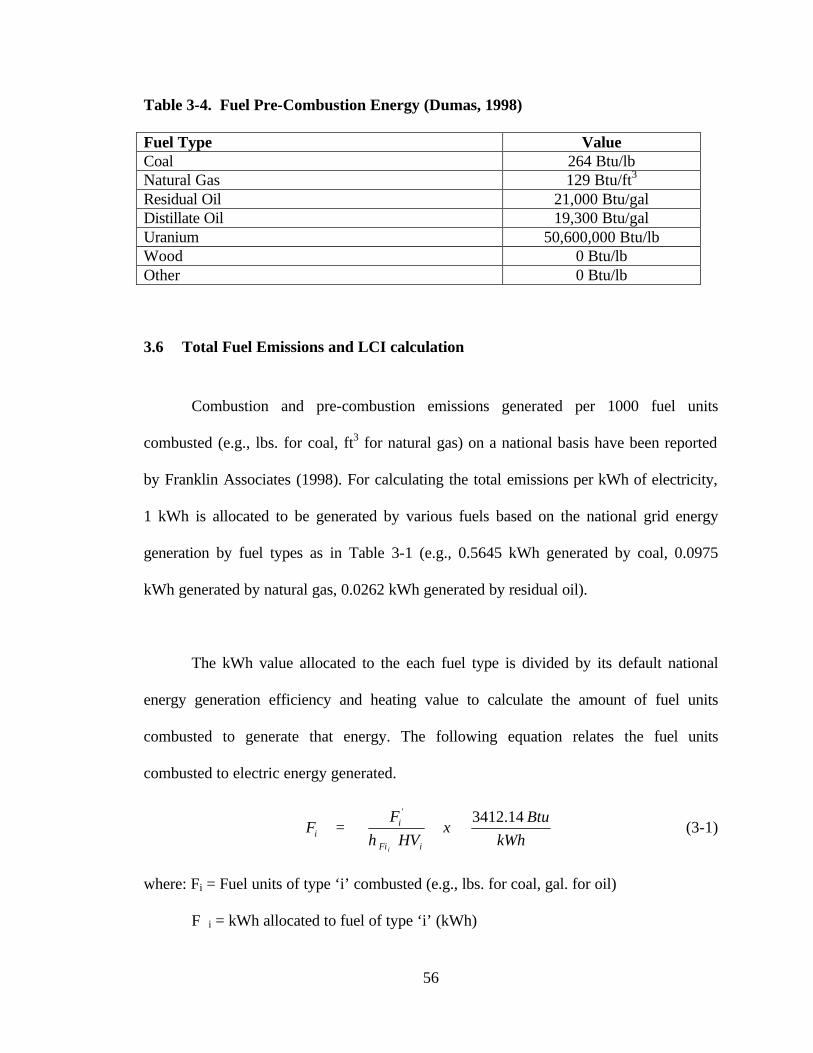
56
Table 3-4. Fuel Pre-Combustion Energy (Dumas, 1998) Fuel Type Value Coal 264 Btu/lb Natural Gas 129 Btu/ft3 Residual Oil 21,000 Btu/gal Distillate Oil 19,300 Btu/gal Uranium 50,600,000 Btu/lb Wood 0 Btu/lb Other 0 Btu/lb
3.6 Total Fuel Emissions and LCI calculation
Combustion and pre-combustion emissions generated per 1000 fuel units
combusted (e.g., lbs. for coal, ft3 for natural gas) on a national basis have been reported
by Franklin Associates (1998). For calculating the total emissions per kWh of electricity,
1 kWh is allocated to be generated by various fuels based on the national grid energy
generation by fuel types as in Table 3-1 (e.g., 0.5645 kWh generated by coal, 0.0975
kWh generated by natural gas, 0.0262 kWh generated by residual oil).
The kWh value allocated to the each fuel type is divided by its default national
energy generation efficiency and heating value to calculate the amount of fuel units
combusted to generate that energy. The following equation relates the fuel units
combusted to electric energy generated.
=
kWh
Btux
HV
FF
iFi
ii
i
14.3412'
η (3-1)
where: Fi = Fuel units of type ‘i’ combusted (e.g., lbs. for coal, gal. for oil)
F�i = kWh allocated to fuel of type ‘i’ (kWh)
57
HVi = Heating value of fuel of type ‘i’ (Btu/fuel units)
The fuel combusted, as calculated in Equation (3-1), is then multiplied by the total
emissions (kg/fuel unit) from that fuel to obtain the emissions for the generation of
electrical energy allocated to that fuel (Equation 3-2).
iijij FFEFE ',, = (3-2)
where: FEj, i = Emission of type ‘j’ from fuel type ‘i’ (kg)
FE�j, i = Emission factor of pollutant ‘j’ from fuel type ‘i’ (kg/fuel unit)
Emission j can then be summed across all the fuels combusted to generate the
total 1 kWh of electricity. Equation (3-3) represents the total emission of type j in
generation of 1 kWh of electricity.
∑=
=n
iijj FEE
1, (3-3)
where: Ej = Emission of ‘j’ per kWh of electricity produced (kg/kWh of electricity)
The results of Equation (3-3) i.e. emissions (both in lb and kg) per kWh of
electricity generated are shown in Table 3-5. These emissions include the pre-combustion
emissions. The data in Table 3-5 represents the LCI of electricity on 1 kWh basis. Pre-
combustion and combustion emissions for each fuel type for a total generation of 1 kWh
of electric energy can be found in Electric Energy Process model documentation by
Dumas (1998).
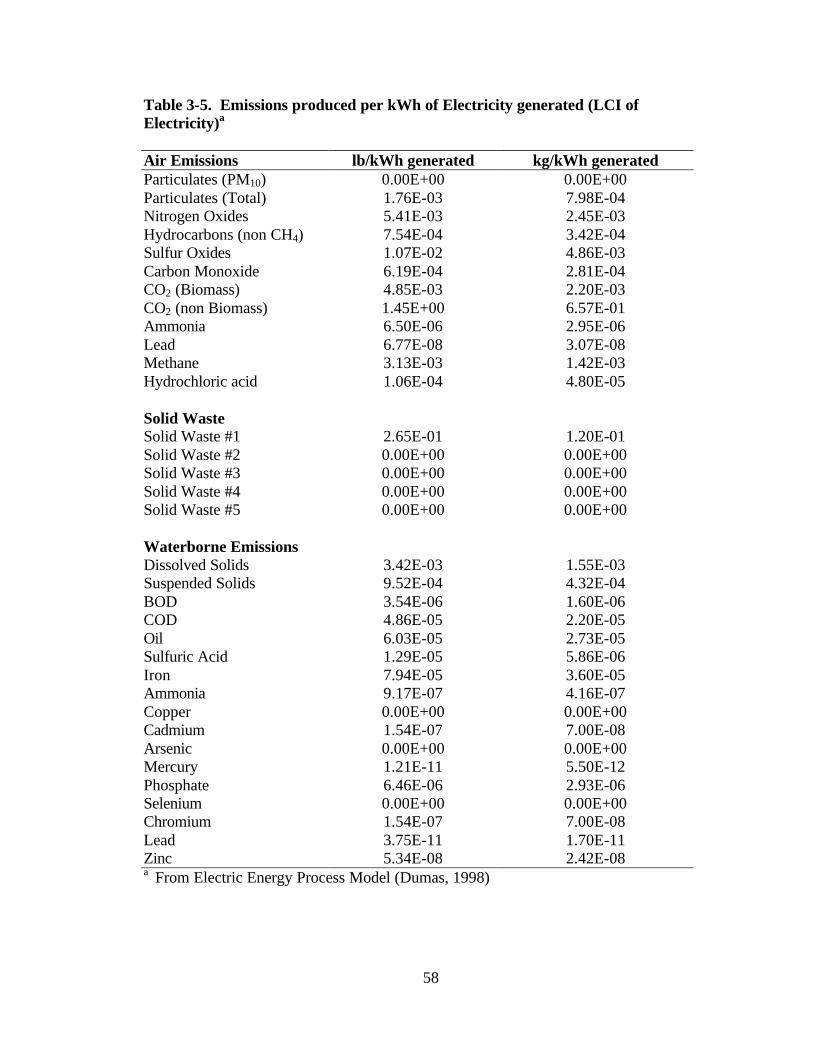
58
Table 3-5. Emissions produced per kWh of Electricity generated (LCI of Electricity)a Air Emissions lb/kWh generated kg/kWh generated Particulates (PM10) 0.00E+00 0.00E+00 Particulates (Total) 1.76E-03 7.98E-04 Nitrogen Oxides 5.41E-03 2.45E-03 Hydrocarbons (non CH4) 7.54E-04 3.42E-04 Sulfur Oxides 1.07E-02 4.86E-03 Carbon Monoxide 6.19E-04 2.81E-04 CO2 (Biomass) 4.85E-03 2.20E-03 CO2 (non Biomass) 1.45E+00 6.57E-01 Ammonia 6.50E-06 2.95E-06 Lead 6.77E-08 3.07E-08 Methane 3.13E-03 1.42E-03 Hydrochloric acid 1.06E-04 4.80E-05
Solid Waste Solid Waste #1 2.65E-01 1.20E-01 Solid Waste #2 0.00E+00 0.00E+00 Solid Waste #3 0.00E+00 0.00E+00 Solid Waste #4 0.00E+00 0.00E+00 Solid Waste #5 0.00E+00 0.00E+00
Waterborne Emissions Dissolved Solids 3.42E-03 1.55E-03 Suspended Solids 9.52E-04 4.32E-04 BOD 3.54E-06 1.60E-06 COD 4.86E-05 2.20E-05 Oil 6.03E-05 2.73E-05 Sulfuric Acid 1.29E-05 5.86E-06 Iron 7.94E-05 3.60E-05 Ammonia 9.17E-07 4.16E-07 Copper 0.00E+00 0.00E+00 Cadmium 1.54E-07 7.00E-08 Arsenic 0.00E+00 0.00E+00 Mercury 1.21E-11 5.50E-12 Phosphate 6.46E-06 2.93E-06 Selenium 0.00E+00 0.00E+00 Chromium 1.54E-07 7.00E-08 Lead 3.75E-11 1.70E-11 Zinc 5.34E-08 2.42E-08 a From Electric Energy Process Model (Dumas, 1998)
59
4.0 LIQUID PHASE METHANOL PROCESS
This chapter describes a systems model for a new and promising technology for
methanol production known as the Liquid Phase Methanol (LPMEOHTM) process, which
is in the demonstration phase at Eastman Chemical’s Kingsport process demonstration
facility. The chapter focuses on modeling of the LPMEOHTM process in ASPEN PLUS, a
steady state chemical process simulator. The systems model of LPMEOHTM process will
enable the evaluation of performance of the LPMEOH production process under varying
synthesis gas feed conditions as might be expected from the municipal solid waste
(MSW) gasification.
An overview of methanol production is presented in the next section (Section
4.1), followed by a brief description of methanol production technologies and their
commercial status in Section 4.2, including the LPMEOH process technology. Modeling
of processes in ASPEN PLUS is then described in Section 4.3. Technical basis for the
LPMEOHTM process, including process chemistry and major process equipment, is
presented in Sections 4.4. Section 4.5 presents the major process sections in the
LPMEOH process model in ASPEN PLUS. Design specification and FORTRAN blocks
used in the LPMEOH process model are presented in Section 4.6. Convergence sequence
of LPMEOH process model is presented in Section 4.7. LPMEOH process model
verification and validation is presented in Section 4.8. Implementation of a LPMEOH
process model in ASPEN PLUS is presented in Section 4.9.
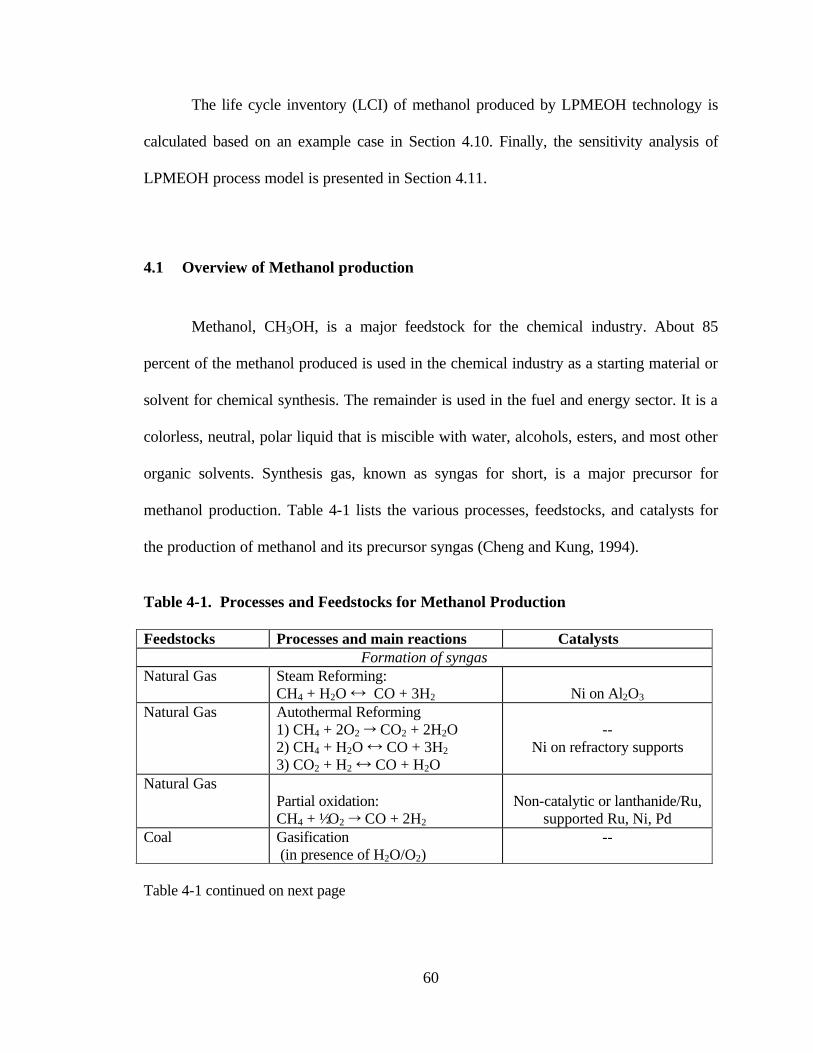
60
The life cycle inventory (LCI) of methanol produced by LPMEOH technology is
calculated based on an example case in Section 4.10. Finally, the sensitivity analysis of
LPMEOH process model is presented in Section 4.11.
4.1 Overview of Methanol production
Methanol, CH3OH, is a major feedstock for the chemical industry. About 85
percent of the methanol produced is used in the chemical industry as a starting material or
solvent for chemical synthesis. The remainder is used in the fuel and energy sector. It is a
colorless, neutral, polar liquid that is miscible with water, alcohols, esters, and most other
organic solvents. Synthesis gas, known as syngas for short, is a major precursor for
methanol production. Table 4-1 lists the various processes, feedstocks, and catalysts for
the production of methanol and its precursor syngas (Cheng and Kung, 1994).
Table 4-1. Processes and Feedstocks for Methanol Production Feedstocks Processes and main reactions Catalysts
Formation of syngas Natural Gas Steam Reforming:
CH4 + H2O Ö CO + 3H2
Ni on Al2O3 Natural Gas Autothermal Reforming
1) CH4 + 2O2 Õ CO2 + 2H2O 2) CH4 + H2O Ö CO + 3H2 3) CO2 + H2 Ö CO + H2O
--
Ni on refractory supports
Natural Gas Partial oxidation: CH4 + ½ O2 Õ CO + 2H2
Non-catalytic or lanthanide/Ru,
supported Ru, Ni, Pd Coal Gasification
(in presence of H2O/O2) --
Table 4-1 continued on next page
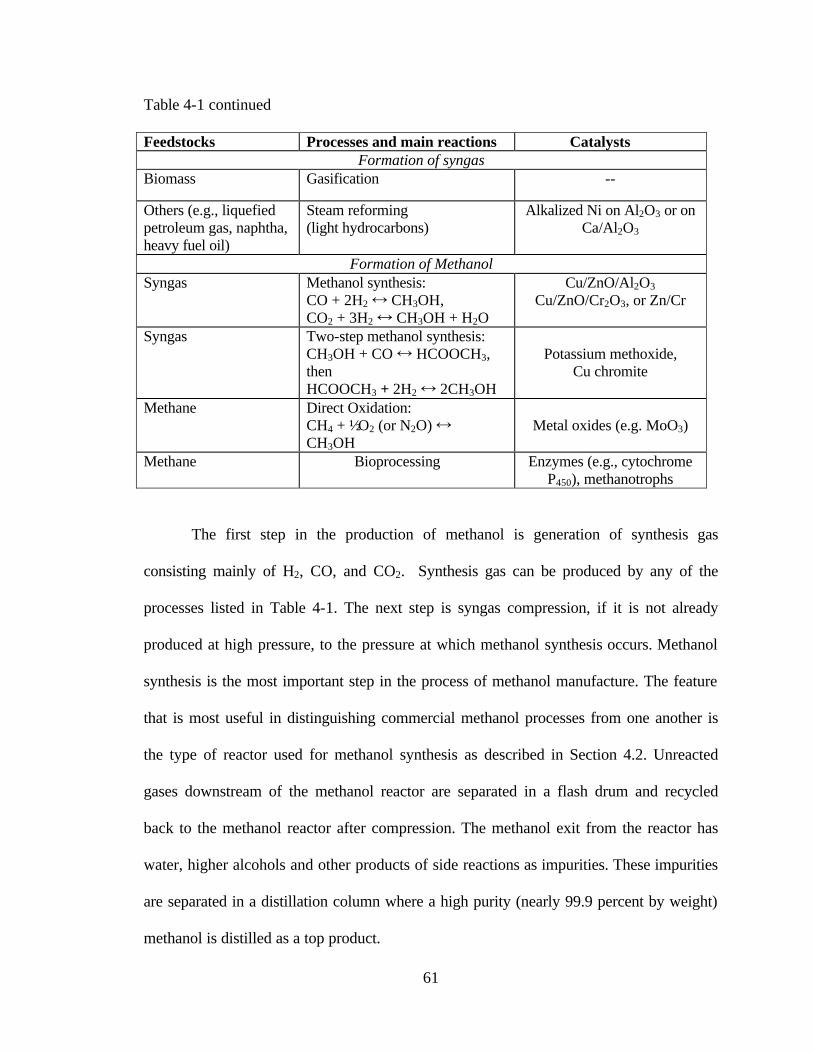
61
Table 4-1 continued
Feedstocks Processes and main reactions Catalysts Formation of syngas
Biomass Gasification --
Others (e.g., liquefied petroleum gas, naphtha, heavy fuel oil)
Steam reforming (light hydrocarbons)
Alkalized Ni on Al2O3 or on Ca/Al2O3
Formation of Methanol Syngas Methanol synthesis:
CO + 2H2 Ö CH3OH, CO2 + 3H2 Ö CH3OH + H2O
Cu/ZnO/Al2O3 Cu/ZnO/Cr2O3, or Zn/Cr
Syngas Two-step methanol synthesis: CH3OH + CO Ö HCOOCH3, then HCOOCH3 + 2H2 Ö 2CH3OH
Potassium methoxide,
Cu chromite
Methane Direct Oxidation: CH4 + ½ O2 (or N2O) Ö CH3OH
Metal oxides (e.g. MoO3)
Methane Bioprocessing Enzymes (e.g., cytochrome P450), methanotrophs
The first step in the production of methanol is generation of synthesis gas
consisting mainly of H2, CO, and CO2. Synthesis gas can be produced by any of the
processes listed in Table 4-1. The next step is syngas compression, if it is not already
produced at high pressure, to the pressure at which methanol synthesis occurs. Methanol
synthesis is the most important step in the process of methanol manufacture. The feature
that is most useful in distinguishing commercial methanol processes from one another is
the type of reactor used for methanol synthesis as described in Section 4.2. Unreacted
gases downstream of the methanol reactor are separated in a flash drum and recycled
back to the methanol reactor after compression. The methanol exit from the reactor has
water, higher alcohols and other products of side reactions as impurities. These impurities
are separated in a distillation column where a high purity (nearly 99.9 percent by weight)
methanol is distilled as a top product.

62
Methanol production processes are classified according to the pressure used in the
methanol synthesis reactor as:
1) High Pressure Process: 25-30 Mpa
2) Medium Pressure Process: 10-25 Mpa
3) Low Pressure Process: 5-10 Mpa
The main advantages of the low-pressure process are lower investment and
production costs, improved operational reliability, and greater flexibility in the choice of
plant size. The technology for the commercial manufacture of methanol has become
fairly standard with the advent of the copper-based catalyst in the 1960s, and several
large plants based on the so-called low-pressure methanol-synthesis process are currently
in operation all over the world. Most current research is to seek alternate processes for
methanol synthesis such as by the liquid-phase methanol synthesis process and the low-
temperature, homogeneous, catalysis process. The syngas used in all low-pressure
processes using copper-based catalysts needs purification and conditioning. Purification
of syngas involves the removal of gaseous (or solid) components that which are harmful
to the process route and/or methanol catalyst. The conditioning of syngas involves
providing proper stoichiometric conditions for producing methanol from CO, CO2, and
H2. The stoichiometric number is expressed by the formula:
][][
][][
2
22
COCO
COHS
+−
= (4-1)
63
where, the square brackets represent the number of moles of each component in the
reactor feed. For higher single pass conversion of the syngas and high methanol yield, the
value of S should be as close to 2 as possible. As reported in literature (Chen, 1995), the
optimum value of S is 2.1.
As stated earlier, the type of methanol synthesis reactor is the main distinguishing
feature in methanol synthesis technologies. The four basic reactor types in use are shown
in Figure 4-1. There are a variety of proprietary reactor designs commercially available
from licensors, all of which utilize one of these four types or a combination of two among
them. ICI low-pressure (using quench type reactor) and Lurgi low-pressure (using steam
raising type reactor) methanol synthesis processes are the two most widely used,
commercially proven, and successful technologies. Most of the methanol plants built in
last 20 to 25 years use the ICI or Lurgi processes. Other commercial technologies in use
include Mitsubishi Gas Chemical (MGC) low-pressure process, Nissui-Topsoe methanol
synthesis process, Variobar(R) process by Linde AG, Germany and Japan Gas-chemical
Company process (JGC). Since ICI and Lurgi low-pressure are the most commonly used
commercial processes, only these will be described in detail. The following subsections
present the detailed process descriptions on ICI, Lurgi and LPMEOH processes. A brief
description of the MGC methanol process is also presented.

64
Figure 4-1. Methanol Converter Types
Steam-raisingMultiple adiabatic Tube-cooled
Syngas
Syngas
ColdSyngas
shots
Syngas
Adiabaticreactor
Inter-stagecooler
Crude Methanol
Crude MethanolCrude Methanol
Steam Drum
Syngas
Crude
Methanol
Quench Steam-raisingMultiple adiabatic Tube-cooled
SyngasSyngas
Syngas
ColdSyngas
shots
Syngas
ColdSyngas
shots
Syngas
Adiabaticreactor
SyngasSyngas
Adiabaticreactor
Inter-stagecooler
Crude Methanol
Crude MethanolCrude Methanol
Steam Drum
Syngas
Crude
Methanol
Steam Drum
Syngas
Crude
Methanol
Quench
64

65
4.1.1 The ICI Low-Pressure Methanol Synthesis Process
ICI, Ltd. of the United Kingdom began manufacturing methanol with the new
low-pressure technology in 1966. The plant, with 400 tons per day (TPD) capacity,
operated at 5 Mpa (50 atm) and used centrifugal compression equipment. As of 1997, 53
methanol plants had been built using the ICI low-pressure methanol process and three
plants were under construction (SRI, 1999). The principal feedstock used to produce
synthesis gas for methanol synthesis is natural gas, although naphtha, heavier oil fractions
and coal are also used. African Explosives and Chemical Industries of South Africa built
the first coal-based plant using the ICI low-pressure process, with a capacity of 25,000
metric tons (8 million gallons) per year in 1976. There are two ways to produce syngas
from the above said feedstocks: steam reforming of the feedstock and the partial
oxidation of the feedstock.
The hydrocarbon feedstock is desulfurized by catalytic or absorptive processes,
mixed with steam and passed forward to a tubular reformer. This is the process of steam
reforming. The reformed gas (syngas) is cooled to ambient temperature and the heat is
recovered in heat recovery section. Alternatively, syngas may be produced by partial
oxidation of heavy fuel oil or coal by oxygen and steam. The product gas mostly consists
of H2 and CO, together with some CO2 and trace impurities. It is treated to remove sulfur
compounds and then adjusted via water-gas shift reaction, in a water-gas shift reactor by
water addition, to achieve the optimum ratio of H2 to CO before sending it to the
66
converter (Equation 4-2). Figure 4-2 shows a simplified process flowsheet for the ICI
low-pressure process.
CO + H2O → CO2 + H2; ∆hro = -41.1 kJ/mol (4-2)
Where: ∆hro = Enthalpy of reaction at standard conditions (T=298K, P = 1 atm; Twigg,
1989)
Syngas produced by either of two routes is compressed by a turbine driven
centrifugal compressor to a pressure between 50 and 100 atm. The synthesis gas is added
to the synthesis loop, which is comprised of the following process units: circulator;
converter; heat exchanger; heat recovery exchanger; cooler and separator. The crude
product is distilled in two or three columns. Synthesis catalyst operates in the pressure
range of 50 atm to 100 atm at 200 oC to 300 oC and has a life of up to four years. The
converter is a pressure vessel containing a single bed of catalyst. The reaction is
quenched at several levels by cold syngas feed gas injections (called cold shots) through
specially designed spargers. Reaction heat is recovered from the converter effluent to
preheat the high-pressure boiler feed-water or to heat water for feedstock saturation. The
product stream is cooled and methanol is condensed out. Crude methanol is then sent to a
distillation column to achieve the desired purity.
67
The main advantages of the ICI low-pressure process are high methanol synthesis
rates and selectivity (Dry, 1988). The main limitations of the ICI process are:
1) Maximum size is limited by multi-stage quenches in view of the pressure drop
across the catalyst beds.
2) Due to high-pressure drop across the catalyst beds, the recycle compressor duty is
high.
3) Methanol production is very sensitive to reactor bed temperatures. This is because
the different parts of the catalyst beds are required to operate at different
temperatures, and these temperatures depend critically on feed temperatures to
each bed.
4) A small deviation in feed temperature tends to be amplified in the system, and
catalyst life is reduced by thermal swings that occur during plant upsets.
5) The reaction heat is largely used to bring the quench gas to the reaction
temperature and therefore the steam generation from the waste heat of the reactor
exit gas is quite low. The maximum attainable steam pressure is limited to about
10 atm.

68
Figure 4-2. The ICI Low Pressure Process
DesulfurizedNaphtha Primary
ReformerHeat
Recovery
Heat Recovery
Steam
To Stack
Purge tofuel gas system
Separator
BFW
ICI Converter
Fuel gas or naphtha
Syngas cold shots
Syngas compressor
Recycle gas compressor
Crude methanol
Unreacted syngas
Methanol distillationcolumn
Condenser
DesulfurizedNaphtha Primary
ReformerHeat
Recovery
Heat Recovery
Heat Recovery
Steam
To Stack
Purge tofuel gas system
Separator
BFW
ICI Converter
Fuel gas or naphtha
Syngas cold shots
Syngas compressor
Recycle gas compressor
Crude methanol
Unreacted syngas
Methanol distillationcolumn
Condenser
68

69
4.1.2 The Lurgi Low-Pressure Methanol Synthesis Process
The first low-pressure Lurgi plants using tubular reactors went onstream between
1970 and 1973 (Supp, 1981). In early 1980, Lurgi had almost 40 percent of the market
for low-pressure methanol plants. The process can handle synthesis gas obtained from a
wide variety of feedstocks from natural gas to coal. Twenty-nine methanol plants had
been built using Lurgi’s methanol technology as of 1997 (SRI, 1999). Eastman Chemical
Company in Kingsport, Tennessee has the only coal-based commercial plant in the
United States.
The converter or the synthesis reactor is operated at temperatures ranging from
250 oC to 260 oC. The operating pressure is 50 atm to 60 atm. The design of the converter
is different from that of ICI. In the ICI design, the catalyst forms a bed in which gas is
introduced at various locations all along the length of the bed to get a uniform
temperature distribution. The Lurgi design is comprised of a shell and tube reactor where
the tubes are packed with catalyst and the heat of reaction is removed by circulating
water on the shell side thereby generating high-pressure steam on the shell side.
The synthesis gas is generated either by the steam-reforming route or by the
partial oxidation route. The steam reformer is typically operated at 850 oC to 880 o C
where the previously desulfurized naphtha is contacted with steam to produce syngas
(Twigg, 1989). Figure 4-3 shows the simplified flowsheet for the Lurgi low-pressure
process. The syngas is compressed in a centrifugal compressor to 50 atm to 80 atm and

70
fed to the reactor. In the second route of partial oxidation, the heavy residues are fed into
the furnace along with oxygen and steam. The feedstock gets partially oxidized at 1400
oC to1450 o C. The operating pressure of the partial oxidizer is 55 atm to 60 atm and there
is no need for syngas compression (Supp, 1981). The gas is cleaned to remove H2S and
free carbon, and a shift conversion is necessary to adjust the hydrogen to carbon
monoxide ratio. The remaining process after the reactor involves cooling of the reactor
effluent to condense the methanol, which is then sent to a separator and finally to a
distillation column for methanol purification. The process after the methanol reactor is
similar to the ICI low-pressure process. The major advantages of the Lurgi process are:
1) High heat-transfer area to catalyst bed volume ratio (ca. 80 m2/m3) and the resulting
low temperature drop across the tube wall imply that temperature and hence
selectivity control is easy.
2) The system is relatively insensitive to changes in feed gas temperature and features
direct bed temperature control via shell pressure.
3) Largely complete utilization of reaction heat for the generation of high-pressure
steam. When preheating feed water to boiling, 40 atm steam at a rate of 1.4 ton/ton
methanol can be produced.
4) For the tube diameters chosen, the maximum temperature differential between the
water and tube centerline is calculated to be about 11 oC because of the intensive
cooling with boiling water around the tubes, thereby giving the reactor nearly
isothermal operation and hence better equilibrium.
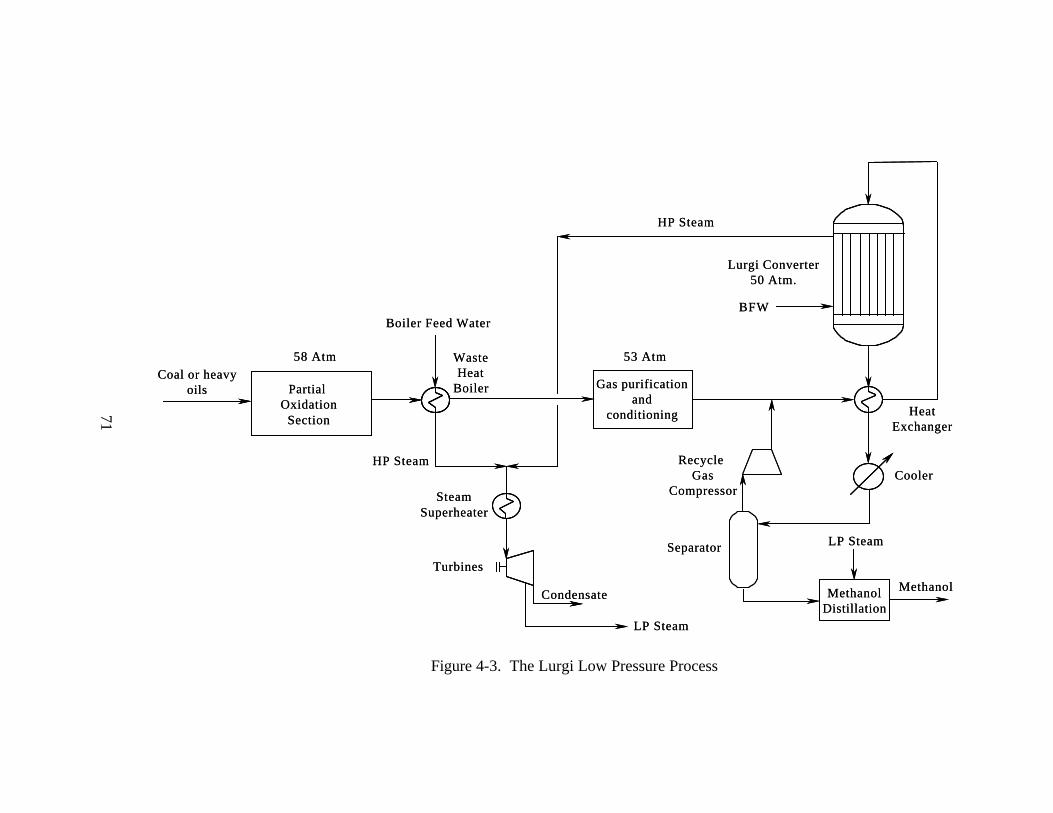
71
Figure 4-3. The Lurgi Low Pressure Process
BFW
HeatExchanger
CoolerRecycle
GasCompressor
Separator LP Steam
MethanolMethanolDistillation
Condensate
LP Steam
SteamSuperheater
Gas purificationand
conditioning
Partial Oxidation
Section
Coal or heavyoils
Boiler Feed Water
HP Steam
Lurgi Converter50 Atm.
58 Atm WasteHeat
Boiler
HP Steam
Turbines
53 Atm
71
72
The main limitation of the Lurgi low-pressure process is intractability of the
system as far as scale-up beyond a certain limit is concerned. The problem stems from
mechanical design of the tube-sheet, and its integrity becomes questionable at diameters
greater than about 6 m. Maximum unit capacity is 900 ton/day to 1250 ton/day of
methanol (Zardi, 1982). This is well short of the single train capacities envisaged for
synfuel plants.
4.1.3 The MGC Low-Pressure Process
Mitsubishi Gas Chemical Company developed MGC low-pressure process. This
process uses a copper-based methanol-synthesis catalyst and is operated at temperatures
of 200 oC to 280 o C over a pressure range of 50 atm to 150 atm. The temperature in the
catalyst bed is controlled by using a quench-type converter design, as well as by
recovering some of the reaction heat in an intermediate stage boiler. The process uses a
hydrocarbon feedstock. The feed is desulfurized and then fed into a steam reformer at
500 o C. The exit stream from the reformer contains hydrogen, carbon monoxide, and
carbon dioxide at a temperature of 800 oC to 850 o C. The gases are then compressed in a
centrifugal compressor and mixed with the recycled stream before being fed into the
methanol reactor (converter).
73
4.1.4 Liquid Phase Methanol Process
In a conventional methanol production process, methanol is synthesized in a gas
phase reaction over a heterogeneous catalyst from a synthesis gas that consists primarily
of hydrogen, carbon monoxide and carbon dioxide. Newer processes for methanol are
focused on the use of CO-rich synthesis gas instead of H2 rich synthesis gas, thereby
utilizing cheaper synthesis gas for the production of methanol. One of the promising
technologies utilizing CO-rich synthesis gas is liquid phase methanol synthesis process
(also known as LPMEOH™ process) that was conceived by Chem Systems, Inc., in 1975.
The LPMEOHTM technology has been developed by Air Products and Chemicals Inc.
Since the 1980’s, the process has been successfully demonstrated on a bench-scale in a
Department of Energy (DOE) – owned process and hydrodynamics development unit in
LaPorte, Texas.
The LPMEOH process is not commercialized yet. However, a commercial scale
demonstration plant began operation in April 1997 at Eastman Chemical Company,
Kingsport, TN. It has a four year operating program scheduled to end in 2001 during
which the demonstration plant intends to meet or exceed the design production capacity
of 260 TPD of methanol, and will simulate operation of the integrated gasification
combined cycle (IGCC) coproduction of power and methanol.
74
The test plan will also seek to establish commercial acceptance of the technology
and verify the fitness of the as-produced methanol product (ranging from 97.5 weight
percent to 99.99 weight percent purity depending on purification conditions chosen)
through a series of off-site, product-use test.
The production of methanol by a LPMEOH process involves three phases: (1) the
catalyst (solid phase); (2) inert hydrocarbon oil (liquid phase); and (3) the synthesis gas
(gas phase). The process is illustrated in Figure 4-4. The reaction takes place in a
fluidized bed reactor within the synthesis section of the methanol plant. The synthesis gas
containing CO, H2, and CO2 is passed upward into the reactor concurrent with the inert
liquid hydrocarbon. At the top of the reactor, product gases separate leaving behind the
catalyst and liquid hydrocarbon. The heat generated in the reactor is used to generate
high-pressure steam in the reactor’s internal heat exchanger. The effluent gases from the
reactor are then cooled and condensed. The unreacted gases are recycled after
compression in a recycle gas compressor. The methanol produced can be purified by
distillation to produce chemical grade methanol.
The single pass conversion of syngas in LPMEOH reactor, though higher than the
conventional gas phase technology, is limited (Brown and Frenduto, 1992). For the
syngas richer in hydrogen, there is lot of unconverted hydrogen after the methanol
reaction in LPMEOH reactor. The unconverted syngas therefore needs to be recycled
back to the reactor in order to produce additional methanol. This scenario of methanol
production is known as LPMEOH process with recycle. Alternative scenario, once-
75
through-methanol (OTM) production, is the case in which unreacted syngas after single
pass through LPMEOH reactor is sent to combustion facility for the generation of steam
(Street, 1999). In an IGCC system combined with LPMEOH process, the unconverted
syngas would be returned to the IGCC power plant’s combustion turbines (Heydorn et
al., 1998). The following sub-section presents the main advantages of the LPMEOH
process over current technologies.
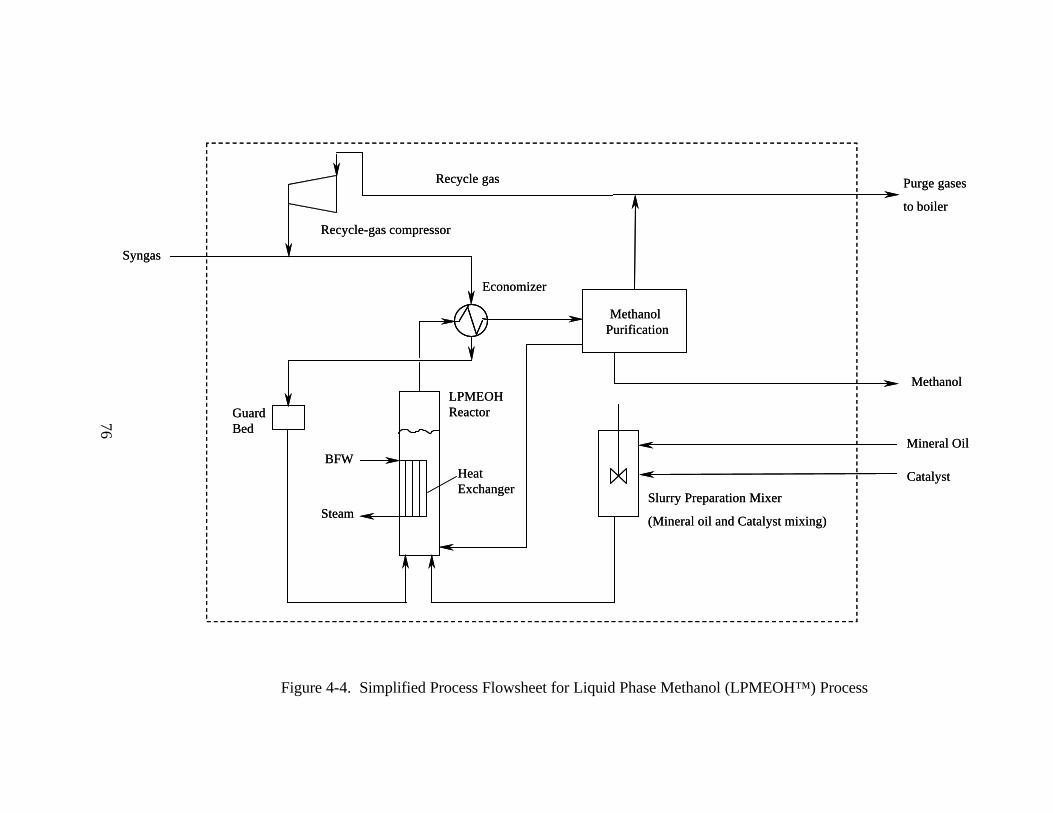
76
Figure 4-4. Simplified Process Flowsheet for Liquid Phase Methanol (LPMEOH™) Process
Purge gases
to boiler
Methanol
Mineral Oil
Catalyst
Guard Bed
LPMEOH Reactor
BFW
SteamSlurry Preparation Mixer
(Mineral oil and Catalyst mixing)
Recycle-gas compressor
Syngas
MethanolPurification
Recycle gas
Heat Exchanger
Economizer
Purge gases
to boiler
Methanol
Mineral Oil
Catalyst
Guard Bed
LPMEOH Reactor
BFW
SteamSlurry Preparation Mixer
(Mineral oil and Catalyst mixing)
Recycle-gas compressor
Syngas
MethanolPurification
Recycle gas
Heat Exchanger
Economizer
76
77
4.1.4.1 Advantages of Liquid Phase Process over Current Technologies
This section presents the advantages of LPMEOH process technology over the
conventional gas phase methanol production process. The main advantages of LPMEOH
process over the gas phase technology are (Cook, 1995; Heydorn et al., 1998):
1) Because of the LPMEOH reactor’s ability to control temperature, it is able to directly
process syngas that is rich in CO and CO2. The gas phase methanol technology would
require such a feedstock to undergo stoichiometric adjustment by water-gas shift
reaction, described in Section 4.1.5, to increase the H2 content and achieve
temperature moderation by recycling large amounts of H2 rich syngas since H2 has
higher heat capacity as compared to CO.
2) Due to good control of reaction temperature, it is possible to achieve high per pass
conversion economically such that the methanol concentration in the exit gas attains
the 15 to 20 volume percent range as compared to normal value of 5 to 6 volume
percent for the syngas with H2/CO ratio of equal to or greater than two. This greatly
reduces recycling and compression requirements.
3) The heat of reaction can be effectively used to generate high-pressure steam.
4) The reactor design allows for liquids and gases to be readily distributed across the
reactor cross-sectional area without the necessity for redistribution and quench along
the reactor length.
5) Catalyst can be added and withdrawn from the system while on-stream without the
necessity of shut-down.

78
6) A smaller catalyst size can be used which leads to higher rates of reaction as
compared to larger catalyst particles.
7) Because of the near isothermal temperature of the reactor, nearly optimum conditions
prevail in the system favoring the reaction kinetics.
8) The axial diffusivity of the gas in three-phase process is relatively low as compared to
gas-solid fluidized bed, making high per pass conversion easier to achieve.
4.1.4.2 Drawbacks of the Liquid Phase Methanol Process
This section presents the main limitations of the LPMEOH process technology
with respect to conventional gas phase technologies. The main limitations of LPMEOH
process are:
1) Liquid phase diffusivities of the reactants are lower than those in the vapor phase.
2) The solubility of the reactants in the liquid medium must be sufficiently high for the
process to be efficient.
3) The liquid chosen for the reaction system should be chemically inert and thermally
stable and have low vapor pressure at operating conditions.
4) Problems of catalyst attrition may occur due to fluidization of catalyst in mineral oil.
4.1.5 Water-gas Shift Reaction
The water-gas shift reaction, as described by Equation 4-2, is employed to
stoichiometrically adjust the H2/CO ratio of syngases that are rich in CO. The
79
conventional gas phase process does not have a capability to operate on raw material
syngas that has less than a stoichiometric amount of H2. Therefore the syngas which is
rich in CO (e.g. syngas obtained from coal gasification) needs to be sent to a water-gas
shift converter to adjust the H2/CO ratio to near stoichiometric (2 to 2.1) for higher
methanol yields (Twigg, 1989).
LPMEOH methanol process has a capability to operate on CO rich syngas and the
syngas feed does not require any water gas shift reaction for stoichiometric adjustment.
However, the conversion per pass in the LPMEOH reactor for CO-rich syngas is low and
the methanol yield is also low. One methanol production option using high CO syngas is
the once-through-methanol (OTM) process described in Section 4.1.4, where the
unreacted syngas after a single reactor pass can be sent to steam boiler for steam
generation or it can be returned to IGCC power plant combustion turbines if an integrated
methanol plant with IGCC is used. In another option, the LPMEOH reactor design can be
altered to generate additional H2 via water-gas shift reaction in the LPMEOH reactor. The
inherent shift activity of the methanol reactor can be utilized to accommodate a modest
amount of shift activity within the reactor. This can be done by the addition of water, as
steam, to the syngas before it passes through the LPMEOH reactor. Within the reactor,
the steam is converted to H2, which is in turn converted to methanol. In the case of water
addition, the increase in conversion would be accompanied with a modest increase of
water in the crude methanol product and of CO2 in the reactor effluent gas (Tijm et al.,
1997).
80
This option is being thought of and being simulated in a proprietary model by Air
Products and Chemical, Inc but no operational experience of this option is available in
literature.
4.2 Commercial Status of Liquid Phase Methanol (LPMEOHTM) Technology
Coal is the most abundant domestic energy resource in the United States. The
Fossil Energy division within the U.S. Department of Energy (DOE) has been supporting
a coal liquefaction program to develop improved technologies for converting coal to
clean and cost-effective liquid fuels to complement the supply of petroleum crude.
Indirect and direct liquefaction routes are the two technologies being pursued under the
DOE coal liquefaction program. In indirect liquefaction, coal is gasified in the presence
of steam and oxygen to produce a synthesis gas containing mostly carbon monoxide and
hydrogen. This synthesis gas, after being cleaned of impurities and adjusted to the desired
H2/CO ratio (if required), is converted to liquid fuels in the presence of catalysts. The
conversion of syngas to motor fuels is known as Fischer-Tropsch (F-T) synthesis.
Commercial indirect liquefaction plants in operation since 1955 have included coal based
plants in South Africa and the U.S. In all these plants, the syngas is converted in gas
phase reactors (Shen, 1996). Because of the highly exothermic reactions, it has long been
known that a liquid phase reactor could offer cost and operational advantages over gas
phase reactors due to its effective heat transfer capabilities.

81
Chem Systems Inc. conducted bench-scale development of the liquid phase
methanol process in the mid-1970s, with support from the Electric Power Research
Institute (EPRI). The project involved bench-scale and process development unit (PDU)
testing of a new liquid-phase reactor. While it was demonstrated that methanol could be
produced from coal-derived syngas, attempts to produce an active, attrition resistant
catalyst were not completely successful as judged by low catalyst life during catalyst
testing. Table 4-2 summarizes the project results.
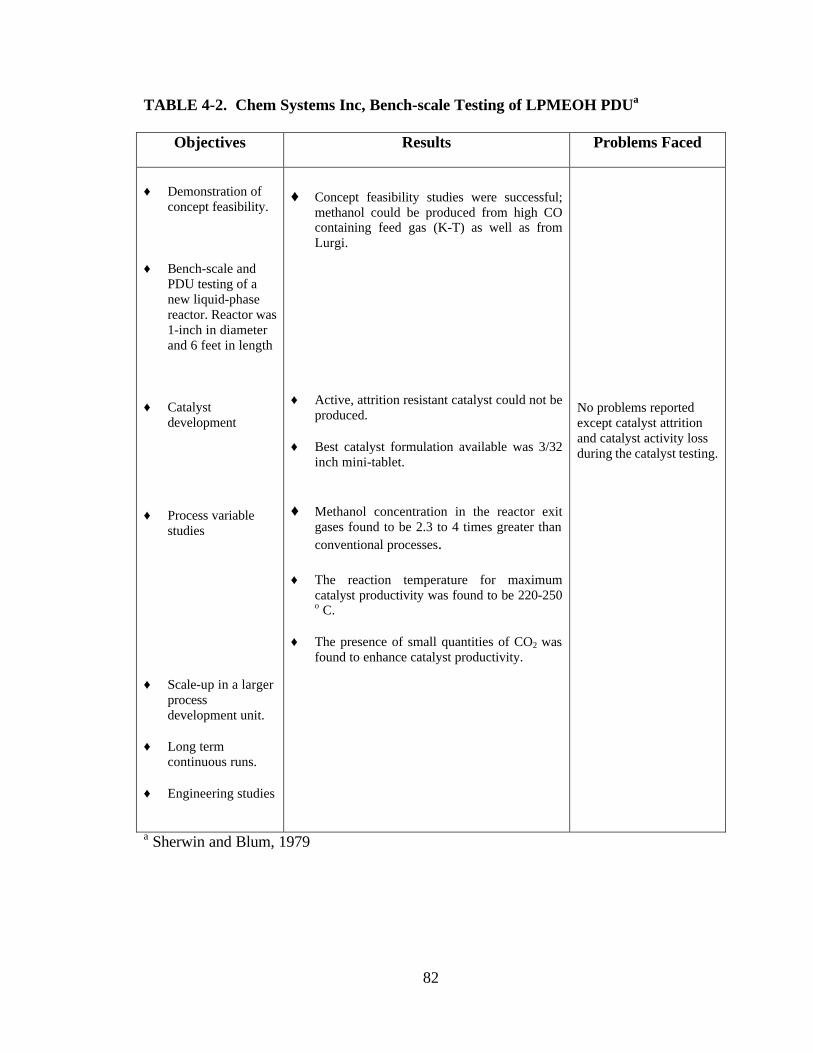
82
TABLE 4-2. Chem Systems Inc, Bench-scale Testing of LPMEOH PDUa
Objectives Results Problems Faced
♦ Demonstration of
concept feasibility. ♦ Bench-scale and
PDU testing of a new liquid-phase reactor. Reactor was 1-inch in diameter and 6 feet in length
♦ Catalyst
development ♦ Process variable
studies ♦ Scale-up in a larger
process development unit.
♦ Long term
continuous runs. ♦ Engineering studies
♦ Concept feasibility studies were successful;
methanol could be produced from high CO containing feed gas (K-T) as well as from Lurgi.
♦ Active, attrition resistant catalyst could not be
produced. ♦ Best catalyst formulation available was 3/32
inch mini-tablet.
♦ Methanol concentration in the reactor exit gases found to be 2.3 to 4 times greater than conventional processes.
♦ The reaction temperature for maximum
catalyst productivity was found to be 220-250 o C.
♦ The presence of small quantities of CO2 was
found to enhance catalyst productivity.
No problems reported except catalyst attrition and catalyst activity loss during the catalyst testing.
a Sherwin and Blum, 1979
83
In 1981, DOE, in cooperation with industrial organizations, began to support a
research and development program to advance the liquid phase reactor technology for
coal based syngas. Air Products and Chemicals, Inc. (APCI), with the support of DOE,
began a research and development project in September 1981 as a part of DOE’s indirect
liquefaction program to further develop LPMEOHTM at a process demonstration unit
(PDU) scale. The PDU scale development began in 1981 with the construction of a 5-ton
per day (TPD) nameplate capacity methanol plant located in LaPorte, Texas (Shen,
1996). Chem Systems Inc., being the inventor of the process, was the key subcontractor
in the program. Industrial cost sharing participants were APCI, EPRI, and Fluor
Engineers, Inc. The primary function of the LaPorte PDU was to acquire data at a small,
representative engineering scale for testing the feasibility of the LPMEOH process. The
process was successfully demonstrated and extensively proven in over 7,400 hours of test
operation (Shen, 1996). Table 4-3 presents a summary of the operational experience at
LaPorte PDU.

84
TABLE 4-3. LPMEOHTM PDU, LaPorte, Texasa
Objectives Overall Results Problems
♦ To acquire data at a small
representative engineering scale for testing the feasibility.
♦ Test the plant over the
range of operating conditions.
Five major runs were conducted. 1) 10-day shakedown run. 2) 40-day continuous run on
CO-rich syngas. 3) Use of commercially
available catalyst powder at high slurry concentration.
4) 40-day run to demonstrate improved activity using catalyst powder that had been reduced in-situ.
5) 10-day run to demonstrate in-situ reduction of a high slurry concentration and to obtain performance data with high solids loading.
♦ 7,400 hours of successful operation. ♦ 99+ % onstream factor. ♦ Confirmation of simple reactor design.
♦ Easy accommodation of shutdowns/restarts/ load increase.
♦ Long catalyst life. ♦ Successful operation at high slurry
concentration (50 wt%) ♦ High production rates, 12+ TPD of fuel
grade methanol at 97.5 wt % methanol product purity (as produced)
♦ Maintenance of production rate with
online addition of fresh catalyst. ♦ Good laboratory-to-pilot plant
agreement on scale-up.
No problems were reported.
a Frank, 1989
85
The first commercial-scale demonstration plant for the technology has been
constructed and operating at Eastman Chemical Company’s coal gasification facility in
Kingsport, Tennessee with the help of a $92.7 million award under the DOE’s Clean Coal
Technology Program. The estimated total cost of the project including the four-year
demonstration test program is $213.7 million. Air Products and Eastman formed the “Air
Products Liquid Phase Conversion Co., L.P.” partnership to execute this demonstration
project. The plant has been in operation since April 1997. The demonstration plant has a
design capacity of 80,000 gallons of methanol per day (260 TPD). The partnership will
own and operate the facility for the four-year demonstration period.
As documented in the DOE reports on the commercial scale demonstration of the
LPMEOHTM process, the demonstration plant, during its four-year operating program is
intended to meet or exceed the design production capacity of 260 TPD of methanol, and
simulate operation for the integrated gasification combined cycle (IGCC) coproduction of
power and methanol application (Air Products and Chemicals, Inc, 1997). The project, as
reported, is intended to establish the commercial acceptance of the technology and verify
the suitability of the as-produced methanol product (approximately 98-weight percent
purity) through a series of off-site, product-use tests. The ultimate goal of the
demonstration period is to reach a stable, optimized operating condition, with the best
combination of the operating parameters. The operational experience and the results to
date are included in Table 4-4.

86
TABLE 4-4. Commercial Scale Demonstration of LPMEOHTM Process, Kingsport (260 TPD Plant)a
Objectives Results as of Oct. 1999 Problems
The ultimate goal of the demonstration period is to reach a stable, optimized operating condition, with the best combination of the most aggressive operating parameters. The test plan outline for 4 years will be: Year 1: ♦ Studies on catalyst aging. ♦ Process Optimization using parameters
such as catalyst slurry concentration, reactor slurry level and gas superficial velocity.
Year 2 and 3: ♦ Catalyst Attrition/poisons/activity/aging
tests. ♦ Simulation of IGCC coproduction for
various commercial gasifiers. ♦ Studies of maximum throughput and
production rate. Year 4: ♦ Test for 99% availability. ♦ Potential alternative catalysts test and
additional industry user test
♦ Methanol production
reached nameplate capacity of 260 TPD and a stable test period at over 300 TPD of methanol revealed no system limitations in reactor or distillation areas.
♦ During initial operating
period, the plant achieved an availability in excess of 92%.
♦ Availability during 1998
has been reported to be above 99%.
♦ Higher levels of iron
and arsenic were found on catalyst that could not be correlated to presence of iron carbonyl in feed gas.
♦ Fresh charge of catalyst
was introduced in December 1997.
♦ Variability in catalyst
performance attributed to presence of trace levels of catalyst poisons (iron, sulfur, arsenic, etc.).
♦ Two high-pressure
oil make-up pumps failed to generate the differential pressure required for their service due to which connection at the reactor was blocked.
♦ The catalyst
samples showed higher levels of iron and arsenic.
♦ The catalyst showed
variability in its performance due to which reactor temperature varied from 220 oC to 250 oC during 8 months period after the fresh catalyst charge was introduced.
a Heydorn et al., 1998 b Tijm et al., 1999
87
4.3 Modeling Process Flowsheets in ASPENPLUS
ASPEN PLUS is a process simulation package that solves steady-state material and
energy balances, estimates physical properties of a large number of species, calculates
phase and chemical equilibria, and sizes and costs various types of process units (Aspen
Technology, Inc., 1996). ASPEN stands for Advanced Systems for Process Engineering.
It was originally developed under government contract for the Department of Energy
(DOE) by Massachusetts Institute of Technology in 1987. ASPEN PLUS is a commercial
version developed by Aspen Technology, Inc. (AspenTech) and is widely used in process
industries.
AspenTech developed ModelManager, a graphical user interface (GUI) program to
simplify building a flowsheet and running process simulation. The user creates a
schematic process flowsheet using ModelManager which then translates the flowsheet
into the equivalent ASPEN PLUS input file and runs the simulation. (AspenTech, 1996).
The ASPEN PLUS framework includes a number of generalized unit operations
“blocks”, which are models of specific process operations or equipment (e.g., chemical
reactions, pumps, compressors, distillation columns, etc.). By specifying configurations
of unit operations and the flow of material, heat, and work streams it is possible to
represent a process plant in ASPEN PLUS. In addition to a varied set of unit operation
blocks, ASPEN PLUS also contains an extensive physical property database and
88
convergence algorithm for calculating results in closed loop systems, all of which make
ASPEN PLUS a powerful tool for process simulation (Akunuri, 1999).
ASPEN PLUS uses a sequential-modular approach to flowsheet convergence. In
this approach, mass and energy balances for individual unit operation blocks are
computed sequentially, often in the same order as the sequencing of mass flows through
the system being modeled. However, when there are recycle loops in an ASPEN PLUS
flowsheet, stream and block variables have to be manipulated iteratively in order to
converge upon the mass and energy balance. ASPEN PLUS has a capability for
converging recycle loops using a feature known as “tear streams”.
In addition to calculations involving unit operations, there are other types of block
used in ASPEN PLUS to allow for iterative calculations or incorporation of user-created
code. These include Design Specifications and FORTRAN blocks.
A Design Specification is used for feedback control. The user can set any
flowsheet variable or function of flowsheet variables to a particular design value. A
stream variable or block input variable is designated to be manipulated in order to
achieve the design value. FORTRAN statements can be used within the design
specification block to compute design specification values.
FORTRAN blocks are used for feedforward control. Any FORTRAN operation
can be carried out on flowsheet variables by using in-line FORTRAN statements that
89
operate on these variables. FORTRAN blocks are one method for incorporating user code
into the model. It is also possible to call any user-provided subroutine from either a
design specification or FORTRAN block.
4.4 Technical Description of the Liquid Phase Methanol (LPMEOHTM) Process
This section discusses the technical basis for the liquid phase methanol
(LPMEOHTM) process. First, the general description and process flow sheet is presented.
The process chemistry and the issues related to it are then discussed. Finally, the unit
operations involved in the process and design variables are presented with their typical
values, many of which were based on a visit to the LPMEOHTM process demonstration
facility at Kingsport, TN (October 14, 1999).
4.4.1 LPMEOHTM Process Description
Eastman Chemical uses the Texaco gasification process to convert about 1,000
tons-per-day of high sulfur, eastern bituminous coal to syngas for the manufacture of
methanol, acetic anhydride, and associated products. The crude syngas is quenched,
partially shifted via water gas shift reaction (Equation 4-2), treated for acid gas removal
(hydrogen sulfide, carbonyl sulfide, and CO2) via the Rectisol® process, and partially
processed in a cryogenic separation unit to produce separate H2 and CO streams. The H2
stream is combined with clean syngas to produce a stoichiometrically balanced feed for a
conventional gas-phase Lurgi methanol synthesis unit that was already present at the
90
facility, which is further polished in an arsine- and sulfur-removal guard bed.
Approximately 50 percent of the balanced gas fresh feed to the existing methanol unit is
diverted to the LPMEOHTM PDU.
Figure 4-5 shows a simplified process flow diagram of the LPMEOHTM
demonstration plant at Kingsport. The balanced gas fresh feed is passed through an
activated carbon guard bed. This bed removes iron and nickel carbonyls, which are
poisons to the methanol synthesis catalyst, down to ppb levels. Because the third feed
stream (H2 gas) is at lower pressure than the other two streams, it can be combined when
appropriate with the recycle gas stream, made up of unconverted syngas from the
LPMEOHTM reactor, and compressed in the recycle gas compressor. These streams are
then combined to form one high-pressure (nearly 750 psia) reactor feed gas stream that is
preheated in the feed/product economizer against the reactor effluent to a temperature of
330 oF. The feed gas is then sparged into the LPMEOHTM reactor (7.5 ft in diameter)
operating at a temperature of 481 oF and approximately 721 psia pressure, where it gets
mixed with the catalyst slurry and is partially converted to methanol vapor, liberating the
heat of reaction in the slurry (Air Products and Chemicals, Inc., 1997). Varying the steam
temperature within the heat exchanger tubes controls the temperature inside the reactor,
which in turn is controlled by adjusting the steam pressure. Saturated steam at 300 psia is
produced from boiler feed water (BFW) in the internal heat exchanger of the reactor
(Street, 1999).
91
Disengagement of the effluent gas (methanol vapor and unreacted syngas) from
the catalyst/oil slurry occurs in the freeboard region of the reactor. Any entrained slurry
droplets leaving the top of the reactor are collected in the cyclone separator, where a
pressure drop of approximately 6 psia occurs (Street, 1999). The product gas passes
through the tubeside of the feed/product economizer, where it is cooled against the
reactor inlet gas stream. Any condensed oil droplets are collected in the high-pressure oil
separator and then returned to the reactor with the entrained slurry from the cyclone
separator.
The product gas is cooled further in a series of air-cooled and cooling water
exchangers to a temperature of approximately 100 oF, where product methanol condenses
and collects in the high-pressure methanol separator (Street, 1999). Most of the unreacted
synthesis gas returns to the reactor after undergoing compression in the recycle
compressor. The balance of the unreacted syngas is purged to the fuel gas system.
The condensed methanol contains dissolved gases, water, trace oil, and some
higher alcohols. These impurities are removed in a two-column distillation train that
produces a methyl acetate feed-grade methanol product. The bottom draw from the
second column is a crude methanol stream heavy in higher alcohols, water, and any oil
carried over from the reactor.
92
Catalyst slurry is activated in the catalyst reduction vessel, which is equipped with
a heating/cooling jacket, utility oil skid, and agitator. Pure CO, diluted with nitrogen, acts
as the reducing agent for the activation of the catalyst.
For a commercial plant, it would be desirable to use the water-gas shift reaction
for syngas compositions lower in hydrogen content (Tijm et al., 1997). This can be done
in the manner explained in Section 4.1.5. However, the LPMEOH process model
developed in this study does not include the option of water-gas shift reaction.
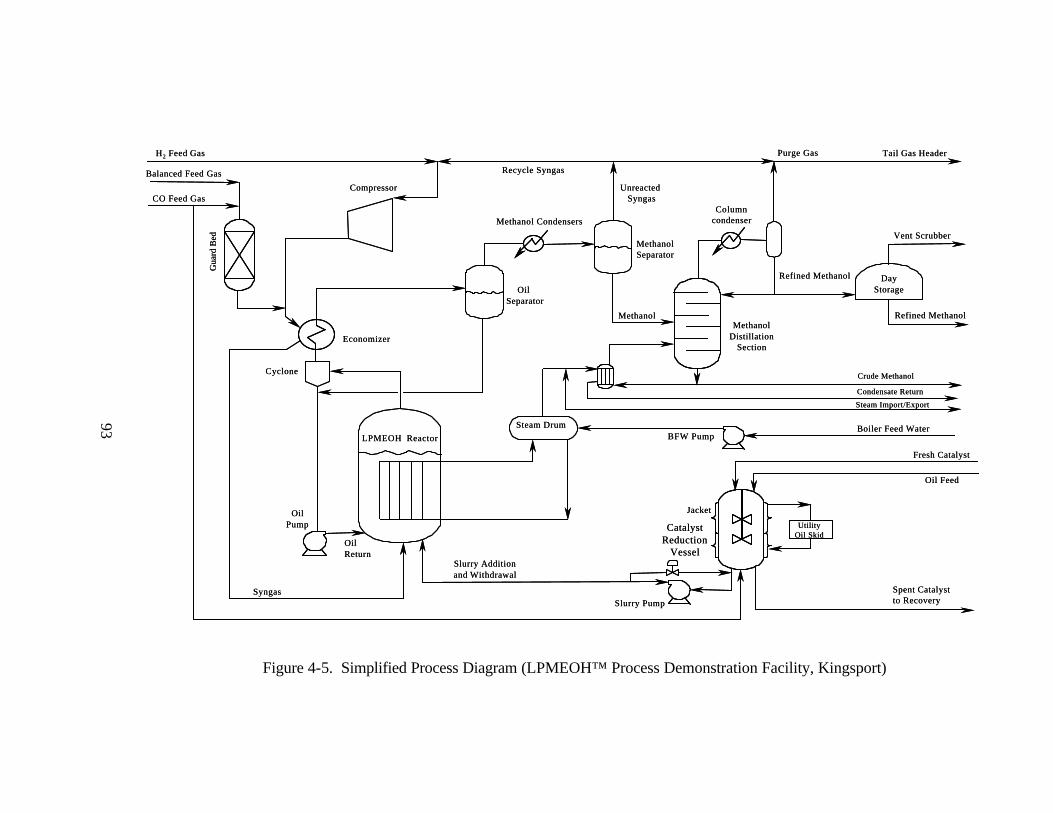
93
Figure 4-5. Simplified Process Diagram (LPMEOH™ Process Demonstration Facility, Kingsport)
UtilityOil Skid
H2 Feed Gas
Balanced Feed Gas
CO Feed Gas
Gua
rd B
ed
Compressor
Economizer
Cyclone
LPMEOH Reactor
Steam Drum
OilReturn
Syngas Spent Catalyst to Recovery
Catalyst Reduction
VesselSlurry Addition and Withdrawal
Oil Separator
Methanol Condensers
MethanolSeparator
MethanolMethanol
DistillationSection
Refined Methanol DayStorage
Vent Scrubber
Refined Methanol
Crude Methanol
Condensate Return
Fresh Catalyst
Oil Feed
Unreacted Syngas
Recycle Syngas
Purge Gas Tail Gas Header
Boiler Feed Water
Jacket
Slurry Pump
BFW Pump
Columncondenser
OilPump
Steam Import/Export
93
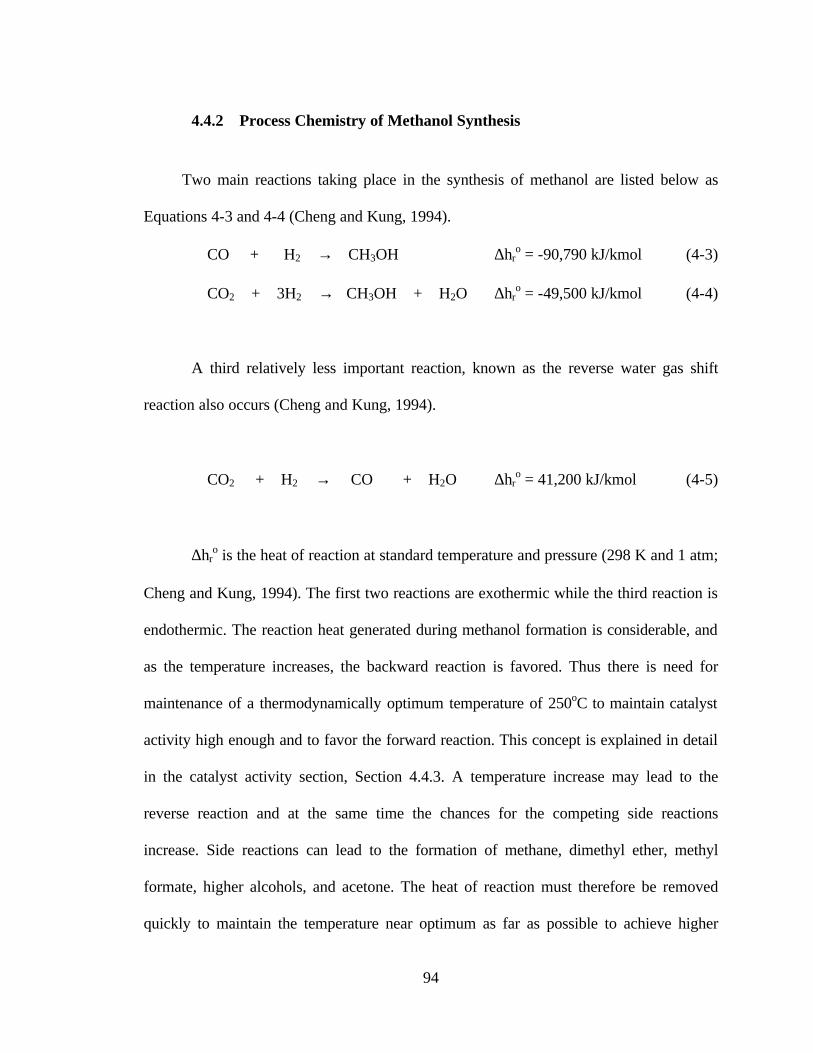
94
4.4.2 Process Chemistry of Methanol Synthesis
Two main reactions taking place in the synthesis of methanol are listed below as
Equations 4-3 and 4-4 (Cheng and Kung, 1994).
CO + H2 → CH3OH ∆hro = -90,790 kJ/kmol (4-3)
CO2 + 3H2 → CH3OH + H2O ∆hro = -49,500 kJ/kmol (4-4)
A third relatively less important reaction, known as the reverse water gas shift
reaction also occurs (Cheng and Kung, 1994).
CO2 + H2 → CO + H2O ∆hro = 41,200 kJ/kmol (4-5)
∆hro is the heat of reaction at standard temperature and pressure (298 K and 1 atm;
Cheng and Kung, 1994). The first two reactions are exothermic while the third reaction is
endothermic. The reaction heat generated during methanol formation is considerable, and
as the temperature increases, the backward reaction is favored. Thus there is need for
maintenance of a thermodynamically optimum temperature of 250oC to maintain catalyst
activity high enough and to favor the forward reaction. This concept is explained in detail
in the catalyst activity section, Section 4.4.3. A temperature increase may lead to the
reverse reaction and at the same time the chances for the competing side reactions
increase. Side reactions can lead to the formation of methane, dimethyl ether, methyl
formate, higher alcohols, and acetone. The heat of reaction must therefore be removed
quickly to maintain the temperature near optimum as far as possible to achieve higher
95
conversion and yield. In LPMEOHTM process, this is accomplished by an inert mineral
oil, which acts as a heat carrier. The common side reactions that may take place are
(Meyers, 1984):
2CH3OH → CH3OCH3 + H2O (4-5)
H2 + CO → HCHO (4-6)
CO + 3H2 → CH4 + H2O (4-7)
2nH2 + nCO → CnH2n+1OH + (n-1) H2O (4-8)
The typical operating condition for the LPMEOHTM process reactor is 50 atm to
100 atm pressure, and near 250 oC temperature. The composition of the catalyst is
proprietary but it consists of copper and zinc oxides in their reduced form.
4.4.3 Catalyst Activity
The role of the catalyst is to increase the rate(s) of the desired reaction(s) under
favorable thermodynamic conditions. The reaction of H2 with carbon monoxide and
carbon dioxide is exothermic and relies on the catalyst. For exothermic reactions, which
are favored at lower temperature, it is the catalyst that determines the lowest practical
operating temperature. The limitation imposed by low temperature catalysts is that their
activity is also a function of temperature. Thus if the reactor temperature drops too low,
the catalyst itself becomes inactive and the reaction proceeds at very slow pace. At higher
temperatures the catalyst may be very active but again thermodynamics will favor CO
96
formation so that the rate of the desired reaction is again slow. At the same time, the
temperature should not be so high that it damages or degrades the catalyst activity. Thus a
reactor should be designed to operate in a regime where the desired reaction is
thermodynamically favored and catalyst activity is high. In such a case the driving force
of thermodynamics is fully utilized given the limitations of the catalyst. This regime
refers to the optimum range of temperature and leads to the definition of optimum
temperature as the temperature at which reaction rate(s) and catalyst life are optimized.
4.4.4 Major Process Equipment
The major process equipment used in the LPMEOHTM process are described in
this section.
4.4.4.1 Reactor
The heart of the LPMEOHTM plant is the reactor. The reactor size being used in
the Kingsport demonstration facility is based on the scale-up of the DOE-owned
Alternate Fuels Process Development Unit at LaPorte, Texas. The reactor is a stainless
steel clad carbon steel vessel designed for 1000 psig and 600 o F. The reactor at
Kingsport, along with supports, is 84-feet tall. Within the reactor, the copper/zinc oxide-
based catalyst is suspended in an inert mineral oil, which serves as the heat transfer
medium. The reactor has an internal heat exchanger for removal of the heat of reaction.
The general reactor schematic is presented in Figure 4-6. The feed gas is sparged into the
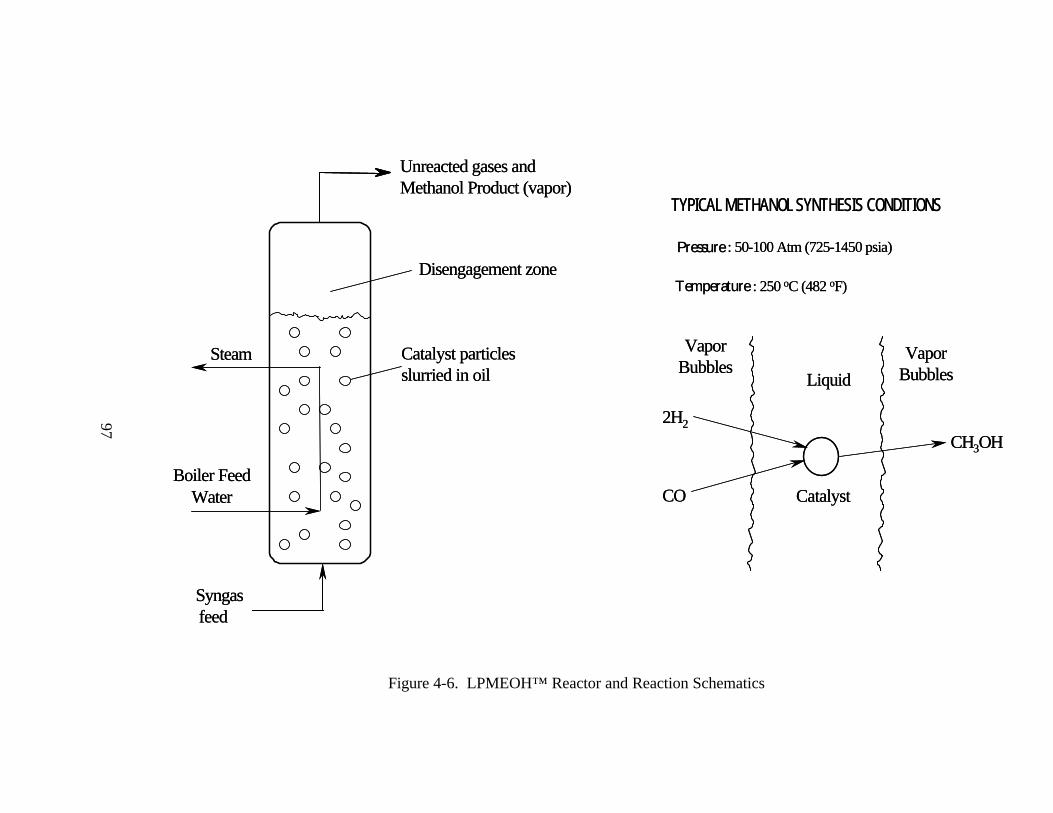
97
Figure 4-6. LPMEOH™ Reactor and Reaction Schematics
TYPICAL METHANOL SYNTHESIS CONDITIONS
Pressure : 50-100 Atm (725-1450 psia)
Temperature : 250 oC (482 oF)
CH3OH
CO
Liquid
Catalyst
VaporBubbles
VaporBubbles
2H2
Syngasfeed
Catalyst particlesslurried in oil
Disengagement zone
Unreacted gases andMethanol Product (vapor)
Boiler FeedWater
Steam
TYPICAL METHANOL SYNTHESIS CONDITIONS
Pressure : 50-100 Atm (725-1450 psia)
Temperature : 250 oC (482 oF)
CH3OH
CO
Liquid
Catalyst
VaporBubbles
VaporBubbles
2H2
Syngasfeed
Catalyst particlesslurried in oil
Disengagement zone
Unreacted gases andMethanol Product (vapor)
Boiler FeedWater
Steam
97
98
LPMEOHTM reactor, where it mixes with the catalyst slurry and is partially converted to
methanol, releasing the heat of reaction to the slurry. A typical pressure drop of 10 psi
occurs in the LPMEOH reactor sparger (Street, 1999).
The removal of heat of reaction is of prime importance. The rise of temperature
above the optimum temperature (approximately 250 oC) may reduce the catalyst activity
and lead to formation of undesirable products via side reactions. The feed gas pressure is
a prime determinant of the degree of syngas conversion. Reaction pressure for methanol
synthesis design is usually 750 psia or higher. The conversion increases as the operating
pressure increases but the capital cost of the reactor and the syngas compression cost also
increase with pressure.
The exit gases consist of methanol vapor, unconverted syngas and other
byproduct impurities produced by the side reactions within the reactor. The heat
generated in the reactor is used to produce steam in the internal heat exchanger, which is
supplied with boiler feed water (BFW).
Typical operating conditions of the reactor as evident from DOE quarterly and
topical reports on commercial scale demonstration of Liquid Phase Methanol
(LPMEOHTM) process are: (1) temperature of 250 oC; (2) pressure of 710 psig to 750
psig; and (3) syngas space velocity of 4000 to 8000 standard liters/kg-hr (Air Products
and Chemicals, Inc., 1997).

99
Depending on the reactor pressure, temperature, composition of the feed syngas,
the per pass conversion of syngas to methanol may typically vary from 15 percent to as
high as 60 percent. The variation of syngas conversion with pressure, syngas space
velocity and H2/CO ratio (composition of syngas) has been described in Section 4.5.4.1.
4.4.4.2 Guard Bed
The guard bed consists of two beds in series called the sections of the guard bed.
The first section consists of MnO as packing for the removal of H2S and arsenic. The
second section consists of activated carbon as packing for the removal of iron and nickel
carbonyls to ppb levels, which are poisons to methanol catalyst. The overall pressure
drop across the guard bed is approximately 6 psia (Street, 1999).
4.4.4.3 Economizer
The LPMEOHTM process includes an economizer to conserve the heat energy
within the process. The economizer is a heat exchanger, which allows for heat exchange
between the cold feed to the reactor and the hot product gas exiting the reactor. The cold
feed is on the shell side of the feed/product economizer and the hot product gas stream
passes through the tubeside.
100
4.4.4.4 Cyclone Separator
After the reaction has taken place on the surface of the catalyst, the products
diffuse back to the liquid phase. The disengagement of the effluent gas, which includes
methanol and unreacted gas, from the catalyst/oil slurry occurs in the freeboard region of
the reactor. A cyclone removes any entrained slurry droplets leaving the top of the
reactor. A pressure drop of approximately 6 psia occurs in the cyclone separator (Street,
1999). The collected slurry droplets from the cyclone are then returned to the reactor. The
exit gas from the cyclone then enters the tubeside of the feed/product economizer to
exchange heat with cold feed.
4.4.4.5 Oil Separator
After cooling of the hot exit gas from the reactor in feed/product economizer, the
gas is sent to a high-pressure oil separator. The function of this oil separator is to remove
any condensed oil droplets from the gas stream. The condensed oil collected is then
returned to the reactor with the entrained slurry from the cyclone separator.
4.4.4.6 Pre-Methanol Separator Condensers
The product gas from the oil separator is cooled by passing it through a series of
air-cooled and cooling water heat exchangers. These heat exchangers are known as pre-
methanol separator condensers.

101
4.4.4.7 Pre-Methanol Separator Valve
The function of the pre-methanol flash valve is to allow for the reduction of
pressure in the stream such that flashing of non-condensables can take place. The stream
after flashing enters the methanol separator for vapor-liquid phase separation.
4.4.4.8 Methanol Separator
Methanol and water condensed in a series of condensers enter the methanol
separator along with unreacted gases. Simple phase separation takes place in the
methanol separator, in which condensed liquid phase consisting mostly of methanol and
water is separated at the bottom and unreacted gases leave the top of separator in the gas
phase.
4.4.4.9 Pre-distillation Pressure Relief Valve
The condensed and phase separated liquid stream, consisting mainly of methanol,
enters the pre-distillation pressure relief valve for the reduction of pressure before it
enters the vapor distillation column for the removal of light gases/impurities.

102
4.4.4.10 Methanol Distillation and Purification Section
The purpose of the methanol distillation section is to produce high purity
methanol (>99 percent by weight). The distillation section consists of a two-column
distillation train. The first column is just a vapor recovery column and is used to remove
light impurities and gases. No methanol is taken out as a top product from this column.
The bottoms from the first distillation column flows as a feed to second distillation
column where 75 percent of the methanol in the feed is distilled to chemical grade
methanol (99.99 percent by weight) in the top product (Street, 1999). The bottom
product from the second column has methanol with 80 to 90 percent purity by weight,
with the balance being water, higher alcohols, and traces of oil. The bottom product is
sent to a third distillation column (not a part of LPMEOH process facility at Kingsport)
for the recovery of remaining methanol with 99.99 percent purity by weight as top
product (Street, 1999). The bottoms from this third column are sent to a wastewater
treatment facility. Use of thee distillation columns for methanol purification is a site-
specific issue at Kingsport. In a chemical plant, 99.99 percent purity of methanol can be
achieved using two distillation columns as modeled in this study (Street, 1999).
4.4.4.11 Recycle Gas Compressor
The unreacted gas from the methanol separator is recycled back to the reactor to
increase the conversion of syngas. This recycled gas is sent to the recycle gas compressor
to raise the pressure of the recycle gas such that it reaches the pressure required for
103
methanol synthesis reactor. A typical inlet pressure of recycle gases to the compressor is
700 psia and typical compressor outlet pressure is approximately 738 psia. Thus the
recycle gas compressor overcomes the overall pressure drop of 38 psi in the LPMEOH
process (Street, 1999).
4.4.4.12 Catalyst Reduction Vessel
In addition to the equipment already discussed, the LPMEOHTM plant has catalyst
activation facilities, consisting of an agitated catalyst reduction vessel, where powdered
catalyst in oxide form is combined with mineral oil to produce a slurry containing 30
percent catalyst by weight. After the agitator is stopped, reducing gas, consisting of a
blend of nitrogen and carbon monoxide, is introduced into the reduction vessel via a gas
distributor. The carbon monoxide reacts with the oxide form of the catalyst to convert it
to the active metallic form.
During the reduction, slurry temperature is carefully increased while the
consumption of carbon monoxide is monitored to determine when complete reduction has
occurred. After reduction, the catalyst is pumped to the LPMEOHTM reactor. Before fresh
slurry is added to the reactor, an equivalent amount of spent slurry is removed and sent to
metals recovery for safe disposal.
104
4.5 Major Process Sections in the LPMEOHTM Process Model in ASPENPLUS
Each major flowsheet section is described below. In the flowsheet, unit operation
models represent specific components of that process area. There are user-specified
inputs regarding key design assumptions for each unit operation model. The numerical
values of the design assumptions are presented in this section. Figure 4-7 presents the
LPMEOH process flowsheet as modeled in ASPEN PLUS with stream numbers. Table 4-
5 presents the description of various stream numbers used in Figure 4-7.
4.5.1 Guard Bed
The feed syngas flows through a guardbed, modeled as a unit operation of the
type “VALVE” with a block identification of “GRDBED”. The purpose of the guard bed,
as described previously, is to remove trace contaminants such as carbonyls and arsenic
from the feed stream. There is a pressure drop across the guard bed as the feed syngas
passes through it. For modeling purposes, we assume that the mass flow rate of the feed
gas is not altered due to removal of trace contaminants and the only change in the feed
gas is its exit pressure because of pressure drop. A pressure drop of approximately 6 psia
occurs across the guard bed (Street, 1999).
4.5.2 Feed-Recycle Mixer
After exiting the guard bed, the syngas mixes with the recycle stream of unreacted
gases in the process. The mixing of the fresh feed and the recycle gas is simulated by a

105
unit operation of the type “MIXER” with a block identification of “FRMIX”. The
combined feed from this block then enters the economizer.
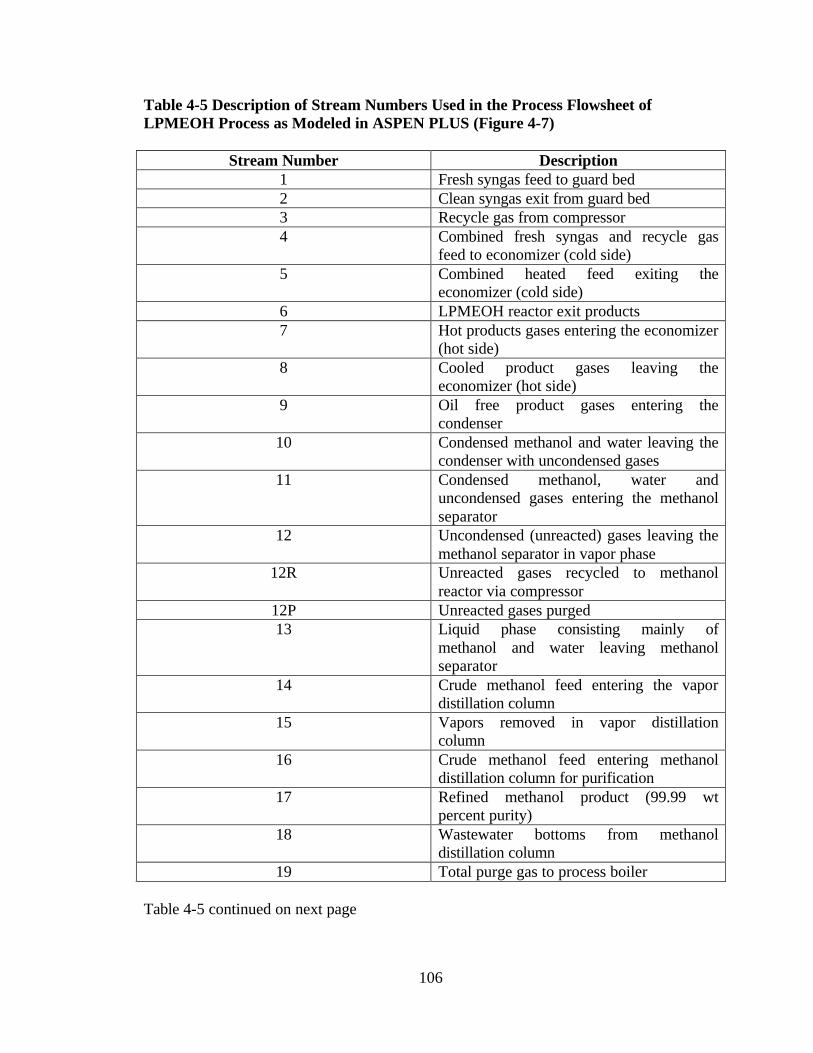
106
Table 4-5 Description of Stream Numbers Used in the Process Flowsheet of LPMEOH Process as Modeled in ASPEN PLUS (Figure 4-7)
Stream Number Description 1 Fresh syngas feed to guard bed 2 Clean syngas exit from guard bed 3 Recycle gas from compressor 4 Combined fresh syngas and recycle gas
feed to economizer (cold side) 5 Combined heated feed exiting the
economizer (cold side) 6 LPMEOH reactor exit products 7 Hot products gases entering the economizer
(hot side) 8 Cooled product gases leaving the
economizer (hot side) 9 Oil free product gases entering the
condenser 10 Condensed methanol and water leaving the
condenser with uncondensed gases 11 Condensed methanol, water and
uncondensed gases entering the methanol separator
12 Uncondensed (unreacted) gases leaving the methanol separator in vapor phase
12R Unreacted gases recycled to methanol reactor via compressor
12P Unreacted gases purged 13 Liquid phase consisting mainly of
methanol and water leaving methanol separator
14 Crude methanol feed entering the vapor distillation column
15 Vapors removed in vapor distillation column
16 Crude methanol feed entering methanol distillation column for purification
17 Refined methanol product (99.99 wt percent purity)
18 Wastewater bottoms from methanol distillation column
19 Total purge gas to process boiler Table 4-5 continued on next page
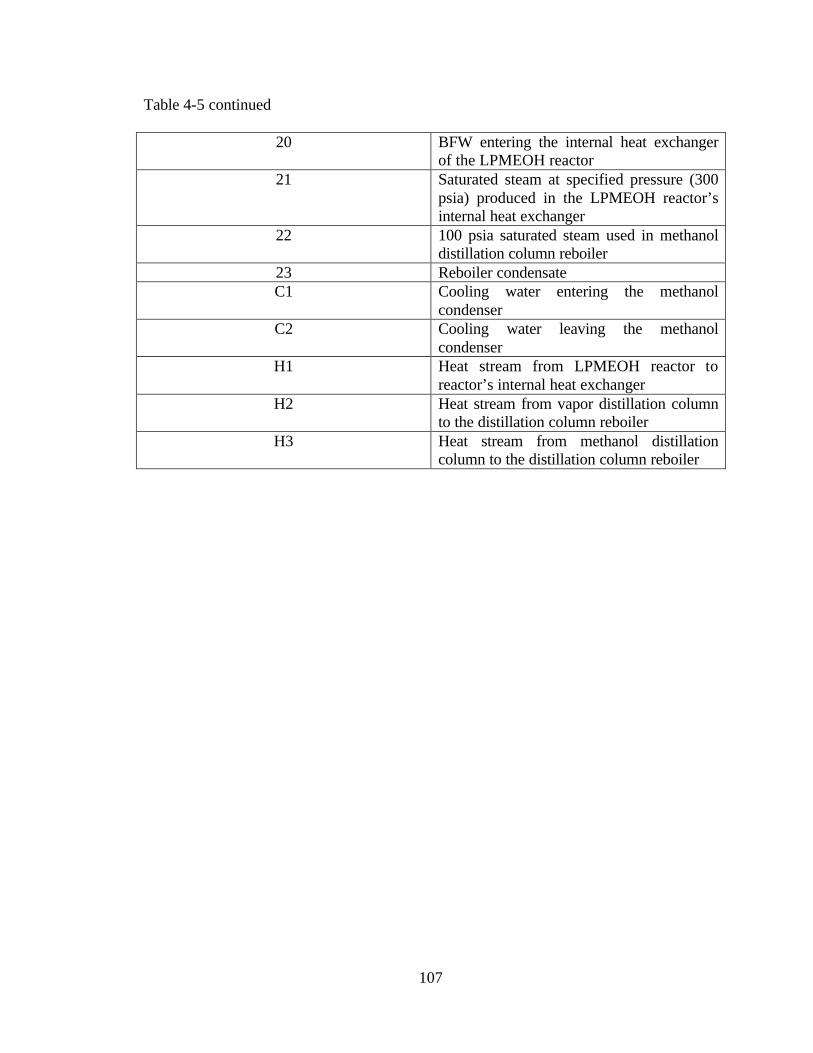
107
Table 4-5 continued
20 BFW entering the internal heat exchanger of the LPMEOH reactor
21 Saturated steam at specified pressure (300 psia) produced in the LPMEOH reactor’s internal heat exchanger
22 100 psia saturated steam used in methanol distillation column reboiler
23 Reboiler condensate C1 Cooling water entering the methanol
condenser C2 Cooling water leaving the methanol
condenser H1 Heat stream from LPMEOH reactor to
reactor’s internal heat exchanger H2 Heat stream from vapor distillation column
to the distillation column reboiler H3 Heat stream from methanol distillation
column to the distillation column reboiler
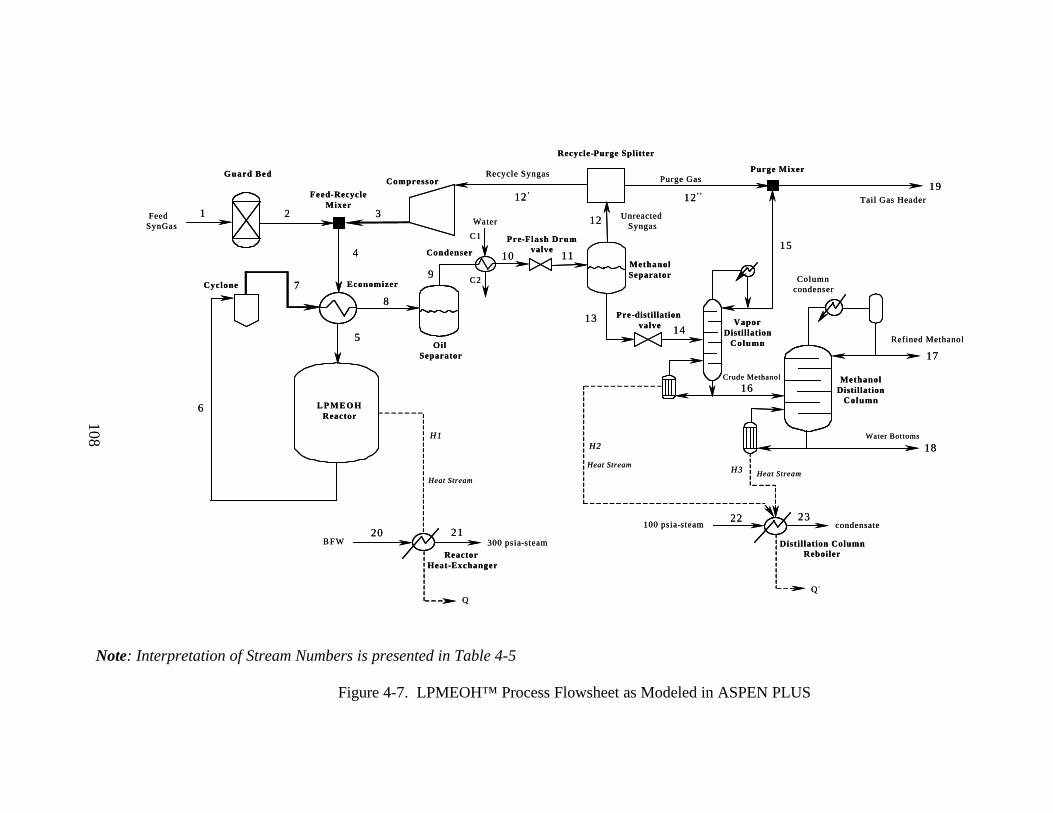
108
Note: Interpretation of Stream Numbers is presented in Table 4-5
Figure 4-7. LPMEOH™ Process Flowsheet as Modeled in ASPEN PLUS
Feed SynGas
Guard BedCompressor
EconomizerCyclone
L P M E O H Reactor
Oil Separator
CondenserMethanolSeparator
Refined Methanol
Crude Methanol
Water Bottoms
Unreacted Syngas
Recycle SyngasPurge Gas
Tail Gas Header
Columncondenser
MethanolDistillation
Column
B F W 300 psia-steam
100 psia-steam condensate
Q ’
Q
Pre-distillation valve
Pre-Flash Drumvalve
Recycle-Purge Splitter
Purge Mixer
VaporDistillation
Column
Heat StreamHeat Stream
Heat Stream
ReactorHeat-Exchanger
Distillation ColumnReboiler
Feed-RecycleMixer
1 2 3
4
5
6
7
8
9
10 11
12
12’’12 ’
1314
15
16
17
18
19
20 2122 23
Water
C1
C2
H1
H3
H2
108
109
4.5.3 Economizer
The purpose of the economizer is to allow for heat exchange between cold
combined feed gas and the hot product gas coming from the LPMEOH reactor. The
economizer or feed-product heat exchanger is modeled as a unit operation of the type
“HEATX” with a block identification of “ECONM” in ASPENPLUS. HEATX is a
simple countercurrent heat exchanger unit operation in ASPEN PLUS that allows for heat
exchange between hot and cold stream. The temperature of cold feed to ECONM is the
temperature of the mixer, FRMIX, exit gas, which is the combined temperature of fresh
feed and the recycle gas. The exit temperature from ECONM’s cold side is specified as
330 oF based on DOE topical reports (Air Products and Chemicals, Inc., 1997) and a visit
to the Kingsport demonstration facility (Street, 1999).
4.5.4 LPMEOHTM Reactor
The heated syngas from ECONM is fed to the LPMEOH reactor, which is
modeled as unit operation of type “RSTOIC” with a block identification of
“LPMREACT”. RSTOIC is a stoichiometric reactor unit operation in ASPEN PLUS and
is used to simulate chemical reactions when the reaction stoichiometry is known,
conversion of one of the reactant is known but the kinetics is unknown. The main
reactions taking place in the LPMEOH reactor are reactions given by Equations (4-3) and
(4-4) as given in Section 4.4.2. Both of these reactions are modeled in LPMREACT by
specifying the reaction conditions, including: (1) temperature (T); (2) pressure (P); and

110
the conversion of a specific reactant in each reaction. The conversion of CO in Equation
(4-3) is specified by a FORTRAN block CONV described in Subsection 4.5.4.1, which
calculates the conversion of CO as a function of reactor pressure (P), syngas space
velocity (SV) and the H2 to CO molar ratio (R) in the syngas fed to the reactor. The
conversion of CO2 in reaction given by Equation (4-4) is specified as a fraction by the
user to be equal to 0.089 (8.9 percent), and does not vary with P, SV and R (Twigg, 1989;
Street, 1999). Carbon dioxide conversion in Equation (4-4) varies only with the reactor
temperature and since the reactor temperature in LPMEOH reactor is held nearly constant
at 250oC, the conversion of CO2 is almost fixed at 8.9 percent. A third, less important,
reaction known as the reverse water gas shift reaction given by Equation (4-5), also
occurs. Equation (4-5) has a very low conversion of CO, which is one of the equilibrium
products, and is not modeled in the reactor (Twigg, 1989; Air Products and Chemicals,
Inc., 1997).
4.5.4.1 FORTRAN Block CONV
The purpose of the FORTRAN block, CONV, is to calculate the conversion of
CO in the LPMEOH reactor using the parameters upon which the conversion of CO is
dependent. The key parameters include: (1) the reactor pressure (P); (2) syngas space
velocity (SV) in the reactor; (3) molar ratio of H2 to CO (R) in the reactor feed; and (4)
reactor temperature. The temperature in LPMEOH reactor is assumed to be 250 oC. This
is the preferred temperature for reasons given in Section 4.4.3. Furthermore, the available

111
data for CO conversion are typically only for this temperature. Thus the parameters
considered in developing the equation for CO conversion are P, SV and R.
Data for once through (H2 +CO) conversion in the LPMEOH reactor as a function
of P, SV, and R are available in an economic analysis report of LPMEOH process in the
form of graphs (Air Products and Chemicals, Inc., 1998). The data presented in the report
are based on the proprietary model of the LPMEOH process developed by Air Products
and Chemicals, Inc. For developing the equation to predict the (H2+CO) conversion as a
function of P, SV, and R, a data set was developed by reading values from the graphs
presented in the Air Products. This data set is presented in Table 4-6.
A regression analysis was done on the data in Table 4-6. Three models given by
Equations (4-10) to (4-12) were fit to the data to find out the most appropriate equation
relating the (H2 + CO) conversion (C) to P, SV and R. The models considered include the
linear (Equation 4-10), quadratic (Equation 4-11) and logarithmic (Equation 4-12)
relationship between the dependent and the independent variables. Table 4-7 presents the
results of the regression analysis on data in Table 4-6 considering the 3 models as given
by Equations (4-10) to (4-12).
Model 1: C = a + b P + c SV + d R (4-10)
Model 2: C = a + b P + c P2 + d SV + e SV2 + f R + g R2 (4-11)
Model 3: C = A (P)B (SV)C (R)D (4-12)

112
Table 4-6. Data Set Used in Regression Analysis to Develop a (H2+CO) Conversion Model (C) for the LPMEOH Reactor as a Function of Pressure, P, Space Velocity, SV, and H2/CO ratio, Ra
C P SV R ln(C) ln(P) ln(S) ln(R) percent psig sL/kg-hr (moles H2/moles CO)
28.1 500 2000 2 3.33 6.21 7.60 0.693 42.2 750 2000 2 3.74 6.62 7.60 0.693 51.8 1000 2000 2 3.94 6.90 7.60 0.693 58.75 1250 2000 2 4.07 7.13 7.60 0.693 22.8 500 4000 2 3.12 6.21 8.29 0.693 34.4 750 4000 2 3.53 6.62 8.29 0.693 44.4 1000 4000 2 3.79 6.90 8.29 0.693 51.8 1250 4000 2 3.94 7.13 8.29 0.693 15.6 500 8000 2 2.74 6.21 8.98 0.693 24.3 750 8000 2 3.19 6.62 8.98 0.693 31.9 1000 8000 2 3.46 6.90 8.98 0.693 38.4 1250 8000 2 3.64 7.13 8.98 0.693 17.5 500 2000 0.97 2.86 6.21 7.60 -0.0305 26.87 750 2000 0.97 3.29 6.62 7.60 -0.0305
35 1000 2000 0.97 3.55 6.90 7.60 -0.0305 41.56 1250 2000 0.97 3.72 7.13 7.60 -0.0305 23.12 500 4000 0.97 3.14 6.21 8.29 -0.0305
34 750 4000 0.97 3.52 6.62 8.29 -0.0305 42.18 1000 4000 0.97 3.74 6.90 8.29 -0.0305 48.12 1250 4000 0.97 3.87 7.13 8.29 -0.0305 17.81 500 2000 0.68 2.87 6.21 7.60 -0.385 26.87 750 2000 0.68 3.29 6.62 7.60 -0.385 33.12 1000 2000 0.68 3.50 6.90 7.60 -0.385 37.5 1250 2000 0.68 3.62 7.13 7.60 -0.385
a Air Products and Chemicals, Inc., 1998
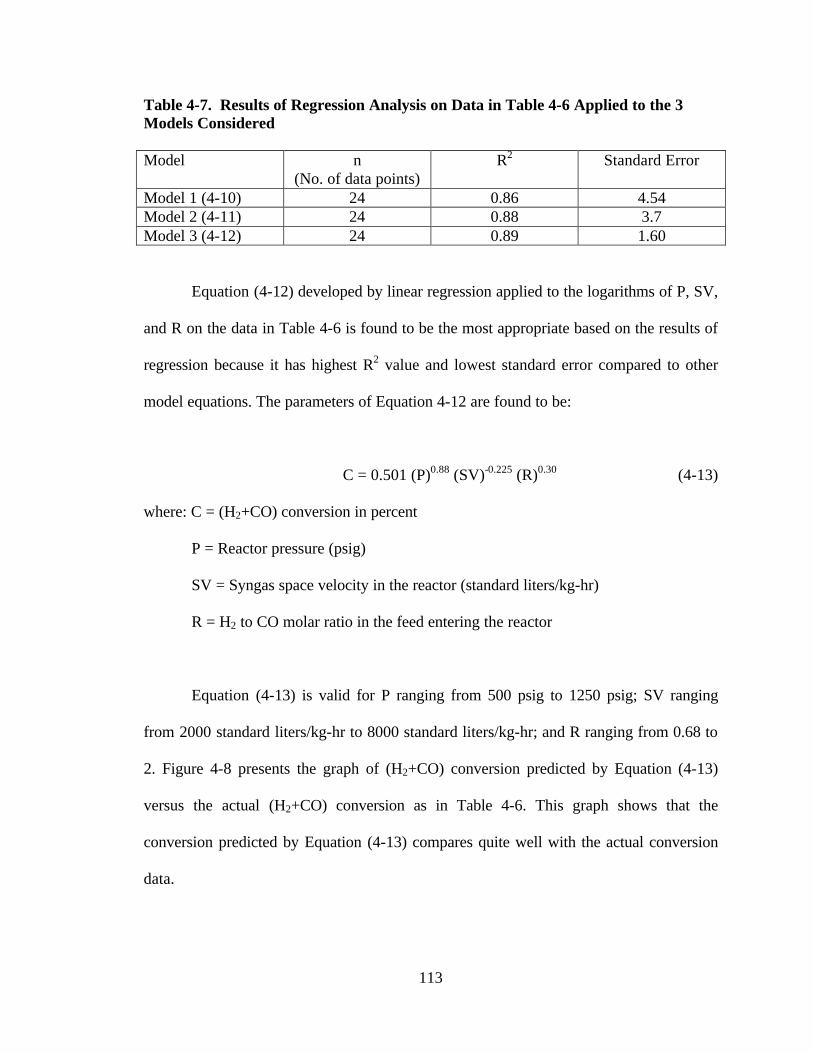
113
Table 4-7. Results of Regression Analysis on Data in Table 4-6 Applied to the 3 Models Considered Model n
(No. of data points) R2 Standard Error
Model 1 (4-10) 24 0.86 4.54 Model 2 (4-11) 24 0.88 3.7 Model 3 (4-12) 24 0.89 1.60
Equation (4-12) developed by linear regression applied to the logarithms of P, SV,
and R on the data in Table 4-6 is found to be the most appropriate based on the results of
regression because it has highest R2 value and lowest standard error compared to other
model equations. The parameters of Equation 4-12 are found to be:
C = 0.501 (P)0.88 (SV)-0.225 (R)0.30 (4-13)
where: C = (H2+CO) conversion in percent
P = Reactor pressure (psig)
SV = Syngas space velocity in the reactor (standard liters/kg-hr)
R = H2 to CO molar ratio in the feed entering the reactor
Equation (4-13) is valid for P ranging from 500 psig to 1250 psig; SV ranging
from 2000 standard liters/kg-hr to 8000 standard liters/kg-hr; and R ranging from 0.68 to
2. Figure 4-8 presents the graph of (H2+CO) conversion predicted by Equation (4-13)
versus the actual (H2+CO) conversion as in Table 4-6. This graph shows that the
conversion predicted by Equation (4-13) compares quite well with the actual conversion
data.
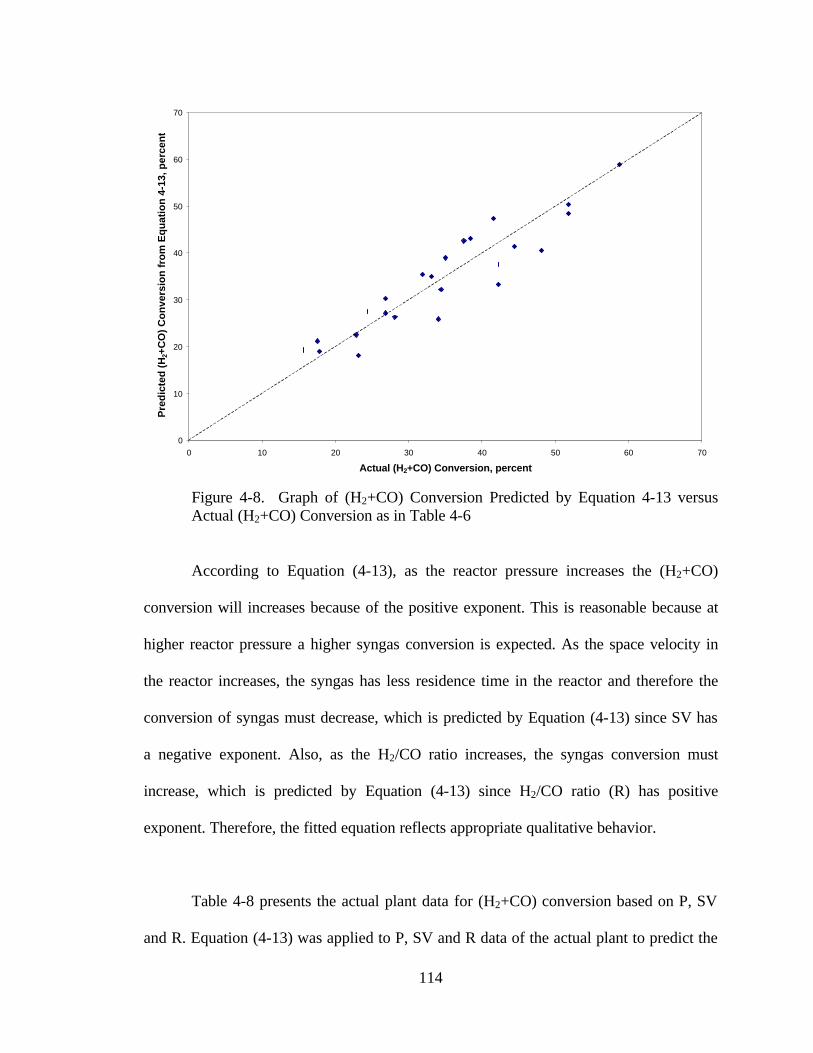
114
Figure 4-8. Graph of (H2+CO) Conversion Predicted by Equation 4-13 versus Actual (H2+CO) Conversion as in Table 4-6
According to Equation (4-13), as the reactor pressure increases the (H2+CO)
conversion will increases because of the positive exponent. This is reasonable because at
higher reactor pressure a higher syngas conversion is expected. As the space velocity in
the reactor increases, the syngas has less residence time in the reactor and therefore the
conversion of syngas must decrease, which is predicted by Equation (4-13) since SV has
a negative exponent. Also, as the H2/CO ratio increases, the syngas conversion must
increase, which is predicted by Equation (4-13) since H2/CO ratio (R) has positive
exponent. Therefore, the fitted equation reflects appropriate qualitative behavior.
Table 4-8 presents the actual plant data for (H2+CO) conversion based on P, SV
and R. Equation (4-13) was applied to P, SV and R data of the actual plant to predict the
0
10
20
30
40
50
60
70
0 10 20 30 40 50 60 70
Actual (H2+CO) Conversion, percent
Pre
dic
ted
(H
2+C
O)
Co
nve
rsio
n f
rom
Eq
uat
ion
4-1
3, p
erce
nt

115
(H2+CO) conversion. It was found that Equation (4-13) overpredicts, on average, the
(H2+CO) conversion with respect (H2+CO) conversion in the actual plant data. A
modified equation for (H2+CO) conversion was therefore desired. Actual plant data could
not be used for developing the (H2+CO) conversion equation. This was because the
various regression models, such as Equations (4-10) to (4-12), when fitted on actual plant
data, predicted an increase in conversion as the space velocity increased, which is
contrary to what is expected.
Since the Equation (4-13) over predicted the (H2+CO) conversion with respect to
the actual data set, the predicted conversion, C, from the above equation based on P, SV,
and R was divided by the actual (H2 + CO) conversion available from plant data. This
provided the ratio of predicted to actual conversion for 13 cases. A mean of the ratios of
these 13 cases is calculated and called a mean ratio. The mean ratio (1.384) is the number
by which the conversion in Equation 4-14 should be divided to form a modified equation
of (H2 + CO) conversion (C*). The exponents associated with P, SV, and R remain
unchanged. The modified equation, as obtained, is:
C* = 0.362 (P)0.88 (SV)-0.225 (R)0.30 (4-14)
where: C* = Modified (H2+CO) conversion
Table 4-8 presents the comparison of (H2+CO) conversion from actual plant data
with that predicted by Equation (4-13). It presents the ratio of conversion predicted by
Equation (4-13) to that of actual plant data. Table 4-8 also presents the conversion
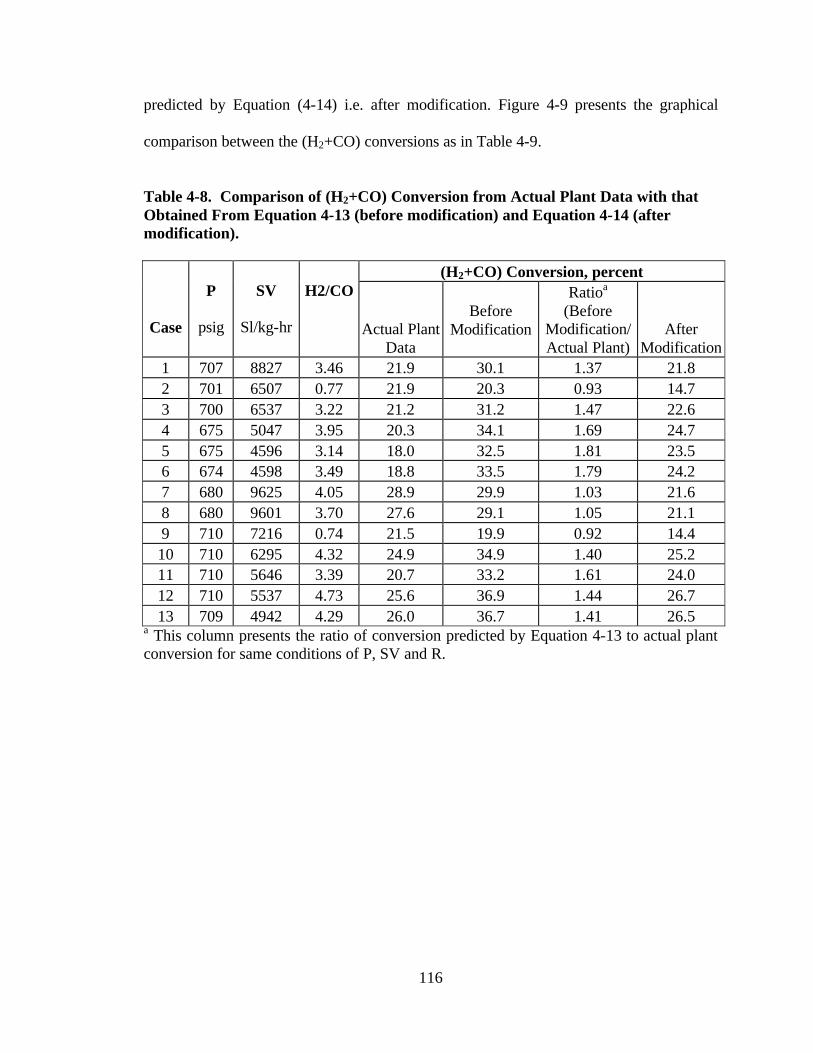
116
predicted by Equation (4-14) i.e. after modification. Figure 4-9 presents the graphical
comparison between the (H2+CO) conversions as in Table 4-9.
Table 4-8. Comparison of (H2+CO) Conversion from Actual Plant Data with that Obtained From Equation 4-13 (before modification) and Equation 4-14 (after modification).
(H2+CO) Conversion, percent
Case
P
psig
SV
Sl/kg-hr
H2/CO
Actual Plant Data
Before Modification
Ratioa (Before
Modification/ Actual Plant)
After Modification
1 707 8827 3.46 21.9 30.1 1.37 21.8 2 701 6507 0.77 21.9 20.3 0.93 14.7 3 700 6537 3.22 21.2 31.2 1.47 22.6 4 675 5047 3.95 20.3 34.1 1.69 24.7 5 675 4596 3.14 18.0 32.5 1.81 23.5 6 674 4598 3.49 18.8 33.5 1.79 24.2 7 680 9625 4.05 28.9 29.9 1.03 21.6 8 680 9601 3.70 27.6 29.1 1.05 21.1 9 710 7216 0.74 21.5 19.9 0.92 14.4 10 710 6295 4.32 24.9 34.9 1.40 25.2 11 710 5646 3.39 20.7 33.2 1.61 24.0 12 710 5537 4.73 25.6 36.9 1.44 26.7 13 709 4942 4.29 26.0 36.7 1.41 26.5
a This column presents the ratio of conversion predicted by Equation 4-13 to actual plant conversion for same conditions of P, SV and R.
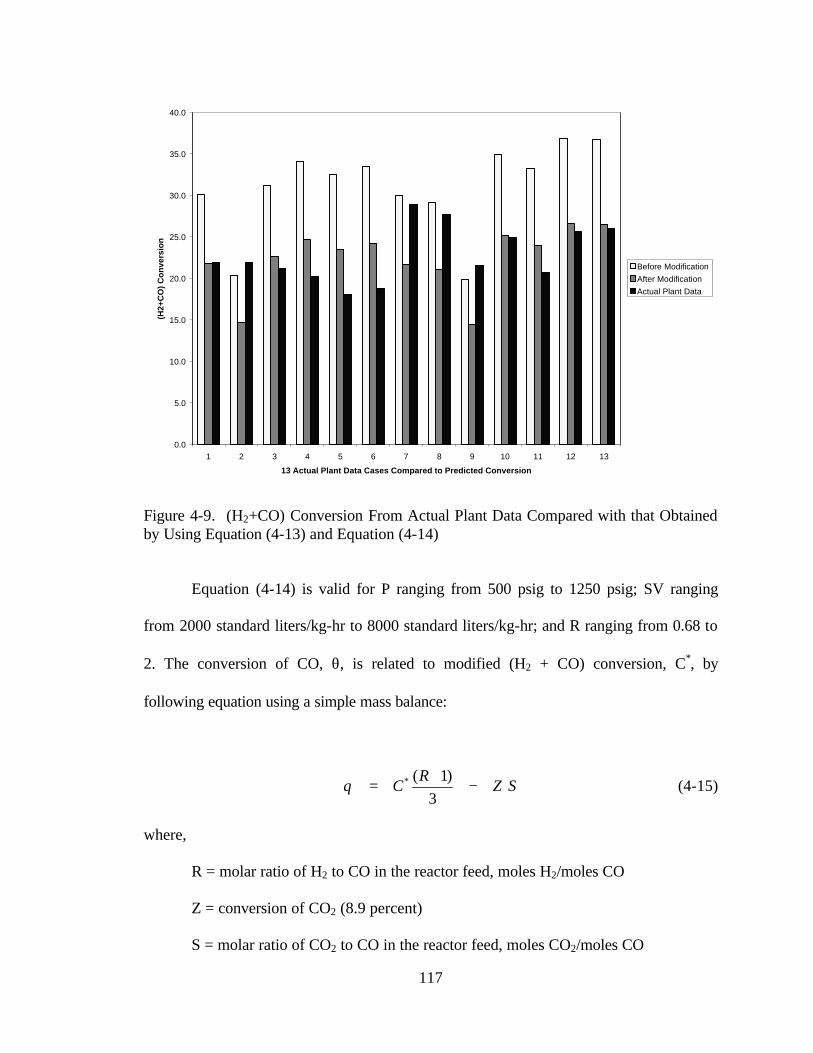
117
Figure 4-9. (H2+CO) Conversion From Actual Plant Data Compared with that Obtained by Using Equation (4-13) and Equation (4-14)
Equation (4-14) is valid for P ranging from 500 psig to 1250 psig; SV ranging
from 2000 standard liters/kg-hr to 8000 standard liters/kg-hr; and R ranging from 0.68 to
2. The conversion of CO, θ, is related to modified (H2 + CO) conversion, C*, by
following equation using a simple mass balance:
SZR
C −+
=3
)1(*θ (4-15)
where,
R = molar ratio of H2 to CO in the reactor feed, moles H2/moles CO
Z = conversion of CO2 (8.9 percent)
S = molar ratio of CO2 to CO in the reactor feed, moles CO2/moles CO
0.0
5.0
10.0
15.0
20.0
25.0
30.0
35.0
40.0
1 2 3 4 5 6 7 8 9 10 11 12 13
13 Actual Plant Data Cases Compared to Predicted Conversion
(H2+
CO
) C
on
vers
ion
Before Modification
After Modification
Actual Plant Data
118
Conversion of CO is required separately because (H2+CO) conversion cannot be
specified in the RSTOIC reactor, LPMREACT since the conversion of only one
component per reaction can be specified in RSTOIC (AspenTech, 1996). Thus in
FORTRAN block CONV, Equation 4-14 is defined first to calculate the (H2+CO)
conversion based on P, SV, and R followed by Equation 4-15 to calculate the CO
conversion from the calculated (H2+CO) conversion. A pressure drop of approximately
10 psi occurs in the LPMEOH reactor sparger (Street, 1999).
4.5.5 Cyclone Separator
The cyclone separator is modeled as a unit operation of type “VALVE” with a
block identification of “CYCLONE” in ASPEN PLUS through which a pressure drop of
approximately 6 psia occurs in the reactor exit gas (Street, 1999). VALVE is the common
unit operation in ASPEN PLUS that can be used to simulate the pressure drop in a
process equipment in which no reaction takes place (AspenTech, 1996). Since the
cyclone separator primarily removes oil droplets entrained in the reactor exit gases, it
does not significantly alter the flow rate for the reactor exit gas.
4.5.6 Oil Separator
The oil separator, like the cyclone separator, is modeled as a unit operation of
type “VALVE” with a block identification of “OILSEP” through which a pressure drop
of approximately 2 psia occurs (Street, 1999). VALVE is used to simulate the pressure

119
drop that occurs in oil separator because no reaction takes place. Also, the oil separator
removes one gallon to two gallons per minute (gpm) of oil, which is very small compared
to the total mass flow through the oil separator. Therefore, it is assumed that the oil
separator does not alter the gaseous flow rate of the feed stream.
4.5.7 Pre-Methanol Separator Condensers
For the methanol to condense, a series of heat exchangers and air coolers is
employed prior to the methanol separator unit. For purposes of simplicity, the train of
condensers is approximated by a single condenser modeled as a unit operation of type
“HEATX” with a block identification of “CONDSR”. HEATX is a simple counter-
current heat exchanger unit operation in ASPEN PLUS that is used to simulate the heat
exchange between hot and cold stream (AspenTech, 1996). CONDSR uses water at 68 oF
for condensing methanol and water vapor in the product gas, which comes from OILSEP.
CONDSR is specified with product gas exit temperature of 100 oF and pressure of 713
psia (Street, 1999). The mass flow rate of water is calculated by design specification,
CONDWAT, described later, which manipulates the flow rate of water such that the exit
temperature of cooling water is 25 oC higher than its inlet temperature (68 oF).
4.5.8 Pre-Methanol Separator Flash Valve
The pre-methanol separator flash valve is modeled as a unit operation of the type
“VALVE” with a block identification of “FLVALVE”. In this block, a pressure drop

120
occurs such that there is a vapor-liquid phase separation. A pressure drop of
approximately 10 psia occurs in FLVALVE (Street, 1999).
4.5.9 Methanol Separator
The stream from pre-methanol flash valve enters the methanol separator.
Methanol separator separates methanol and other condensable material as a liquid phase
while non-condensable gases leave at the top. The methanol separator is modeled as a
unit operation of the type “FLASH2” with a block identification of “MEOHSEP” in
ASPEN PLUS. MEOHSEP is a simple flash drum where the vapor and liquid phase
separate. MEOHSEP block has temperature and pressure specifications of 100 oF and 700
psia, respectively (Street, 1999).
4.5.10 Recycle and Purge Gas Splitter
In this section of the process model, exit gases from the methanol separator are
split into two streams: recycle gas and purge gas. The amount of reactor exit gases split
to be recycled depends on a specified recycle ratio, which is the molar ratio of recycled
gas to fresh feed to the process. The recycle and purge gas splitter is modeled as a unit
operation of the type “FSPLIT” with a block identification of “RPSPLIT” in ASPEN
PLUS. The flowrate of recycle gas is calculated using the desired recycle ratio and is
specified in RPSPLIT. A typical value of the recycle ratio is 3 moles recycle gas per

121
moles fresh syngas feed for the syngas being used at Kingsport to achieve higher
conversion of syngas in methanol reactor (Street, 1999).
4.5.11 Pre-Distillation Pressure Relief Valve
The pre-distillation pressure relief valve is modeled as a unit operation of the type
“VALVE” with a block identification of “DISTVAL” in ASPENPLUS. The phase
separated liquid stream from MEOHSEP enters the DISTVAL and undergoes a pressure
reduction such that the exit pressure from the DISTVAL is 35 psia, which is near the
pressure at which the methanol distillation column operates (Street, 1999).
4.5.12 Methanol Distillation and Purification Section
There are two distillation columns in the methanol purification section. The first
distillation column is modeled as a unit operation of the type “SEP2” with a block
identification of “VPDISTCO” in ASPEN PLUS. SEP2 is a unit operation in ASPEN
PLUS in which component separation operation such as vapor distillation occurs
(AspenTech, 1999). Since the function of the first distillation column is to purge all of the
gases and vapors, it is specified to remove 100 percent of the H2, CO, N2, CO2 and CH4
as a purge stream. All of the methanol and water flow from the bottom of VPDISTCO is
a feed to a second distillation column.

122
The second distillation column is modeled as unit operation of the type
“DSTWU” with a block identification of “MEOHDIST” in ASPENPLUS. DSTWU is a
simplified distillation column unit operation in ASPEN PLUS and is used to simulate
distillation of a light component such as methanol and a heavy component such as water
from their mixture (AspenTech, 1999). The number of trays specified in MEOHDIST is
40 (Street, 1999). Recovery of the light key component is specified as 99.99 percent. The
light key component is the one which has the highest vapor pressure and it is methanol in
this case. The recovery of the heavy key component in the top product is set by a design
specification, MOHPURIT. The heavy key component is the one which has the lowest
vapor pressure and water in this case. The design specification MOHPURIT determines
the recovery of the heavy key component, water, such that the distilled methanol has a
purity of 99.99 percent on weight basis. The top and bottom pressures of MEOHDIST are
specified to be 30 and 33 psia, respectively (Street, 1999).
4.5.13 Distillation Column Reboiler
The distillation column reboiler is modeled for the purpose of calculating the
steam consumption in the distillation column. It is modeled as a unit operation of type
“HEATER” with a block identification of “REBHTR”. It has two input heat streams: one
heat stream is from VPDISTCO, which as described before, is a distillation column for
vapor removal; and the other heat stream is from MEOHDIST. The heat stream from
VPDISTCO is its heat duty and the heat stream from MEOHDIST column is its reboiler
duty. The amount of 100-psia steam used in the reboiler is calculated by the design
123
specification, STMCON. STMCON sets the heat loss from the REBHTR equal to zero by
manipulating the flow rate of 100-psia steam such that saturated water at 100 psia is
produced at the exit.
4.5.14 Recycle Gas Compressor
The recycle gas compressor is modeled as a unit operation of the type “COMPR”
with a block identification of “RECCOMP”. RECCOMP is an isentropic compressor with
which has typical inlet recycle gas pressure of 700 psia and the typical outlet pressure of
738 psia (Street, 1999). Therefore, the recycle gas compressor overcomes a process
pressure drop of 38 psi, approximately. The purpose of RECCOMP is to raise the
pressure of the recycle gas and make it compatible with the pressure of the fresh syngas
before they mix in FRMIX.
4.5.15 Reactor’s Internal Heat Exchanger
The LPMEOH reactor has an internal heat exchanger for the removal of the heat
of reaction. It is modeled as unit operation of type “HEATER” with a block identification
of “REACTHX” in ASPEN PLUS. REACTHX receives a heat stream from the RSTOIC
reactor (LPMREACT) unit operation block and uses that heat to model the conversion of
boiler feed water (BFW) at 160 oF and 200 psia into saturated steam at 300 psia. The
amount of BFW fed to REACTHX is calculated by a design specification, STMPRO.
124
STMPRO sets the heat loss from the REACTHX to surroundings equal to zero by
manipulating the flow rate of BFW through REACTHX.
4.5.16 Fresh and Recycle Syngas Mixer
Fresh syngas mixes with the recycle gas from recycle compressor in a mixer
before entering the economizer. Fresh and recycle syngas mixer is modeled as unit
operation of type “MIXER” with a block identification of “FRMIX” in ASPEN PLUS.
MIXER is a simple unit operation block in ASPEN PLUS which allows for mixing of
two different streams to produce one combined stream. The combined feed from FRMIX
enters the cold side of ECONM for heat exchange with hot product gases coming from
the LPMEOH reactor (LPMREACT).
4.5.17 Purge Mixer
The purge gases coming from splitter and vapor distillation column are mixed in a
purge mixer. Purge mixer is modeled as a unit operation of type “MIXER” with a block
identification of “PURGEMIX” in ASPEN PLUS.
Table 4-9 presents the description of process unit operation blocks used in
ASPEN PLUS to simulate the various unit operations involved in the LPMEOH process.
This table also contains the default values for key inputs to the model.
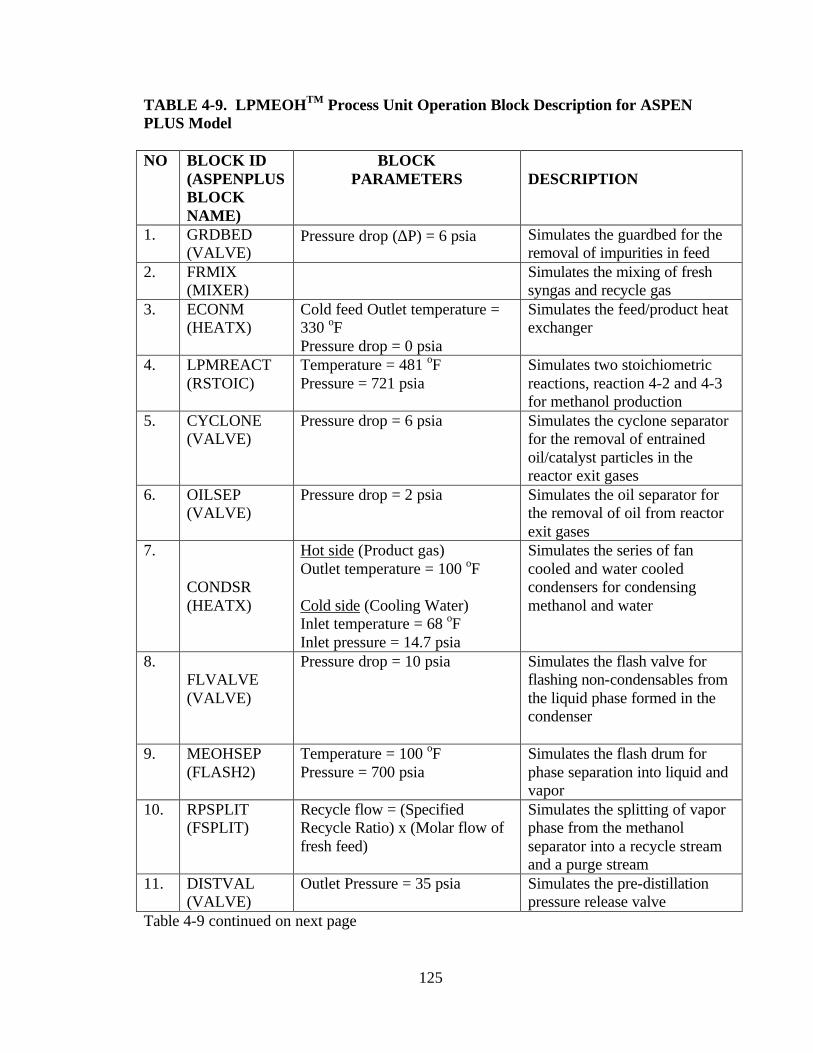
125
TABLE 4-9. LPMEOHTM Process Unit Operation Block Description for ASPEN PLUS Model
NO BLOCK ID
(ASPENPLUS BLOCK NAME)
BLOCK PARAMETERS
DESCRIPTION
1. GRDBED (VALVE)
Pressure drop (∆P) = 6 psia Simulates the guardbed for the removal of impurities in feed
2. FRMIX (MIXER)
Simulates the mixing of fresh syngas and recycle gas
3. ECONM (HEATX)
Cold feed Outlet temperature = 330 oF Pressure drop = 0 psia
Simulates the feed/product heat exchanger
4. LPMREACT (RSTOIC)
Temperature = 481 oF Pressure = 721 psia
Simulates two stoichiometric reactions, reaction 4-2 and 4-3 for methanol production
5. CYCLONE (VALVE)
Pressure drop = 6 psia Simulates the cyclone separator for the removal of entrained oil/catalyst particles in the reactor exit gases
6. OILSEP (VALVE)
Pressure drop = 2 psia Simulates the oil separator for the removal of oil from reactor exit gases
7. CONDSR (HEATX)
Hot side (Product gas) Outlet temperature = 100 oF Cold side (Cooling Water) Inlet temperature = 68 oF Inlet pressure = 14.7 psia
Simulates the series of fan cooled and water cooled condensers for condensing methanol and water
8. FLVALVE (VALVE)
Pressure drop = 10 psia
Simulates the flash valve for flashing non-condensables from the liquid phase formed in the condenser
9. MEOHSEP (FLASH2)
Temperature = 100 oF Pressure = 700 psia
Simulates the flash drum for phase separation into liquid and vapor
10. RPSPLIT (FSPLIT)
Recycle flow = (Specified Recycle Ratio) x (Molar flow of fresh feed)
Simulates the splitting of vapor phase from the methanol separator into a recycle stream and a purge stream
11. DISTVAL (VALVE)
Outlet Pressure = 35 psia Simulates the pre-distillation pressure release valve
Table 4-9 continued on next page

126
Table 4-9 continued NO BLOCK ID
(ASPENPLUS BLOCK NAME)
BLOCK PARAMETERS
DESCRIPTION
12. VPDISTCO (SEP2)
Separation Efficiency of H2, CO, CO2, N2, and CH4 = 100 percent
Simulates first distillation column of methanol purification section for the complete removal of gases and vapors
13. MEOHDIST (DSTWU)
Light key recovery = 0.9999 Heavy key recovery: manipulated by design specification, MOHPURIT Top tray pressure = 30 psia Bottom tray pressure = 33 psia
Simulates the second distillation column for 99.99 percent recovery of methanol with 99.99 weight percent purity
14. RECCOMP (COMPR)
∆P = 38 psi Simulates the recycle gas compressor
15. PURGEMIX (MIXER)
Simulates the mixing of the main purge from the splitter and first distillation column
16. REACTHX (HEATER)
Outlet Pressure = 300 psia Outlet Vapor fraction = 1.0
Simulates the internal heat exchanger in the reactor for calculation of steam generation.
17. REBHTR
Outlet Pressure = 100 psia Outlet Liquid fraction = 1.0
Simulates the reboilers of both distillation columns (1 and 2) for calculation of steam consumption.
127
4.6 Design Specification and FORTRAN blocks used in LPMEOH Process Model
The design specifications used in the LPMEOHTM process model are STMPRO,
CONDWAT, STMCON, and MOHPURIT.
STMPRO is used to calculate the amount of saturated steam produced at 300 psia
in the reactor’s internal heat exchanger. The internal heat exchanger is used to keep the
reactor temperature at 250oC. Because the overall reaction in the reactor is exothermic,
heat must be removed from the reactor and it is used to generate steam. The heat lost to
the surroundings (Q) from the REACTHX should be zero. The product steam is specified
to be saturated at 300 psia in REACTHX. This design specification is achieved by
varying the flow rate of boiler feed water entering the REACTHX at 160 oF and 200 psia.
This in turn gives the amount of boiler feed water used in the REACTHX and therefore
the amount of saturated steam produced at 300 psia in the REACTHX.
STMCON operates in a very similar way as STMPRO. STMCON is used to
calculate the amount of 100 psia saturated steam used in the distillation column reboiler
for methanol recovery. The heat loss to the surroundings (Q′) from REBHTR should be
zero. The product water is specified to be saturated water at 100 psia in the REBHTR.
This design specification is achieved by varying the flow rate of 100 psia saturated steam
entering REBHTR.

128
The purpose of design specification CONDWAT is to manipulate the flow rate of
cooling water, used in methanol condenser for condensing methanol, such that its
temperature rise upon exit is limited to 25 oC.
The purpose of design specification, MOHPURIT, is to specify the purity of the
methanol top product from the second distillation column to 99.99 percent (on weight
basis) by varying the recovery of the heavy key component (water) in top product.
Recovery of the heavy key component is manipulated because the methanol distillation
column is specified as unit operation of type DSTWU. In this unit operation model, the
only the variable that directly corresponds to the reflux ratio is the heavy key component
recovery. Also, since the number of stages, the top pressure and the bottom pressure are
fixed, the only variable left to be manipulated is the heavy key component recovery. The
initial guess supplied for the water recovery in top product is arbitrarily set to 0.005
moles reflux/moles distillate.
FORTRAN block CONV is used to calculate the conversion of CO in the reactor
based on pressure (P), space velocity (SV) and the molar ratio of H2 to CO entering the
reactor as explained in Section 4.5.4.1.
4.7 Convergence Sequence of LPMEOH Process Model
The convergence sequence for the model is based on 17 unit operation blocks, 2
tear streams, 4 design specifications and one FORTRAN block. All of the unit operation
blocks have been described individually in Section 4.5. Here, the calculation sequence for

129
the simulation is described. The design specification STMPRO, STMCON, CONDWAT,
and MOHPURIT and FORTRAN block CONV are described in Section 4.6.
The convergence sequence starts with the initialization of key input variables in
the unit operations. The physical property data set RKSOAVE (Redlich-Kwong-Soave) is
then invoked to specify the physical properties of the components used in the simulation.
RKSOAVE is specified by the user when specifying the input values of process
parameters. RKSOAVE is specified because it is recommended for methanol production
process simulation based on the thermodynamic parameter estimation method
(AspenTech, 1996). The fresh feed, Stream 1 in Figure 4-7, first enters the GRDBED.
The fresh feed exit from GRDBED then mixes with the recycle stream, Stream 3 in
Figure 4-7, whose composition and flowrate is unknown at this point. Therefore Stream 3
is defined as a tear stream. Convergence block MOH-TER1 is defined to converge the
tear stream 3 before the Stream 2 mixes with it in FRMIX.
MOH-TER2 is a convergence block that is specified to tear Stream 7. Stream 7
leaves the ECONM which requires a temperature specification for streams entering and
leaving it. However the temperature of Stream 7 is not known initially and therefore an
initial guess must be used. Stream 2 is mixed with Steam 3 to form Stream 4. The
combined syngas stream, Stream 4 enters the ECONM for heat exchange with the hot
product gases from the reactor. Stream 5 is the heated stream that enters the LPMEOH
reactor, LPMREACT. Before Stream 5 enters the LPMREACT, FORTRAN block
CONV is executed to specify the conversion of CO in the LPMREACT. LPMREACT is
130
executed next. After LPMREACT, the product gases, Stream 6, enters CYCLONE,
which is then executed. Here some pressure drop in Stream 6 occurs. Stream 7 is
calculated and compared with its initial guess. If the steam parameters don’t match,
MOH-TER2 convergence block updates the Stream 7 and repeats the calculation starting
at ECONM. When the simulated value of Stream 7 exiting the CYCLONE agrees with
the previous value of Stream 7 used when going to ECONM, then there is convergence
and the simulation continues to other unit operations. After MOH-TER2 has converged
for a particular pass, OILSEP is executed the next. The exit stream from OILSEP, Stream
9, consist of vapors of methanol, water and unreacted gases, enters the CONDSR where
CONDWAT (a design specification) is specified to calculate the flowrate of cooling
water required in CONDSR cold side.
After CONDSR is executed, the CONDSR exit stream, Stream 10, enters
FLVALVE. FLVALVE and MEOHSEP are then executed. MEOHSEP produces Stream
12 and Stream 13. Stream 13 needs to be recycled and therefore RPSPLIT is executed
next which splits Stream 12 into Stream 12R and 12P. Stream 12R is recycled back via
RECCOMP, which is executed next. Stream 3 exiting from RECCOMP is compared with
its initial guess. If the temperature, pressure and flowrate do not match, MOH-TER1
convergence block updates the tear stream parameters and repeats through same process
steps as earlier until the Stream 3 is converged.
After MOH-TER1 has converged, DISTVAL, VPDISTCO, MOHPURIT (a
Design Specification), MEOHDIST, and PURGEMIX are executed. After the tear
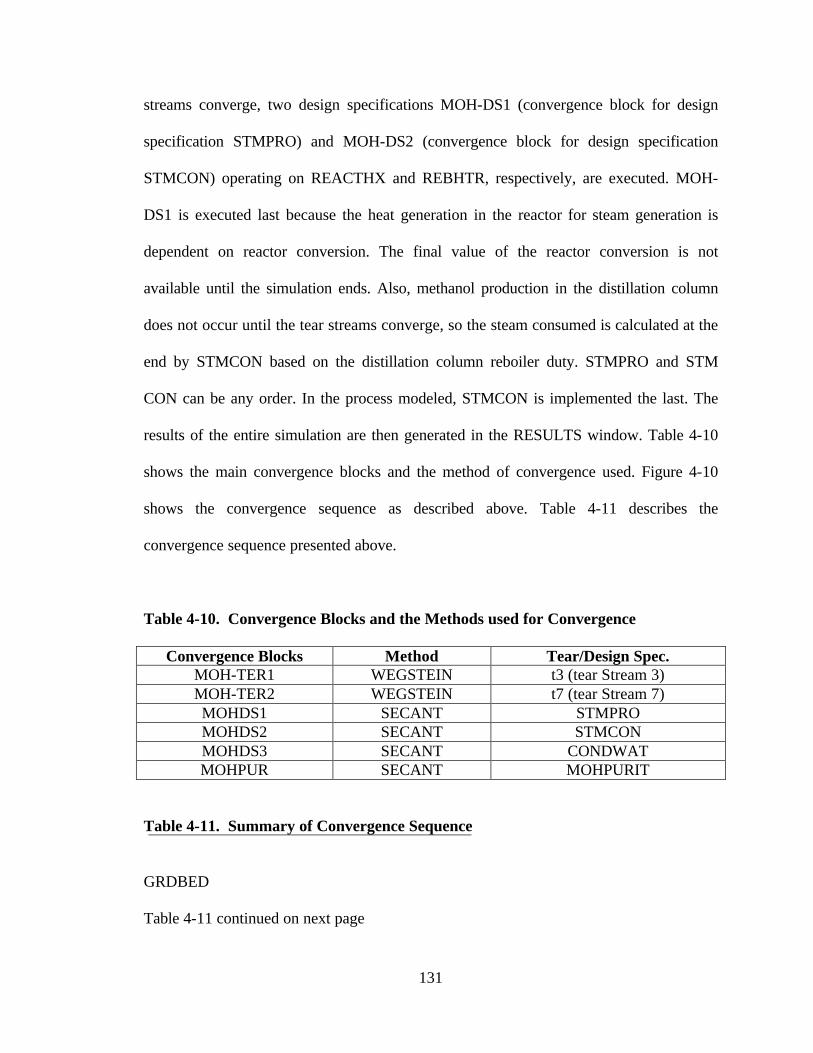
131
streams converge, two design specifications MOH-DS1 (convergence block for design
specification STMPRO) and MOH-DS2 (convergence block for design specification
STMCON) operating on REACTHX and REBHTR, respectively, are executed. MOH-
DS1 is executed last because the heat generation in the reactor for steam generation is
dependent on reactor conversion. The final value of the reactor conversion is not
available until the simulation ends. Also, methanol production in the distillation column
does not occur until the tear streams converge, so the steam consumed is calculated at the
end by STMCON based on the distillation column reboiler duty. STMPRO and STM
CON can be any order. In the process modeled, STMCON is implemented the last. The
results of the entire simulation are then generated in the RESULTS window. Table 4-10
shows the main convergence blocks and the method of convergence used. Figure 4-10
shows the convergence sequence as described above. Table 4-11 describes the
convergence sequence presented above.
Table 4-10. Convergence Blocks and the Methods used for Convergence
Convergence Blocks Method Tear/Design Spec. MOH-TER1 WEGSTEIN t3 (tear Stream 3) MOH-TER2 WEGSTEIN t7 (tear Stream 7) MOHDS1 SECANT STMPRO MOHDS2 SECANT STMCON MOHDS3 SECANT CONDWAT MOHPUR SECANT MOHPURIT
Table 4-11. Summary of Convergence Sequence
GRDBED
Table 4-11 continued on next page
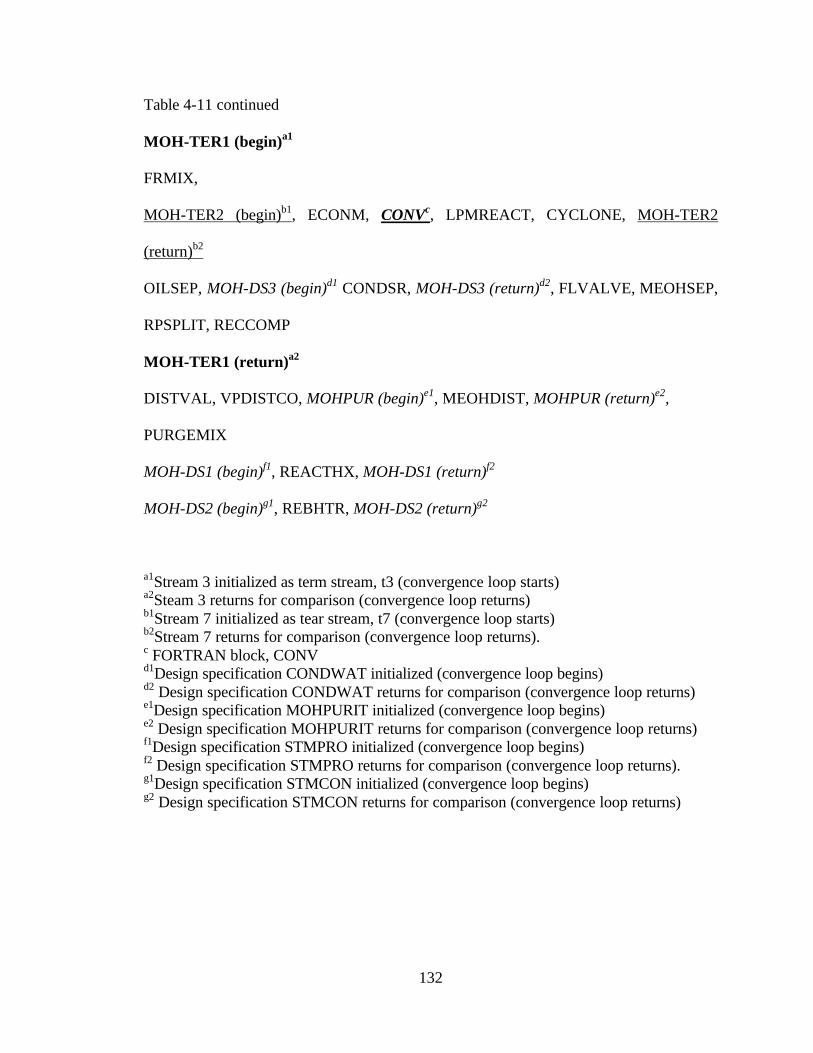
132
Table 4-11 continued
MOH-TER1 (begin)a1
FRMIX,
MOH-TER2 (begin)b1, ECONM, CONVc, LPMREACT, CYCLONE, MOH-TER2
(return)b2
OILSEP, MOH-DS3 (begin)d1 CONDSR, MOH-DS3 (return)d2, FLVALVE, MEOHSEP,
RPSPLIT, RECCOMP
MOH-TER1 (return)a2
DISTVAL, VPDISTCO, MOHPUR (begin)e1, MEOHDIST, MOHPUR (return)e2,
PURGEMIX
MOH-DS1 (begin)f1, REACTHX, MOH-DS1 (return)f2
MOH-DS2 (begin)g1, REBHTR, MOH-DS2 (return)g2
a1Stream 3 initialized as term stream, t3 (convergence loop starts) a2Steam 3 returns for comparison (convergence loop returns) b1Stream 7 initialized as tear stream, t7 (convergence loop starts) b2Stream 7 returns for comparison (convergence loop returns). c FORTRAN block, CONV d1Design specification CONDWAT initialized (convergence loop begins) d2 Design specification CONDWAT returns for comparison (convergence loop returns) e1Design specification MOHPURIT initialized (convergence loop begins) e2 Design specification MOHPURIT returns for comparison (convergence loop returns) f1Design specification STMPRO initialized (convergence loop begins) f2 Design specification STMPRO returns for comparison (convergence loop returns). g1Design specification STMCON initialized (convergence loop begins) g2 Design specification STMCON returns for comparison (convergence loop returns)
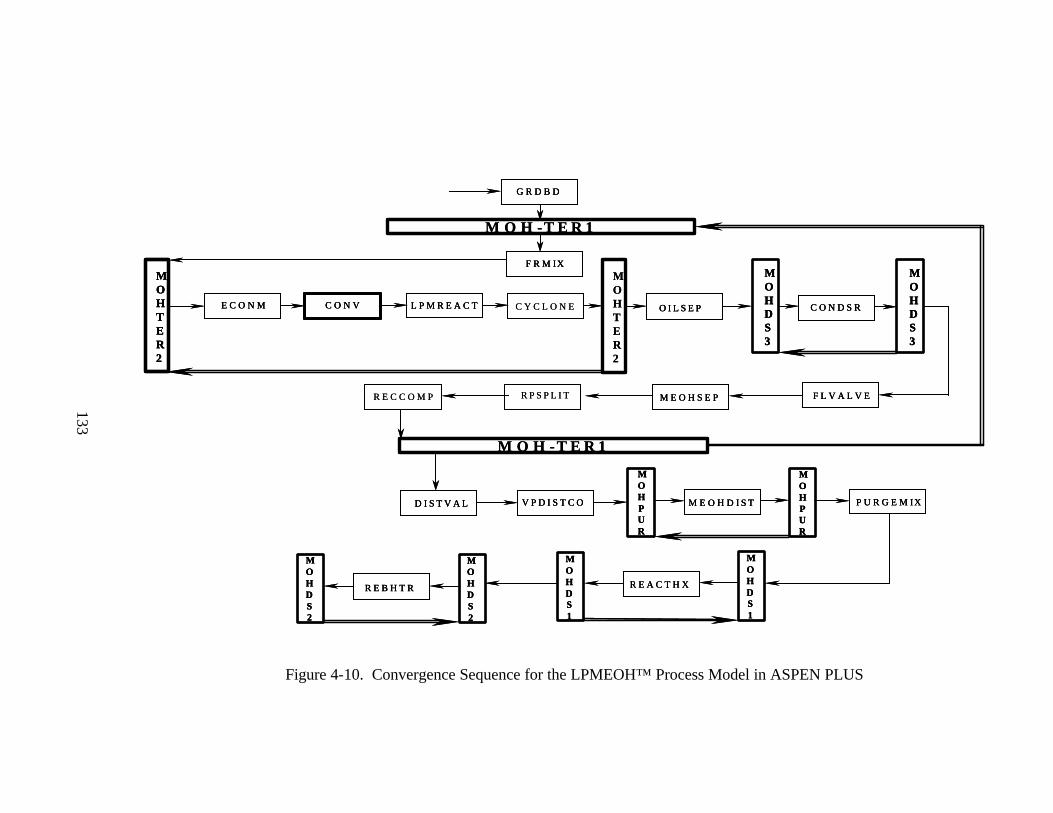
133
Figure 4-10. Convergence Sequence for the LPMEOH™ Process Model in ASPEN PLUS
M O H -T E R 1
G R D B D
F R M IXMOHTER2
MOHTER2
E C O N M C O N V L P M R E A C T C Y C L O N E O I L S E P
MOHDS3
MOHDS3
C O N D S R
F L V A L V EM E O H S E PR P S P L I TR E C C O M P
M O H - T E R 1
D I S T V A L V P D I S T C O M E O H D I S T P U R G E M IX
R E A C T H XR E B H T R
MOHPUR
MOHPUR
MOHDS1
MOHDS1
MOHDS2
MOHDS2
M O H -T E R 1
G R D B DG R D B D
F R M IXF R M IXMOHTER2
MOHTER2
MOHTER2
E C O N ME C O N M C O N VC O N V L P M R E A C TL P M R E A C T C Y C L O N E O I L S E PO I L S E P
MOHDS3
MOHDS3
MOHDS3
MOHDS3
C O N D S RC O N D S R
F L V A L V EF L V A L V EM E O H S E PM E O H S E PR P S P L I TR E C C O M P
M O H - T E R 1
D I S T V A LD I S T V A L V P D I S T C OV P D I S T C O M E O H D I S TM E O H D I S T P U R G E M IXP U R G E M IX
R E A C T H XR E A C T H XR E B H T RR E B H T R
MOHPUR
MOHPUR
MOHPUR
MOHPUR
MOHDS1
MOHDS1
MOHDS1
MOHDS1
MOHDS2
MOHDS2
MOHDS2
MOHDS2
133
134
4.8 LPMEOH Process Model Verification and Validation
The LPMEOH process model is developed in ASPEN PLUS, a chemical process
simulator. ASPEN PLUS can perform mass and energy balance of the entire LPMEOH
process in a clock time of less than 5 minutes. It is however important to verify that the
results produced by ASPEN PLUS are reasonable and in agreement with what is
expected in a real plant. The following sections describe the steps taken to verify and
validate the LPMEOH process model implemented in ASPEN PLUS.
4.8.1 Comparison of the Model Results with the Actual Plant Results
The LPMEOH process model results such as methanol produced, steam produced
in methanol reactor, steam consumed in the methanol distillation column, and purge gas
production were compared with the same results from an actual plant run using similar
operating conditions. Section 4.9 discusses the base case run of the LPMEOH process
model and compares the results with the actual plant results. The results produced by
ASPEN PLUS model are found to be in close agreement with that from actual plant. Thus
the analysis provides some proof that model behaves appropriately and resembles the
actual plant.

135
4.8.2 Sensitivity Analysis on the LPMEOH Process Model
The sensitivity analysis of LPMEOH process model is presented in Section 4.11.
Based on the sensitivity runs it is observed that for increasing reactor pressure, the
production of methanol increases because there is more syngas conversion in the reactor.
Similarly, the variation of syngas space velocity, recycle ratio and syngas composition
produces the results that are expected if an actual plant operated on similar conditions.
This provides some proof that the LPMEOH process model is correctly implemented in
ASPEN PLUS. The results of sensitivity analysis are discussed in detail in Section 4.11.
4.9 Application of the Liquid Phase Methanol (LPMEOH) Process Model to a Base Case.
In this section an example case is presented to illustrate the use of the LPMEOH
process model in ASPEN PLUS. The main application of the model is to determine,
quantitatively, the life cycle inventory parameters associated with the process. The key
steps in running the ASPENPLUS simulation model of the LPMEOH process are: (1)
specify input assumptions; (2) execute the model; and (3) collect results. The results
obtained after running the ASPEN PLUS model of LPMEOH process are used in an
EXCEL spreadsheet to calculate the LCI of methanol produced by the LPMEOH process.
136
4.9.1 Input Assumptions
Model input assumptions were developed for the LPMEOH process by the review
of samples of material balance available in DOE topical reports on the commercial scale
demonstration of LPMEOH process at Kingsport (Air Products and Chemicals, Inc.,
1998) and a visit to Kingsport. The inlet temperature, pressure, and composition of the
syngas, as available from a particular base case (actual plant run at Kingsport) are given
in Table 4-12.
Table 4-13 summarizes a number of the input assumptions for this case study, with
a focus on the key inputs for the LPMEOH reactor and FORTRAN block, CONV. Many
of these assumptions have been previously described in the technical description of the
technology. Conversion of (H2+CO) in the LPMEOH reactor is a function of reactor
pressure (P), reactor temperature (T), syngas space velocity (SV), and the molar ratio of
H2 to CO (R) entering the reactor, as stated earlier. Since P, T, and SV are fixed for a
particular base case, the conversion of CO in the reactor depends on R for a specified
simulation. During an ASPEN PLUS run of the model for a specified case, the
conversion of CO is modified continuously due to changing R in each iteration, until the
tear streams converge thereby satisfying the mass and energy balance across all the
process equipment.
137
4.9.2 Running the Model and Model Results
The first step in making an ASPENPLUS model of a process is to assemble the
various unit operations involved into a flowsheet of the process in ASPENPLUS. This is
done by selecting the unit operation block from the vertical tool bar at the left. The user
then clicks in the flowsheet area where the unit operation is desired. After building the
entire flowsheet, the user then connects the blocks by double clicking on one block and
choosing the outlet stream. By double clicking on the block, the ports for that unit
operation block are displayed and labeled. After choosing the outlet port, ASPENPLUS
reveals all of the options where the stream can inlet the other blocks. After building the
model, the streams can be labeled by selecting the stream, right clicking and choosing
Rename Stream.
Once the flowsheet connectivity is complete, the user is asked to specify the set of
components that will be used in the model. The next thing to do is to specify the unit
operation blocks (block’s operating conditions like temperature, pressure, pressure drop
etc.) for the block to run. The user then has an opportunity to choose the physical
property data set from various equation of state (EOS) models built in ASPENPLUS like
Redlich-Kwong-Soave, Peng-Robinson, NRTL, UNIFAC, Pitzer, Ideal Gas etc. The
choice is based on the type of vapor-liquid interaction expected between the components
involved in the model. FORTRAN blocks and any design specification, if needed, are
then included in the model. In the end, the sequence must be specified to indicate to
ASPENPLUS what block should be executed and in what order. If no sequence is
138
specified, then ASPENPLUS specifies its own sequence based on its understanding of the
process. When all the inputs are complete, ASPENPLUS plus displays “Required Input
Complete” on top left corner of the ASPENPLUS window indicating that model is ready
to run.
Our main interest lies in obtaining the mass flowrates of the process streams,
which are related to LCI parameters, like steam produced in LPMEOH reactor, steam
consumed in the methanol distillation columns, methanol produced, and any waste or
purge stream leaving the process. The results of ASPENPLUS base case simulation are
summarized in Table 4-14. It is observed that ASPENPLUS converges to a slightly
different mass and energy balance than the base case if Equation (4-14) is used for the
conversion of (H2+CO) as a function of P, SV, and R. The final conversion of CO, θ, at
the end of simulation is 28.6 percent, whereas in base case it is reported as 30.6 percent.
An investigation was conducted to understand why ASPENPLUS produces different
results when all the input parameters and equipment operating conditions were the same
as the base case.
Equation 4--14 was developed from the graphical data obtained from the process
economic report (Air Products and Chemicals, Inc, 1998). The equation relating (H2+CO)
conversion to P, SV, and R was in form:
C* = A (P)b (SV)c (R)d (4-16)
139
where, A was equal to 0.362.
It is found that the conversion of (H2+CO) and therefore CO is sensitive to a
change in the value of A. For example, if the value of A is 0.380 instead of 0.362, CO
conversion in the end of simulation is slightly different. On performing simulations using
hit and trial values of A, it was found that for a value of A = 0.402, ASPENPLUS
converged to mass and energy balance which closely resembled the base case. Looking at
the results that influence the LCI parameters (steam produced, steam consumed,
electricity consumed, etc.), it is seen that there is not a significant difference in them even
when the final conversion of CO is 29.2 percent as opposed to the actual base case value
of 30.6 percent. Table 4-15 shows a comparison of the results produced by both
simulations.
Thus the parameters which are of concern in terms of developing the LCI of
methanol are not sensitive to small changes in value of factor A. The following section
presents the LCI of methanol based on the results produced by ASPENPLUS process
model for the base case.
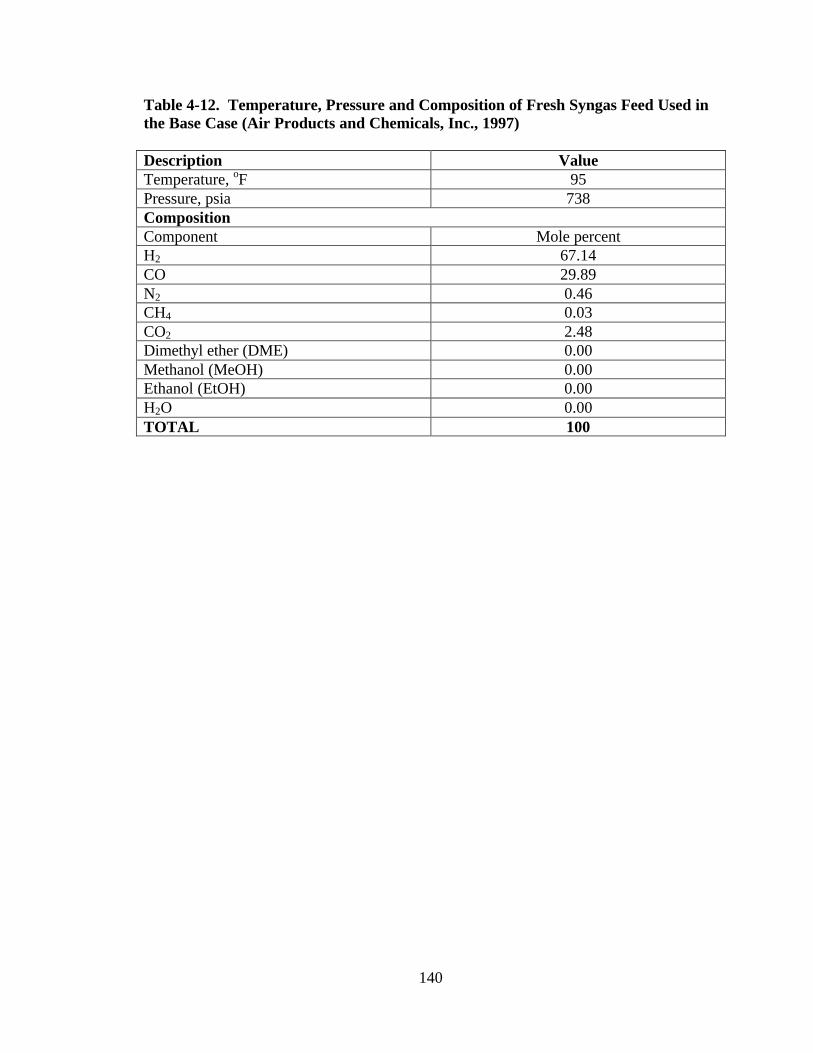
140
Table 4-12. Temperature, Pressure and Composition of Fresh Syngas Feed Used in the Base Case (Air Products and Chemicals, Inc., 1997) Description Value Temperature, oF 95 Pressure, psia 738 Composition Component Mole percent H2 67.14 CO 29.89 N2 0.46 CH4 0.03 CO2 2.48 Dimethyl ether (DME) 0.00 Methanol (MeOH) 0.00 Ethanol (EtOH) 0.00 H2O 0.00 TOTAL 100
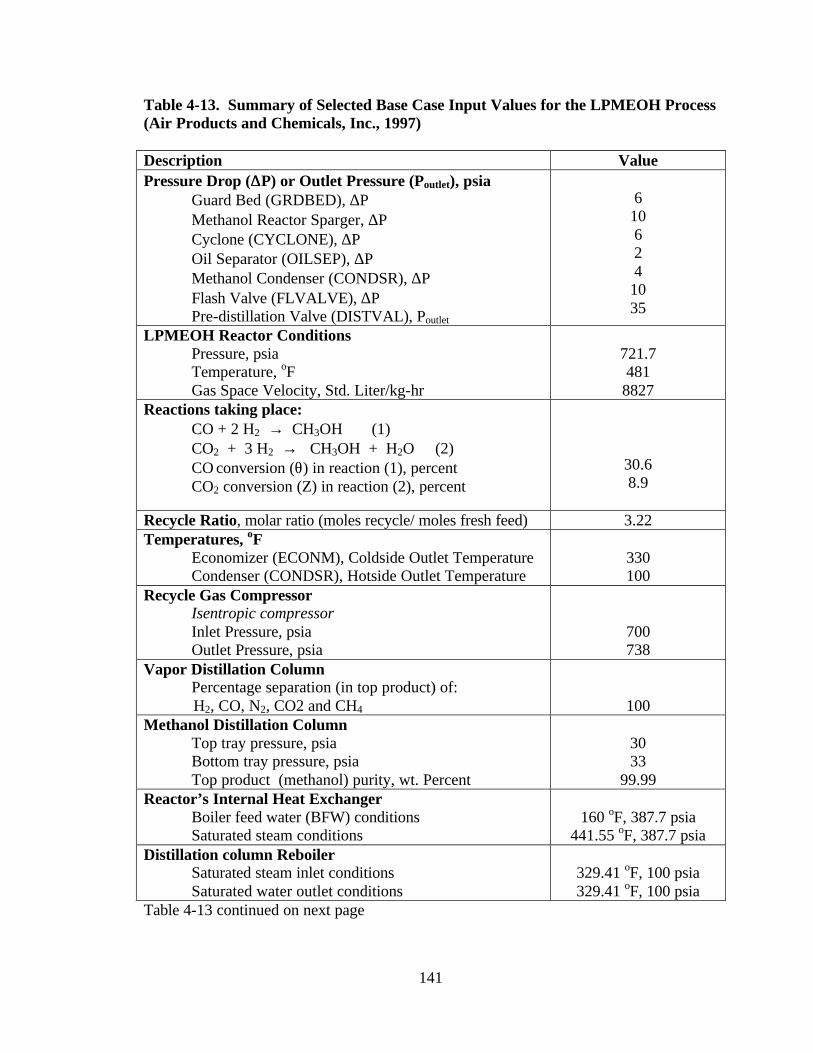
141
Table 4-13. Summary of Selected Base Case Input Values for the LPMEOH Process (Air Products and Chemicals, Inc., 1997) Description Value Pressure Drop (∆∆P) or Outlet Pressure (Poutlet), psia
Guard Bed (GRDBED), ∆P Methanol Reactor Sparger, ∆P Cyclone (CYCLONE), ∆P Oil Separator (OILSEP), ∆P Methanol Condenser (CONDSR), ∆P Flash Valve (FLVALVE), ∆P Pre-distillation Valve (DISTVAL), Poutlet
6
10 6 2 4
10 35
LPMEOH Reactor Conditions Pressure, psia Temperature, oF Gas Space Velocity, Std. Liter/kg-hr
721.7 481
8827 Reactions taking place:
CO + 2 H2 → CH3OH (1) CO2 + 3 H2 → CH3OH + H2O (2) CO conversion (θ) in reaction (1), percent CO2 conversion (Z) in reaction (2), percent
30.6 8.9
Recycle Ratio, molar ratio (moles recycle/ moles fresh feed) 3.22 Temperatures, oF
Economizer (ECONM), Coldside Outlet Temperature Condenser (CONDSR), Hotside Outlet Temperature
330 100
Recycle Gas Compressor Isentropic compressor Inlet Pressure, psia Outlet Pressure, psia
700 738
Vapor Distillation Column Percentage separation (in top product) of:
H2, CO, N2, CO2 and CH4
100 Methanol Distillation Column
Top tray pressure, psia Bottom tray pressure, psia Top product (methanol) purity, wt. Percent
30 33
99.99 Reactor’s Internal Heat Exchanger
Boiler feed water (BFW) conditions Saturated steam conditions
160 oF, 387.7 psia
441.55 oF, 387.7 psia Distillation column Reboiler
Saturated steam inlet conditions Saturated water outlet conditions
329.41 oF, 100 psia 329.41 oF, 100 psia
Table 4-13 continued on next page
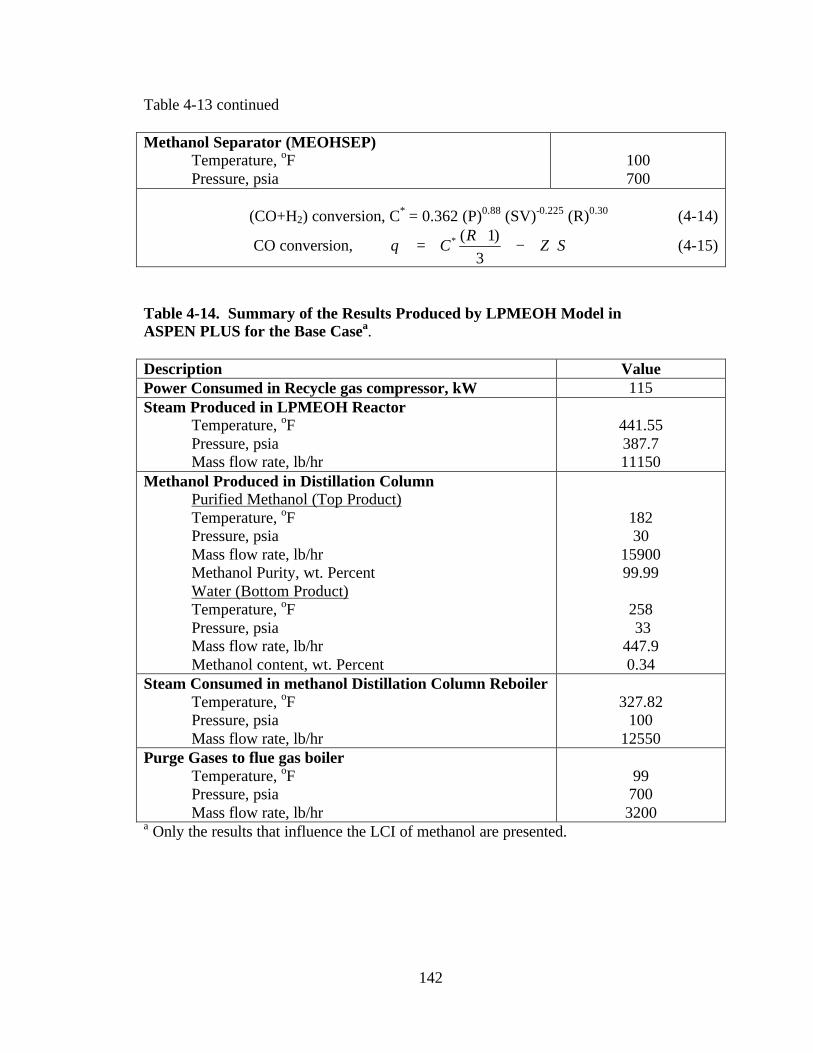
142
Table 4-13 continued
Methanol Separator (MEOHSEP) Temperature, oF Pressure, psia
100 700
(CO+H2) conversion, C* = 0.362 (P)0.88 (SV)-0.225 (R)0.30 (4-14)
CO conversion, SZR
C ⋅−+
=3
)1(*θ (4-15)
Table 4-14. Summary of the Results Produced by LPMEOH Model in ASPEN PLUS for the Base Casea. Description Value Power Consumed in Recycle gas compressor, kW 115 Steam Produced in LPMEOH Reactor
Temperature, oF Pressure, psia Mass flow rate, lb/hr
441.55 387.7 11150
Methanol Produced in Distillation Column Purified Methanol (Top Product) Temperature, oF Pressure, psia Mass flow rate, lb/hr Methanol Purity, wt. Percent Water (Bottom Product) Temperature, oF Pressure, psia Mass flow rate, lb/hr Methanol content, wt. Percent
182 30
15900 99.99
258 33
447.9 0.34
Steam Consumed in methanol Distillation Column Reboiler Temperature, oF Pressure, psia Mass flow rate, lb/hr
327.82
100 12550
Purge Gases to flue gas boiler Temperature, oF Pressure, psia Mass flow rate, lb/hr
99
700 3200
a Only the results that influence the LCI of methanol are presented.
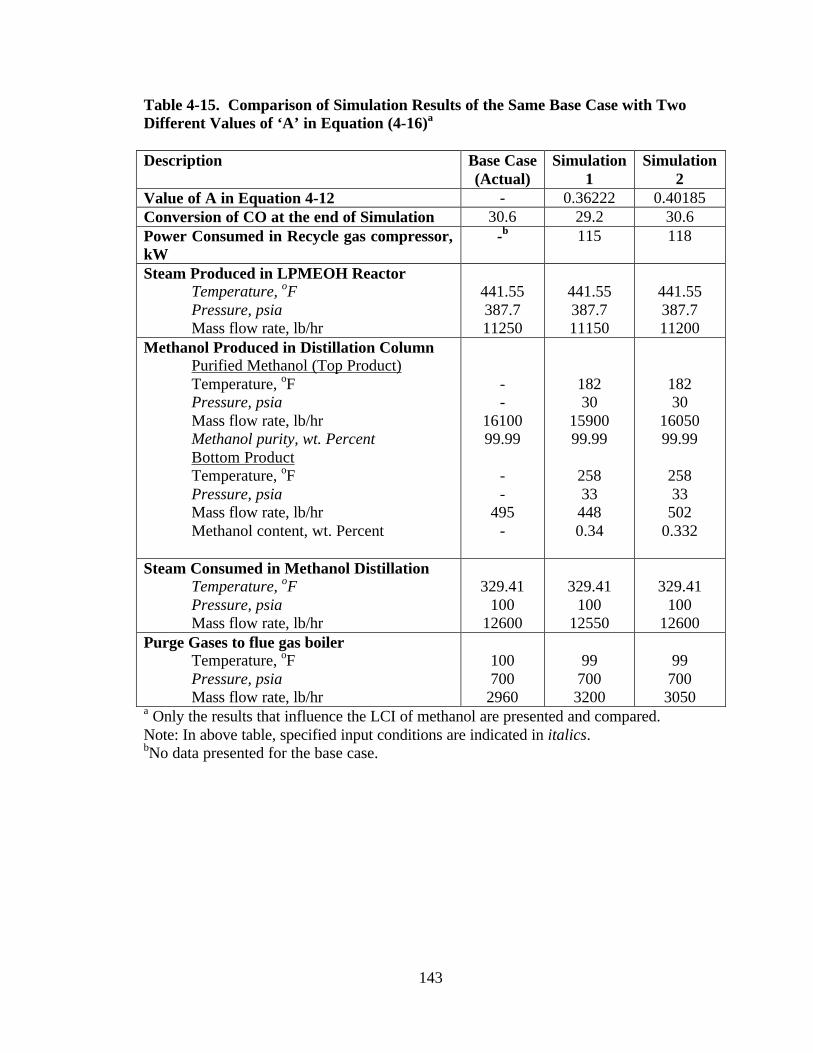
143
Table 4-15. Comparison of Simulation Results of the Same Base Case with Two Different Values of ‘A’ in Equation (4-16)a Description Base Case
(Actual) Simulation
1 Simulation
2 Value of A in Equation 4-12 - 0.36222 0.40185 Conversion of CO at the end of Simulation 30.6 29.2 30.6 Power Consumed in Recycle gas compressor, kW
-b 115 118
Steam Produced in LPMEOH Reactor Temperature, oF Pressure, psia Mass flow rate, lb/hr
441.55 387.7 11250
441.55 387.7 11150
441.55 387.7 11200
Methanol Produced in Distillation Column Purified Methanol (Top Product) Temperature, oF Pressure, psia Mass flow rate, lb/hr Methanol purity, wt. Percent Bottom Product Temperature, oF Pressure, psia Mass flow rate, lb/hr Methanol content, wt. Percent
- -
16100 99.99
- -
495 -
182 30
15900 99.99
258 33
448 0.34
182 30
16050 99.99
258 33
502 0.332
Steam Consumed in Methanol Distillation Temperature, oF Pressure, psia Mass flow rate, lb/hr
329.41
100 12600
329.41
100 12550
329.41
100 12600
Purge Gases to flue gas boiler Temperature, oF Pressure, psia Mass flow rate, lb/hr
100 700
2960
99
700 3200
99
700 3050
a Only the results that influence the LCI of methanol are presented and compared. Note: In above table, specified input conditions are indicated in italics. bNo data presented for the base case.
144
4.10 Life Cycle Inventory of LPMEOH Process
A methodology to calculate emissions associated with the LPMEOH process is
presented here. The methodology considers emissions at a LPMEOH facility as well as
emissions that are generated due to electricity and steam consumption. The LCI of steam
and electricity is used directly from Chapters 2 and 3, respectively. Emissions are
calculated in units of kg pollutant per kg of methanol produced.
4.10.1 System Boundaries and Design Basis
The LPMEOH LCI modeling includes all activities associated with the operating
LPMEOH facility starting with the syngas. The LCIs of steam and electricity are
considered in separate spreadsheet models, the results from which are then imported into
the overall spreadsheet model for the LCI of methanol from the LPMEOH process. It was
assumed that emissions associated with construction of the LPMEOH facility were not
significant and these emissions are not considered in the LCI. Energy recovered from
thermal oxidation of purge gases from the LPMEOH system was assumed to be in the
form of heat, which raises steam in steam boiler. The emissions that are avoided because
of this steam generation were subtracted from the LPMEOH process emissions to
calculate the overall LCI of methanol from LPMEOH process.
The LCI of methanol produced in the LPMEOH process is a function of syngas
composition, temperature and pressure. It is also a function of reactor pressure, gas space
145
velocity in the reactor and the recycle to fresh feed molar ratio. The process as described
in previous sections is modeled in ASPENPLUS and the model results are directly used
in an EXCEL spreadsheet in conjunction with the LCIs of steam and electricity to
develop the overall LCI of methanol. The results produced by the LPMEOH model that
are of concern for developing the LCI of methanol are: steam generated in the methanol
reactor, steam consumed in methanol distillation section, electric power consumed by the
recycle gas compressor, purge gases produced from the process that are then combusted
to generate steam in a boiler, and the amount of methanol produced. Information on
fugitive emissions and other wastes that could not be modeled in ASPENPLUS is derived
from the environmental information volume on the LPMEOH process (Air Products and
Chemicals, Inc., 1995).
LCI parameters considered include gaseous and liquid releases as well as solid
waste. Although it is assumed that there are no water releases or solid waste production in
the LPMEOH process, these parameters are included because such releases are associated
with the LCI of electrical energy and steam. Table 4-16 lists the parameters that are
considered in the LCI of the LPMEOH process. Individual components of the overall LCI
like steam, electricity, purge gas emissions, fugitive emissions also have the same LCI
parameters. Wherever the information regarding a particular LCI parameter is not
available, it is left blank indicating that “no data” is available for that parameter. The
methodology used to calculate and allocate emissions from each part of LPMEOH
process is described in the following section.
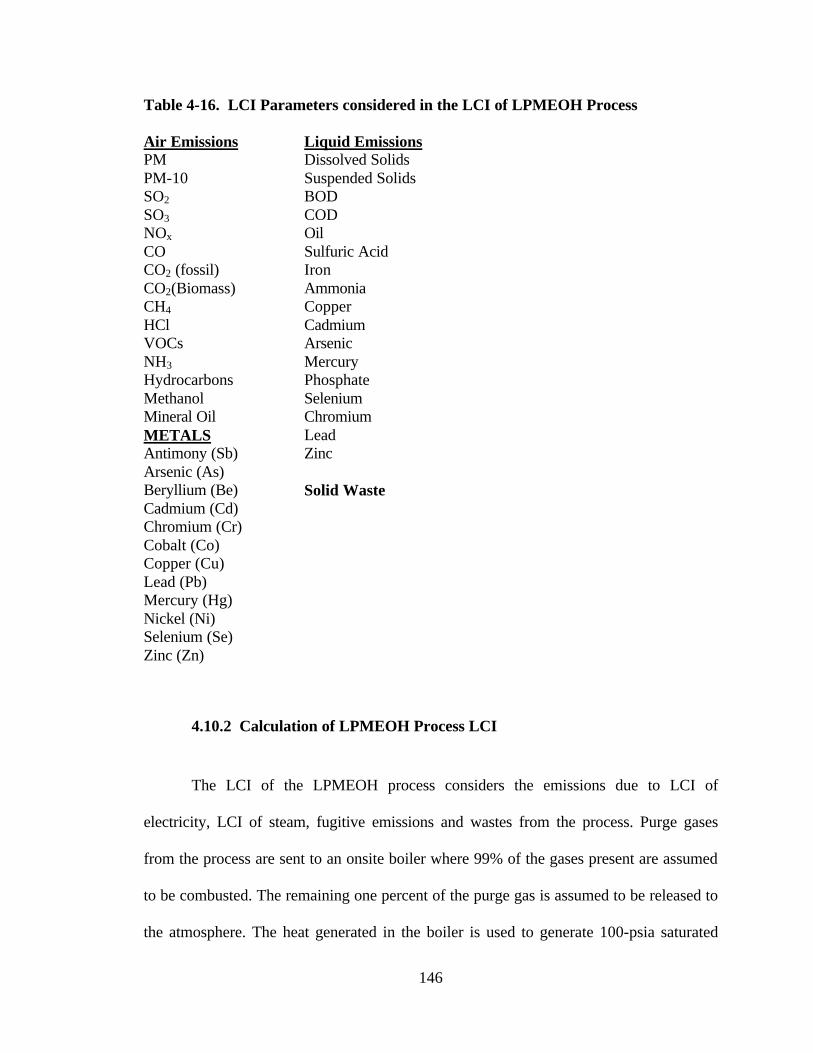
146
Table 4-16. LCI Parameters considered in the LCI of LPMEOH Process Air Emissions Liquid Emissions PM Dissolved Solids PM-10 Suspended Solids SO2 BOD SO3 COD NOx Oil CO Sulfuric Acid CO2 (fossil) Iron CO2(Biomass) Ammonia CH4 Copper HCl Cadmium VOCs Arsenic NH3 Mercury Hydrocarbons Phosphate Methanol Selenium Mineral Oil Chromium METALS Lead Antimony (Sb) Zinc Arsenic (As) Beryllium (Be) Solid Waste Cadmium (Cd) Chromium (Cr) Cobalt (Co) Copper (Cu) Lead (Pb) Mercury (Hg) Nickel (Ni) Selenium (Se) Zinc (Zn)
4.10.2 Calculation of LPMEOH Process LCI
The LCI of the LPMEOH process considers the emissions due to LCI of
electricity, LCI of steam, fugitive emissions and wastes from the process. Purge gases
from the process are sent to an onsite boiler where 99% of the gases present are assumed
to be combusted. The remaining one percent of the purge gas is assumed to be released to
the atmosphere. The heat generated in the boiler is used to generate 100-psia saturated
147
steam. The methodology used to calculate and allocate energy used and associated
emissions are described in this section.
4.10.2.1 Emissions associated with LCI of Steam
The LPMEOH process produces the 387.7 psia-saturated steam in the reactor’s
internal heat exchanger for the base case. The methanol purification section of the
process uses 100 psia-saturated steam in distillation column’s reboiler. Again the
LPMEOH process model reports the amount of steam consumed in the distillation
column reboiler. The steam produced in the reactor’s heat exchanger can be blown down
to 100-psia steam to meet the steam demand for distillation. If steam generated in the
reactor is more than steam required in distillation, the balance can be used elsewhere in
the process plant but if the steam required in distillation is more than steam generated in
the reactor, the difference must be supplied. It is found that 387.7 psia saturated steam
when blown down to 100 psia saturated steam, produces 900 kWh per day in a steam
turbine with 75 percent efficiency. This would result in revenue of $18 per day based on
an electricity price of 2 cents per kWh. Further it is found that bare module capital cost of
a turbine is more than $100,000 (Ulrich, 1984). Since the cost of a steam turbine is very
high, the steam at 387.7 psia is assumed to be blown down to 100 psia in pressure relief
valve with no energy recovery.
Thus 100-psia steam required in the process is obtained from 387.7 psia steam
generated in the process. The difference is supplied from a steam boiler. Since the only

148
steam now required in the process is the difference between the 100 psia steam used and
387.7-psia steam generated, the LCI conducted on this steam difference would give the
LCI of steam emissions associated with the LPMEOH process. Table 4-17 presents the
steam generated and the steam consumed in the LPMEOH process for the base case and
the difference. It also presents the LCI of steam, as applicable to LPMEOH process, for
the base case. The documentation for the LCI of steam can be found in Chapter 2. The
only inputs required in the LCI of steam spreadsheet are the total enthalpy carried by the
steam (MJ/hr) and the amount of methanol produced.
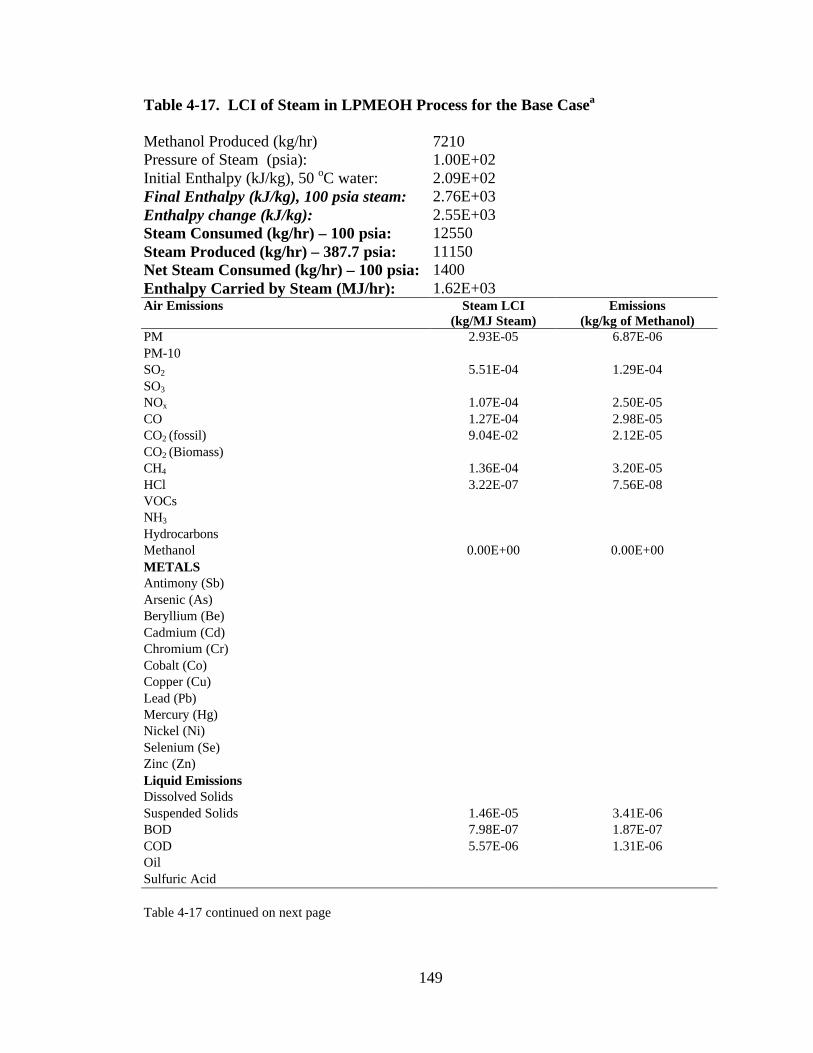
149
Table 4-17. LCI of Steam in LPMEOH Process for the Base Casea
Methanol Produced (kg/hr) 7210 Pressure of Steam (psia): 1.00E+02 Initial Enthalpy (kJ/kg), 50 oC water: 2.09E+02 Final Enthalpy (kJ/kg), 100 psia steam: 2.76E+03 Enthalpy change (kJ/kg): 2.55E+03 Steam Consumed (kg/hr) – 100 psia: 12550 Steam Produced (kg/hr) – 387.7 psia: 11150 Net Steam Consumed (kg/hr) – 100 psia: 1400 Enthalpy Carried by Steam (MJ/hr): 1.62E+03 Air Emissions Steam LCI
(kg/MJ Steam) Emissions
(kg/kg of Methanol) PM 2.93E-05 6.87E-06 PM-10 SO2 5.51E-04 1.29E-04 SO3 NOx 1.07E-04 2.50E-05 CO 1.27E-04 2.98E-05 CO2 (fossil) 9.04E-02 2.12E-05 CO2 (Biomass) CH4 1.36E-04 3.20E-05 HCl 3.22E-07 7.56E-08 VOCs NH3 Hydrocarbons Methanol 0.00E+00 0.00E+00 METALS Antimony (Sb) Arsenic (As) Beryllium (Be) Cadmium (Cd) Chromium (Cr) Cobalt (Co) Copper (Cu) Lead (Pb) Mercury (Hg) Nickel (Ni) Selenium (Se) Zinc (Zn) Liquid Emissions Dissolved Solids Suspended Solids 1.46E-05 3.41E-06 BOD 7.98E-07 1.87E-07 COD 5.57E-06 1.31E-06 Oil Sulfuric Acid Table 4-17 continued on next page
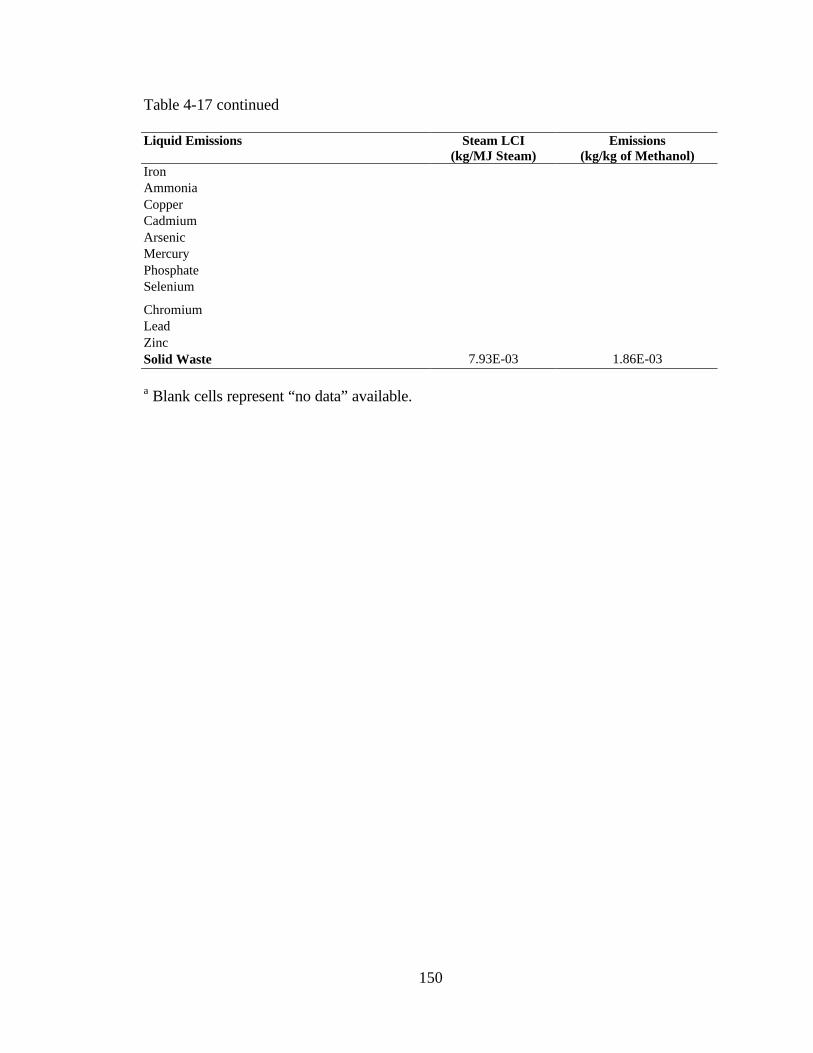
150
Table 4-17 continued
Liquid Emissions Steam LCI (kg/MJ Steam)
Emissions (kg/kg of Methanol)
Iron Ammonia Copper Cadmium Arsenic Mercury Phosphate Selenium
Chromium Lead Zinc Solid Waste 7.93E-03 1.86E-03
a Blank cells represent “no data” available.
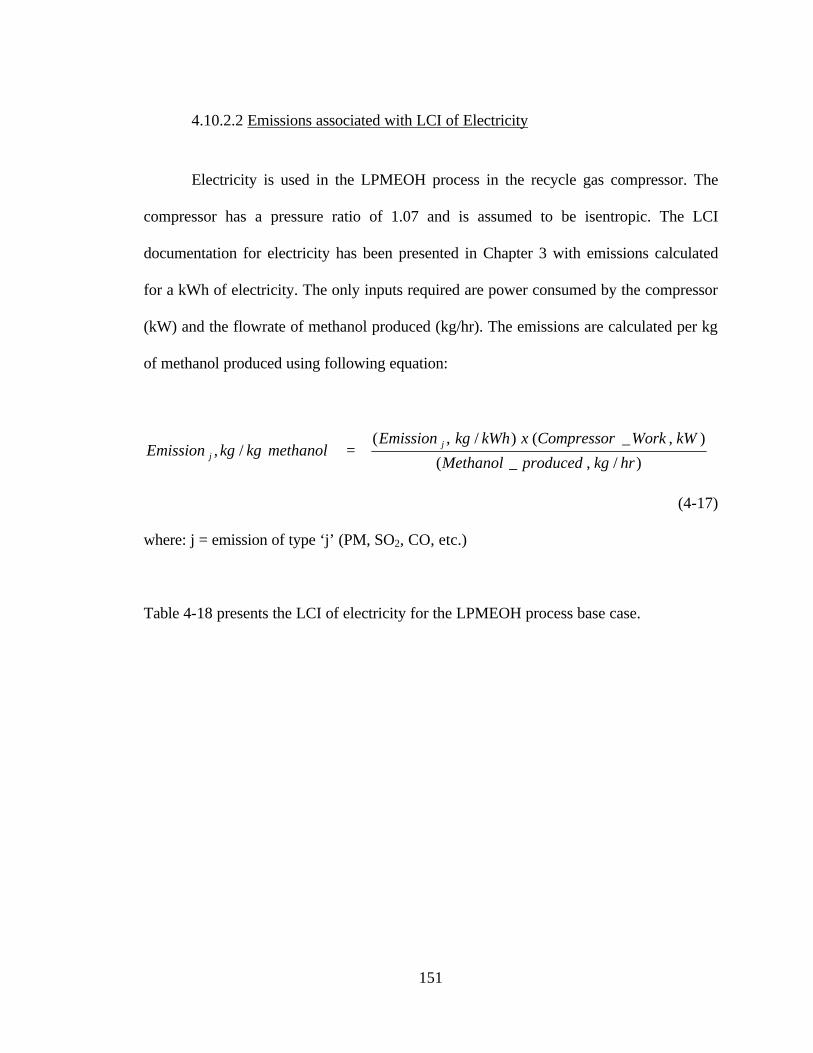
151
4.10.2.2 Emissions associated with LCI of Electricity
Electricity is used in the LPMEOH process in the recycle gas compressor. The
compressor has a pressure ratio of 1.07 and is assumed to be isentropic. The LCI
documentation for electricity has been presented in Chapter 3 with emissions calculated
for a kWh of electricity. The only inputs required are power consumed by the compressor
(kW) and the flowrate of methanol produced (kg/hr). The emissions are calculated per kg
of methanol produced using following equation:
)/,_(
),_()/,(/,
hrkgproducedMethanol
kWWorkCompressorxkWhkgEmissionmethanolkgkgEmission j
j =
(4-17)
where: j = emission of type ‘j’ (PM, SO2, CO, etc.)
Table 4-18 presents the LCI of electricity for the LPMEOH process base case.
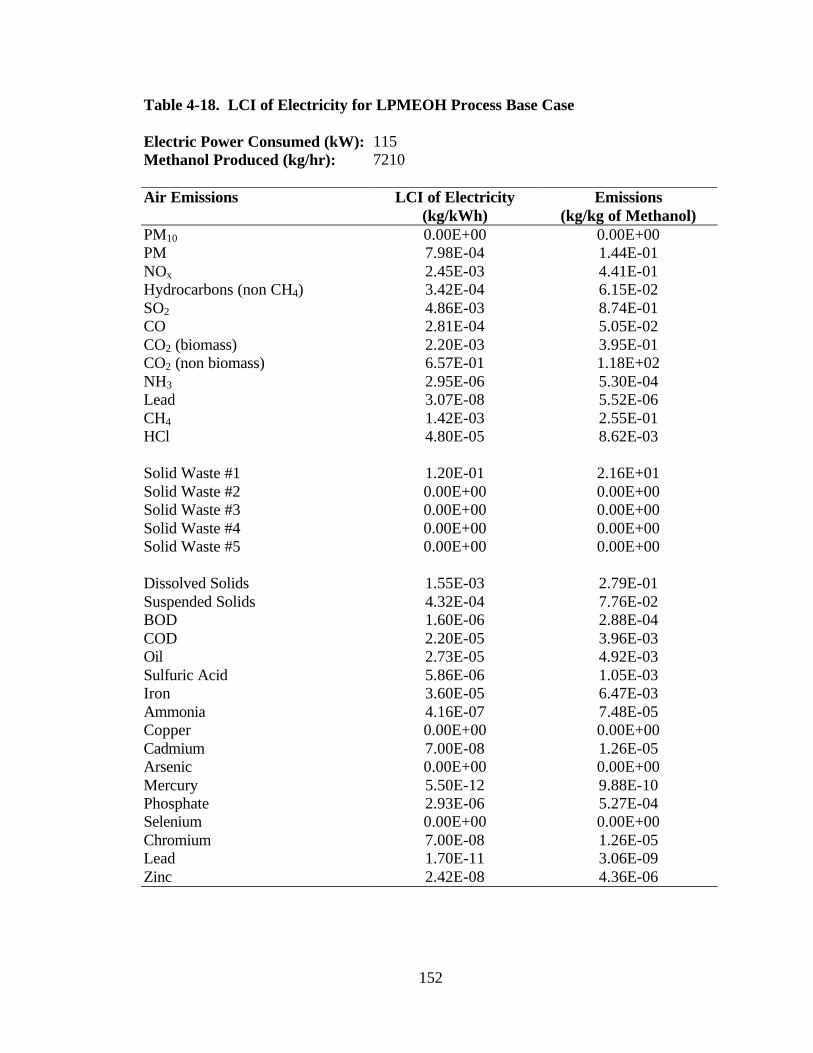
152
Table 4-18. LCI of Electricity for LPMEOH Process Base Case Electric Power Consumed (kW): 115 Methanol Produced (kg/hr): 7210 Air Emissions LCI of Electricity
(kg/kWh) Emissions
(kg/kg of Methanol) PM10 0.00E+00 0.00E+00 PM 7.98E-04 1.44E-01 NOx 2.45E-03 4.41E-01 Hydrocarbons (non CH4) 3.42E-04 6.15E-02 SO2 4.86E-03 8.74E-01 CO 2.81E-04 5.05E-02 CO2 (biomass) 2.20E-03 3.95E-01 CO2 (non biomass) 6.57E-01 1.18E+02 NH3 2.95E-06 5.30E-04 Lead 3.07E-08 5.52E-06 CH4 1.42E-03 2.55E-01 HCl 4.80E-05 8.62E-03
Solid Waste #1 1.20E-01 2.16E+01 Solid Waste #2 0.00E+00 0.00E+00 Solid Waste #3 0.00E+00 0.00E+00 Solid Waste #4 0.00E+00 0.00E+00 Solid Waste #5 0.00E+00 0.00E+00
Dissolved Solids 1.55E-03 2.79E-01 Suspended Solids 4.32E-04 7.76E-02 BOD 1.60E-06 2.88E-04 COD 2.20E-05 3.96E-03 Oil 2.73E-05 4.92E-03 Sulfuric Acid 5.86E-06 1.05E-03 Iron 3.60E-05 6.47E-03 Ammonia 4.16E-07 7.48E-05 Copper 0.00E+00 0.00E+00 Cadmium 7.00E-08 1.26E-05 Arsenic 0.00E+00 0.00E+00 Mercury 5.50E-12 9.88E-10 Phosphate 2.93E-06 5.27E-04 Selenium 0.00E+00 0.00E+00 Chromium 7.00E-08 1.26E-05 Lead 1.70E-11 3.06E-09 Zinc 2.42E-08 4.36E-06
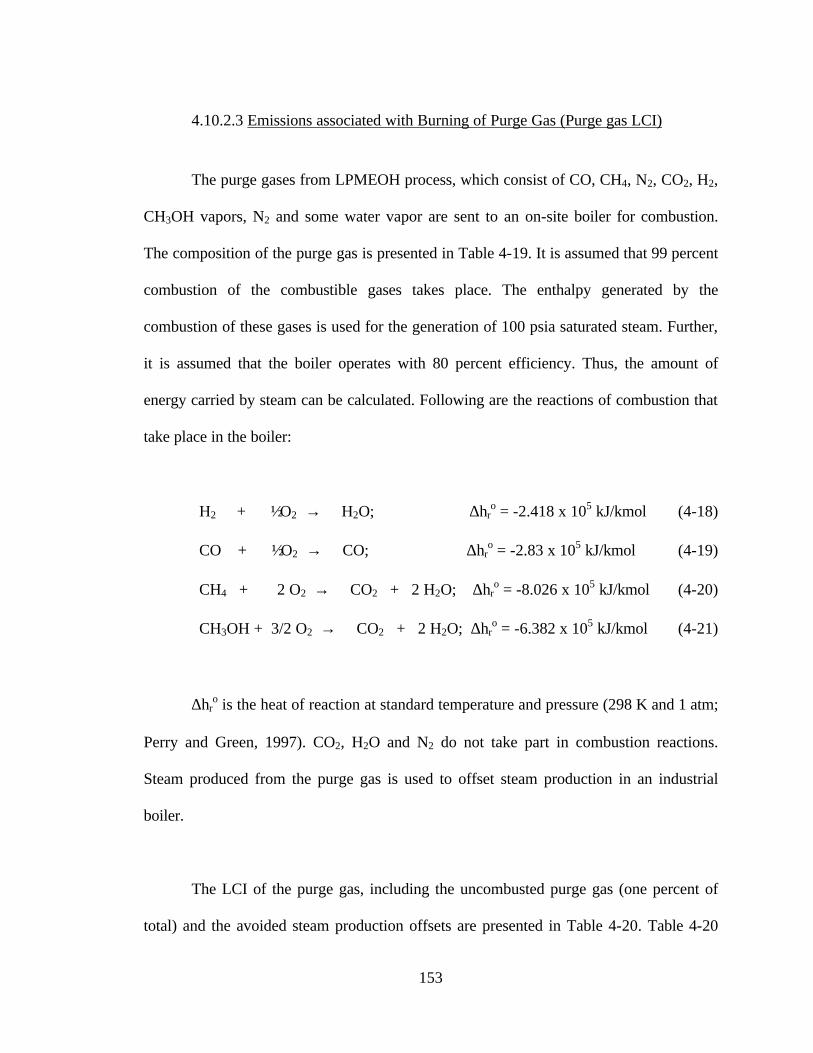
153
4.10.2.3 Emissions associated with Burning of Purge Gas (Purge gas LCI)
The purge gases from LPMEOH process, which consist of CO, CH4, N2, CO2, H2,
CH3OH vapors, N2 and some water vapor are sent to an on-site boiler for combustion.
The composition of the purge gas is presented in Table 4-19. It is assumed that 99 percent
combustion of the combustible gases takes place. The enthalpy generated by the
combustion of these gases is used for the generation of 100 psia saturated steam. Further,
it is assumed that the boiler operates with 80 percent efficiency. Thus, the amount of
energy carried by steam can be calculated. Following are the reactions of combustion that
take place in the boiler:
H2 + ½ O2 → H2O; ∆hro = -2.418 x 10⁵ kJ/kmol (4-18)
CO + ½ O2 → CO; ∆hro = -2.83 x 10⁵ kJ/kmol (4-19)
CH4 + 2 O2 → CO2 + 2 H2O; ∆hro = -8.026 x 10⁵ kJ/kmol (4-20)
CH3OH + 3/2 O2 → CO2 + 2 H2O; ∆hro = -6.382 x 10⁵ kJ/kmol (4-21)
∆hro is the heat of reaction at standard temperature and pressure (298 K and 1 atm;
Perry and Green, 1997). CO2, H2O and N2 do not take part in combustion reactions.
Steam produced from the purge gas is used to offset steam production in an industrial
boiler.
The LCI of the purge gas, including the uncombusted purge gas (one percent of
total) and the avoided steam production offsets are presented in Table 4-20. Table 4-20
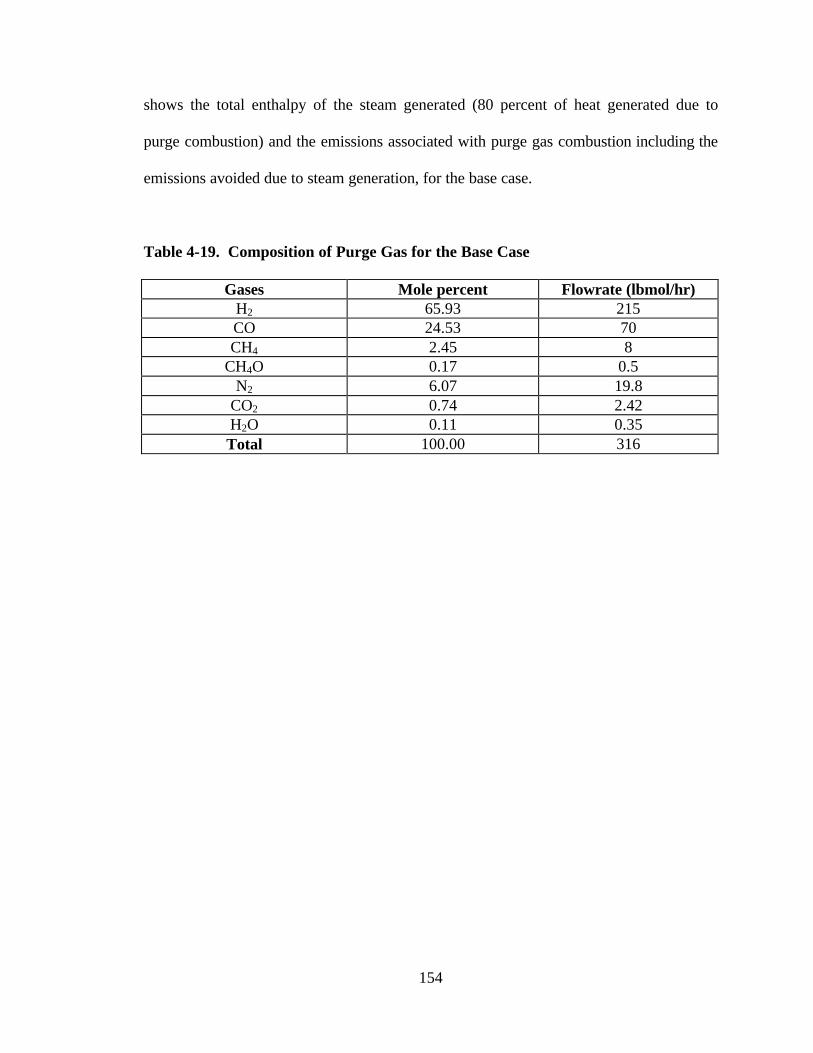
154
shows the total enthalpy of the steam generated (80 percent of heat generated due to
purge combustion) and the emissions associated with purge gas combustion including the
emissions avoided due to steam generation, for the base case.
Table 4-19. Composition of Purge Gas for the Base Case
Gases Mole percent Flowrate (lbmol/hr) H2 65.93 215 CO 24.53 70 CH4 2.45 8
CH4O 0.17 0.5 N2 6.07 19.8
CO2 0.74 2.42 H2O 0.11 0.35 Total 100.00 316
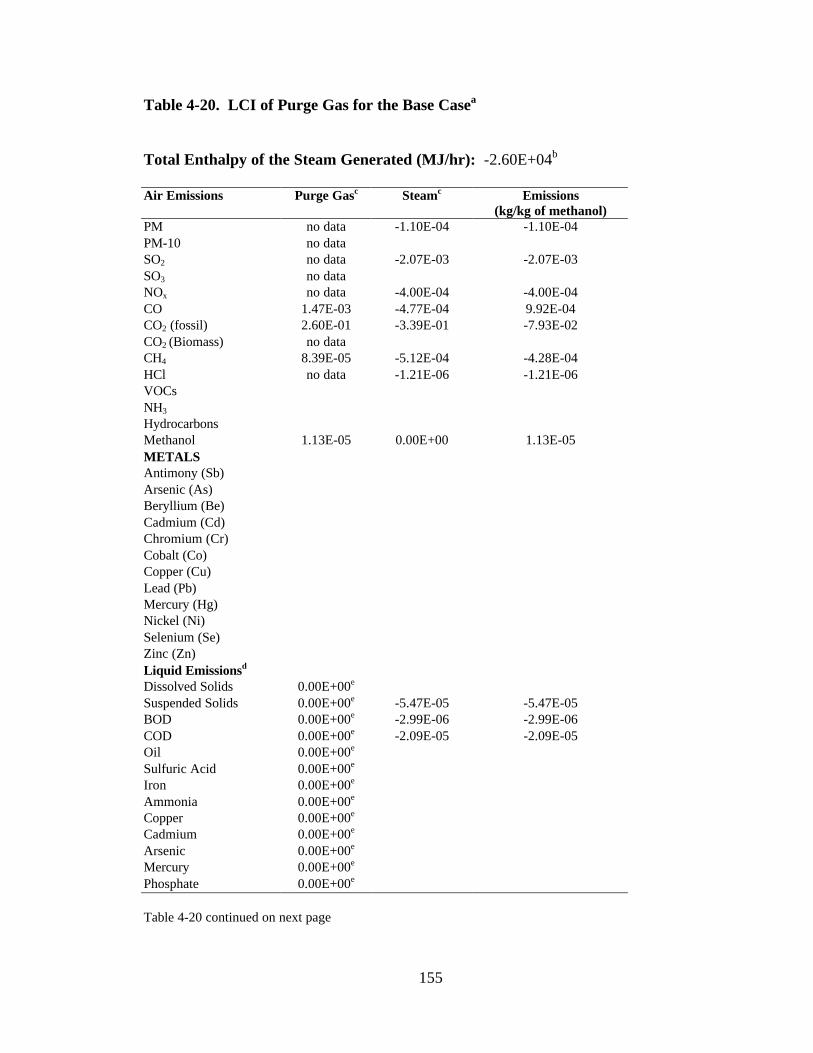
155
Table 4-20. LCI of Purge Gas for the Base Casea Total Enthalpy of the Steam Generated (MJ/hr): -2.60E+04b
Air Emissions Purge Gasc
Steamc Emissions
(kg/kg of methanol) PM no data -1.10E-04 -1.10E-04 PM-10 no data SO2 no data -2.07E-03 -2.07E-03 SO3 no data NOx no data -4.00E-04 -4.00E-04 CO 1.47E-03 -4.77E-04 9.92E-04 CO2 (fossil) 2.60E-01 -3.39E-01 -7.93E-02 CO2 (Biomass) no data CH4 8.39E-05 -5.12E-04 -4.28E-04 HCl no data -1.21E-06 -1.21E-06 VOCs NH3 Hydrocarbons Methanol 1.13E-05 0.00E+00 1.13E-05 METALS Antimony (Sb) Arsenic (As) Beryllium (Be) Cadmium (Cd) Chromium (Cr) Cobalt (Co) Copper (Cu) Lead (Pb) Mercury (Hg) Nickel (Ni) Selenium (Se) Zinc (Zn) Liquid Emissionsd Dissolved Solids 0.00E+00e Suspended Solids 0.00E+00e -5.47E-05 -5.47E-05 BOD 0.00E+00e -2.99E-06 -2.99E-06 COD 0.00E+00e -2.09E-05 -2.09E-05 Oil 0.00E+00e Sulfuric Acid 0.00E+00e Iron 0.00E+00e Ammonia 0.00E+00e Copper 0.00E+00e Cadmium 0.00E+00e Arsenic 0.00E+00e Mercury 0.00E+00e Phosphate 0.00E+00e Table 4-20 continued on next page
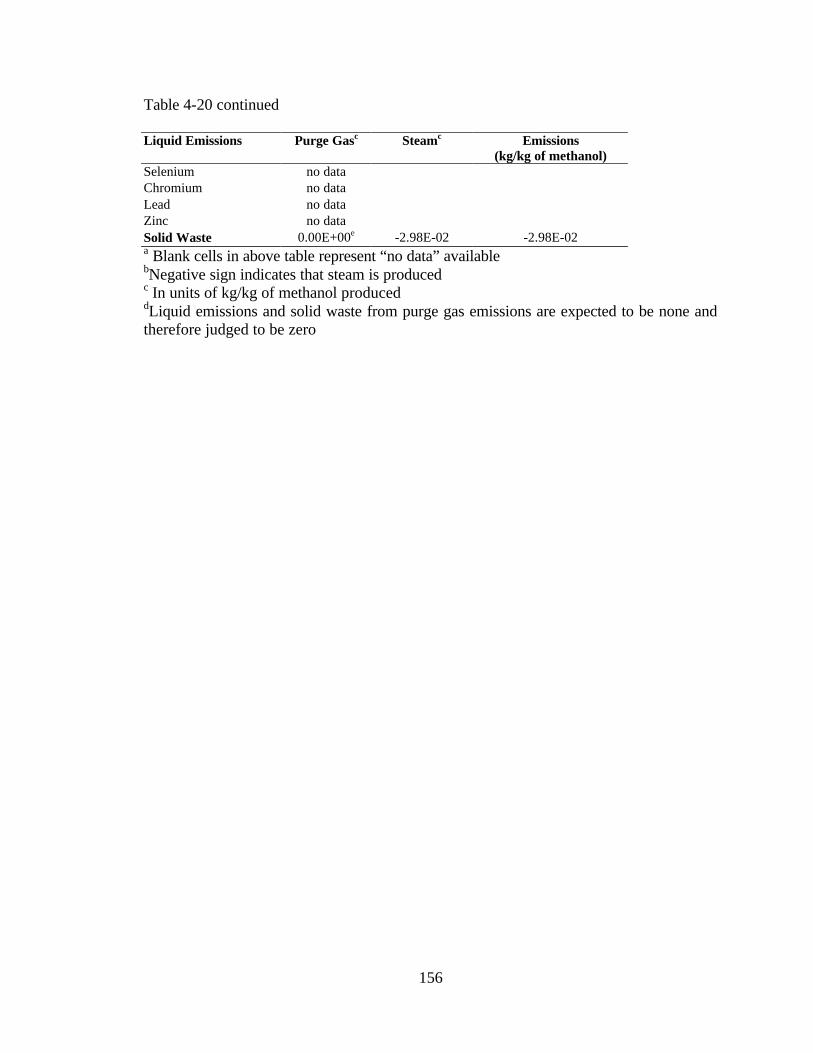
156
Table 4-20 continued
Liquid Emissions Purge Gasc
Steamc Emissions (kg/kg of methanol)
Selenium no data Chromium no data Lead no data Zinc no data Solid Waste 0.00E+00e -2.98E-02 -2.98E-02 a Blank cells in above table represent “no data” available bNegative sign indicates that steam is produced c In units of kg/kg of methanol produced dLiquid emissions and solid waste from purge gas emissions are expected to be none and therefore judged to be zero
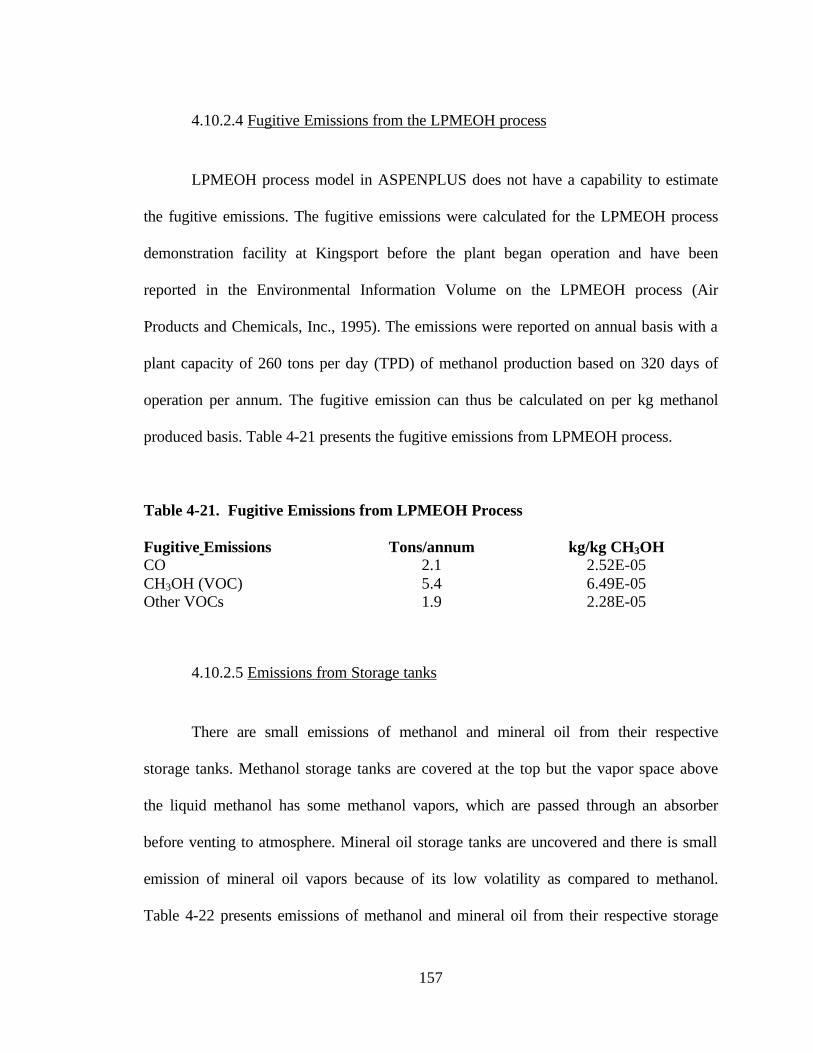
157
4.10.2.4 Fugitive Emissions from the LPMEOH process
LPMEOH process model in ASPENPLUS does not have a capability to estimate
the fugitive emissions. The fugitive emissions were calculated for the LPMEOH process
demonstration facility at Kingsport before the plant began operation and have been
reported in the Environmental Information Volume on the LPMEOH process (Air
Products and Chemicals, Inc., 1995). The emissions were reported on annual basis with a
plant capacity of 260 tons per day (TPD) of methanol production based on 320 days of
operation per annum. The fugitive emission can thus be calculated on per kg methanol
produced basis. Table 4-21 presents the fugitive emissions from LPMEOH process.
Table 4-21. Fugitive Emissions from LPMEOH Process Fugitive Emissions Tons/annum kg/kg CH3OH CO 2.1 2.52E-05 CH3OH (VOC) 5.4 6.49E-05 Other VOCs 1.9 2.28E-05
4.10.2.5 Emissions from Storage tanks
There are small emissions of methanol and mineral oil from their respective
storage tanks. Methanol storage tanks are covered at the top but the vapor space above
the liquid methanol has some methanol vapors, which are passed through an absorber
before venting to atmosphere. Mineral oil storage tanks are uncovered and there is small
emission of mineral oil vapors because of its low volatility as compared to methanol.
Table 4-22 presents emissions of methanol and mineral oil from their respective storage
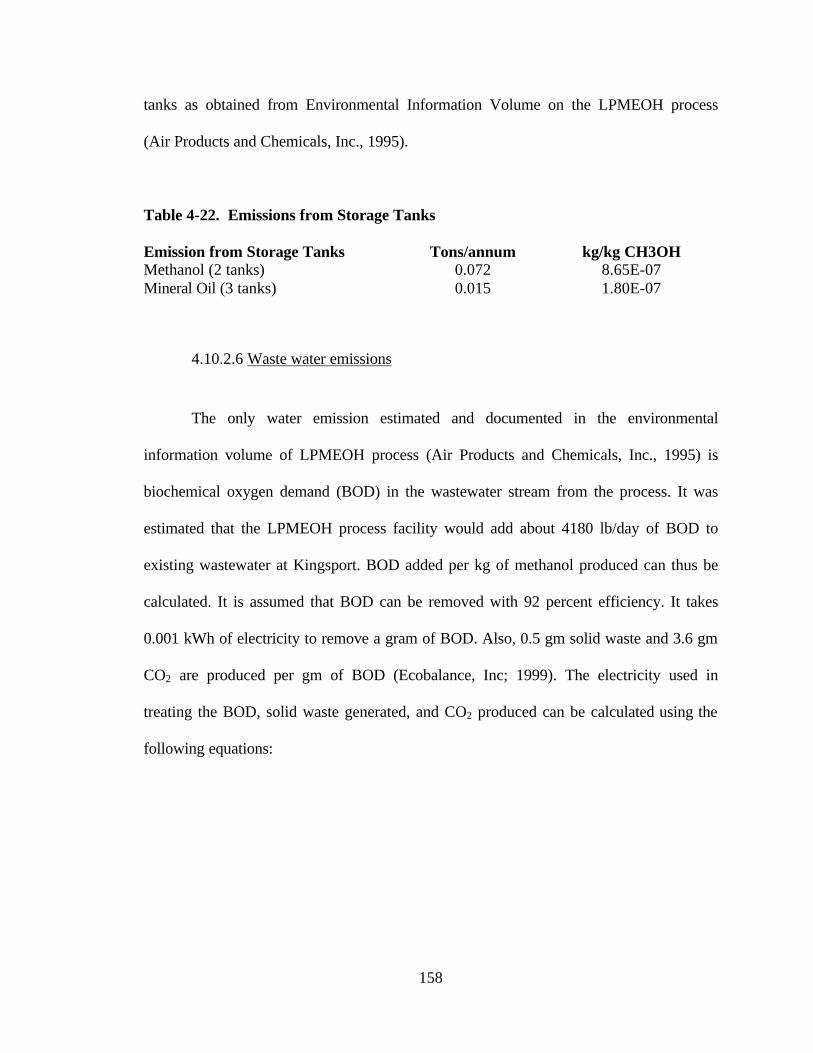
158
tanks as obtained from Environmental Information Volume on the LPMEOH process
(Air Products and Chemicals, Inc., 1995).
Table 4-22. Emissions from Storage Tanks Emission from Storage Tanks Tons/annum kg/kg CH3OH Methanol (2 tanks) 0.072 8.65E-07 Mineral Oil (3 tanks) 0.015 1.80E-07
4.10.2.6 Waste water emissions
The only water emission estimated and documented in the environmental
information volume of LPMEOH process (Air Products and Chemicals, Inc., 1995) is
biochemical oxygen demand (BOD) in the wastewater stream from the process. It was
estimated that the LPMEOH process facility would add about 4180 lb/day of BOD to
existing wastewater at Kingsport. BOD added per kg of methanol produced can thus be
calculated. It is assumed that BOD can be removed with 92 percent efficiency. It takes
0.001 kWh of electricity to remove a gram of BOD. Also, 0.5 gm solid waste and 3.6 gm
CO2 are produced per gm of BOD (Ecobalance, Inc; 1999). The electricity used in
treating the BOD, solid waste generated, and CO2 produced can be calculated using the
following equations:
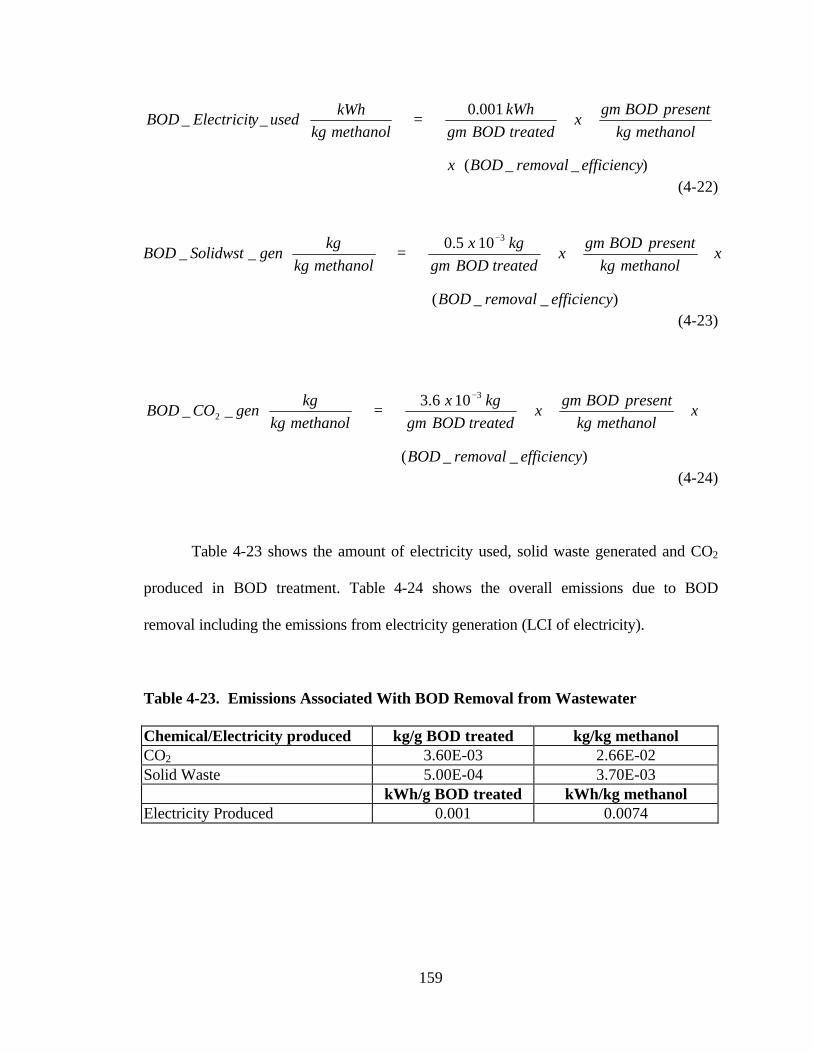
159
)__(
001.0__
efficiencyremovalBODx
methanolkg
presentBODgmx
treatedBODgm
kWh
methanolkg
kWhusedyElectricitBOD
=
(4-22)
(4-23)
(4-24)
Table 4-23 shows the amount of electricity used, solid waste generated and CO2
produced in BOD treatment. Table 4-24 shows the overall emissions due to BOD
removal including the emissions from electricity generation (LCI of electricity).
Table 4-23. Emissions Associated With BOD Removal from Wastewater Chemical/Electricity produced kg/g BOD treated kg/kg methanol CO2 3.60E-03 2.66E-02 Solid Waste 5.00E-04 3.70E-03
kWh/g BOD treated kWh/kg methanol Electricity Produced 0.001 0.0074
)__(
105.0__
3
efficiencyremovalBOD
xmethanolkg
presentBODgmx
treatedBODgm
kgx
methanolkg
kggenSolidwstBOD
=
−
)__(
106.3__
3
2
efficiencyremovalBOD
xmethanolkg
presentBODgmx
treatedBODgm
kgx
methanolkg
kggenCOBOD
=
−
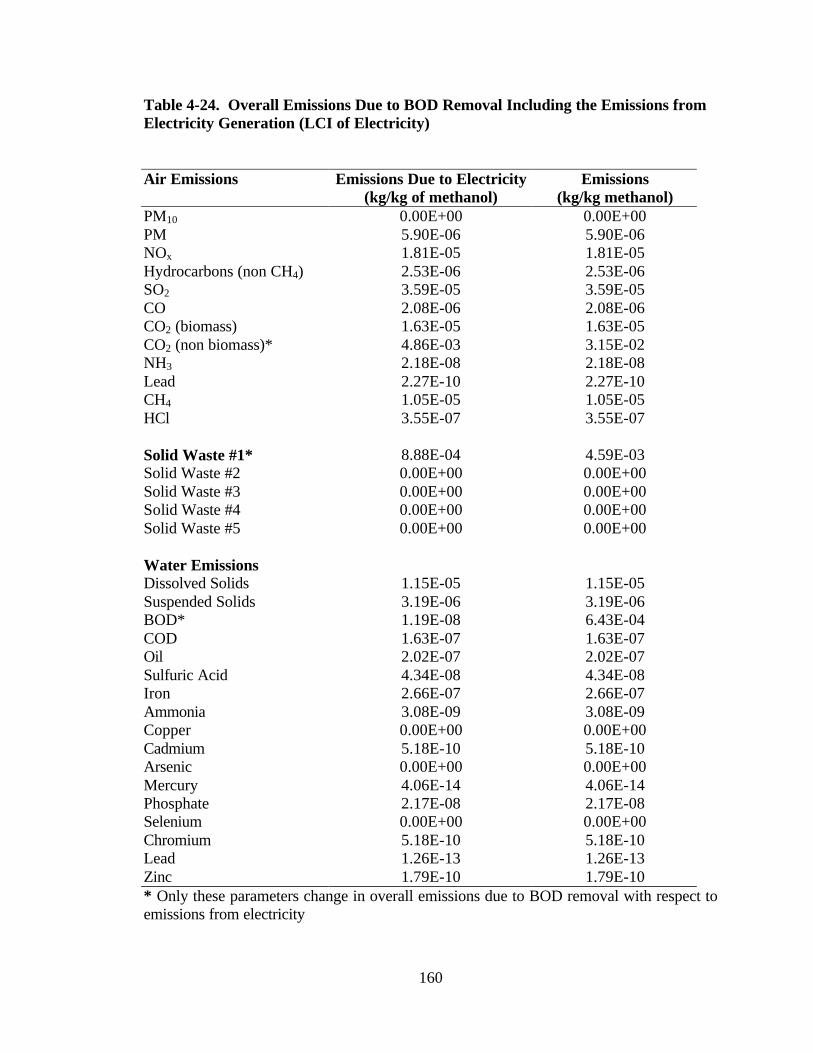
160
Table 4-24. Overall Emissions Due to BOD Removal Including the Emissions from Electricity Generation (LCI of Electricity)
Air Emissions Emissions Due to Electricity (kg/kg of methanol)
Emissions (kg/kg methanol)
PM10 0.00E+00 0.00E+00 PM 5.90E-06 5.90E-06 NOx 1.81E-05 1.81E-05 Hydrocarbons (non CH4) 2.53E-06 2.53E-06 SO2 3.59E-05 3.59E-05 CO 2.08E-06 2.08E-06 CO2 (biomass) 1.63E-05 1.63E-05 CO2 (non biomass)* 4.86E-03 3.15E-02 NH3 2.18E-08 2.18E-08 Lead 2.27E-10 2.27E-10 CH4 1.05E-05 1.05E-05 HCl 3.55E-07 3.55E-07
Solid Waste #1* 8.88E-04 4.59E-03 Solid Waste #2 0.00E+00 0.00E+00 Solid Waste #3 0.00E+00 0.00E+00 Solid Waste #4 0.00E+00 0.00E+00 Solid Waste #5 0.00E+00 0.00E+00
Water Emissions Dissolved Solids 1.15E-05 1.15E-05 Suspended Solids 3.19E-06 3.19E-06 BOD* 1.19E-08 6.43E-04 COD 1.63E-07 1.63E-07 Oil 2.02E-07 2.02E-07 Sulfuric Acid 4.34E-08 4.34E-08 Iron 2.66E-07 2.66E-07 Ammonia 3.08E-09 3.08E-09 Copper 0.00E+00 0.00E+00 Cadmium 5.18E-10 5.18E-10 Arsenic 0.00E+00 0.00E+00 Mercury 4.06E-14 4.06E-14 Phosphate 2.17E-08 2.17E-08 Selenium 0.00E+00 0.00E+00 Chromium 5.18E-10 5.18E-10 Lead 1.26E-13 1.26E-13 Zinc 1.79E-10 1.79E-10 * Only these parameters change in overall emissions due to BOD removal with respect to emissions from electricity
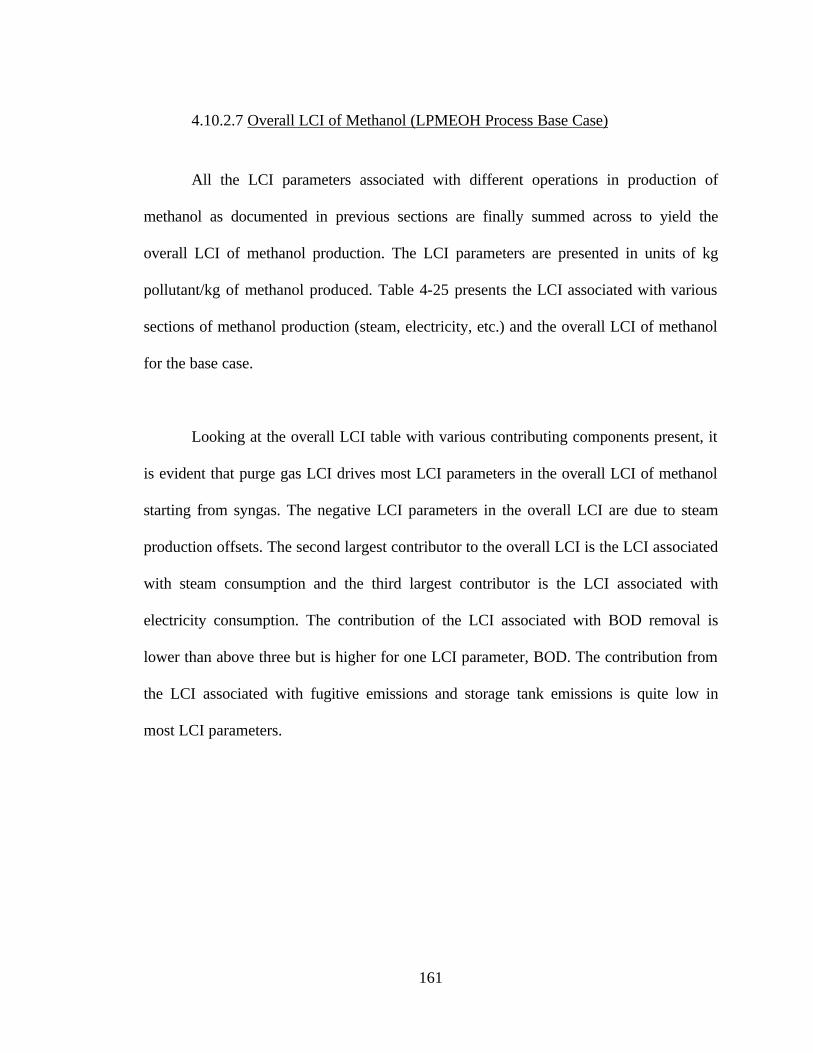
161
4.10.2.7 Overall LCI of Methanol (LPMEOH Process Base Case)
All the LCI parameters associated with different operations in production of
methanol as documented in previous sections are finally summed across to yield the
overall LCI of methanol production. The LCI parameters are presented in units of kg
pollutant/kg of methanol produced. Table 4-25 presents the LCI associated with various
sections of methanol production (steam, electricity, etc.) and the overall LCI of methanol
for the base case.
Looking at the overall LCI table with various contributing components present, it
is evident that purge gas LCI drives most LCI parameters in the overall LCI of methanol
starting from syngas. The negative LCI parameters in the overall LCI are due to steam
production offsets. The second largest contributor to the overall LCI is the LCI associated
with steam consumption and the third largest contributor is the LCI associated with
electricity consumption. The contribution of the LCI associated with BOD removal is
lower than above three but is higher for one LCI parameter, BOD. The contribution from
the LCI associated with fugitive emissions and storage tank emissions is quite low in
most LCI parameters.
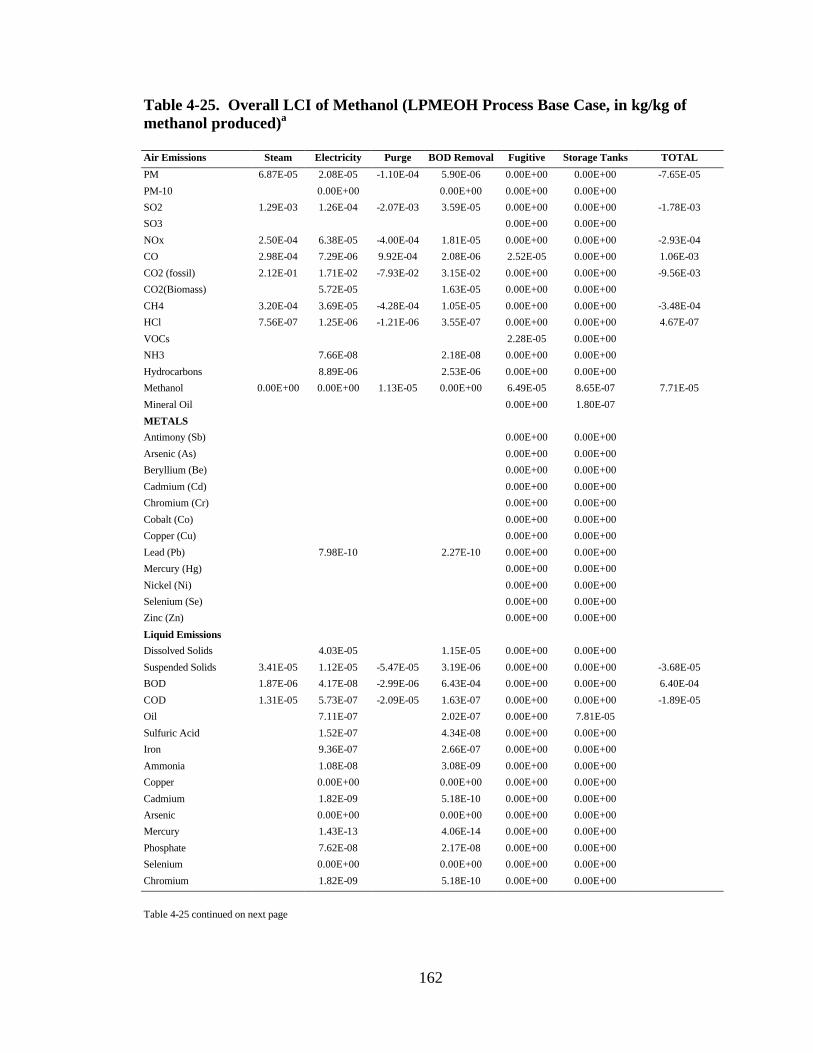
162
Table 4-25. Overall LCI of Methanol (LPMEOH Process Base Case, in kg/kg of methanol produced)a Air Emissions Steam Electricity Purge BOD Removal Fugitive Storage Tanks TOTAL
PM 6.87E-05 2.08E-05 -1.10E-04 5.90E-06 0.00E+00 0.00E+00 -7.65E-05
PM-10 0.00E+00 0.00E+00 0.00E+00 0.00E+00
SO2 1.29E-03 1.26E-04 -2.07E-03 3.59E-05 0.00E+00 0.00E+00 -1.78E-03
SO3 0.00E+00 0.00E+00
NOx 2.50E-04 6.38E-05 -4.00E-04 1.81E-05 0.00E+00 0.00E+00 -2.93E-04
CO 2.98E-04 7.29E-06 9.92E-04 2.08E-06 2.52E-05 0.00E+00 1.06E-03
CO2 (fossil) 2.12E-01 1.71E-02 -7.93E-02 3.15E-02 0.00E+00 0.00E+00 -9.56E-03
CO2(Biomass) 5.72E-05 1.63E-05 0.00E+00 0.00E+00
CH4 3.20E-04 3.69E-05 -4.28E-04 1.05E-05 0.00E+00 0.00E+00 -3.48E-04
HCl 7.56E-07 1.25E-06 -1.21E-06 3.55E-07 0.00E+00 0.00E+00 4.67E-07
VOCs 2.28E-05 0.00E+00
NH3 7.66E-08 2.18E-08 0.00E+00 0.00E+00
Hydrocarbons 8.89E-06 2.53E-06 0.00E+00 0.00E+00
Methanol 0.00E+00 0.00E+00 1.13E-05 0.00E+00 6.49E-05 8.65E-07 7.71E-05
Mineral Oil 0.00E+00 1.80E-07
METALS
Antimony (Sb) 0.00E+00 0.00E+00
Arsenic (As) 0.00E+00 0.00E+00
Beryllium (Be) 0.00E+00 0.00E+00
Cadmium (Cd) 0.00E+00 0.00E+00
Chromium (Cr) 0.00E+00 0.00E+00
Cobalt (Co) 0.00E+00 0.00E+00
Copper (Cu) 0.00E+00 0.00E+00
Lead (Pb) 7.98E-10 2.27E-10 0.00E+00 0.00E+00
Mercury (Hg) 0.00E+00 0.00E+00
Nickel (Ni) 0.00E+00 0.00E+00
Selenium (Se) 0.00E+00 0.00E+00
Zinc (Zn) 0.00E+00 0.00E+00
Liquid Emissions
Dissolved Solids 4.03E-05 1.15E-05 0.00E+00 0.00E+00
Suspended Solids 3.41E-05 1.12E-05 -5.47E-05 3.19E-06 0.00E+00 0.00E+00 -3.68E-05
BOD 1.87E-06 4.17E-08 -2.99E-06 6.43E-04 0.00E+00 0.00E+00 6.40E-04
COD 1.31E-05 5.73E-07 -2.09E-05 1.63E-07 0.00E+00 0.00E+00 -1.89E-05
Oil 7.11E-07 2.02E-07 0.00E+00 7.81E-05
Sulfuric Acid 1.52E-07 4.34E-08 0.00E+00 0.00E+00
Iron 9.36E-07 2.66E-07 0.00E+00 0.00E+00
Ammonia 1.08E-08 3.08E-09 0.00E+00 0.00E+00
Copper 0.00E+00 0.00E+00 0.00E+00 0.00E+00
Cadmium 1.82E-09 5.18E-10 0.00E+00 0.00E+00
Arsenic 0.00E+00 0.00E+00 0.00E+00 0.00E+00
Mercury 1.43E-13 4.06E-14 0.00E+00 0.00E+00
Phosphate 7.62E-08 2.17E-08 0.00E+00 0.00E+00
Selenium 0.00E+00 0.00E+00 0.00E+00 0.00E+00
Chromium 1.82E-09 5.18E-10 0.00E+00 0.00E+00
Table 4-25 continued on next page
163
Table 4-25 continued
Liquid Emissions Steam Electricity Purge BOD Removal Fugitive Storage Tanks TOTAL
Lead 4.42E-13 1.26E-13 0.00E+00 0.00E+00
Zinc 6.30E-10 1.79E-10 0.00E+00 0.00E+00
Solid Waste 1.86E-02 3.12E-03 -2.98E-02 4.59E-03 0.00E+00 0.00E+00 -2.02E-02 a Blank cells represent “no data” available.
164
4.11 Sensitivity Analysis of LPMEOH Process Model in ASPEN PLUS
This section documents the sensitivity analysis results of the LPMEOH process
model implemented in ASPEN PLUS. The main objective of doing a sensitivity analysis
is to evaluate the effect of change in one or more mode inputs on the values of selected
model outputs. One form of sensitivity, which is used here, is to vary only one model
input at a time over a nominal range while all other model inputs are held constant. The
purpose of the sensitivity analysis of the LPMEOH process model is to evaluate the
model performance under varying conditions of reactor pressure, syngas space velocity,
and recycle ratio. These parameters are considered because the (H2 + CO) conversion,
which is a significant parameter in the LPMEOH process, depends on them. All other
process conditions such as temperatures and pressure drops in all of the process
equipment, are held at their constant values as in the base case. The base case
assumptions are presented in Table 4-13. The main model results that are considered are:
(1) methanol production; (2) steam production in the methanol reactor; (3) steam
consumption in methanol distillation; (4) net steam consumption in the process; (5)
electricity consumption in the recycle gas compressor; and (6) purge gas production.
These results are tracked because they affect the LCI of methanol starting from syngas.
These are also key indicators of overall process performance. Furthermore, these outputs
are important when considering integration issues with an IGCC power plant.
The sensitivity analysis is focused on three sets of cases based upon three different
syngases. These syngases are: (1) syngas obtained from Texaco gasifier at Kingsport; (2)
165
syngas gas obtained from a British Gas/Lurgi (BGL) gasifier firing coal; and (3) syngas
obtained from a BGL gasifier firing a mixture of coal and MSW. For each of the three
syngases, the following sensitivity cases are considered:
(1) Varying the reactor pressure (P), keeping space velocity (SV) and recycle ratio
(R) constant. The cases considered for pressure are 500, 750, 1000, 1250 psig
while SV is held constant at 8827 standard liters/kg-hr and R is held constant at
3.22 moles recycle gas/moles fresh syngas feed.
(2) Varying SV, keeping P and R constant. The cases considered for SV are 2000,
4000, and 8000 standard liters/kg-hr while P is held constant at 707 psig and R is
held constant at 3.22 moles recycle gas/moles fresh feed.
(3) Varying R, keeping P and SV constant. The cases considered for the recycle ratio
are 0 (no recycle), 1, 2, and 3 moles recycle gas/moles fresh feed, while P is held
constant at 707 psig and SV is held constant at 8827 standard liters/kg-hr.
The reactor pressure is held constant at 707 psig, space velocity is held constant at
8827 standard liters/kg-hr, and the recycle ratio is held constant at 3.22 moles recycle
gas/moles fresh syngas feed because these values are the base case values.
4.11.1 Syngases Considered in the Sensitivity Analysis
This section presents the description of syngases considered in the sensitivity
analysis of LPMEOH process model. Three syngas compositions are described: (1)

166
Syngas obtained from Texaco gasifier at Kingsport; (2) syngas obtained from a coal fired
BGL gasifier; and (3) syngas obtained from a BGL gasifier firing mixture of coal and
MSW. The composition of the three syngases considered is presented in Table 4-26.
Table 4-26. Temperature and Composition of Texaco Gasifier Syngas (Air Products and Chemicals, Inc., 1997) Syngas Type Texaco Syngas Coal Fired BGL
Syngas Coal and MSW co-fired
BGL Syngas Component Mole Percent Mole Percent Mole Percent
H2 67.14 29.90 38.20 CO 29.89 58.60 48.80 N2 0.46 1.80 2.60 CH4 0.03 7.80 8.40 CO2 2.48 2.01 2.00 CH3OH 0.00 0.00 0.00 H2O 0.00 0.00 0.00
It is clear in the above table that the three syngases mainly differ in their H2 and
CO content. As discussed in section 4.5.4.1, the H2/CO ratio is one of the key parameters
affecting the performance of the LPMEOH process because syngas conversion in
methanol reactor depends on it. In Table 4-26, the Texaco syngas has highest H2/CO ratio
of 2.25 and coal fired BGL syngas has the lowest H2/CO ratio of 0.51. The syngas
obtained from co-firing coal and MSW in a BGL gasifier has lower H2/CO content than
Texaco syngas but higher than the coal fired BGL syngas. Based on the H2/CO ratio, it
can be said that the Texaco syngas will produce maximum amount of methanol for given
syngas flowrate and process conditions. The following section presents the sensitivity
analysis results of the LPMEOH process model using Texaco syngas as feed.
167
4.11.2 Sensitivity Analysis on Texaco Syngas used at LPMEOH Process Demonstration Facility at Kingsport
This section presents the sensitivity analysis results of individually changing
pressure, space velocity, and recycle ratio in LPMEOH process operating on Texaco
syngas the same as that being used at Kingsport, TN. The composition of syngas is
presented in Table 4-26. Flowrate of syngas considered is 1805.2 lbmol/hr as in base
case. This is held constant for all of the sensitivity cases considered. Saturated steam is
produced in the methanol reactor whose pressure is held constant at 387.7 psia as in base
case. Saturated steam at 100 psia is used in methanol distillation and its pressure is also
held constant in all the sensitivity cases.
Table 4-27 presents the results of the sensitivity analysis with P, SV and R as
sensitive inputs. It should be noted that in varying reactor pressure, the pressure drops
and temperatures across various process equipment are held constant as in Table 4-13.
The following section presents the interpretation of the results of the sensitivity analysis
on pressure. The sensitivity analysis of space velocity and recycle ratio are discussed in
Sections 4.11.2.2 and 4.11.2.3, respectively.
4.11.2.1 Effect of Change in Reactor Pressure
This section presents the interpretations of the results of sensitivity analysis on
pressure. In doing the sensitivity analysis on pressure, a FORTRAN block PRESSURE is
defined which specifies the pressure, at the beginning of the simulation, in various
process equipment based on the pressure drop across them. For example, if a reaction

168
pressure of 500 psig is specified for simulation, the FORTRAN block PRESSURE sets
the fresh syngas pressure to 516 psig based 6 psia pressure drop in guard bed and 10 psia
pressure drop in reactor sparger. It sets the operating pressure of methanol separator to
478 psig to account for the pressure drops from reactor until methanol separator. It also
sets the compressor outlet pressure as 516 psig to match the pressure of fresh syngas feed.
The following subsections present the interpretation of results obtained in Table 4-27.
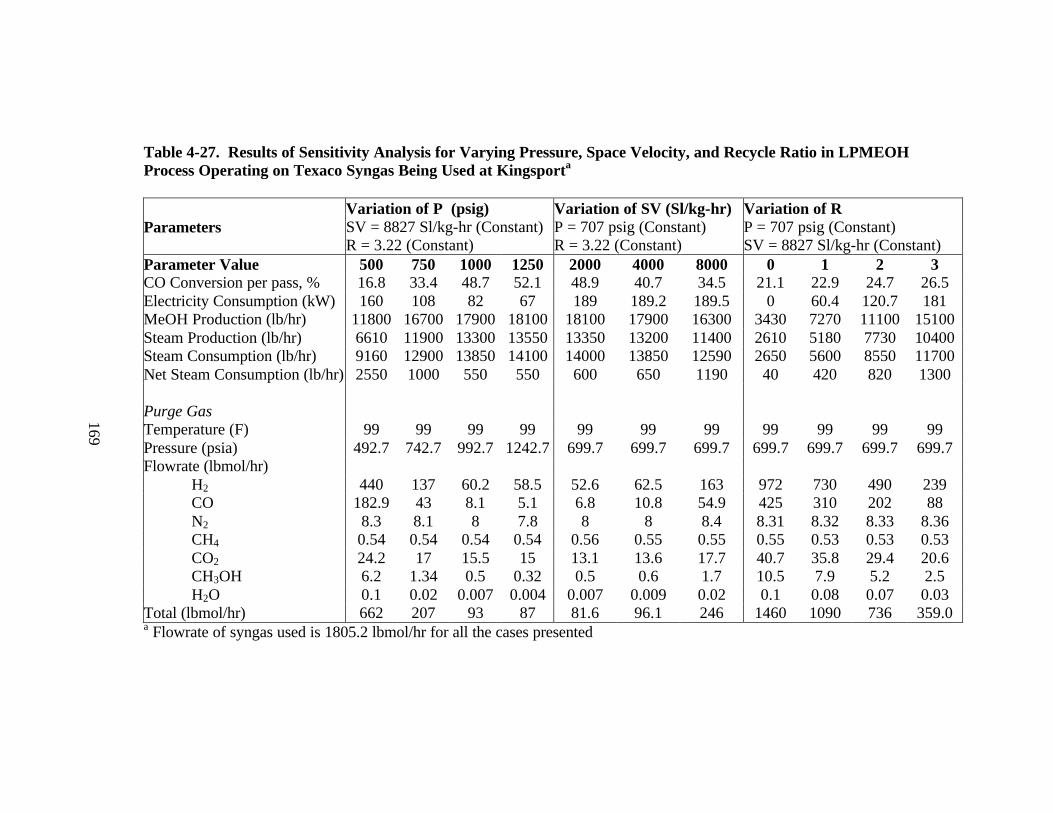
169
Table 4-27. Results of Sensitivity Analysis for Varying Pressure, Space Velocity, and Recycle Ratio in LPMEOH Process Operating on Texaco Syngas Being Used at Kingsporta
Parameters
Variation of P (psig) SV = 8827 Sl/kg-hr (Constant) R = 3.22 (Constant)
Variation of SV (Sl/kg-hr) P = 707 psig (Constant) R = 3.22 (Constant)
Variation of R P = 707 psig (Constant) SV = 8827 Sl/kg-hr (Constant)
Parameter Value 500 750 1000 1250 2000 4000 8000 0 1 2 3 CO Conversion per pass, % 16.8 33.4 48.7 52.1 48.9 40.7 34.5 21.1 22.9 24.7 26.5 Electricity Consumption (kW) 160 108 82 67 189 189.2 189.5 0 60.4 120.7 181 MeOH Production (lb/hr) 11800 16700 17900 18100 18100 17900 16300 3430 7270 11100 15100 Steam Production (lb/hr) 6610 11900 13300 13550 13350 13200 11400 2610 5180 7730 10400 Steam Consumption (lb/hr) 9160 12900 13850 14100 14000 13850 12590 2650 5600 8550 11700 Net Steam Consumption (lb/hr) 2550 1000 550 550 600 650 1190 40 420 820 1300 Purge Gas Temperature (F) 99 99 99 99 99 99 99 99 99 99 99 Pressure (psia) 492.7 742.7 992.7 1242.7 699.7 699.7 699.7 699.7 699.7 699.7 699.7 Flowrate (lbmol/hr)
H2 440 137 60.2 58.5 52.6 62.5 163 972 730 490 239 CO 182.9 43 8.1 5.1 6.8 10.8 54.9 425 310 202 88 N2 8.3 8.1 8 7.8 8 8 8.4 8.31 8.32 8.33 8.36 CH4 0.54 0.54 0.54 0.54 0.56 0.55 0.55 0.55 0.53 0.53 0.53 CO2 24.2 17 15.5 15 13.1 13.6 17.7 40.7 35.8 29.4 20.6 CH3OH 6.2 1.34 0.5 0.32 0.5 0.6 1.7 10.5 7.9 5.2 2.5 H2O 0.1 0.02 0.007 0.004 0.007 0.009 0.02 0.1 0.08 0.07 0.03
Total (lbmol/hr) 662 207 93 87 81.6 96.1 246 1460 1090 736 359.0 a Flowrate of syngas used is 1805.2 lbmol/hr for all the cases presented
169

170
4.11.2.1.1 Effect of Reactor Pressure on Electricity Consumption in the Recycle Gas Compressor
The purpose of the recycle gas compressor is to compress the recycle gases to
overcome the pressure drop across the process such that recycle gas is at the pressure at
which fresh syngas is available. The total pressure drop starting from fresh syngas
through the methanol separator is approximately 38 psia. This total pressure drop is
assumed to remain the same even if the pressure in the reactor changes. As an example,
for the reactor pressure of 1250 psig, fresh syngas needs to be supplied at 1266 psig to
account for pressure drops in guardbed and reactor sparger. The recycle gases entering
the compressor would be at a pressure of 1228 psig. The compressor has to compress the
recycle gas to 1266 psig, which results in a compression ratio of 1.03. Thus the
compressor has to do less work in compressing the recycle gases for the case in which
high pressure fresh syngas is used. Therefore, when the reactor pressure is increased from
500 to 1250 psig, the work done by the recycle gas compressor decreases. This trend is
clear in Table 4-27.
4.11.2.1.2 Effect of Reaction Pressure on Methanol Production
As the pressure in the reactor increases, the CO conversion in the reactor
increases, leading to more production of methanol (Equation 4-14). Although the
production of methanol increases with an increase in pressure, the increase in methanol
production is not in same proportion as the pressure increase because the CO conversion
does not increase in the same proportion as the pressure. As the pressure increases from
500 psig to 750 psig, an increment of 250 psi, methanol production increases by 4900
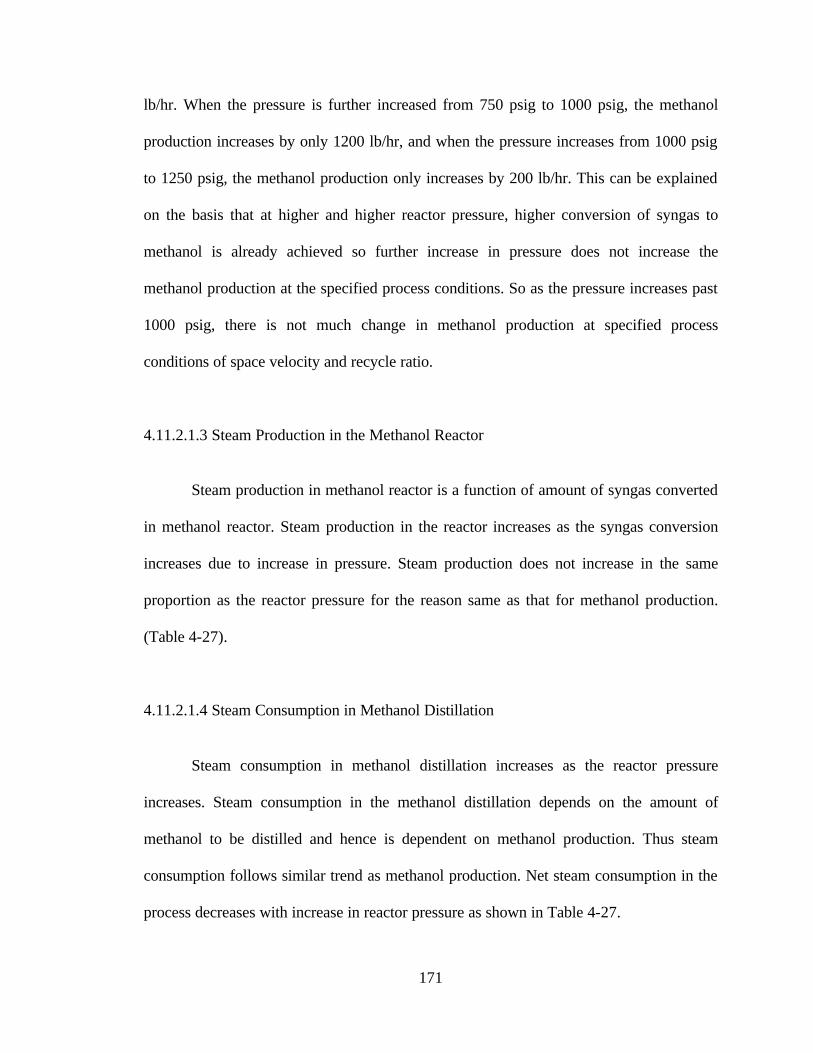
171
lb/hr. When the pressure is further increased from 750 psig to 1000 psig, the methanol
production increases by only 1200 lb/hr, and when the pressure increases from 1000 psig
to 1250 psig, the methanol production only increases by 200 lb/hr. This can be explained
on the basis that at higher and higher reactor pressure, higher conversion of syngas to
methanol is already achieved so further increase in pressure does not increase the
methanol production at the specified process conditions. So as the pressure increases past
1000 psig, there is not much change in methanol production at specified process
conditions of space velocity and recycle ratio.
4.11.2.1.3 Steam Production in the Methanol Reactor
Steam production in methanol reactor is a function of amount of syngas converted
in methanol reactor. Steam production in the reactor increases as the syngas conversion
increases due to increase in pressure. Steam production does not increase in the same
proportion as the reactor pressure for the reason same as that for methanol production.
(Table 4-27).
4.11.2.1.4 Steam Consumption in Methanol Distillation
Steam consumption in methanol distillation increases as the reactor pressure
increases. Steam consumption in the methanol distillation depends on the amount of
methanol to be distilled and hence is dependent on methanol production. Thus steam
consumption follows similar trend as methanol production. Net steam consumption in the
process decreases with increase in reactor pressure as shown in Table 4-27.
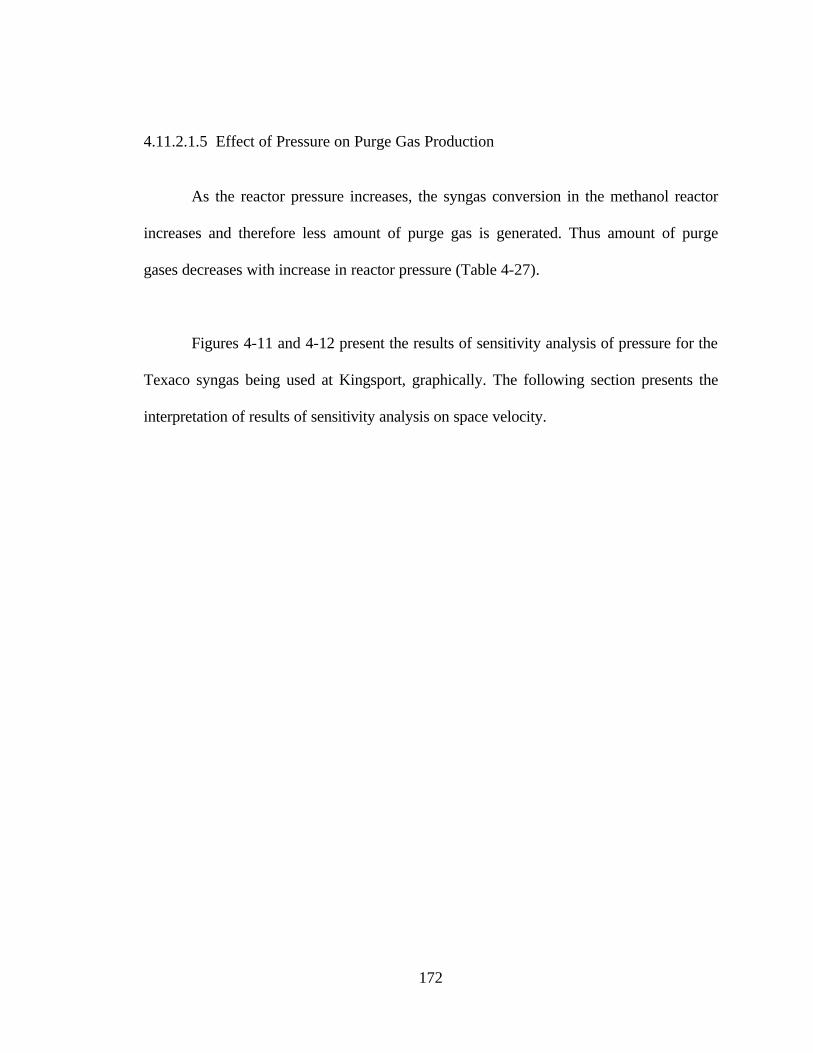
172
4.11.2.1.5 Effect of Pressure on Purge Gas Production
As the reactor pressure increases, the syngas conversion in the methanol reactor
increases and therefore less amount of purge gas is generated. Thus amount of purge
gases decreases with increase in reactor pressure (Table 4-27).
Figures 4-11 and 4-12 present the results of sensitivity analysis of pressure for the
Texaco syngas being used at Kingsport, graphically. The following section presents the
interpretation of results of sensitivity analysis on space velocity.
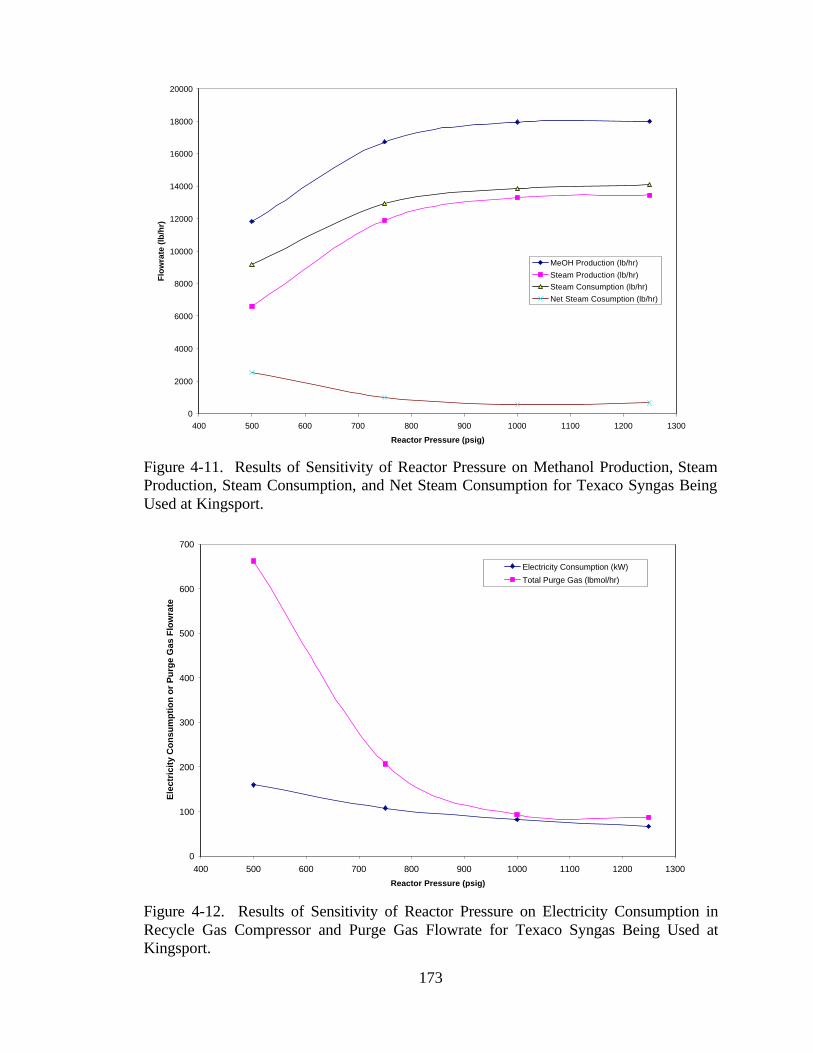
173
Figure 4-11. Results of Sensitivity of Reactor Pressure on Methanol Production, Steam Production, Steam Consumption, and Net Steam Consumption for Texaco Syngas Being Used at Kingsport.
Figure 4-12. Results of Sensitivity of Reactor Pressure on Electricity Consumption in Recycle Gas Compressor and Purge Gas Flowrate for Texaco Syngas Being Used at Kingsport.
0
2000
4000
6000
8000
10000
12000
14000
16000
18000
20000
400 500 600 700 800 900 1000 1100 1200 1300
Reactor Pressure (psig)
Flo
wra
te (
lb/h
r)
MeOH Production (lb/hr)
Steam Production (lb/hr)
Steam Consumption (lb/hr)
Net Steam Cosumption (lb/hr)
0
100
200
300
400
500
600
700
400 500 600 700 800 900 1000 1100 1200 1300
Reactor Pressure (psig)
Ele
ctri
city
Co
nsu
mp
tio
n o
r P
urg
e G
as F
low
rate
Electricity Consumption (kW)
Total Purge Gas (lbmol/hr)
174
4.11.2.2 Effect of Change in Syngas Space Velocity in Methanol Reactor
This section presents the interpretation of the results of sensitivity analysis on
space velocity for the Texaco syngas being used at Kingsport.
4.11.2.2.1 Effect of Reactor Space Velocity on Electricity Consumption in the Recycle Gas Compressor
The electric power consumed in the recycle gas compressor does not change as
the syngas space velocity inside the reactor changes. The compressor power depends on
the process pressure drop that the compressor has to overcome based on the fresh syngas
supply pressure and the recycle gas flowrate and since neither of these changes, the
power consumed in the compressor remains approximately constant (Table 4-27).
4.11.2.2.2 Effect of Syngas Space Velocity on Methanol Production
As the space velocity in the reactor increases, the CO conversion in the methanol
reactor decreases as shown in Table 4-27, thus less methanol is produced. As space
velocity of syngas in the reactor increases, there is less residence time for contact with the
catalyst so the syngas conversion decreases.
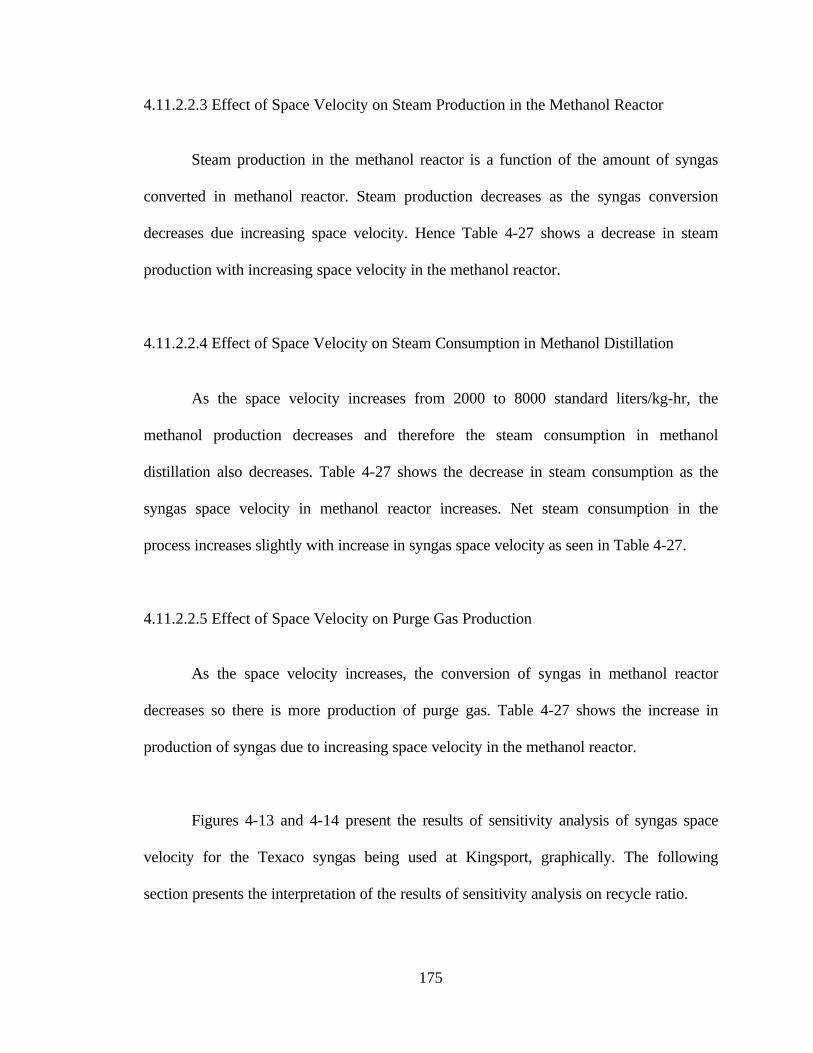
175
4.11.2.2.3 Effect of Space Velocity on Steam Production in the Methanol Reactor
Steam production in the methanol reactor is a function of the amount of syngas
converted in methanol reactor. Steam production decreases as the syngas conversion
decreases due increasing space velocity. Hence Table 4-27 shows a decrease in steam
production with increasing space velocity in the methanol reactor.
4.11.2.2.4 Effect of Space Velocity on Steam Consumption in Methanol Distillation
As the space velocity increases from 2000 to 8000 standard liters/kg-hr, the
methanol production decreases and therefore the steam consumption in methanol
distillation also decreases. Table 4-27 shows the decrease in steam consumption as the
syngas space velocity in methanol reactor increases. Net steam consumption in the
process increases slightly with increase in syngas space velocity as seen in Table 4-27.
4.11.2.2.5 Effect of Space Velocity on Purge Gas Production
As the space velocity increases, the conversion of syngas in methanol reactor
decreases so there is more production of purge gas. Table 4-27 shows the increase in
production of syngas due to increasing space velocity in the methanol reactor.
Figures 4-13 and 4-14 present the results of sensitivity analysis of syngas space
velocity for the Texaco syngas being used at Kingsport, graphically. The following
section presents the interpretation of the results of sensitivity analysis on recycle ratio.
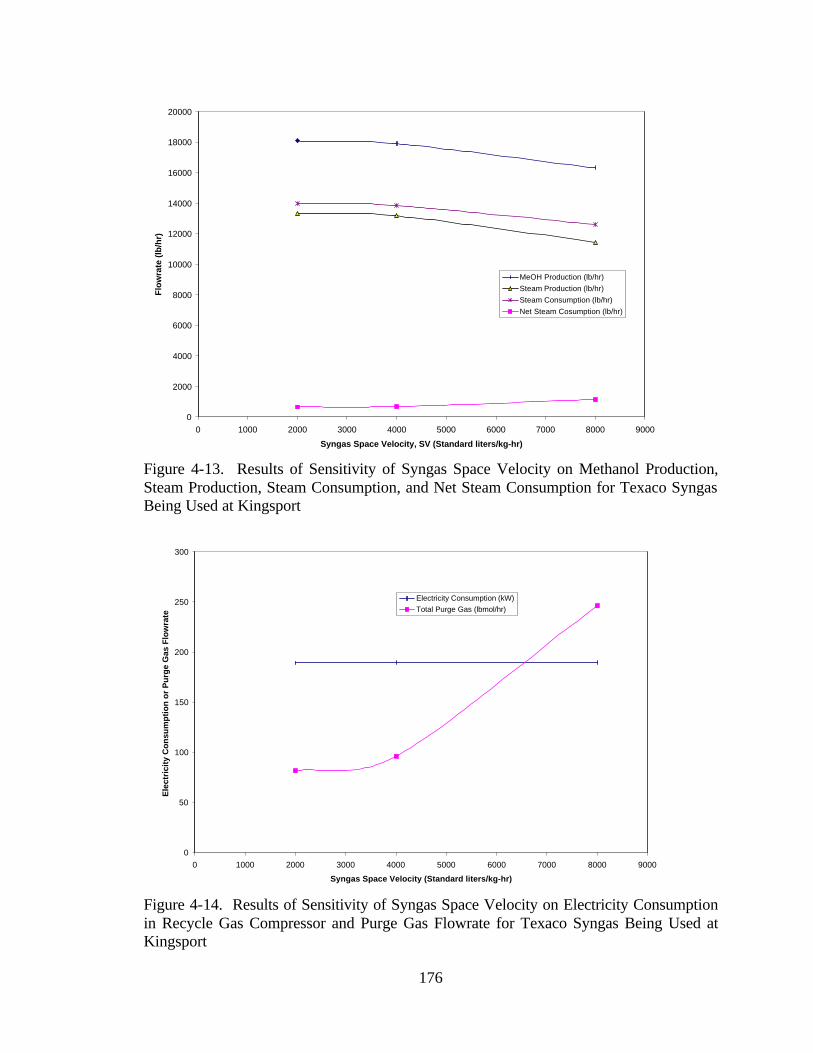
176
Figure 4-13. Results of Sensitivity of Syngas Space Velocity on Methanol Production, Steam Production, Steam Consumption, and Net Steam Consumption for Texaco Syngas Being Used at Kingsport
Figure 4-14. Results of Sensitivity of Syngas Space Velocity on Electricity Consumption in Recycle Gas Compressor and Purge Gas Flowrate for Texaco Syngas Being Used at Kingsport
0
2000
4000
6000
8000
10000
12000
14000
16000
18000
20000
0 1000 2000 3000 4000 5000 6000 7000 8000 9000
Syngas Space Velocity, SV (Standard liters/kg-hr)
Flo
wra
te (
lb/h
r)
MeOH Production (lb/hr)
Steam Production (lb/hr)
Steam Consumption (lb/hr)
Net Steam Cosumption (lb/hr)
0
50
100
150
200
250
300
0 1000 2000 3000 4000 5000 6000 7000 8000 9000
Syngas Space Velocity (Standard liters/kg-hr)
Ele
ctri
city
Co
nsu
mp
tio
n o
r P
urg
e G
as F
low
rate
Electricity Consumption (kW)
Total Purge Gas (lbmol/hr)

177
4.11.2.3 Effect of Change in Recycle Ratio
This section presents the interpretation of the results of the sensitivity analysis of
the recycle ratio. Table 4-27 presents the results of the sensitivity analysis with recycle
ratio as a variable.
4.11.2.3.1 Effect of Recycle Ratio on Electricity Consumption in Recycle Gas Compressor
As the flowrate of the recycle gases through the recycle gas compressor increases,
the electric power consumed in the compressor also increases because the compressor has
to do more work to compress the higher mass of recycle gas. For the case of no recycle,
the power consumed in compressor is zero and as the recycle ratio increases from 1 to 3
the compressor power increases linearly because of the linear increase in flowrate of
recycle gas with increase in recycle ratio.
4.11.2.3.2 Effect of Recycle Ratio on Methanol Production
Methanol production increases as the recycle ratio is increased. For the fresh
syngas richer in H2, the H2/CO ratio in the combined feed (fresh syngas and recycle gas)
would increase with the recycle ratio since the recycle gas would have higher H2/CO ratio
than fresh feed. Due to increase in H2/CO ratio in combined feed, the conversion of
syngas in methanol reactor increases. More amount of syngas flows through the methanol
reactor because of higher recycle ratio due to which methanol production increases. Table
4-27 shows increasing methanol production with increasing recycle ratio.

178
4.11.2.3.3 Effect of Recycle Ratio on Steam Production in Methanol Reactor
Steam production in the methanol reactor is a function of amount of syngas
converted in methanol reactor. Steam production increases as the syngas conversion
increases due to increasing recycle ratio. Hence Table 4-27 shows an increase in steam
production with increasing recycle ratio.
4.11.2.3.4 Effect of Recycle Ratio on Steam Consumption in Methanol Distillation
As the recycle ratio increases from 0 to 3, the methanol production increases and
therefore the steam consumption in methanol distillation also increases. Table 4-27 shows
the increase in steam consumption as the recycle ratio increases. Net steam consumption
in the process increases with recycle ratio as seen in Table 4-27.
4.11.2.3.5 Effect of Recycle Ratio on Purge Gas Production
As the recycle ratio increases, the conversion of syngas in methanol reactor
increases so there is less production of purge gas. Table 4-27 shows the decrease in
production of syngas due to increasing recycle ratio.
Figures 4-15 and 4-16 present the results of sensitivity analysis of recycle ratio for
the Texaco syngas being used at Kingsport, graphically. The following section presents
the sensitivity analysis of P, SV, and R for the syngas obtained from coal fired BGL
gasifier.

179
Figure 4-15. Results of Sensitivity of Recycle Ratio on Methanol Production, Steam Production, Steam Consumption, and Net Steam Consumption for Texaco Syngas Being Used at Kingsport
Figure 4-16. Results of Sensitivity of Recycle Ratio on Electricity Consumption in Recycle Gas Compressor and Purge Gas Flowrate for Texaco Syngas Being Used at Kingsport
0
2000
4000
6000
8000
10000
12000
14000
16000
0 0.5 1 1.5 2 2.5 3 3.5
Recycle Ratio (moles recycle gas/moles fresh syngas feed)
Flo
wra
te,lb
/hr
MeOH Production (lb/hr)
Steam Production (lb/hr)Steam Consumption (lb/hr)
Net Steam Cosumption (lb/hr)
0
200
400
600
800
1000
1200
1400
1600
0 0.5 1 1.5 2 2.5 3 3.5
Recycle Ratio (moles recycle gas/moles fresh syngas feed)
Ele
ctri
city
Co
nsu
mp
tio
n o
r P
urg
e G
as F
low
rate
Electricity Consumption (kW)
Total Purge Gas (lbmol/hr)
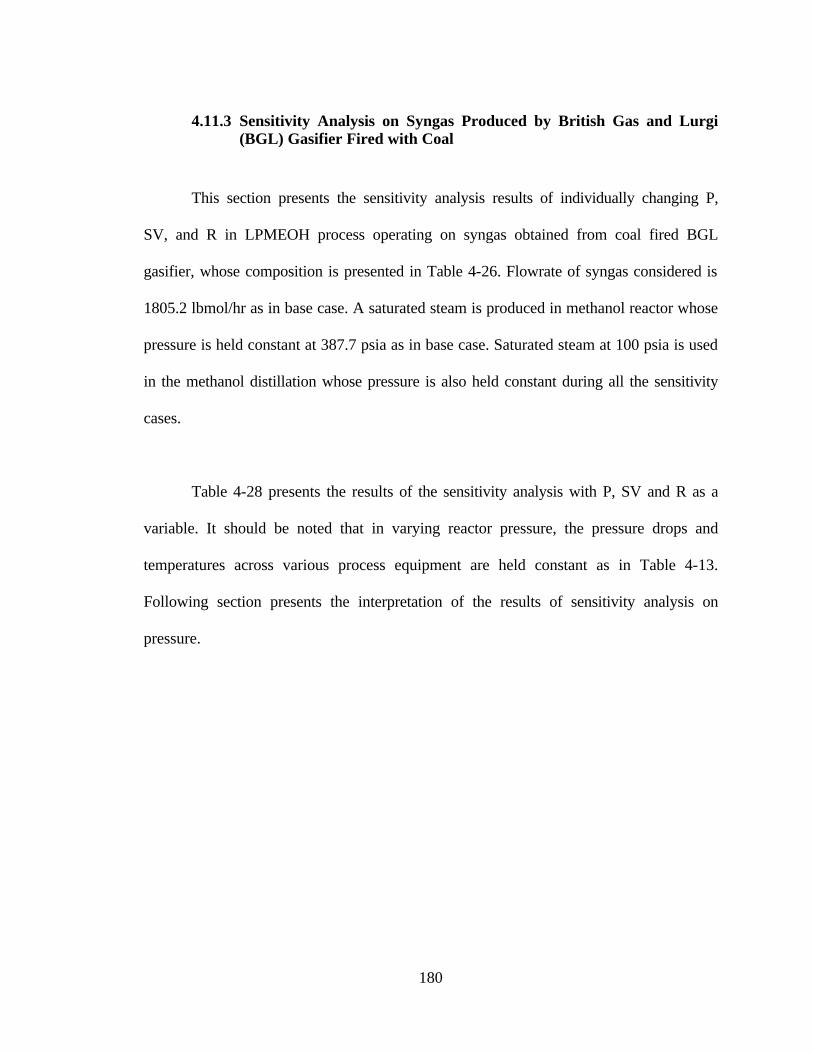
180
4.11.3 Sensitivity Analysis on Syngas Produced by British Gas and Lurgi (BGL) Gasifier Fired with Coal
This section presents the sensitivity analysis results of individually changing P,
SV, and R in LPMEOH process operating on syngas obtained from coal fired BGL
gasifier, whose composition is presented in Table 4-26. Flowrate of syngas considered is
1805.2 lbmol/hr as in base case. A saturated steam is produced in methanol reactor whose
pressure is held constant at 387.7 psia as in base case. Saturated steam at 100 psia is used
in the methanol distillation whose pressure is also held constant during all the sensitivity
cases.
Table 4-28 presents the results of the sensitivity analysis with P, SV and R as a
variable. It should be noted that in varying reactor pressure, the pressure drops and
temperatures across various process equipment are held constant as in Table 4-13.
Following section presents the interpretation of the results of sensitivity analysis on
pressure.
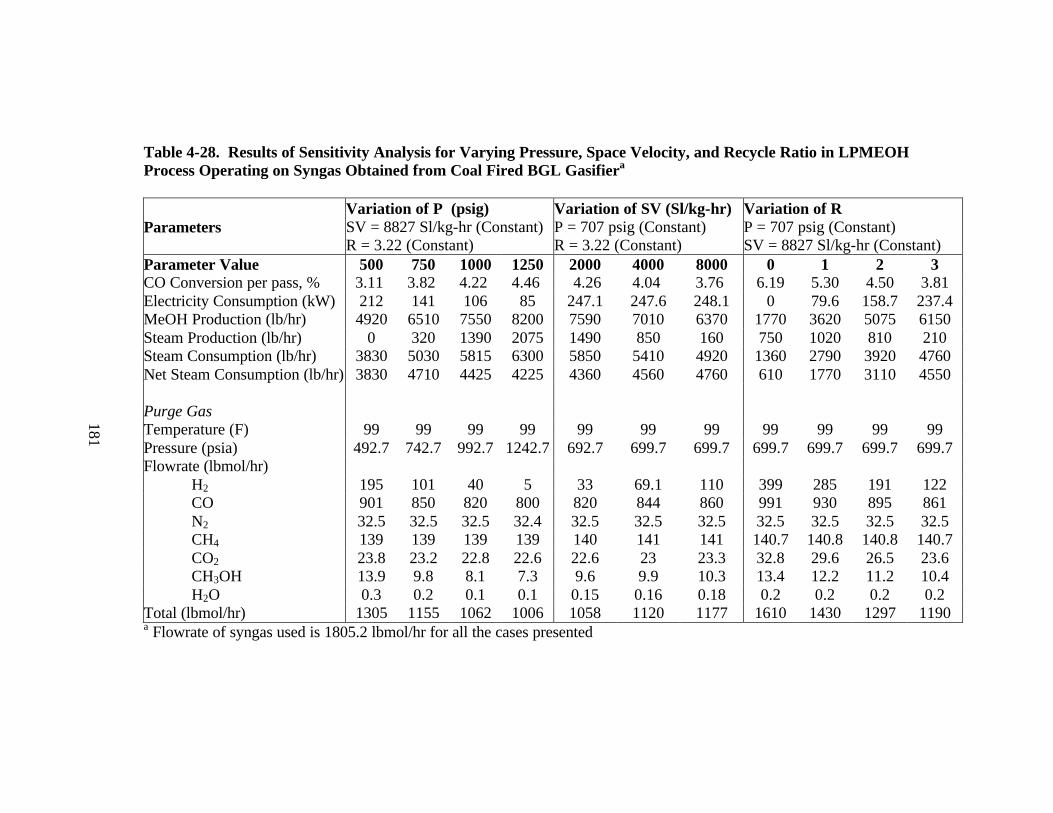
181
Table 4-28. Results of Sensitivity Analysis for Varying Pressure, Space Velocity, and Recycle Ratio in LPMEOH Process Operating on Syngas Obtained from Coal Fired BGL Gasifiera
Parameters
Variation of P (psig) SV = 8827 Sl/kg-hr (Constant) R = 3.22 (Constant)
Variation of SV (Sl/kg-hr) P = 707 psig (Constant) R = 3.22 (Constant)
Variation of R P = 707 psig (Constant) SV = 8827 Sl/kg-hr (Constant)
Parameter Value 500 750 1000 1250 2000 4000 8000 0 1 2 3 CO Conversion per pass, % 3.11 3.82 4.22 4.46 4.26 4.04 3.76 6.19 5.30 4.50 3.81 Electricity Consumption (kW) 212 141 106 85 247.1 247.6 248.1 0 79.6 158.7 237.4 MeOH Production (lb/hr) 4920 6510 7550 8200 7590 7010 6370 1770 3620 5075 6150 Steam Production (lb/hr) 0 320 1390 2075 1490 850 160 750 1020 810 210 Steam Consumption (lb/hr) 3830 5030 5815 6300 5850 5410 4920 1360 2790 3920 4760 Net Steam Consumption (lb/hr) 3830 4710 4425 4225 4360 4560 4760 610 1770 3110 4550 Purge Gas Temperature (F) 99 99 99 99 99 99 99 99 99 99 99 Pressure (psia) 492.7 742.7 992.7 1242.7 692.7 699.7 699.7 699.7 699.7 699.7 699.7 Flowrate (lbmol/hr)
H2 195 101 40 5 33 69.1 110 399 285 191 122 CO 901 850 820 800 820 844 860 991 930 895 861 N2 32.5 32.5 32.5 32.4 32.5 32.5 32.5 32.5 32.5 32.5 32.5 CH4 139 139 139 139 140 141 141 140.7 140.8 140.8 140.7 CO2 23.8 23.2 22.8 22.6 22.6 23 23.3 32.8 29.6 26.5 23.6 CH3OH 13.9 9.8 8.1 7.3 9.6 9.9 10.3 13.4 12.2 11.2 10.4 H2O 0.3 0.2 0.1 0.1 0.15 0.16 0.18 0.2 0.2 0.2 0.2
Total (lbmol/hr) 1305 1155 1062 1006 1058 1120 1177 1610 1430 1297 1190 a Flowrate of syngas used is 1805.2 lbmol/hr for all the cases presented
181
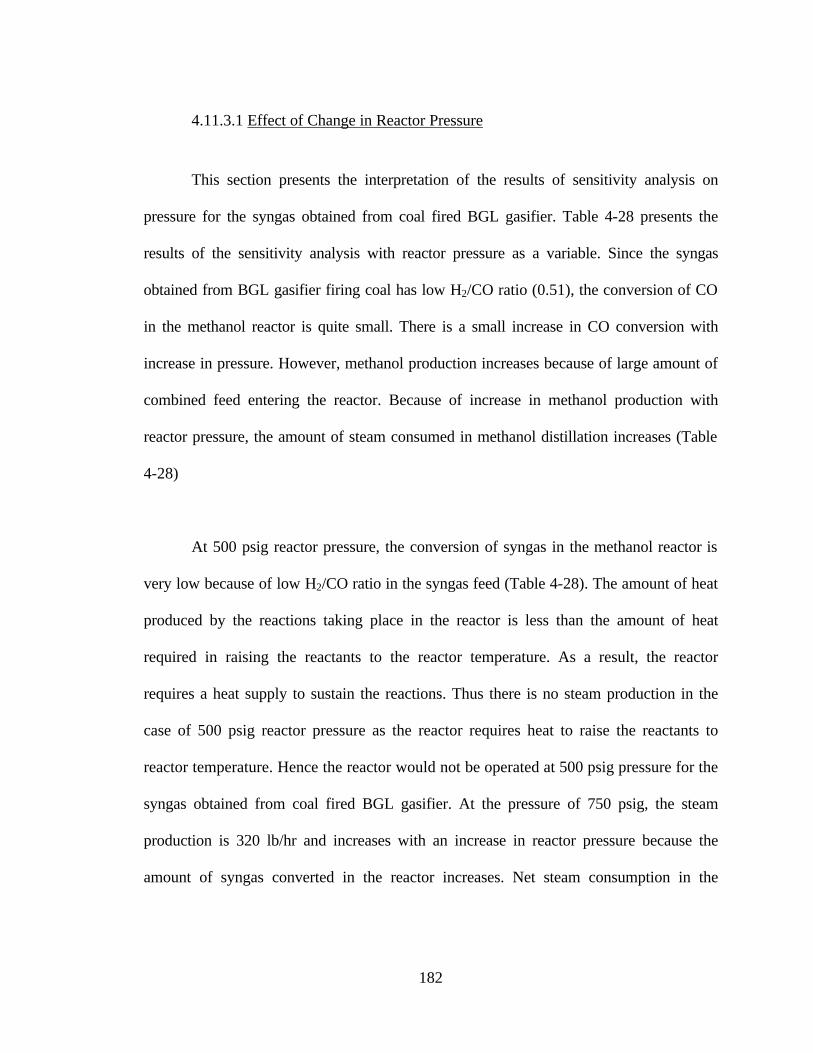
182
4.11.3.1 Effect of Change in Reactor Pressure
This section presents the interpretation of the results of sensitivity analysis on
pressure for the syngas obtained from coal fired BGL gasifier. Table 4-28 presents the
results of the sensitivity analysis with reactor pressure as a variable. Since the syngas
obtained from BGL gasifier firing coal has low H2/CO ratio (0.51), the conversion of CO
in the methanol reactor is quite small. There is a small increase in CO conversion with
increase in pressure. However, methanol production increases because of large amount of
combined feed entering the reactor. Because of increase in methanol production with
reactor pressure, the amount of steam consumed in methanol distillation increases (Table
4-28)
At 500 psig reactor pressure, the conversion of syngas in the methanol reactor is
very low because of low H2/CO ratio in the syngas feed (Table 4-28). The amount of heat
produced by the reactions taking place in the reactor is less than the amount of heat
required in raising the reactants to the reactor temperature. As a result, the reactor
requires a heat supply to sustain the reactions. Thus there is no steam production in the
case of 500 psig reactor pressure as the reactor requires heat to raise the reactants to
reactor temperature. Hence the reactor would not be operated at 500 psig pressure for the
syngas obtained from coal fired BGL gasifier. At the pressure of 750 psig, the steam
production is 320 lb/hr and increases with an increase in reactor pressure because the
amount of syngas converted in the reactor increases. Net steam consumption in the
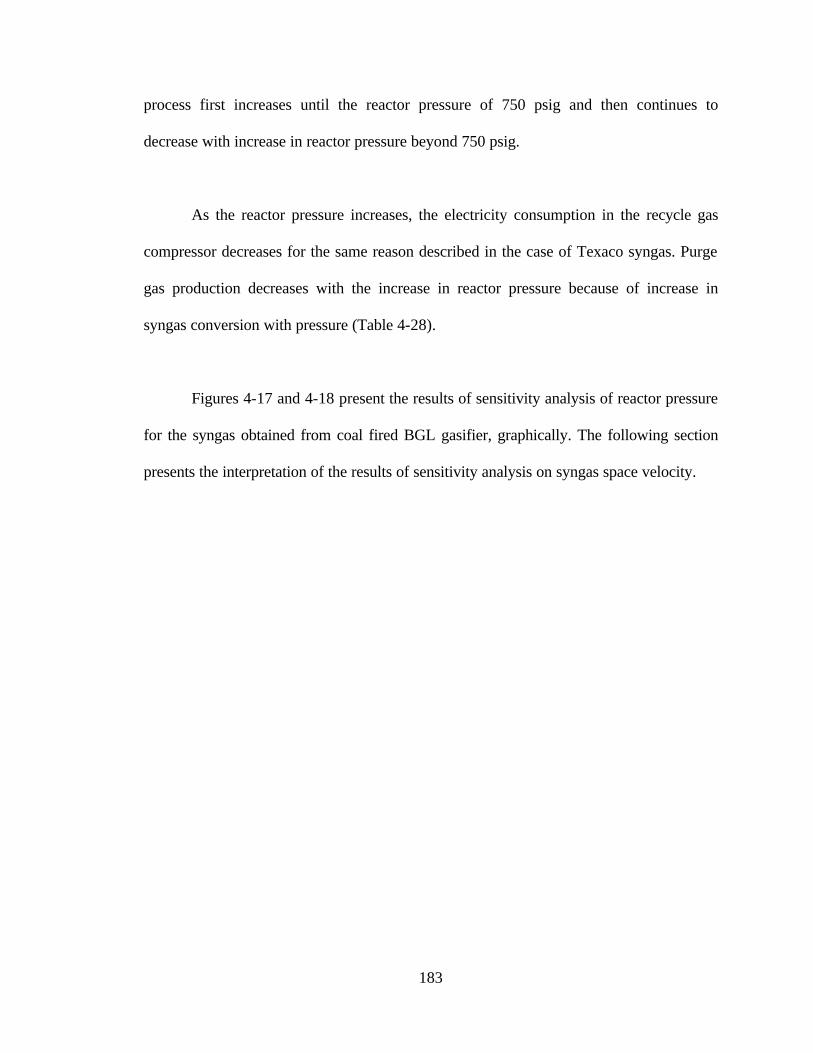
183
process first increases until the reactor pressure of 750 psig and then continues to
decrease with increase in reactor pressure beyond 750 psig.
As the reactor pressure increases, the electricity consumption in the recycle gas
compressor decreases for the same reason described in the case of Texaco syngas. Purge
gas production decreases with the increase in reactor pressure because of increase in
syngas conversion with pressure (Table 4-28).
Figures 4-17 and 4-18 present the results of sensitivity analysis of reactor pressure
for the syngas obtained from coal fired BGL gasifier, graphically. The following section
presents the interpretation of the results of sensitivity analysis on syngas space velocity.
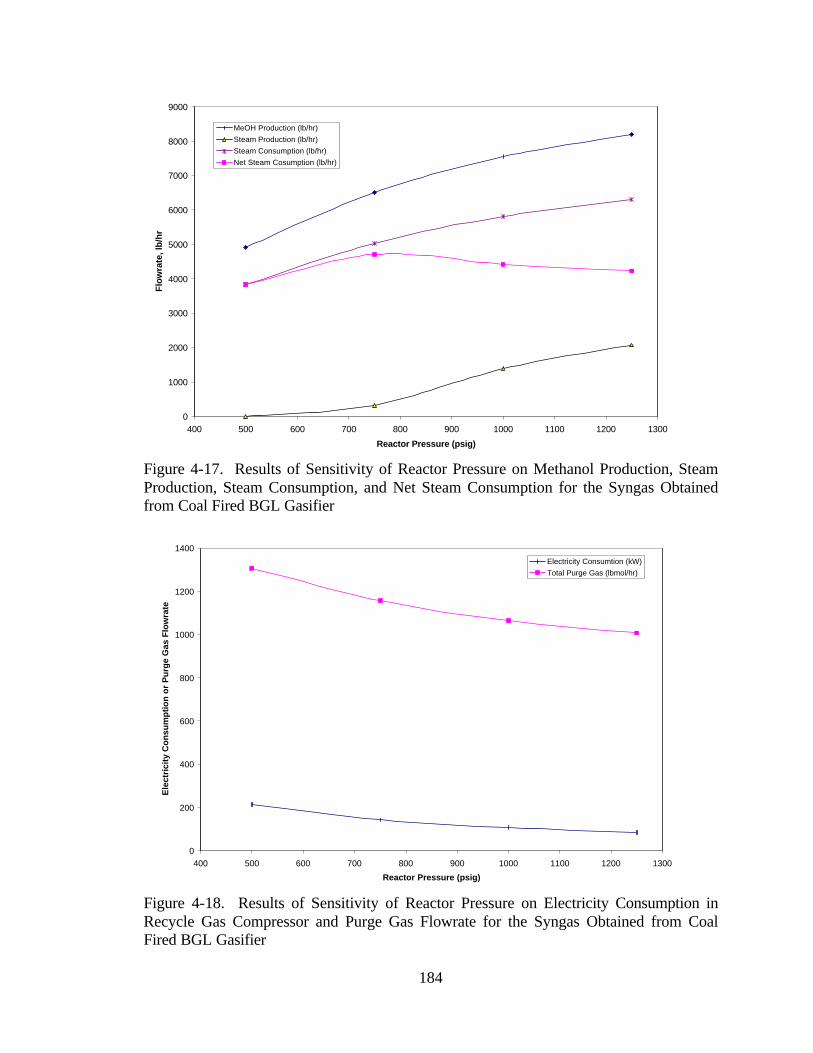
184
Figure 4-17. Results of Sensitivity of Reactor Pressure on Methanol Production, Steam Production, Steam Consumption, and Net Steam Consumption for the Syngas Obtained from Coal Fired BGL Gasifier
Figure 4-18. Results of Sensitivity of Reactor Pressure on Electricity Consumption in Recycle Gas Compressor and Purge Gas Flowrate for the Syngas Obtained from Coal Fired BGL Gasifier
0
1000
2000
3000
4000
5000
6000
7000
8000
9000
400 500 600 700 800 900 1000 1100 1200 1300
Reactor Pressure (psig)
Flo
wra
te, l
b/h
r
MeOH Production (lb/hr)
Steam Production (lb/hr)
Steam Consumption (lb/hr)
Net Steam Cosumption (lb/hr)
0
200
400
600
800
1000
1200
1400
400 500 600 700 800 900 1000 1100 1200 1300
Reactor Pressure (psig)
Ele
ctri
city
Co
nsu
mp
tio
n o
r P
urg
e G
as F
low
rate
Electricity Consumtion (kW)
Total Purge Gas (lbmol/hr)
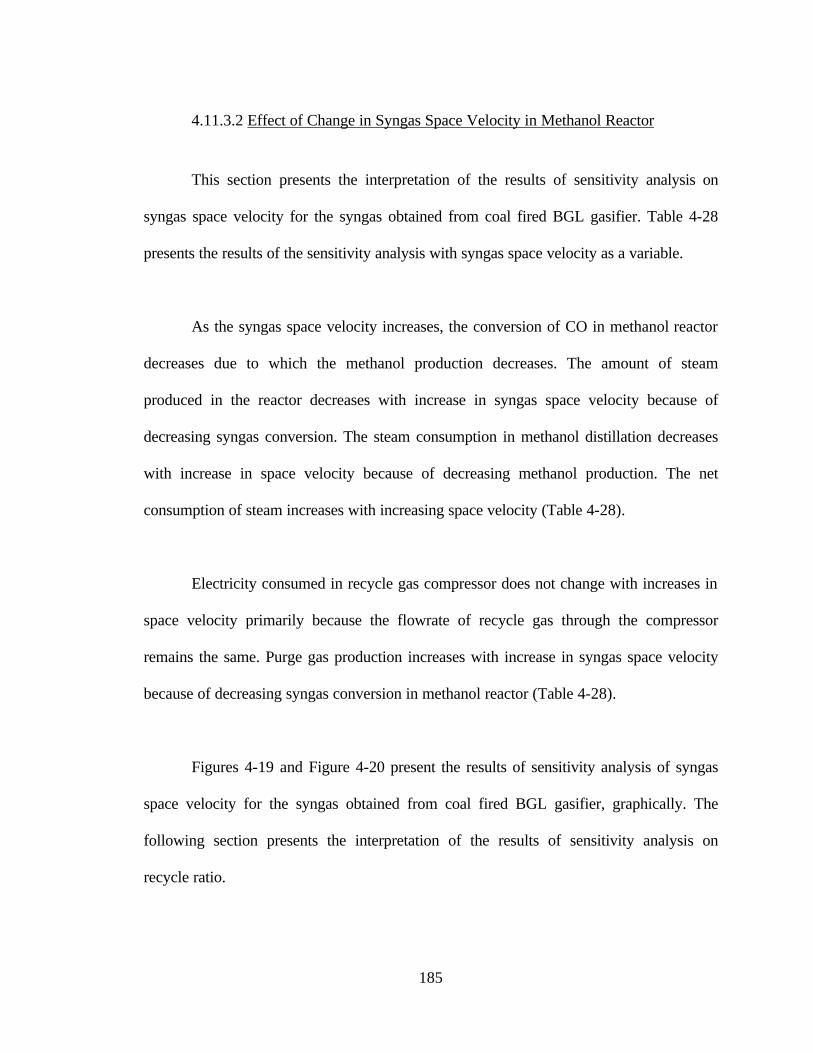
185
4.11.3.2 Effect of Change in Syngas Space Velocity in Methanol Reactor
This section presents the interpretation of the results of sensitivity analysis on
syngas space velocity for the syngas obtained from coal fired BGL gasifier. Table 4-28
presents the results of the sensitivity analysis with syngas space velocity as a variable.
As the syngas space velocity increases, the conversion of CO in methanol reactor
decreases due to which the methanol production decreases. The amount of steam
produced in the reactor decreases with increase in syngas space velocity because of
decreasing syngas conversion. The steam consumption in methanol distillation decreases
with increase in space velocity because of decreasing methanol production. The net
consumption of steam increases with increasing space velocity (Table 4-28).
Electricity consumed in recycle gas compressor does not change with increases in
space velocity primarily because the flowrate of recycle gas through the compressor
remains the same. Purge gas production increases with increase in syngas space velocity
because of decreasing syngas conversion in methanol reactor (Table 4-28).
Figures 4-19 and Figure 4-20 present the results of sensitivity analysis of syngas
space velocity for the syngas obtained from coal fired BGL gasifier, graphically. The
following section presents the interpretation of the results of sensitivity analysis on
recycle ratio.

186
Figure 4-19. Results of Sensitivity of Syngas Space Velocity on Methanol Production, Steam Production, Steam Consumption, and Net Steam Consumption for the Syngas Obtained from Coal Fired BGL Gasifier
Figure 4-20. Results of Sensitivity of Syngas Space Velocity on Electricity Consumption in Recycle Gas Compressor and Purge Gas Flowrate for the Syngas Obtained from Coal Fired BGL Gasifier
0
1000
2000
3000
4000
5000
6000
7000
8000
0 1000 2000 3000 4000 5000 6000 7000 8000 9000
Syngas Space Velocity (Standard liters/kg-hr)
Flo
wra
te, l
b/h
r
MeOH Production (lb/hr)
Steam Production (lb/hr)
Steam Consumption (lb/hr)Net Steam Cosumption (lb/hr)
0
200
400
600
800
1000
1200
1400
0 1000 2000 3000 4000 5000 6000 7000 8000 9000
Syngas Space Velocity (Standard liters/kg-hr)
Ele
ctri
city
Co
nsu
mp
tio
n o
r P
urg
e G
as F
low
rate
Electricity Consumption (kW)
Purge Gas Flowrate (lbmol/hr)
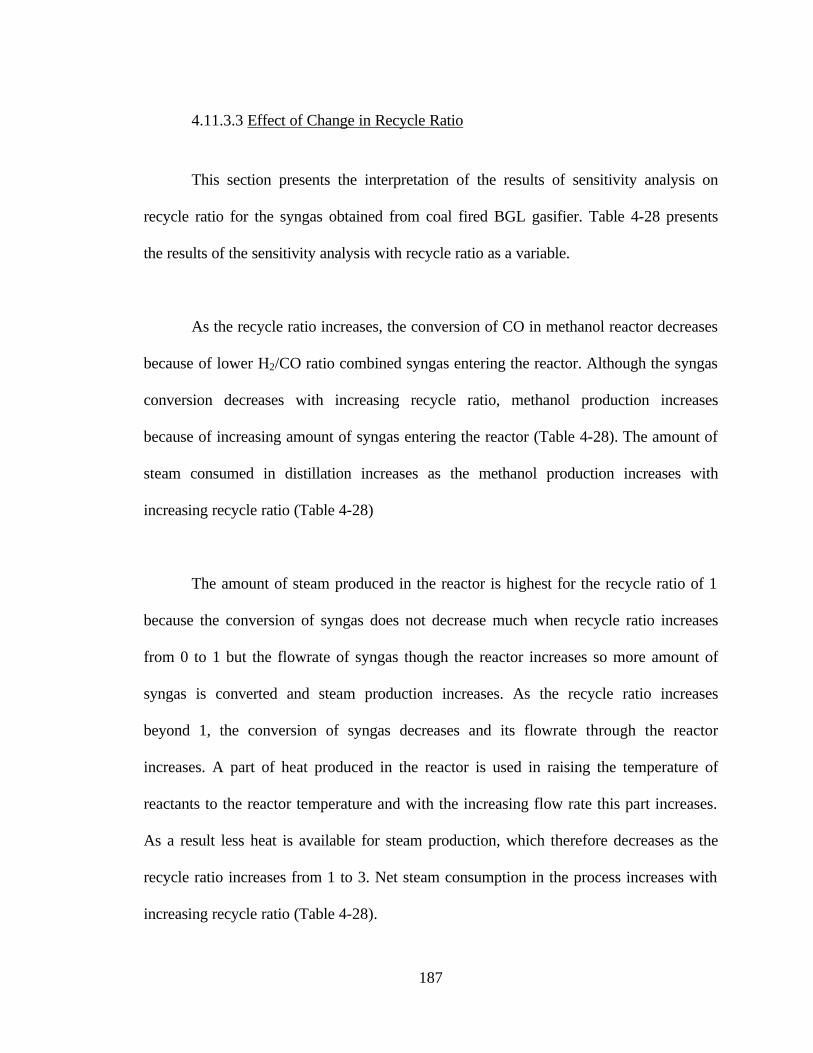
187
4.11.3.3 Effect of Change in Recycle Ratio
This section presents the interpretation of the results of sensitivity analysis on
recycle ratio for the syngas obtained from coal fired BGL gasifier. Table 4-28 presents
the results of the sensitivity analysis with recycle ratio as a variable.
As the recycle ratio increases, the conversion of CO in methanol reactor decreases
because of lower H2/CO ratio combined syngas entering the reactor. Although the syngas
conversion decreases with increasing recycle ratio, methanol production increases
because of increasing amount of syngas entering the reactor (Table 4-28). The amount of
steam consumed in distillation increases as the methanol production increases with
increasing recycle ratio (Table 4-28)
The amount of steam produced in the reactor is highest for the recycle ratio of 1
because the conversion of syngas does not decrease much when recycle ratio increases
from 0 to 1 but the flowrate of syngas though the reactor increases so more amount of
syngas is converted and steam production increases. As the recycle ratio increases
beyond 1, the conversion of syngas decreases and its flowrate through the reactor
increases. A part of heat produced in the reactor is used in raising the temperature of
reactants to the reactor temperature and with the increasing flow rate this part increases.
As a result less heat is available for steam production, which therefore decreases as the
recycle ratio increases from 1 to 3. Net steam consumption in the process increases with
increasing recycle ratio (Table 4-28).
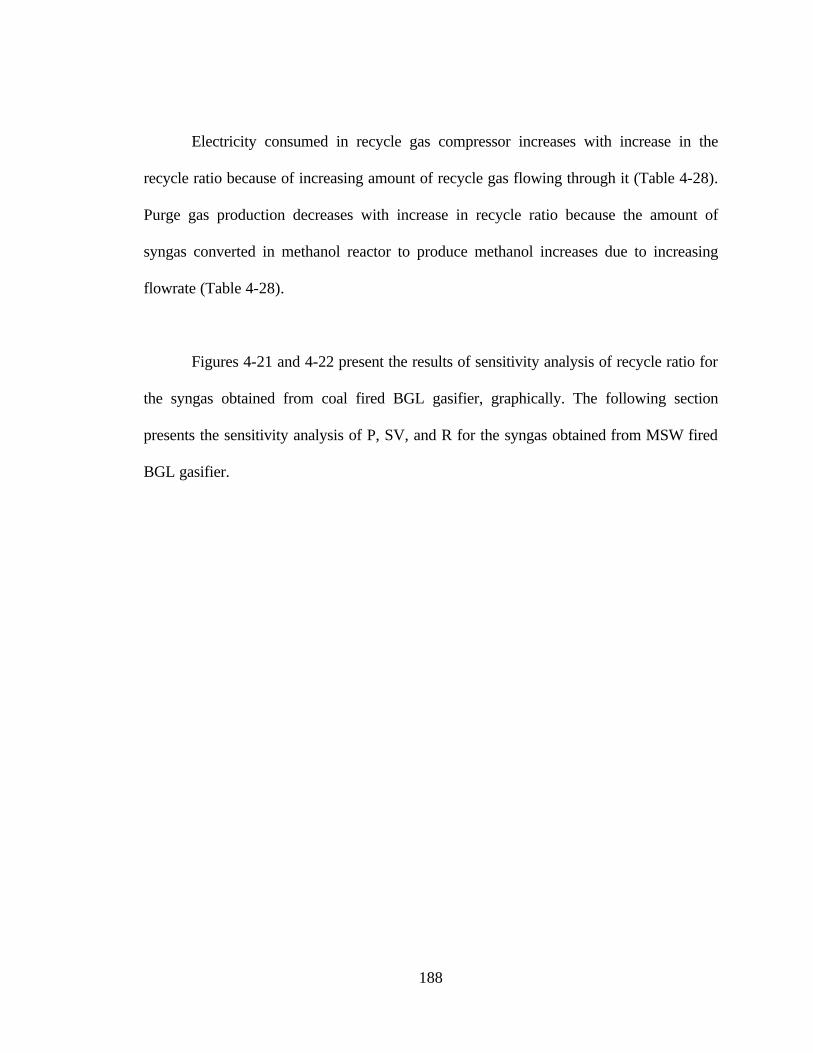
188
Electricity consumed in recycle gas compressor increases with increase in the
recycle ratio because of increasing amount of recycle gas flowing through it (Table 4-28).
Purge gas production decreases with increase in recycle ratio because the amount of
syngas converted in methanol reactor to produce methanol increases due to increasing
flowrate (Table 4-28).
Figures 4-21 and 4-22 present the results of sensitivity analysis of recycle ratio for
the syngas obtained from coal fired BGL gasifier, graphically. The following section
presents the sensitivity analysis of P, SV, and R for the syngas obtained from MSW fired
BGL gasifier.
189
Figure 4-21. Results of Sensitivity of Recycle Ratio on Methanol Production, Steam Production, Steam Consumption, and Net Steam Consumption for the Syngas Obtained from Coal Fired BGL Gasifier
Figure 4-22. Results of Sensitivity of Syngas Recycle Ratio on Electricity Consumption in Recycle Gas Compressor and Purge Gas Flowrate for the Syngas Obtained from Coal Fired BGL Gasifier
0
1000
2000
3000
4000
5000
6000
7000
0 0.5 1 1.5 2 2.5 3 3.5
Recycle Ratio (moles recycle gas/moles fresh syngas feed)
Flo
wra
te, l
b/h
r
MeOH Production (lb/hr)
Steam Production (lb/hr)
Steam Consumption (lb/hr)
Net Steam Cosumption (lb/hr)
0
200
400
600
800
1000
1200
1400
1600
1800
0 0.5 1 1.5 2 2.5 3 3.5
Recycle Ratio (moles recycle gas/moles fresh syngas feed)
Ele
ctri
city
Co
nsu
mp
tio
n o
r P
urg
e G
as F
low
rate
Electricity Consumption (kW)
Purge Gas Flowrate (lbmol/hr)
190
4.11.4 Sensitivity Analysis on Syngas Produced by Municipal Solid Waste (MSW) Fired British Gas and Lurgi (BGL) Gasifier
This section presents the sensitivity analysis results of individually changing P,
SV, and R in LPMEOH process operating on syngas obtained from a blend of coal and
refuse derived fuel (RDF), which is referred to here as the MSW fired BGL gasifier. The
composition of the syngas derived from MSW is presented in Table 4-26. Flowrate of
syngas considered is 1805.2 lbmol/hr as in base case. A saturated steam is produced in
methanol reactor whose pressure is held constant at 387.7 psia as in base case. Saturated
steam at 100 psia is used in the methanol distillation whose pressure is also held constant
during all the sensitivity cases.
Table 4-29 presents the results of the sensitivity analysis with P, SV and R as a
variable. It should be noted that in varying reactor pressure, the pressure drops and
temperatures across various process equipment are held constant as in Table 4-13.
Following section presents the interpretation of the results of sensitivity analysis on
pressure

191
Table 4-29. Results of Sensitivity Analysis for Varying Pressure, Space Velocity, and Recycle Ratio in LPMEOH Process Operating on Syngas Obtained from MSW Fired BGL Gasifiera
Results of Simulation
Variation of P (psig) SV = 8827 Sl/kg-hr (Constant) R = 3.22 (Constant)
Variation of SV (Sl/kg-hr) P = 707 psig (Constant) R = 3.22 (Constant)
Variation of R P = 707 psig (Constant) SV = 8827 Sl/kg-hr (Constant)
Parameter Value 500 750 1000 1250 2000 4000 8000 0 1 2 3 CO Conversion per pass, % 4.37 5.39 5.96 6.29 6.03 5.72 5.33 8.35 7.3 6.29 5.38 Electricity Consumption (kW) 205 137 102 82 242 242.4 243 0 76.5 153 230 MeOH Production (lb/hr) 5780 7690 8980 9860 9070 8320 7520 2050 4180 5910 7250 Steam Production (lb/hr) 0 1570 2930 3870 3060 2260 1400 1050 1630 1730 1360 Steam Consumption (lb/hr) 4480 5930 6910 7560 6980 6410 5800 1570 3210 4550 5600 Net Steam Consumption (lb/hr) 4480 4360 3980 3690 3920 4150 4400 520 1580 2820 4240 Purge Gas Temperature (F) 99 99 99 99 99 99 99 99 99 99 99 Pressure (psia) 492.7 742.7 992.7 1242.7 699.7 699.7 699.7 699.7 699.7 699.7 699.7 Flowrate (lbmol/hr)
H2 291 178 100 47 92 139 187 532 399 290 205 CO 701 647 611 583 606 628 652 807 745 696 659 N2 47 46.9 46.8 46.8 46.8 46.8 46.8 46.9 46.9 46.9 46.9 CH4 151 151 151 151 151.8 151.6 151.2 151 151 151 151 CO2 23.5 22.6 22.1 21.7 21.8 22.3 22.7 32.9 29.5 26.2 23.13 CH3OH 12.9 8.8 7 6.1 8.3 8.7 9.2 12.9 11.5 10.3 9.4 H2O 0.2 0.1 0.08 0.07 0.11 0.12 0.13 0.16 0.15 0.14 0.14
Total (lbmol/hr) 1226 1054 938 856 927 997 1069 1580 1380 1220 1090 a Flowrate of syngas used is 1805.2 lbmol/hr for all the cases presented
191

192
4.11.4.1 Effect of Change in Reactor Pressure
This section presents the interpretation of the results of sensitivity analysis on
pressure for the syngas obtained from MSW fired BGL gasifier. Table 4-29 presents the
results of the sensitivity analysis with reactor pressure as a variable.
As the syngas obtained from BGL gasifier firing MSW has low H2/CO ratio
(0.78), the conversion of CO in the methanol reactor is quite small but greater than that
for syngas derived from coal fired BGL gasifier. The trends in the sensitivity results with
varying reactor pressure in case of syngas obtained from MSW are similar to that for
syngas derived from coal discussed in previous section and are not detailed here.
Figures 4-23 and 4-24 present the results of sensitivity analysis of reactor pressure
for the syngas obtained from MSW fired BGL gasifier, graphically. The following
section presents the interpretation of the results of sensitivity analysis on syngas space
velocity.
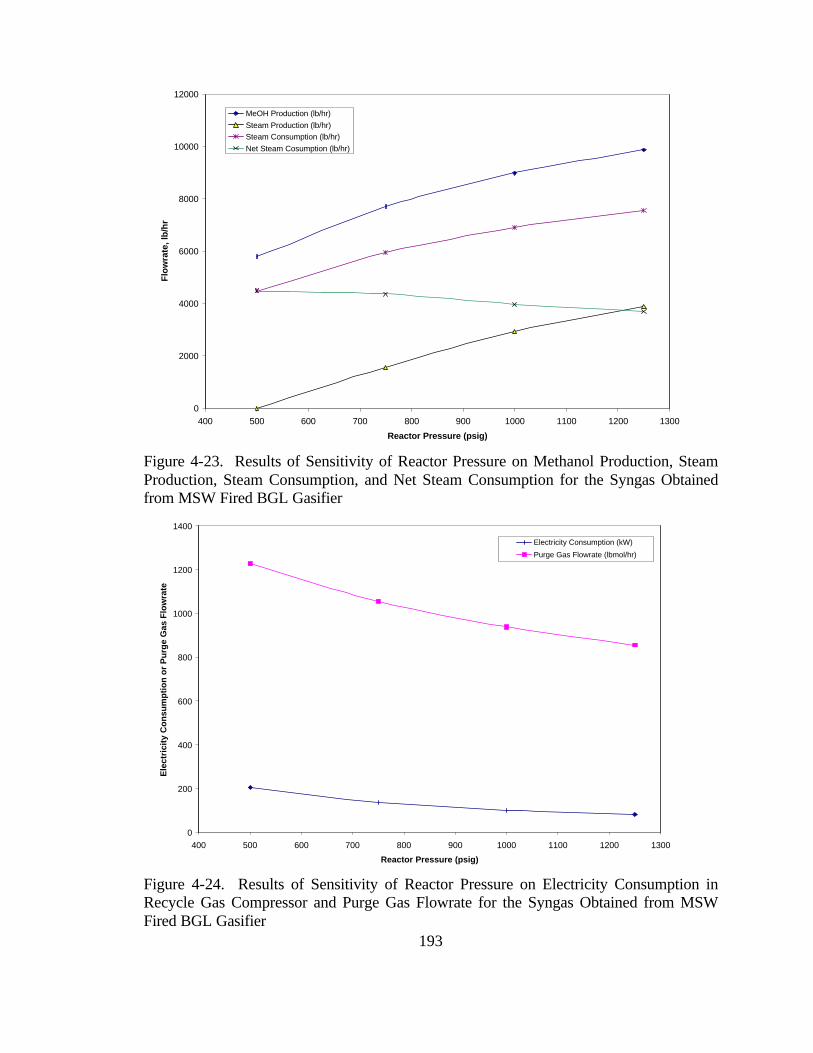
193
Figure 4-23. Results of Sensitivity of Reactor Pressure on Methanol Production, Steam Production, Steam Consumption, and Net Steam Consumption for the Syngas Obtained from MSW Fired BGL Gasifier
Figure 4-24. Results of Sensitivity of Reactor Pressure on Electricity Consumption in Recycle Gas Compressor and Purge Gas Flowrate for the Syngas Obtained from MSW Fired BGL Gasifier
0
2000
4000
6000
8000
10000
12000
400 500 600 700 800 900 1000 1100 1200 1300
Reactor Pressure (psig)
Flo
wra
te, l
b/h
r
MeOH Production (lb/hr)
Steam Production (lb/hr)Steam Consumption (lb/hr)
Net Steam Cosumption (lb/hr)
0
200
400
600
800
1000
1200
1400
400 500 600 700 800 900 1000 1100 1200 1300
Reactor Pressure (psig)
Ele
ctri
city
Co
nsu
mp
tio
n o
r P
urg
e G
as F
low
rate
Electricity Consumption (kW)
Purge Gas Flowrate (lbmol/hr)

194
4.11.4.2 Effect of Change in Syngas Space Velocity in Methanol Reactor
This section presents the interpretation of the results of sensitivity analysis on
syngas space velocity for the syngas obtained from MSW fired BGL gasifier. Table 4-29
presents the results of the sensitivity analysis with syngas space velocity as a variable.
As the syngas space velocity increases, the conversion of CO in methanol reactor
decreases due to which the methanol production decreases. The amount of steam
produced in the reactor decreases with increase in syngas space velocity because of
decreasing syngas conversion. The steam consumption in methanol distillation decreases
with increase in space velocity because of decreasing methanol production. The net
consumption of steam increases with increasing space velocity (Table 4-29).
Electricity consumed in recycle gas compressor does not change with increases in
space velocity primarily because the flowrate of recycle gas through the compressor
remains the same (Table 4-29). Purge gas production increases with increase in syngas
space velocity because of decreasing syngas conversion (Table 4-29).
Figures 4-25 and 4-26 present the results of sensitivity analysis of syngas space
velocity for the syngas obtained from MSW fired BGL gasifier, graphically. The
following section presents the interpretation of the results of sensitivity analysis on
recycle ratio.
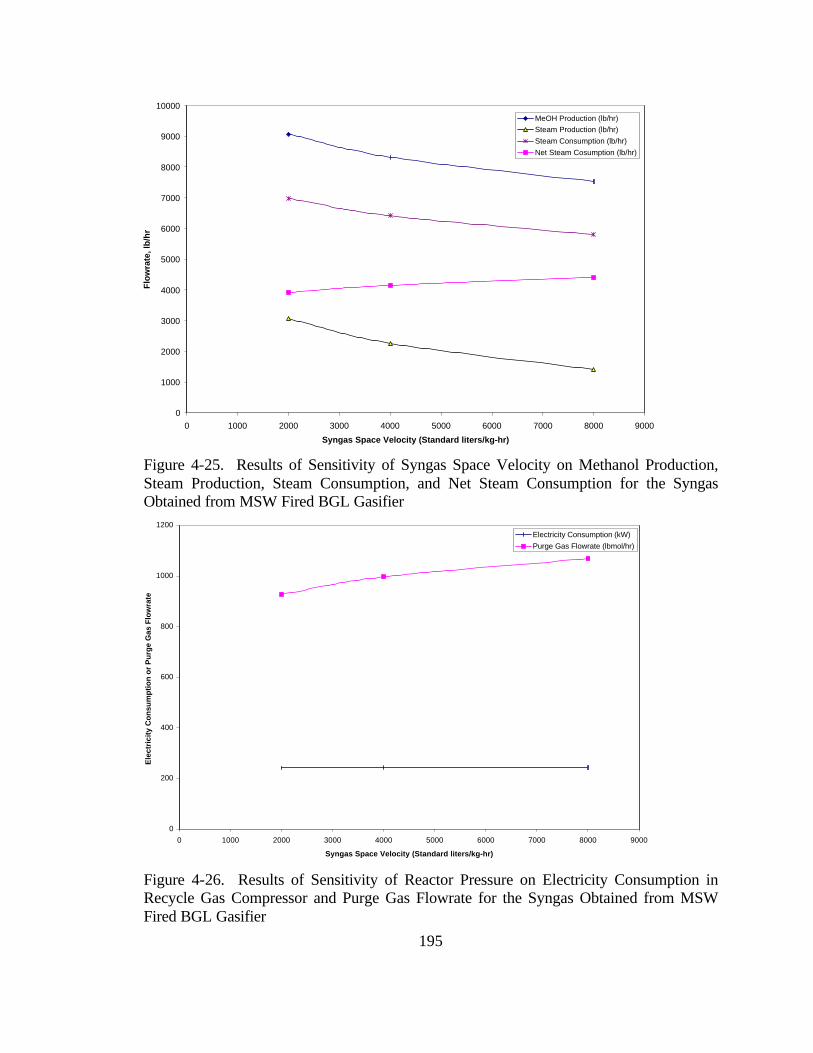
195
Figure 4-25. Results of Sensitivity of Syngas Space Velocity on Methanol Production, Steam Production, Steam Consumption, and Net Steam Consumption for the Syngas Obtained from MSW Fired BGL Gasifier
Figure 4-26. Results of Sensitivity of Reactor Pressure on Electricity Consumption in Recycle Gas Compressor and Purge Gas Flowrate for the Syngas Obtained from MSW Fired BGL Gasifier
0
1000
2000
3000
4000
5000
6000
7000
8000
9000
10000
0 1000 2000 3000 4000 5000 6000 7000 8000 9000
Syngas Space Velocity (Standard liters/kg-hr)
Flo
wra
te, l
b/h
r
MeOH Production (lb/hr)
Steam Production (lb/hr)
Steam Consumption (lb/hr)
Net Steam Cosumption (lb/hr)
0
200
400
600
800
1000
1200
0 1000 2000 3000 4000 5000 6000 7000 8000 9000
Syngas Space Velocity (Standard liters/kg-hr)
Ele
ctri
city
Co
nsu
mp
tio
n o
r P
urg
e G
as F
low
rate
Electricity Consumption (kW)
Purge Gas Flowrate (lbmol/hr)
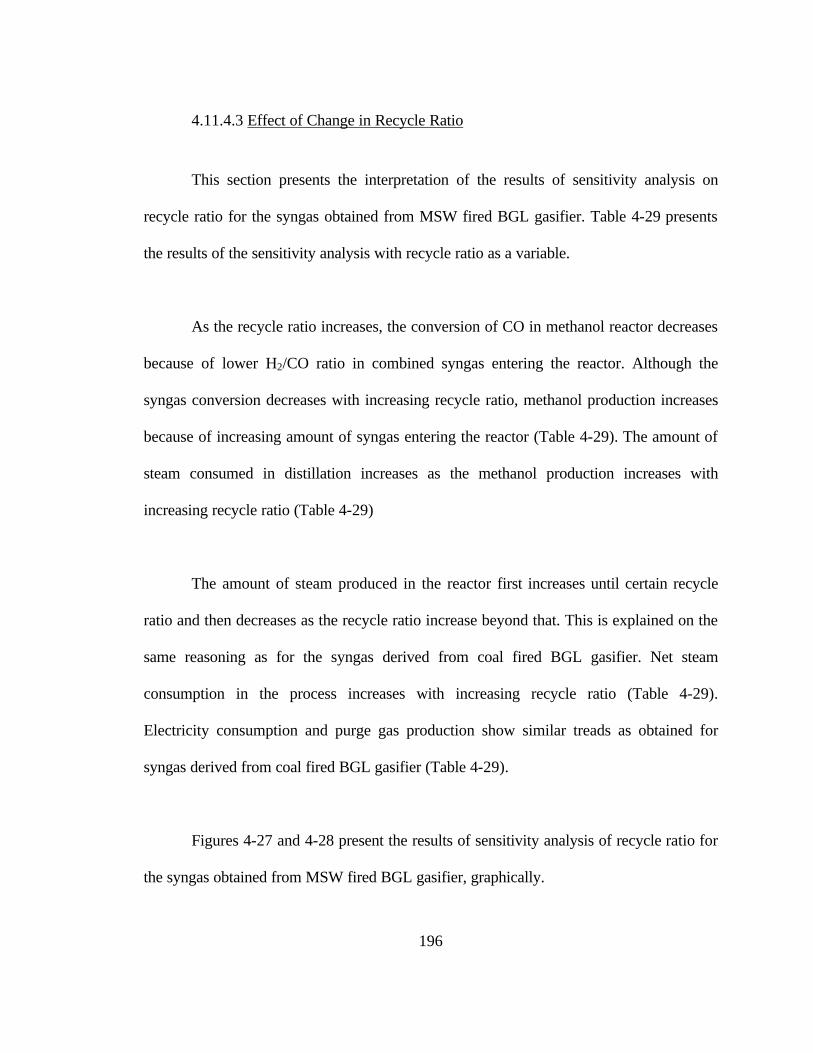
196
4.11.4.3 Effect of Change in Recycle Ratio
This section presents the interpretation of the results of sensitivity analysis on
recycle ratio for the syngas obtained from MSW fired BGL gasifier. Table 4-29 presents
the results of the sensitivity analysis with recycle ratio as a variable.
As the recycle ratio increases, the conversion of CO in methanol reactor decreases
because of lower H2/CO ratio in combined syngas entering the reactor. Although the
syngas conversion decreases with increasing recycle ratio, methanol production increases
because of increasing amount of syngas entering the reactor (Table 4-29). The amount of
steam consumed in distillation increases as the methanol production increases with
increasing recycle ratio (Table 4-29)
The amount of steam produced in the reactor first increases until certain recycle
ratio and then decreases as the recycle ratio increase beyond that. This is explained on the
same reasoning as for the syngas derived from coal fired BGL gasifier. Net steam
consumption in the process increases with increasing recycle ratio (Table 4-29).
Electricity consumption and purge gas production show similar treads as obtained for
syngas derived from coal fired BGL gasifier (Table 4-29).
Figures 4-27 and 4-28 present the results of sensitivity analysis of recycle ratio for
the syngas obtained from MSW fired BGL gasifier, graphically.

197
Figure 4-27. Results of Sensitivity of Recycle Ratio on Methanol Production, Steam Production, Steam Consumption, and Net Steam Consumption for the Syngas Obtained from MSW Fired BGL Gasifier
Figure 4-28. Results of Sensitivity of Syngas Recycle Ratio on Electricity Consumption in Recycle Gas Compressor and Purge Gas Flowrate for the Syngas Obtained from MSW Fired BGL Gasifier
0
1000
2000
3000
4000
5000
6000
7000
8000
0 0.5 1 1.5 2 2.5 3 3.5
Recycle Ratio (moles recycle gas/moles fresh syngas feed)
Flo
wra
te, l
b/h
r
MeOH Production (lb/hr)
Steam Production (lb/hr)
Steam Consumption (lb/hr)
Net Steam Cosumption (lb/hr)
0
200
400
600
800
1000
1200
1400
1600
1800
0 0.5 1 1.5 2 2.5 3 3.5
Recycle Ratio (moles recycle gas/moles fresh syngas feed)
Ele
ctri
city
Co
nsu
mp
tio
n o
r P
urg
e G
as F
low
rate
Electricity Consumption (kW)
Purge Gas Flowrate (lbmol/hr)
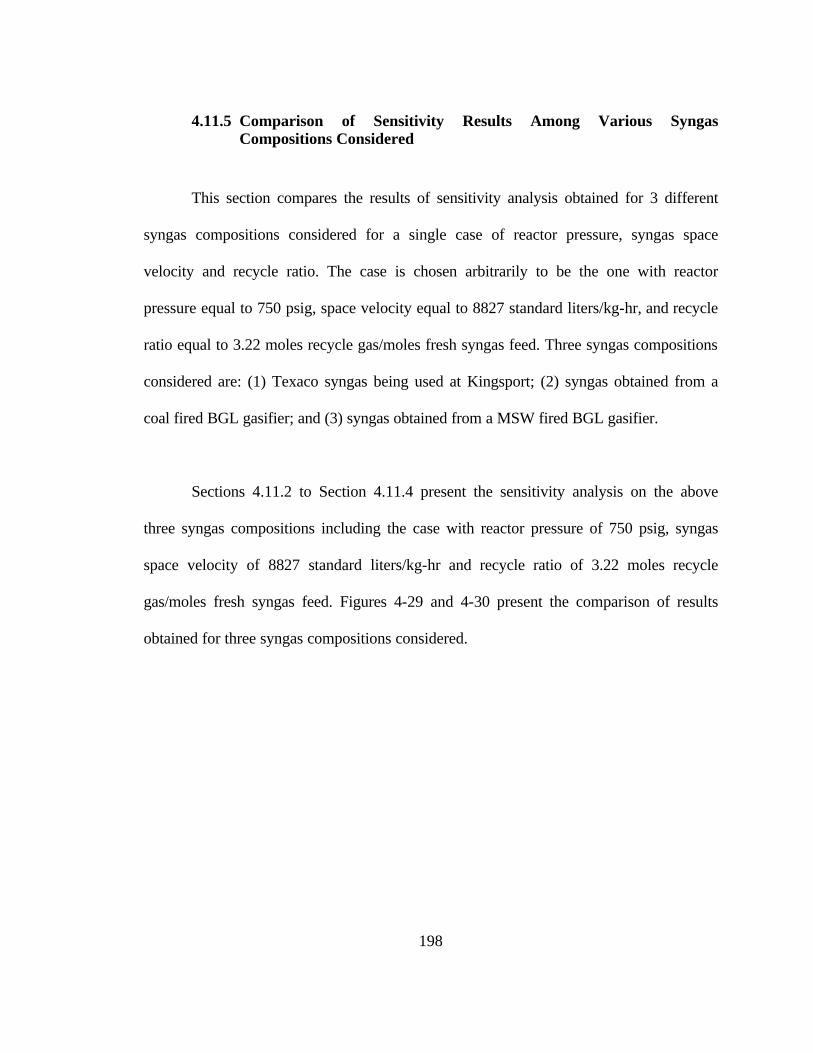
198
4.11.5 Comparison of Sensitivity Results Among Various Syngas Compositions Considered
This section compares the results of sensitivity analysis obtained for 3 different
syngas compositions considered for a single case of reactor pressure, syngas space
velocity and recycle ratio. The case is chosen arbitrarily to be the one with reactor
pressure equal to 750 psig, space velocity equal to 8827 standard liters/kg-hr, and recycle
ratio equal to 3.22 moles recycle gas/moles fresh syngas feed. Three syngas compositions
considered are: (1) Texaco syngas being used at Kingsport; (2) syngas obtained from a
coal fired BGL gasifier; and (3) syngas obtained from a MSW fired BGL gasifier.
Sections 4.11.2 to Section 4.11.4 present the sensitivity analysis on the above
three syngas compositions including the case with reactor pressure of 750 psig, syngas
space velocity of 8827 standard liters/kg-hr and recycle ratio of 3.22 moles recycle
gas/moles fresh syngas feed. Figures 4-29 and 4-30 present the comparison of results
obtained for three syngas compositions considered.

199
Figure 4-29. Comparison of Methanol Production, Stream Production, Steam Consumption, Net Steam Consumption for: (1) Texaco Syngas (Kingsport); (2) MSW Fired BGL Gasifier Syngas; and (3) Coal Fired BGL Gasifier Syngas
Figure 4-30. Comparison of Electricity Consumption and Purge Gas Production for: (1) Texaco Syngas (Kingsport); (2) MSW Fired BGL Gasifier Syngas; and (3) Coal Fired BGL Gasifier Syngas
P = 750 psig; SV = 8827 Sl/kg-hr; R = 3.22 Syngas flowrate = 1805.2 lbmol/hr
0
2000
4000
6000
8000
10000
12000
14000
16000
18000
Methanol Production (lb/hr) Steam Production (lb/hr) Steam Consumption (lb/hr) Net Steam Consumption (lb/hr)
Model Results
Flo
wra
te, l
b/h
r
Texaco Syngas (Kingsport)
MSW Fired BGL Gasifier Syngas
Coal Fired BGL Gasifier Syngas
P = 750 psig; SV = 8827 Sl/kg-hr; R = 3.22, Syngas flowrate = 1805.2 lbmol/hr
0
200
400
600
800
1000
1200
1400
Electricity Consumption (kW) Purge Gas Flowrate (lbmol/hr)
Model Results
Ele
ctri
city
Co
nsu
mp
tio
n o
r P
urg
e G
as F
low
rate
Texaco Syngas (Kingsport)
MSW Fired BGL Gasifier Syngas
Coal Fired BGL Gasifier Syngas
200
The main difference between the three syngas compositions is their H2/CO molar
ratio. Texaco syngas has the H2/CO ratio of 2.25 (highest), syngas derived from MSW
has H2/CO ratio of 0.78, and syngas derived from coal has H2/CO ratio of 0.51 (lowest).
From Figure 4-29, it is clear that for same fresh syngas flowrate (1805.2 lbmol/hr) and
same conditions of reactor pressure, syngas space velocity, and recycle ratio, the Texaco
syngas produces the most methanol and the syngas derived from coal produces the least
amount of methanol. Thus as the H2/CO ratio of the fresh syngas feed decreases, the
methanol production decreases because there is less syngas conversion in the methanol
reactor due to decreasing H2/CO ratio of syngas feed. Also the steam consumption in
methanol reactor decreases as the H2/CO ratio of the syngas decreases because methanol
production decreases. Steam production in the methanol also decreases with decreasing
H2/CO ratio in the fresh syngas feed for the same reason as that in methanol production.
Net steam consumption, however, increases with decreasing H2/CO ratio of the fresh
syngas feed.
In Figure 4-30, it is clear that electricity consumption in the recycle gas
compressor increases with decrease in H2/CO ratio because for the same molar flowrate
through the compressor, the syngas with higher H2/CO has lower mass flowrate, so the
compressor has to do less work in compressing it than the recycle gas with lower H2/CO
ratio. Purge gas flowrate increases with decreasing H2/CO ratio because the syngas
conversion in the reactor decreases.
201
Based on the sensitivity analysis of LPMEOH process model, it is found that
methanol production, steam consumption, steam production, electricity consumption, and
purge gas production are sensitive to reactor pressure, syngas space velocity, and recycle
ratio. For the syngas compositions with lower H2/CO ratio such as coal and MSW
derived syngas, it is recommended that the reactor be operated at or above 750 psig
pressure since at lower pressure such as 500 psig, the syngas conversion in the reactor is
very limited and reactions would not occur unless the reactor is supplied with heat. Also
there is no steam production in the LPMEOH reactor at pressure of 500 psig for coal and
MSW derived syngas which defeats the purpose of having internal heat exchanger in the
reactor for heat removal.
The sensitivity analysis indicate that there is a clear advantage to recycling the
unconverted syngas to the methanol reactor, since there is more production of methanol
for the case with a recycle than the case with no recycle. This holds true for all three
syngas compositions considered. Also as the H2/CO ratio of the fresh syngas decreases
from Texaco syngas (2.25) to that of coal derived syngas (0.51), there is a decrease in
methanol production. Thus it would be desirable to adjust the H2/CO ratio of the fresh
syngas feed through a water-gas shift reaction so that the H2/CO ratio increases and there
is higher methanol production. This would require inclusion of a water-gas shift reactor
prior to the LPMEOH process section or some modification within the LPMEOH
methanol reactor itself to incorporate water gas shift reaction for the syngas feeds limited
in hydrogen content. The actual steps to be incorporated will require detailed economic
analysis and is beyond the scope of this study.

202
The following section presents the sensitivity analysis of the LCI of methanol
produced by LPMEOH process.
203
4.11.6 Sensitivity Analysis of the LCI of Methanol
This section presents the results of sensitivity analysis of LCI of methanol based
on the results obtained from LPMEOH process model. Four main cases considered for
the sensitivity analysis on the LCI of methanol are: (1) effect of reactor pressure; (3)
effect of syngas space velocity; (3) effect of recycle ratio; (4) effect of syngas
composition. Texaco syngas is arbitrarily chosen to demonstrate the sensitivity analysis
on 2 cases of rector pressures, 750 psig, and 1000 psig; 2 cases of syngas space
velocities, 4000 standard liters/kg-hr and 8000 standard liters/kg-hr; and 2 cases of
recycle ratio, 2 moles recycle gas/moles fresh syngas feed and 3 moles recycle gas/moles
fresh syngas feed. For the case of sensitivity analysis on syngas composition, reactor
pressure of 750 psig, syngas space velocity of 8827 standard liters/kg-hr, and a recycle
ratio of 3.22 moles recycle gas/moles fresh syngas feed are chosen, arbitrarily.
The following section presents the results of sensitivity analysis on LCI of
methanol with change in reactor pressure. The results that are relevant from LCI
standpoint are: (1) electricity consumption; (2) net steam consumption in the process; (3)
steam production from 99 percent purge gas combustion in boiler; (4) purge gas
emissions after 99 percent purge gas combustion, and (5) methanol production. Since the
LPMEOH process model does not have a capability to calculate fugitive emissions,
storage tank emissions, and BOD removal emissions, they are assumed to be constant.
204
4.11.6.1 Effect of Change in Reactor Pressure on the LCI of Methanol
This section presents the results of sensitivity analysis on the LCI of methanol
with change in reactor pressure for the Texaco syngas being used at Kingsport. Two
reactor pressures considered are: (1) 750 psig, and (2) 1000 psig. Table 4-30 presents the
results as obtained in Section 4.11.2.1 on per kg of methanol produced basis for reactor
pressure of 750 psig and 1000 psig.
From Table 4-30, it is clear that as pressure increases from 750 psig to 1000 psig,
the electricity consumed per kg of methanol decreases. Net steam consumption per kg of
methanol also decreases with an increase in pressure. As the pressure increases from 750
psig to 1000 psig, purge gas production per kg of methanol decreases so the purge gas
emissions (one percent of total purge gas produced) also decrease. As the purge gas
production decreases with increasing pressure, less steam per kg of methanol is produced
by 99 percent combustion of purge gases.
Table 4-31 presents the overall LCI of methanol for both the reactor pressures of
750 psig and 1000 psig.

205
Table 4-30. Sensitivity Results for Texaco Syngas on per kg of Methanol Produced Basis for Reactor Pressure of 750 psig and 1000 psig.
Reactor Pressure (psig) Model Results per kg of Methanol Produced
750
1000
Electricity Consumption (kWh/kg methanol) 1.43E-02 1.01E-02 Net Steam Consumption in Process (kg/kg methanol) 5.99E-02 3.07E-02 Purge Gas Steam Production (MJ/kg methanol)a 1.95E+00 6.88E-01 Purge Gas Emissions (kg/kg methanol)b
H2 1.64E-04 6.73E-05 CO 7.21E-04 1.27E-04 CH4 5.17E-06 4.83E-06 CH3OH 2.57E-05 8.94E-06 N2 8.81E-02 2.67E-02 CO2
c 1.62E-01 6.03E-02 H2O 1.50E-01 6.20E-02
aSteam produced in boiler due to 99 percent purge gas combustion bPurge gas emissions are based on 99 percent combustion efficiency in steam boiler cIncludes CO2 produced after 99 percent purge gas combustion in steam boiler

206
Table 4-31. The LCI of Methanol for Reactor Pressures of 750 psig and 1000 psig in LPMEOH Process Using Texaco Syngas
Air Emissions P = 750 psig P = 1000 psig PM -3.55E-05 -3.91E-06 SO2 -8.88E-04 -2.51E-04 NOx -1.39E-04 -2.20E-05 CO 5.23E-04 7.94E-05 CO2 (fossil) 3.99E-02 4.33E-02 CH4 -2.10E-04 -5.35E-05 HCl 4.58E-07 6.42E-07 Methanol 9.14E-05 7.47E-05 Liquid Emissions Suspended Solids -1.69E-05 -1.33E-06 BOD 6.42E-04 6.43E-04 COD -9.56E-06 -3.01E-06 Solid Waste -7.98E-03 9.65E-04
In Table 4-31, it is clear that as reactor pressure increases from 750 psig to 1000
psig, the LCI parameters that are positive in sign increase in magnitude except that for
CO and methanol. The CO and methanol emissions are higher in case of 750 psig case
because of a higher amount of CO and methanol (per kg of methanol produced) are
present in the uncombusted purge gas emitted from boiler. Some of the LCI parameters
are negative which means that they are avoided. The avoided emissions in case of 750
psig case are more than 1000 psig case. For example 750 psig pressure case avoids one
order of magnitude more PM emissions than 1000 psig case. For the case of 750 psig
pressure, steam production (per kg of methanol produced) by purge gas combustion is
higher that that for 1000 psig pressure case. Higher steam production due to purge gas
combustion causes more emission offsets in case of 750 psig case than 1000 psig case.

207
4.11.6.2 Effect of Change in Syngas Space Velocity on the LCI of Methanol
This section presents the results of sensitivity analysis on the LCI of methanol
with change in syngas space velocity for the Texaco syngas being used at Kingsport. Two
syngas space velocities considered are: (1) 4000 standard liters/kg-hr, and (2) 8000
standard liters/kg-hr. Table 4-32 presents the results as obtained in Section 4.11.2.2 on
per kg of methanol produced basis for space velocities of 4000 standard liters/kg-hr and
8000 standard liters/kg-hr.
From Table 4-32, it is clear that as syngas space velocity increases from 4000
standard liters/kg-hr to 8000 standard liters/kg-hr, the electricity consumed per kg of
methanol increases because the methanol production decreases. Net steam consumption
per kg of methanol increases with increase in pressure. As the space velocity increases
from 4000 standard liters/kg-hr to 8000 standard liters/kg-hr, purge gas production per kg
of methanol increases so the purge gas emissions (one percent of total purge gas
produced) also increases. As the purge gas production increases with increasing space
velocity, more steam per kg of methanol is produced by 99 percent combustion of purge
gases in boiler.
Table 4-33 presents the overall LCI of methanol for both the space velocities of
4000 standard liters/kg-hr and 8000 standard liters/kg-hr.

208
Table 4-32. Sensitivity Results for Texaco Syngas on per kg of Methanol Produced Basis for Syngas Space Velocities of 4000 standard liters/kg-hr and 8000 standard liters/kg-hr
Syngas Space Velocity (Standard liters/kg-hr)
Model Results per kg of Methanol Produced
4000
8000
Electricity Consumption (kWh/kg methanol) 2.33E-02 2.56E-02 Net Steam Consumption in Process (kg/kg methanol) 3.63E-02 7.30E-02 Purge Gas Steam Production (MJ/kg methanol)a 7.43E-01 2.42E+00 Purge Gas Emissions (kg/kg methanol)b
H2 6.98E-05 2.00E-04 CO 1.69E-04 9.43E-04 CH4 4.92E-06 5.40E-06 CH3OH 1.07E-05 3.34E-05 N2 3.10E-02 1.12E-01 CO2
c 6.25E-02 2.01E-01 H2O 6.45E-02 1.83E-01
aSteam produced in boiler due to 99 percent purge gas combustion bPurge gas emissions are based on 99 percent combustion efficiency in steam boiler cIncludes CO2 produced after 99 percent purge gas combustion in steam boiler
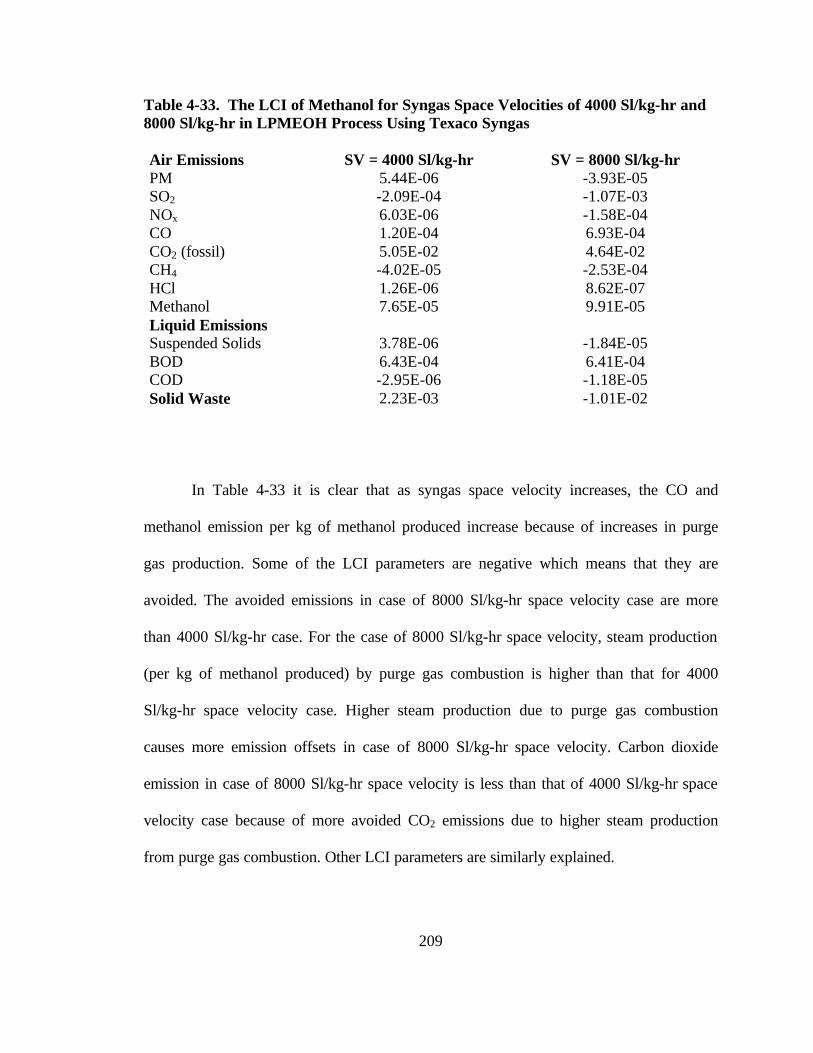
209
Table 4-33. The LCI of Methanol for Syngas Space Velocities of 4000 Sl/kg-hr and 8000 Sl/kg-hr in LPMEOH Process Using Texaco Syngas Air Emissions SV = 4000 Sl/kg-hr SV = 8000 Sl/kg-hr PM 5.44E-06 -3.93E-05 SO2 -2.09E-04 -1.07E-03 NOx 6.03E-06 -1.58E-04 CO 1.20E-04 6.93E-04 CO2 (fossil) 5.05E-02 4.64E-02 CH4 -4.02E-05 -2.53E-04 HCl 1.26E-06 8.62E-07 Methanol 7.65E-05 9.91E-05 Liquid Emissions Suspended Solids 3.78E-06 -1.84E-05 BOD 6.43E-04 6.41E-04 COD -2.95E-06 -1.18E-05 Solid Waste 2.23E-03 -1.01E-02
In Table 4-33 it is clear that as syngas space velocity increases, the CO and
methanol emission per kg of methanol produced increase because of increases in purge
gas production. Some of the LCI parameters are negative which means that they are
avoided. The avoided emissions in case of 8000 Sl/kg-hr space velocity case are more
than 4000 Sl/kg-hr case. For the case of 8000 Sl/kg-hr space velocity, steam production
(per kg of methanol produced) by purge gas combustion is higher than that for 4000
Sl/kg-hr space velocity case. Higher steam production due to purge gas combustion
causes more emission offsets in case of 8000 Sl/kg-hr space velocity. Carbon dioxide
emission in case of 8000 Sl/kg-hr space velocity is less than that of 4000 Sl/kg-hr space
velocity case because of more avoided CO2 emissions due to higher steam production
from purge gas combustion. Other LCI parameters are similarly explained.

210
4.11.6.3 Effect of Change in Recycle Ratio on the LCI of Methanol
This section presents the results of sensitivity analysis on the LCI of methanol
with change in recycle ratio for the Texaco syngas being used at Kingsport. Two recycle
ratios considered are: (1) 2 moles recycle gas/moles fresh syngas feed, and (2) 3 moles
recycle gas/moles fresh syngas feed. Table 4-34 presents the results as obtained in
Section 4.11.2.3 on per kg of methanol produced basis for the recycle ratio of 2 moles
recycle gas/moles fresh syngas feed and 3 moles recycle gas/moles fresh syngas feed.
From Table 4-34, it is clear that as recycle ratio increases from 2 to 3, the
electricity consumed per kg of methanol increases because the compressor has to recycle
more unreacted gases where as the methanol production does not increased in same
proportion. Net steam consumption per kg of methanol increases with increase in recycle
ratio. As the recycle ratio increases from 2 to 3, purge gas production per kg of methanol
decreases because of higher syngas conversion in methanol reactor. Therefore the purge
gas emissions (one percent of total purge gas produced) also decrease. As the purge gas
decreases with increasing recycle ratio, less amount of steam per kg of methanol is
produced by 99 percent combustion of purge gases in boiler.
Table 4-35 presents the overall LCI of methanol for the recycle ratio of 2 moles
recycle gas/moles fresh syngas feed and 3 moles recycle gas/moles fresh syngas feed.
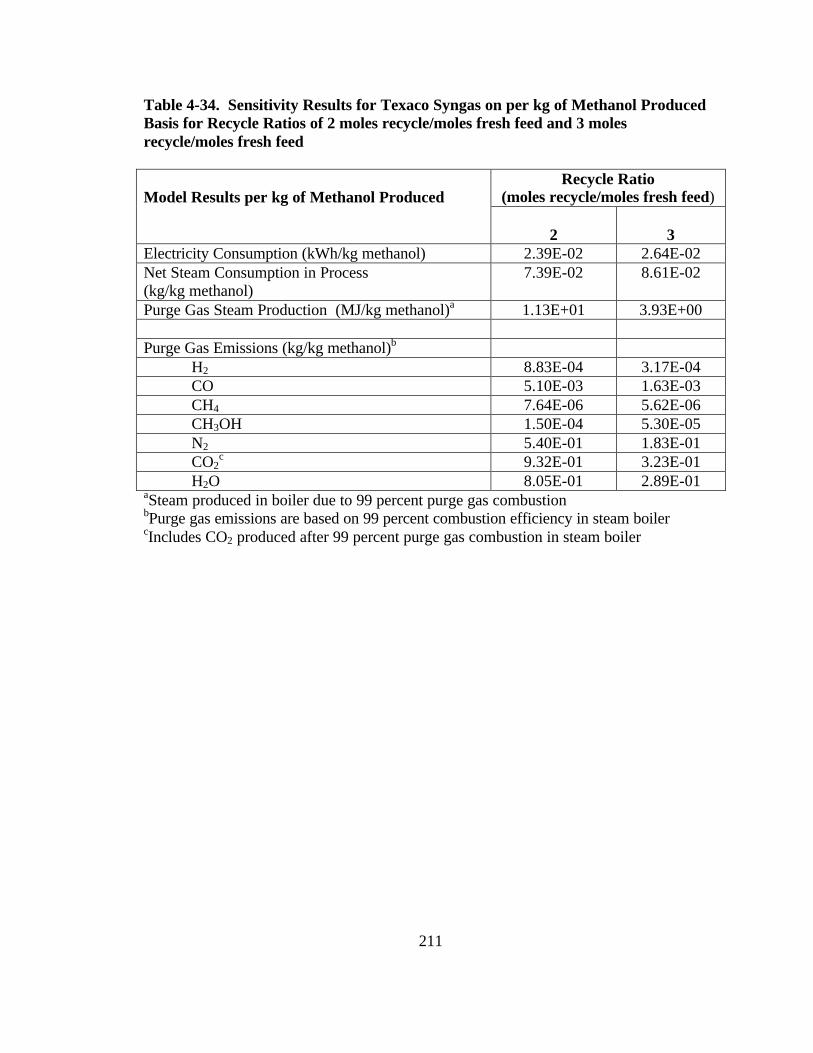
211
Table 4-34. Sensitivity Results for Texaco Syngas on per kg of Methanol Produced Basis for Recycle Ratios of 2 moles recycle/moles fresh feed and 3 moles recycle/moles fresh feed
Recycle Ratio (moles recycle/moles fresh feed)
Model Results per kg of Methanol Produced
2
3
Electricity Consumption (kWh/kg methanol) 2.39E-02 2.64E-02 Net Steam Consumption in Process (kg/kg methanol)
7.39E-02 8.61E-02
Purge Gas Steam Production (MJ/kg methanol)a 1.13E+01 3.93E+00 Purge Gas Emissions (kg/kg methanol)b
H2 8.83E-04 3.17E-04 CO 5.10E-03 1.63E-03 CH4 7.64E-06 5.62E-06 CH3OH 1.50E-04 5.30E-05 N2 5.40E-01 1.83E-01 CO2
c 9.32E-01 3.23E-01 H2O 8.05E-01 2.89E-01
aSteam produced in boiler due to 99 percent purge gas combustion bPurge gas emissions are based on 99 percent combustion efficiency in steam boiler cIncludes CO2 produced after 99 percent purge gas combustion in steam boiler
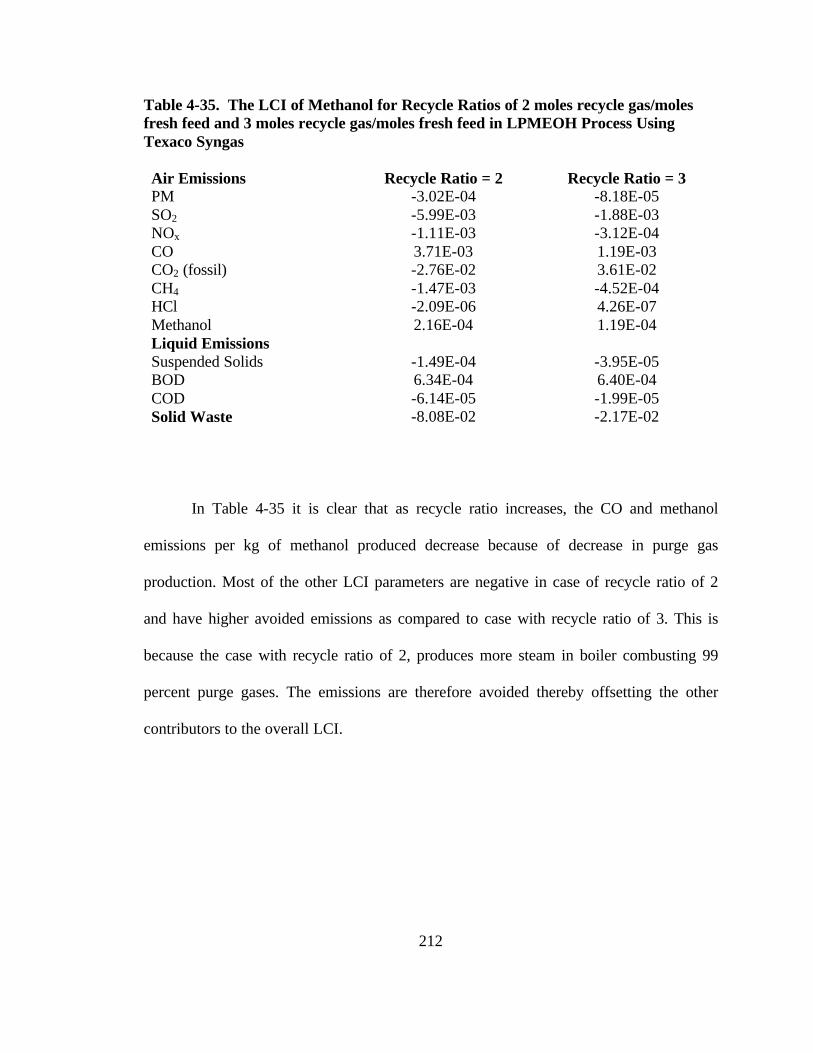
212
Table 4-35. The LCI of Methanol for Recycle Ratios of 2 moles recycle gas/moles fresh feed and 3 moles recycle gas/moles fresh feed in LPMEOH Process Using Texaco Syngas Air Emissions Recycle Ratio = 2 Recycle Ratio = 3 PM -3.02E-04 -8.18E-05 SO2 -5.99E-03 -1.88E-03 NOx -1.11E-03 -3.12E-04 CO 3.71E-03 1.19E-03 CO2 (fossil) -2.76E-02 3.61E-02 CH4 -1.47E-03 -4.52E-04 HCl -2.09E-06 4.26E-07 Methanol 2.16E-04 1.19E-04 Liquid Emissions Suspended Solids -1.49E-04 -3.95E-05 BOD 6.34E-04 6.40E-04 COD -6.14E-05 -1.99E-05 Solid Waste -8.08E-02 -2.17E-02
In Table 4-35 it is clear that as recycle ratio increases, the CO and methanol
emissions per kg of methanol produced decrease because of decrease in purge gas
production. Most of the other LCI parameters are negative in case of recycle ratio of 2
and have higher avoided emissions as compared to case with recycle ratio of 3. This is
because the case with recycle ratio of 2, produces more steam in boiler combusting 99
percent purge gases. The emissions are therefore avoided thereby offsetting the other
contributors to the overall LCI.
213
4.11.6.4 Effect of Change in Syngas Composition on the LCI of Methanol
This section presents the results of sensitivity analysis on the LCI of methanol
with change in syngas composition. Three syngas compositions considered are: (1)
Texaco syngas being used at Kingsport; (2) syngas obtained from coal fired BGL
gasifier; and (3) syngas obtained MSW fired BGL gasifier. Table 4-36 presents the
results as obtained in Section 4.11.2 to Section 4.11.4 on per kg of methanol produced
basis. All the three cases considered have same reactor pressure (P = 750 psig), syngas
space velocity (SV = 8827 standard liters/kg-hr), and recycle ratio (R = 3.22 moles
recycle gas/moles fresh syngas feed).
As stated earlier in Section 1.1.4, the main difference between the three syngas
compositions considered is their H2/CO molar ratio. From Table 4-36, it is clear that as
H2/CO ratio decreases from Texaco syngas (2.25) to coal syngas (0.51), the electricity
consumed per kg of methanol increases. Net steam consumption per kg of methanol also
increases with decrease in H2/CO ratio of fresh syngas feed. Amount of purge gas
increases as H2/CO ratio decreases because the syngas conversion in methanol reactor
decreases. Thus purge gas production increases per kg of methanol produced when
H2/CO ratio decreases from Texaco syngas to coal derived syngas. As the purge gas
production increases with decreasing H2/CO ratio, amount of steam produced per kg of
methanol by 99 percent combustion of purge gases in boiler also increases and is highest
for coal derived syngas. Table 4-37 presents the overall LCI of methanol for 3 syngas
compositions considered.
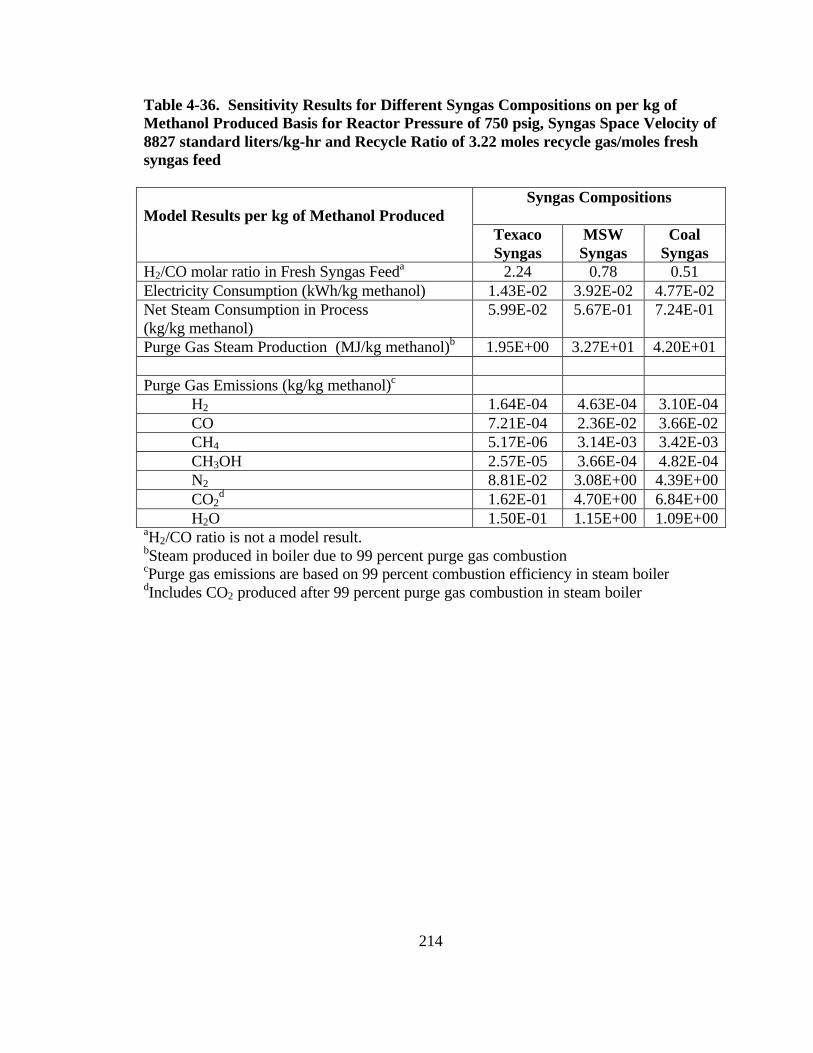
214
Table 4-36. Sensitivity Results for Different Syngas Compositions on per kg of Methanol Produced Basis for Reactor Pressure of 750 psig, Syngas Space Velocity of 8827 standard liters/kg-hr and Recycle Ratio of 3.22 moles recycle gas/moles fresh syngas feed
Syngas Compositions Model Results per kg of Methanol Produced
Texaco Syngas
MSW Syngas
Coal Syngas
H2/CO molar ratio in Fresh Syngas Feeda 2.24 0.78 0.51 Electricity Consumption (kWh/kg methanol) 1.43E-02 3.92E-02 4.77E-02 Net Steam Consumption in Process (kg/kg methanol)
5.99E-02 5.67E-01 7.24E-01
Purge Gas Steam Production (MJ/kg methanol)b 1.95E+00 3.27E+01 4.20E+01 Purge Gas Emissions (kg/kg methanol)c
H2 1.64E-04 4.63E-04 3.10E-04 CO 7.21E-04 2.36E-02 3.66E-02 CH4 5.17E-06 3.14E-03 3.42E-03 CH3OH 2.57E-05 3.66E-04 4.82E-04 N2 8.81E-02 3.08E+00 4.39E+00 CO2
d 1.62E-01 4.70E+00 6.84E+00 H2O 1.50E-01 1.15E+00 1.09E+00
aH2/CO ratio is not a model result. bSteam produced in boiler due to 99 percent purge gas combustion cPurge gas emissions are based on 99 percent combustion efficiency in steam boiler dIncludes CO2 produced after 99 percent purge gas combustion in steam boiler
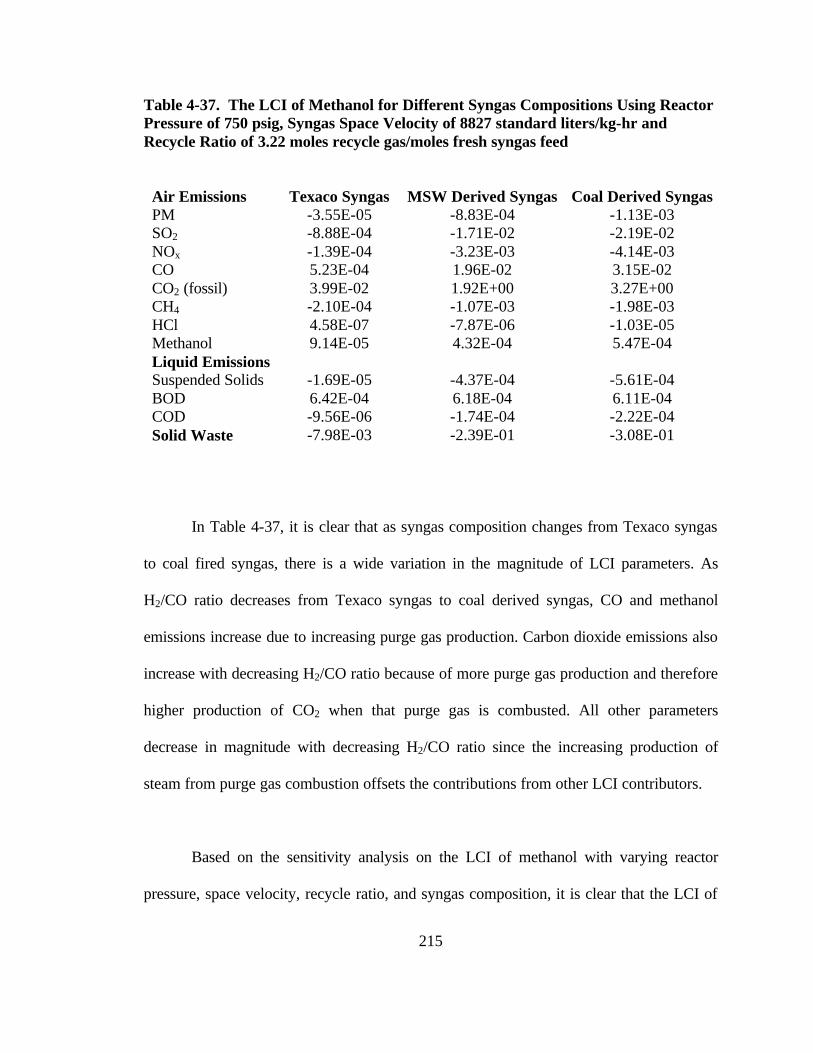
215
Table 4-37. The LCI of Methanol for Different Syngas Compositions Using Reactor Pressure of 750 psig, Syngas Space Velocity of 8827 standard liters/kg-hr and Recycle Ratio of 3.22 moles recycle gas/moles fresh syngas feed
Air Emissions Texaco Syngas MSW Derived Syngas Coal Derived Syngas PM -3.55E-05 -8.83E-04 -1.13E-03 SO2 -8.88E-04 -1.71E-02 -2.19E-02 NOx -1.39E-04 -3.23E-03 -4.14E-03 CO 5.23E-04 1.96E-02 3.15E-02 CO2 (fossil) 3.99E-02 1.92E+00 3.27E+00 CH4 -2.10E-04 -1.07E-03 -1.98E-03 HCl 4.58E-07 -7.87E-06 -1.03E-05 Methanol 9.14E-05 4.32E-04 5.47E-04 Liquid Emissions Suspended Solids -1.69E-05 -4.37E-04 -5.61E-04 BOD 6.42E-04 6.18E-04 6.11E-04 COD -9.56E-06 -1.74E-04 -2.22E-04 Solid Waste -7.98E-03 -2.39E-01 -3.08E-01
In Table 4-37, it is clear that as syngas composition changes from Texaco syngas
to coal fired syngas, there is a wide variation in the magnitude of LCI parameters. As
H2/CO ratio decreases from Texaco syngas to coal derived syngas, CO and methanol
emissions increase due to increasing purge gas production. Carbon dioxide emissions also
increase with decreasing H2/CO ratio because of more purge gas production and therefore
higher production of CO2 when that purge gas is combusted. All other parameters
decrease in magnitude with decreasing H2/CO ratio since the increasing production of
steam from purge gas combustion offsets the contributions from other LCI contributors.
Based on the sensitivity analysis on the LCI of methanol with varying reactor
pressure, space velocity, recycle ratio, and syngas composition, it is clear that the LCI of
216
methanol is sensitive to changes in them. In most of the cases considered above, steam
production from 99 percent purge gas combustion offsets the contributions from other
sources such as electricity, net steam consumption in the process, BOD removal, fugitive
emissions and methanol storage tank emissions. A sensitivity analysis of LCI of methanol
by varying pressure, space velocity and recycle ratio for two other syngas compositions
(MSW derived syngas and coal derived syngas) can be conducted in a similar way as
done for Texaco syngas in Sections 4.11.6.1 to 4.11.6.3. Although the results would be
widely different from the Texaco syngas, but trends within the same syngas composition
are expected to be similar as trends in Texaco syngas.
217
5.0 LIFE CYCLE INVENTORY OF METHANOL PRODUCED BY
CONVENTIONAL PROCESS
MSW gasification is a potentially new technology for MSW management.
Gasification is defined as the thermochemical conversion of a solid carbonacious feed to
a combustible gas product (Chen, 1995). The product gas, referred to as synthesis gas or
syngas, is usually rich in hydrogen, H2, carbon monoxide, CO, carbon dioxide, CO2, and
various low-weight hydrocarbons. There has been lot of experience with coal gasification
for the generation of power and chemicals and the technology has been successfully
demonstrated commercially (Cheng and Kung, 1994; Supp 1990). MSW gasification is
similar to coal gasification in a sense that the unit operations involved in its gasification
are similar.
MSW gasification results in generation of synthesis gas (syngas), which is the
main raw material for the production of methanol. Thus we can utilize the syngas
generated from MSW to produce methanol and therefore avoid some conventional
methanol production.
To evaluate the environmental burdens of MSW gasification relative to alternate
MSW management strategies, it is necessary to develop a life cycle inventory (LCI) of
methanol production based on conventional feedstock and production. This will enable us
to take credit for avoided methanol production when methanol is produced from syngas
obtained from MSW gasification.
218
The objective of this chapter is to develop a model for calculation of the LCI of
methanol production based on conventional feedstock (Natural gas). The previous
chapter, Chapter 4, presented the LCI of methanol based on the Liquid Phase Methanol
(LPMEOHTM) technology.
This chapter is divided into 4 sections. Section 5.1 presents an overview of
methanol production by the conventional process in which natural gas is used as a
feedstock in a syngas generator (steam reformer). The major sections of the process are
identified and described. Section 5.2 presents the methodology of performing a LCI. A
spreadsheet model for the LCI of methanol is developed in EXCEL, which consists of
mass and energy balances of the conventional process. The manner in which the model
was assembled is described. Section 5.3 is divided into several subsections. The mass
balance, energy balance, and the LCI calculation documentation of the process are
presented. Section 5.4 presents the sensitivity analysis of the conventional methanol
process.
5.1 Overview of Methanol Production by Conventional Process
An overview of a conventional methanol production process is presented in this
section. The major factors that will affect the LCI of methanol production include the
generation and consumption of steam, consumption of electrical energy, natural gas
production and consumption, purge gas combustion, and fugitive emissions.
219
Methanol is produced from syngas, which consists primarily of H2 and CO.
Generation of syngas is the first step in the production of methanol. Carbonaceous
materials such as coal, coke, natural gas, petroleum, and fractions obtained from
petroleum (asphalt, gasoline, gaseous compounds) can be used as starting materials for
syngas production. Most methanol produced worldwide is derived from natural gas
(Elvers et. al., 1989). The production of methanol using conventional industrial processes
involves the following three steps:
1) Natural gas (mostly methane) is converted to syngas using steam. This process is
known as steam cracking or steam reforming. The syngas produced consists of CO,
H2 and CO2 as its major components. The reactions that occur in a syngas generator
(steam reformer) are:
Reforming reactions
CH4 + H2O → CO + 3H2; ∆hr* = 234.66 kJ/mol (5-1)
C2H6 + 2H2O → 2CO + 5H2; ∆hr* = 131.68 kJ/mol (5-2)
C3H8 + 3H2O → 3CO + 7H2; ∆hr* = 563.64 kJ/mol (5-3)
Shift reaction
CO + H2O → CO2 + H2; ∆hr* = - 34.6 kJ/mol (5-4)
(∆hr* indicates the heat of reaction at typical reformer operating conditions: 2.0 MPa
and 870 oC – Elvers et al., 1989).

220
2) In the second step, water is removed from the syngas and the components (mainly
CO, H2, and CO2) of dry syngas are catalytically reacted to produce methanol. Two
major reactions taking place are:
CO + 2H2 → CH3OH; ∆hro = -90.79 kJ/mol (5-5)
CO2 + 3H2 → CH3OH + H2O; ∆hro = -49.5 kJ/mol (5-6)
A side reaction producing dimethyl ether also occurs to a limited extent
2CO + 4H2 → CH3-O-CH3 + H2O; ∆hr o = -204.94 kJ/mol (5-7)
The water-gas shift reaction (reaction 5-4) also occurs. ∆hr o is the heat of reaction at
standard temperature and pressure (298K and 1 atm; Cheng and Kung, 1994).
3) The methanol is distilled and purified to the desired purity.
The production of methanol can be further divided into a series of steps including
natural gas compression, production of syngas, heat recovery in waste heat boiler
(WHB), removal of water to produce dry syngas, methanol production, methanol
condensation, unreacted gas recycle, and methanol distillation to desired purity. Figure 5-
1 represents the process flow diagram of the process. Each step is described in the
following subsections.

221
Figure 5-1. Simplified Flowsheet for the Production of Methanol by a Conventional Process (e.g., Lurgi Low Pressure Process)
Desulfurized Natural Gas(1 Atm, 25 oC)
Natural GasCompressor
Saturated Steam(20 atm)
Steam Reformer
Waste Heat Boiler
Water knock-out drum
Syngas Compressor
Methanol Reactor(LURGI)
Feed/ProductHeat exchange
Water
Methanol condenserPressure relief valve
Flash Drum (Purge Removal)
Dimethyl-ether (DME) Distillation Column
DME
Methanol (MeOH) Distillation Column
Water Bottoms
99.9 wt% MeOH
Purgegases
Water
Dry syngas
Natural GasAir
Pressure relief valve
1
3
2 3’4
5
6
7
8
9
10
Fugitive Emissions
8’
11
12
1314
15
16
17
18
19
20
21
Condenser Condenser
Reboiler Reboiler
221
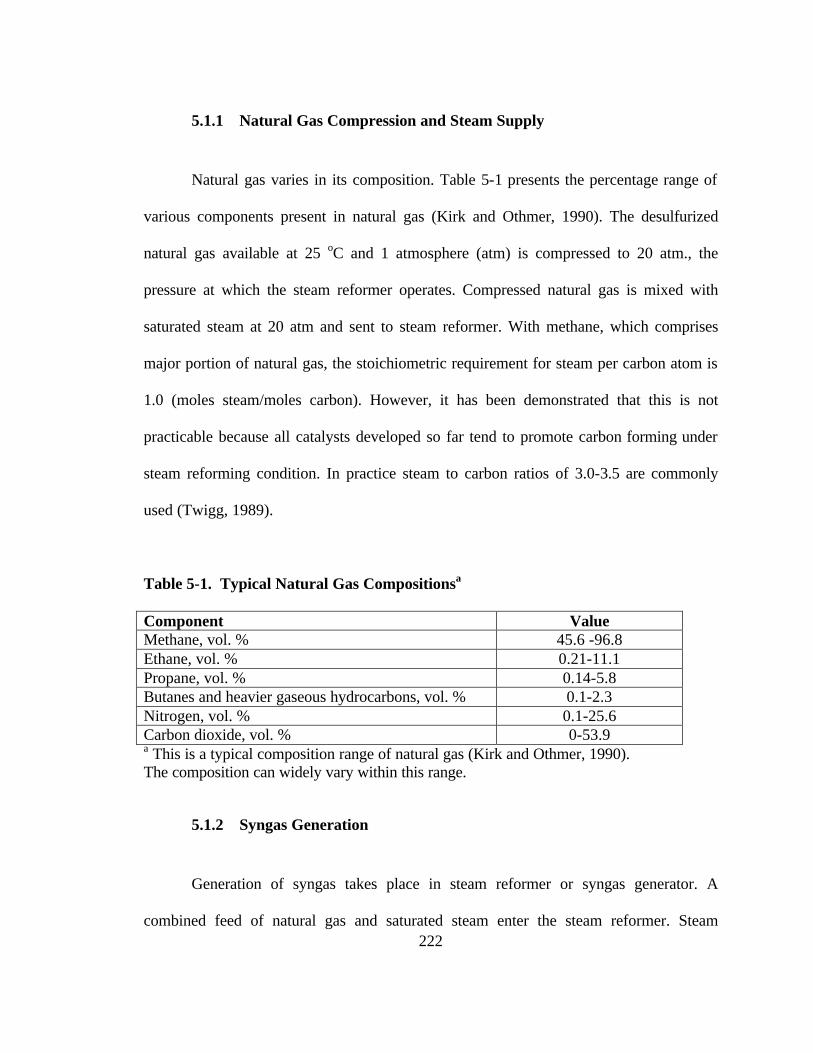
222
5.1.1 Natural Gas Compression and Steam Supply
Natural gas varies in its composition. Table 5-1 presents the percentage range of
various components present in natural gas (Kirk and Othmer, 1990). The desulfurized
natural gas available at 25 oC and 1 atmosphere (atm) is compressed to 20 atm., the
pressure at which the steam reformer operates. Compressed natural gas is mixed with
saturated steam at 20 atm and sent to steam reformer. With methane, which comprises
major portion of natural gas, the stoichiometric requirement for steam per carbon atom is
1.0 (moles steam/moles carbon). However, it has been demonstrated that this is not
practicable because all catalysts developed so far tend to promote carbon forming under
steam reforming condition. In practice steam to carbon ratios of 3.0-3.5 are commonly
used (Twigg, 1989).
Table 5-1. Typical Natural Gas Compositionsa
Component Value Methane, vol. % 45.6 -96.8 Ethane, vol. % 0.21-11.1 Propane, vol. % 0.14-5.8 Butanes and heavier gaseous hydrocarbons, vol. % 0.1-2.3 Nitrogen, vol. % 0.1-25.6 Carbon dioxide, vol. % 0-53.9 a This is a typical composition range of natural gas (Kirk and Othmer, 1990). The composition can widely vary within this range.
5.1.2 Syngas Generation
Generation of syngas takes place in steam reformer or syngas generator. A
combined feed of natural gas and saturated steam enter the steam reformer. Steam
223
reforming reactions are endothermic (equations 5-1 to 5-3) and are favored at high
temperatures. The heat for maintaining this high temperature is supplied by combustion
of purge gases (generated in methanol production process) external to the tubes in which
reactants (natural gas and steam) flow. The heat is also supplied by natural gas
combustion. Typical operating pressure and temperature in steam reformer tubes are 20
atm and 880 oC (Twigg, 1989). Typically 80 to 95 percent of CH4 is converted to CO and
H2. All C2H6 and C3H8 are reformed to CO and H2 (US patent 4,407,973). The water-gas
shift reaction (reaction 5-4) also occurs in the steam reformer. Hot product gases
comprising of H2, CO, CO2, unconverted CH4, N2 and water vapor leave the steam
reformer at 20 atm and 880 oC.
5.1.3 Waste Heat Boiler (WHB)
The exit gases from the syngas generator are at a temperature of 880 oC and enter
the waste heat boiler (WHB) for the recovery of excess process heat. In addition to heat
recovery, the gases need to be cooled in order to condense the water for its removal from
the syngas. Typically, the hot gases are cooled to 110 oC (Dry, 1988). Saturated steam is
generated as a result of process heat exchange. Water vapor in the syngas condenses in
this process section as a result of heat exchange. The cooled syngas enters the water
knockout drum.
224
5.1.4 Water Removal and Knock-out Drum
In water knockout drum, the condensed water and trace solid impurities (carbon
particles) produced in the steam reformer are removed to produce clean dry syngas. The
exit syngas from this section consists of H2, CO, CO2, CH4, and N2. One half percent loss
of syngas as fugitive emission is estimated to occur in this process section (Overcash,
1999).
5.1.5 Syngas Compressor
Clean and dried syngas from the water knockout drum enters the syngas
compressor. The syngas is compressed to an exit pressure of 50 atm, which is a typical
operating pressure for a low-pressure methanol reactor (Cheng and Kung, 1994).
5.1.6 Methanol Reactor
In the methanol reactor CO, CO2 and H2 are catalytically converted to methanol
and dimethyl ether in accordance with Equations (5-5), (5-6) and (5-7). The reactions
taking place in the methanol reactor are all exothermic and heat must be removed to
maintain an optimum reaction temperature in the reactor. Typical operating conditions in
methanol reactor are 50 atm. and 260 oC (Cheng and Kung, 1994; Lurgi Corp., 1979; ICI
Ltd., 1979; Supp 1973). The catalyst used consists of copper oxide, zinc oxide and
alumina in varying proportions. At higher temperatures, the catalyst gets deactivated and
the potential for side reactions to produce undesirable products increases.
225
Various reactor configurations are available for the synthesis of methanol. ICI
quench bed reactors and Lurgi tubular reactors are the most widely used reactors for
methanol synthesis (Elvers et. al., 1989). The ICI design employs cold syngas injections
at various catalyst beds to maintain the temperature in the reactor around 260 oC. Lurgi
design employs a tubular reactor in which high-pressure steam (40 atm) is generated on
the shell side of the reactor (Cheng and Kung, 1994). By controlling the pressure of
steam generated on the shell side, it is possible to control the temperature in the tubes of
the reactor and maintain it in the vicinity of 260 oC.
CO conversion is dependent on the temperature and pressure inside the reactor,
the H2 to CO ratio, gas space velocity, catalyst composition, and CO2 content. Since CO
and CO2 conversion to methanol is normally only 40 to 60 percent complete per pass,
economics usually dictate that excess unreacted gas be recycled. The common recycle
ratio (recycle to fresh feed) ranges from 3 to 8 moles recycle gas per moles fresh feed
(US patent 3,920,717; Dry, 1988). Overall conversion of the carbon content in syngas to
methanol is typically 95 percent (US patent 4,407,973) and may be as high as 99.5
percent (Cheng and Kung, 1994).
The Lurgi low-pressure reactor is assumed to be a typical representative
technology for methanol synthesis primarily because it is more commonly used that ICI
methanol reactor in the process industry in U.S. In Lurgi methanol reactor, a high-
pressure steam at 40 atm is generated from the enthalpy of reactions taking place (Cheng
226
and Kung, 1994). 95 percent of carbon in syngas (CO and CO2) conversion to methanol
takes place (US patent 4,407,973) and CH4 does not react under the reaction conditions
since the catalyst is highly selective to CO and CO2 for methanol synthesis. The amount
of Dimethyl ether (DME) produced is 2 percent of the weight of methanol produced (US
patent 3,920,717). The actual reactor in the process has a recycle stream mixing with the
fresh syngas feed in a ratio ranging from 3 to 8 (moles recycle gas/moles fresh feed) to
achieve the overall conversion of 95 percent for both CO and CO2. No recycle stream is
shown in Figure 5-1 since the reactor is modeled to achieve 95 percent conversion of CO
and CO2 to methanol in a single pass. Unreacted gases are taken out as purge after the
methanol condenser described in section 5.1.1.8. They have the same flowrate and
composition as the purge from the actual process (compared with US patent 4,407,973).
This simplification does not affect the steam generation on shell-side in the reactor and
therefore the LCI parameters associated with it are not affected. Product gas from the
methanol reactor consists of CH3OH, H2O, CO, CO2, DME, N2 and CH4.
5.1.7 Syngas Feed/Methanol Product Heat Exchanger (Feed-Preheater)
The product gases from the methanol reactor leave at 260 oC. The enthalpy
carried by this stream can be utilized to preheat the syngas from the syngas compressor to
250 oC, typically, before sending it to the methanol reactor (Chen, 1995). The cooled
product gases are then sent to the methanol condenser. The exit temperature of the
product gas depends on the inlet temperature of fresh feed and can be evaluated by
simple energy balance.
227
5.1.8 Methanol Condenser
The cooled product gas from the feed/product heat exchanger enters a series of
methanol condensers. Cooling water at 20 oC is used to cool the product gas for methanol
condensation. The exit temperature of water is set at 50 oC (Overcash, 1999). The
saturation temperature of methanol at 50 atm is 45 oC; therefore, the product gas is cooled
to 45 oC to condense all methanol, DME, and water present. Unreacted H2, CO, CO2, CH4
and N2 do not condense at this temperature and remain in gas phase.
5.1.9 Pre-Flash Drum Pressure Relief Valve
The exit stream from the methanol condenser is a two-phase mixture with
methanol, DME and water in the liquid phase. The pressure of this stream is 50 atm,
assuming that there is no pressure drop in feed/product heat exchanger and methanol
condenser. The pressure is reduced using a pressure relief valve so that liquid and gas
phase separation can take place in flash drum. For DME distillation to occur in the DME
distillation column, the pressure should be reduced to 11.2 atm (US patent 3,920,717).
The exit stream from pressure relief valve has a pressure of 11.2 atm.
5.1.10 Flash Drum for Removal of Uncondensed Gases
The next step in methanol production is vapor-liquid phase separation. The
gaseous phase comprised of unreacted CO, CO2, H2, CH4, N2 is removed as a purge at the

228
top of the flash drum and sent to a steam reformer furnace for combustion (thermal
oxidation) to supply the heat required for the steam reforming process. The liquid phase,
comprised of methanol, DME and water, is taken out at the bottom of the flash drum. The
liquid stream at 11.2 atm and 45 oC is then sent to a DME distillation column.
5.1.11 DME Distillation
Dimethyl ether can be separated from crude methanol by extractive distillation.
Extractive distillation is a process in which a third component is added to alter the
relative volatility of a binary mixture which is difficult to separate so that distillation can
proceed with ease. The extractive distillation of DME involves addition of with water in a
15 to 45 tray column at approximately 11.2 atm pressure and a reflux ratio of 20 (moles
recycle liquid/moles distillate) (US patent 3,920,717). In this column, almost complete
recovery of DME is accomplished as a top product, while methanol and water leave as
bottoms. DME recovered has various uses including as an aerosol and as a diesel
additive. Since the amount of DME produced is very small, it is not considered in the LCI
of methanol.
5.1.12 Pre-Methanol Distillation Pressure Relief Valve
Liquid bottoms from the DME distillation column at 11.2 atm enter the pressure
relief valve, where the pressure is reduce to 3.4 atm, which is the pressure at which
229
distillation of methanol in the methanol distillation column takes place (US patent
3,920,717).
5.1.13 Methanol Distillation
Feed entering the methanol distillation column consists of methanol and water at
3.4 atm and 45 oC. Methanol distillation takes place in a 45 to 75 tray distillation column
at a pressure of 3.4 atm and a reflux ratio of 1.5 (moles recycle liquid/moles distillate)
(US patent 3,920,717). The boiling point of methanol at 3.4 atm is approximately 90 oC.
Methanol recovery of 99.9 percent takes place in the top product with 99.9 percent purity
by weight (US patent 3,920,717). Water leaves as bottoms with a trace amount of
methanol and is sent to a wastewater treatment facility.
5.2 Overview of LCI Model
The LCI of methanol based upon a conventional process is comprised of:
1) The mass and energy balance of the process;
2) Calculation of the amount of energy used in the process and in what form (e.g.,
steam, electricity);
3) The emissions associated with the methanol production process (e.g., fugitive
emissions, purge emissions);
4) The emissions associated with the form of energy usage in the process (e.g., steam,
electricity); and
230
5) LCI parameters associated with the production and consumption of raw material for
the process (e.g., pre-combustion emissions for natural gas).
The information required for the LCI of methanol production includes the amount
of raw materials used in the process, process utilities required, energy used or generated
in the process, emissions and wastes produced, the emissions produced in production of
the inputs to the process. Thus, a mass and energy balance of the entire process is
required.
Mass and energy balances of the process are performed in MS EXCEL. MS
EXCEL is a spreadsheet-based model in which various cells are defined to represent the
inputs used in the process. Inputs such as feed composition, flow rates, reaction
conversion, removal efficiency, efficiency of operation, percentage losses, and others, are
set up such that they can be altered by a user to create alternate scenarios. Such flexibility
in altering the input parameters will permit the user to perform sensitivity analysis of
parameters involved in the process. The details of the process conditions and assumptions
made in performing the mass and energy balance are discussed in sections 5.3.1 and
5.3.2.
The EXCEL spreadsheet model consists of various sub-sheets called “sub-
models” linked together to calculate the LCI of methanol production. The entire
spreadsheet model, as presented in Figure 5-2, consists of following sub-models:
231
5.2.1 Mass Balance Sub-Model
The mass balance sub-model contains quantitative information on mass flow rates
of raw materials, intermediate streams, utility streams and product streams. It is linked to
the energy balance sub-model (described next) to represent the process as a whole.
5.2.2 Energy Balance Sub-Model
The energy balance sub-model presents an energy balance across all the
components of the process. It contains quantitative information on temperatures,
pressures, enthalpy flow rates of process streams, and energy generation and
consumption in process units. The energy balance sub-model is linked to the mass
balance sub-model to represent the complete process.
5.2.3 Physical Property Sub-Model
The physical property sub-model contains the values of physical properties and
constants that are used repetitively in energy balance calculations. It is linked with energy
balance sub-model wherever required. It consists of heat capacity constants, Antoine’s
equation constants, specific heat capacities of liquids, and heats of vaporizations. Table
5-2 presents the values of these constants.
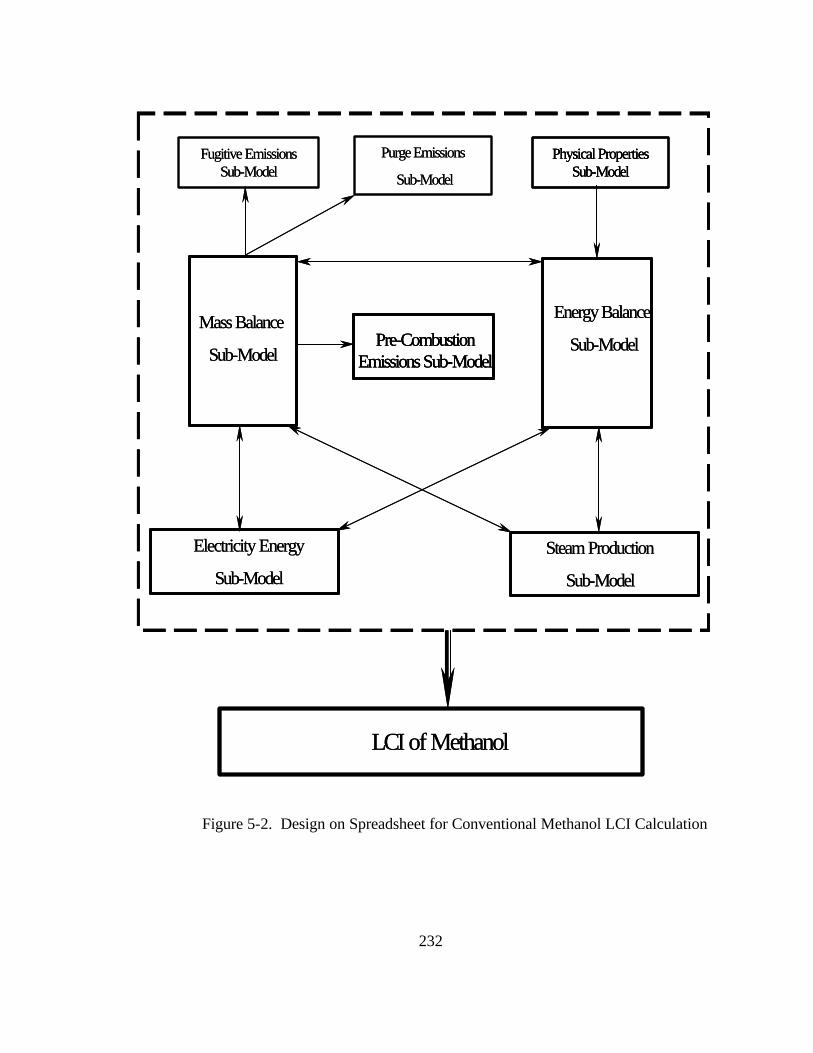
232
Figure 5-2. Design on Spreadsheet for Conventional Methanol LCI Calculation
Steam Production
Sub-Model
Energy Balance
Sub-Model
Electricity Energy
Sub-Model
Mass Balance
Sub-ModelPre-Combustion
Emissions Sub-Model
LCI of Methanol
Physical Properties Sub-Model
Purge Emissions
Sub-Model
Fugitive Emissions Sub-Model
Steam Production
Sub-Model
Energy Balance
Sub-Model
Electricity Energy
Sub-Model
Mass Balance
Sub-ModelPre-Combustion
Emissions Sub-ModelPre-Combustion
Emissions Sub-Model
LCI of Methanol
Physical Properties Sub-Model
Physical Properties Sub-Model
Purge Emissions
Sub-Model
Fugitive Emissions Sub-Model

233
Table 5-2. Physical Properties of Compounds used in Physical Property Sub-Model
(a) Heat Capacity Constants in equation, Cpi/R = Ai + BiT + CiT2 + Di/T
2, R = 8.314 J/mol-K (Felder and Rousseau, 1986)
Compound Ai Bi Ci Di
CH4 1.702E+00 9.081E-03 -2.16E-06 0 C2H6 1.131E+00 1.92E-02 -5.56E-06 0 C3H8 1.213E+00 2.88E-02 -8.82E-06 0
N2 3.28E+00 5.93E-04 0 4.00E+03 H2 3.249E+00 4.22E-04 0 8.3E+03 CO 3.376E+00 5.57E-04 0 -3.10E+03
CO2 5.457E+00 1.05E-03 0 -1.16E+05 H2O 3.47E+00 1.45E-03 0 1.21E+04
DMEb 2.0465E+00 2.15E-02 -6.29E-06 -2.31E-10 CH3OH 2.211E+00 1.22E-02 -3.45E-06 0.00E+00
b(Perry and Green, 1997)
(b) Specific Heat Capacity of Liquids (CpLiquid, in J/mol-K)c
Compound CpLiquid
CH3OH 82.59 H2O 75.4
c(Felder and Rousseau, 1986)
(c) Antoine’s Equation Constantsc in equationd, Ln (P) = Ao – Bo/(T+Co) (where, P = partial pressure in mm Hg, and T = temperature in K)
Compound Ao Bo Co H2O 7.966 1668.21 228
CH3OH 7.878 1473.11 230 DME 16.846 2361.44 -17.1
d(Sinnott, 1996)
(d) Heat of Vaporizations (Hv)e
Compound Tboiling (K) (Hv)o, kJ/molf
H20 373 40.657 DME 248 27.032
CH3OH 338 36.842 e(Perry and Green, 1997) f(Hv)
o = Standard heat of vaporization (at 298K and 1 atm).
234
5.2.4 Purge Emissions Sub-Model
The purge emissions sub-model consists of mass flow rates of the purge streams
generated in the process. Since the purge stream is combusted in the steam reformer
furnace to supply the heat for steam reforming of natural gas, this sheet also calculates
the balance fuel (natural gas) required to be burned in the steam reformer furnace to
maintain steam reforming conditions (20 atm, 880 oC). Emissions due to combustion of
fuel (natural gas) and unconverted purge gas (one percent of total) described in section
5.3.3.4 are also calculated in this sub-model.
5.2.5 Fugitive Emissions Sub-Model
The fugitive emissions sub-model consists of fugitive emissions obtained from the
mass balance sub-model to be included in the overall LCI of methanol. It calculates the
loss of chemicals from the water knockout drum in the methanol production process.
5.2.6 LCI of Steam Sub-Model
The LCI of steam developed in Chapter 2 is directly used in this sub-model. It
consists of quantitative information on the total energy of steam consumed or produced in
various process sections of methanol production. The process section where steam is
produced is assigned a negative sign indicating that energy is recovered. The process
section where steam is consumed is assigned positive sign indicating that energy is
235
consumed. All these energies are summed together to calculate the net steam energy
consumed or produced. This sub-model then calculates the emissions associated with
steam generation or consumption using the LCI of steam imported from Chapter 2.
5.2.7 LCI of Electricity Sub-Model
The LCI of electricity sub-model provides an accounting of the total energy
consumed in the form of electricity in the process. This sub-model is linked to the total
energy consumed in two compressors (natural gas compressor and syngas compressor) as
calculated in energy balance sub-model. The LCI of electricity as presented in Chapter 3
is directly imported into this sub-model to calculate the total emissions due to
consumption of electricity in the process.
5.2.8 Pre-Combustion Sub-Model
The pre-combustion sub-model presents the pre-combustion emissions associated
with the raw material, specifically natural gas, used in the methanol production process.
Pre-combustion emissions for natural gas were obtained from an electric energy process
model (Dumas, 1998).

236
5.2.9 Overall LCI of Methanol Model
The overall LCI of methanol model calculates overall LCI of methanol production
using the Lurgi process. The results of all sub-models are imported into the overall LCI
of methanol model where they are divided by the quantity of methanol produced to
calculate the LCI parameters per kg of methanol produced.
The following section presents the manner in which the overall LCI of methanol
was developed. It describes the mass and energy balance calculations and the
assumptions made therein. It also presents the equations coded in the EXCEL
spreadsheet.
5.3 LCI of Methanol Production
The LCI of methanol is developed by performing a mass and energy balance across
the entire methanol production process. The mass balance includes all mass streams
entering and leaving the process. The energy balance evaluates the amount of energy
associated with each stream and the energy supplied to the process in the form of
electricity, steam, and heat. Results from both the mass balance and energy balance are
used to calculate the LCI parameters of the entire process.
The following sub-section presents documentation of the mass balance across the
entire process. Mass balance calculations and all other calculations described were
237
implemented in an EXCEL spreadsheet. Section 5.3.2 describes the energy balance and
section 5.3.3 presents the methodology for calculation of the LCI associated with
production of conventional methanol.
5.3.1 Mass Balance across the Conventional Methanol Process
This section documents the mass balance across each process section including all
assumptions and relevant equations. One thousand kmol/hr of desulfurized natural gas is
assumed as a starting raw material for methanol production. US patents 4,407,973 and
4,443,560 present the mass balance for conventional process of methanol production
starting with 3865 lbmoles/hr and 6957 lbmoles/hr of desulfurized natural gas,
respectively. Both of these patents result in same mass balance per kmol of natural gas
used so either of them can be used to represent the mass balance of the conventional
process. The mass balance presented in this section has been scaled down, with a scale
down factor of 3.865, from the mass balance of conventional methanol production as
presented in US patent 4,407,973.
5.3.1.1 Natural Gas Compressor
Desulfurized natural gas at 1 atm and 25 oC is sent to natural gas compressor to
achieve the outlet pressure of 20 atm. The compressor is assumed to operate
isentropically for simplicity (Overcash, 1999). This is the pressure at which the steam
reformer operates. Since the composition of natural gas used is not presented in US
patent 4,407,973, it is calculated by trial and error based on reforming reactions taking
238
place in the syngas generator (steam reformer), using a simple mass balance involving
reactions 5-1, 5-2, 5-3 and 5-4. The method used in calculating the composition is
described in Appendix A. The composition of natural gas thus determined is 90.6 percent
CH4, 7 percent C2H6, 2.1 percent C3H8, 0.17 percent N2 and 0.13 percent CO2, on mole
basis. The percentage of each component is within the range of the typical compositions
presented in Table 5-1. Since there is no reaction occurring in the compressor, the mole
flow rate and composition of natural gas remain the same. Electric power consumed is
calculated in Section 5.3.2.1.
5.3.1.2 Synthesis Gas Generator
Natural gas with the above-mentioned composition at 20 atm is mixed with
saturated steam at 20 atm at a steam to natural gas ratio of 3.681 kmol H2O/kmol natural
gas (US patent 4,407,973) before entering the syngas generator. Steam reforming
reactions (5-1), (5-2), and (5-3) take place at 20 atm. and 880 oC (Twigg, 1989). C2H6 and
C3H8 are completely reformed to produce CO and H2, while 81.46 percent of the CH4 is
reformed to produce CO and H2, as calculated from mass balance presented in US patent
4,407,973. A water-gas shift reaction also occurs in the syngas generator producing CO2.
The CO conversion to produce CO2 in reaction 5-4 was estimated to be 40.2 percent
based upon US patent 4,407,973. The percentage conversions of reactants are specified as
user inputs in the spreadsheet to provide the user with the flexibility to change these
values in case the reaction conditions change and the default values are based on the
information in US patent 4,407,973. The flow rates of products leaving the syngas

239
generator can be calculated by the following equations. Flowrates of all the components
are in kgmol/hr (kmol/hr).
5,5, 4
4
4 1001 CH
CHCH mxm
−=
φ (5-8)
'83
83'
62
62'
4
4
2 3,3,3,5, 1007
1005
1003
HC
HC
HC
HC
CH
CH
H mmmm
+
+
=
φφφ (5-9)
−
+
+
=
1001
1003
1002
100'
83
83'
62
62'
4
4
3,3,3,5,CO
HC
HC
HC
HC
CH
CH
CO mmmmφφφφ
(5-10)
+
+
+=
1001003
1002
100'
83
83'
62
62'
4
4'
22 3,3,3,3,5,CO
HC
HC
HC
HC
CH
CH
COCO mmmmmφφφφ
(5-11)
+
+
+
−= 5,3,3,3,3,5, 2
'83
83'
62
62'
4
4'
22 1003
1002
100 COHC
HC
HC
HC
CH
CH
OHOH mmmmmmφφφ
(5-12)
Where: φi = percentage conversion of component ‘i’ (CH4, C2H6, C3H6, and CO)
Number subscript = stream number as identified in Figure 5-1.
mi,j = molar flowrate of the component ‘i’, kmol/hr in stream j. (Applies
throughout the mass balance)
The flowrates of C2H6 and C3H8 have been defined by equations similar to
Equation (5-8). Since N2 is inert, its flowrate is the same at the inlet and outlet of the

240
syngas generator. The flowrate of fuel (natural gas) used in the syngas generator furnace
to supply the heat for reforming reactions has been calculated with the energy balance.
The product gases from syngas generator leave at 20 atm and 880 oC.
5.3.1.3 Waste Heat Boiler
The products from the syngas generator are sent to waste heat boiler (WHB) for
recovery of excess process heat. The syngas is cooled to 110oC but no change in mole
flow rate of any component occurs.
5,6, ii mm = (5-13)
where, i = represents all the components present in syngas (CH4, N2, CO2, CO, H2, and
H2O).
5.3.1.4 Water Removal and Knock-out Drum
Since the syngas is cooled to 110 oC, which is 55 oC below the dew point of water
in syngas at 20 atm., complete condensation of water takes place. The condensed water is
removed from the syngas to produce dry syngas. Also, a small amount of carbon particles
produced in syngas generator due to coking are removed with the water. It is assumed
that a 0.5 percent loss of syngas as fugitive emission takes place in this section
(Overcash, 1999). Hence, the molar flowrates of gaseous components leaving the section
are 0.995 times of that entering the section. Since all the water is in liquid state, no loss of
water takes place as fugitive emissions.

241
6,8, 995.0 ii mm = (5-14)
6,8,005.0' ii
mm = (Fugitive Emissions) (5-15)
where, i = CH4, C2H6, C3H8, N2, H2, CO, and CO2
7,6, 22 OHOH mm = (5-16)
5.3.1.5 Syngas Compressor
After leaving the water knockout drum, dry syngas enters the syngas compressor
where it is compressed to 50 atm, the pressure at which the methanol synthesis reactor
operates. For simplicity, it is assumed that the compressor operates isentropically
(Overcash, 1999). No reaction takes place in syngas compressor so the flowrate of
components in is equal to their exit flowrate.
8,9, ii mm = (5-17)
where, i = CH4, C2H6, C3H8, N2, H2, CO, and CO2
5.3.1.6 Syngas Feed/Product Heat Exchanger (Feed Preheater)
Before sending the syngas to the methanol reactor, it is passed through a
feed/product heat exchanger, where the hot product gases from the methanol reactor
exchange heat with the syngas feed thereby heating them close to the temperature in the
methanol reactor (260oC). The syngas feed is heated to a temperature of 250 oC (Chen,
1995). No reaction takes place in this process section and therefore the flowrates of
components going in is equal to their flowrate out.
242
9,10, ii mm = (5-18)
where, i = CH4, C2H6, C3H8, N2, H2, CO, and CO2
5.3.1.7 Methanol Reactor
Feed syngas enters methanol reactor at 250 oC and 50 atm. The Lurgi tubular
reactor operates at 260 oC and 50 atm. (Cheng and Kung, 1994; Lurgi Corp., 1979; Supp,
1973). Reactions 5-5, 5-6 and 5-7 take place in the reactor and since all of them are
exothermic reactions, heat removal from the reactor is a critical issue.
In the Lurgi tubular reactor design, a high-pressure steam at 40 atm is generated
from boiler feed water on the shell side while the exothermic reaction takes place in
tubeside filled with catalyst (Cheng and Kung, 1994). The main component of the Lurgi
methanol catalyst is copper. As with all copper catalysts, this one tends to recrystallize
and deactivate at a temperature above 270 oC (Supp, 1981). Use of catalyst filled tubes in
the Lurgi methanol reactor system ensures an extremely quick transfer of the reaction
heat from the catalyst to a cooling medium (Meyers, 1984). Per pass conversion in the
methanol reactor ranges from 40 to 60 percent of CO and CO2. To increase the
conversion, the unreacted gases after methanol condensation are recycled back to the
reactor with a result that above 95 and up to 99.5 percent overall conversion can be
achieved (Meyers, 1984).

243
For simplicity, an overall conversion of 95 percent of CO and CO2 to methanol
(US patent 4,407,973 and 4,443,560) is specified as a default for the reactor and no
recycle stream is considered since the primary purpose of recycle stream is to increase the
conversion as compared to single pass reactor. This simplification is not expected to alter
the overall LCI of methanol (Overcash, 1999). A third reaction in methanol reactor,
reaction 7, is considered which produces DME equal to 2 percent by weight of the
methanol produced in the reactor (US patent 3,920,717). Unreacted gases are removed
from process as a purge. Conversions of CO and CO2 are user-specified parameters as
defined in EXCEL. The amount of DME produced is based upon a percentage of
methanol produced and is also a user-specified parameter with a default value of 2
percent (US patent 3,920,717). CH4 is inert under methanol synthesis conditions and so is
N2. The outlet flowrates of various components from methanol reactor are calculated by
following equations.
10,11, 2
2
2 1001 CO
CO
CO mm
−=
φ (5-19)
10,10,11, 100100 2
2
3 COCO
CO
CO
OHCH mmm
+
=
φφ (5-20)
=
100
__%
_
_ 3311,11,
3
DMEOHCHWt
DMEMW
OHCHMWmm
OHCHDME (5-21)
)(2100
1 11,10,11, DMECOCO
CO mmm −
−=
φ (5-22)
)(4100
3100
2 11,10,10,10,11, 2
2
22 DMECO
CO
COCO
HH mmmmm −
−
−=
φφ (5-23)
244
10,11,11, 2
2
2 100 CO
CO
DMEOH mmm
+=
φ (5-24)
10,11, 44 CHCH mm = (5-25)
10,11, 22 NN mm = (5-26)
where: φi = percent conversion of “i” to methanol (i = CO, CO2)
MW = Molecular weight (CH3OH = 32; DME = 46)
Wt%_CH3OH_DME = Wt. Of DME produced as user-defined percentage of
methanol production
Product gases from methanol reactor are passed through feed/product heat
exchanger. No reaction occurs in heat exchanger and therefore the flowrates in and out of
the heat exchanger remains the same.
11,12, ii mm = (5-27)
where: i = CH4, N2, H2, CO, CO2, H2O, CH3OH, and DME
5.3.1.8 Methanol Condenser
In methanol condenser, syngas from the feed/product heat exchanger is cooled to
45 oC (Overcash, 1999). CH3OH, DME and H2O condense out of the product gases. It is
assumed that complete condensation of these components takes place. Other components
entering the condenser leave as gases. Cooling water at 20oC is used for condensing
methanol. The exit temperature of water is limited to 50 oC (Overcash, 1999). No

245
reaction takes place in this process section and therefore the flowrates of component in
and out remain the same.
13,14, ii mm = (5-28)
where: i = CH4, N2, H2, CO, CO2, H2O, CH3OH, and DME
5.3.1.9 Pre-Flash Drum Pressure Relief Valve
In pre-flash drum pressure relief valve, the pressure of the outlet stream from the
condenser is reduced from 50 atm to 11.2 atm for the removal of uncondensed gases in a
flash drum to follow (US patent 3,920,717). Since no reaction occurs in this process
section, the flowrate of components in and out remains the same.
13,14, ii mm = (5-29)
where: i = CH4, N2, H2, CO, CO2, H2O, CH3OH, DME
5.3.1.10 Flash Drum for Removal of Uncondensed Gases
Uncondensed gases CH4, N2, unreacted CO, unreacted CO2 and unreacted H2 are
removed in a flash drum at the top as a purge. This purge is sent for combustion in steam
reformer furnace to generate the heat required for steam reforming reactions. The liquid
fraction is taken out at bottom and consists of CH3OH, DME and H2O. The following
equations represent the mass balance across this section
14,15, ii mm = (5-30)
246
14,16, jj mm = (5-31)
where: i = CH4, N2, H2, CO, and CO2
j = CH3OH, DME, and H2O
5.3.1.11 DME Distillation Column
DME is distilled by extractive distillation with water. Since water is already
present in the mixture to be separated and the feed to the distillation column is at the
boiling point of DME (45oC) at 11.2 atm, it is assumed that complete recovery of DME
takes place in the top product. Water and methanol are assumed to leave as bottoms of
DME distillation column at 45oC for simplicity (Overcash, 1999). The steam used in the
reboiler section of distillation column is assumed to be saturated steam at 100 psia. This
column operates at 11.2 atm and 45 oC (Overcash, 1999). The column operates with a
reflux ratio of 20 (moles recycle/moles distillate). The following equations represent the
mass balance across this process section.
16,17, DMEDME mm = (5-32)
16,18, jj mm = (5-33)
where: j = CH3OH and H2O

247
5.3.1.12 Pre-Methanol Distillation Pressure Relief Valve
The bottom exit from the DME distillation column consists of CH3OH and H2O at
11.2 atm and 45 oC. This process section reduces the pressure from 11.2 atm to 3.4 atm,
the pressure at which methanol distillation occurs (US patent 3,920,717). No reaction
takes place in this process section so the flowrate of the components remains the same.
18,19, jj mm = (5-34)
where: j = CH3OH and H2O
5.3.1.13 Methanol Distillation Column
The exit stream from pre-methanol distillation column valve enters methanol
distillation column at 45oC and 3.4 atm. The column operates at a pressure of 3.4 atm.
and a reflux ratio of 1.5 (US patent 3,920,717). It is assumed that 99.9 percent recovery
of methanol in top product takes place producing 99.9 percent pure methanol on weight
basis. Water with a trace quantity of methanol is recovered at the bottom and sent to
wastewater treatment facility. Following equation present the mass balance across the
methanol distillation column.
)(999.0 19,20, 33 OHCHOHCH mm = (5-35)
=
%__
100)( 20,20, 32 moleinPurityMethanol
mm OHCHOH (5-36)
20,19,21, 333 OHCHOHCHOHCH mmm −= (5-37)

248
20,19,21, 222 OHOHOH mmm −= (5-38)
where: Number subscript = stream numbers as identified in process flow diagram (PFD).
Table 5-3 presents the default values of the process variables used in the process.
Table 5-4 presents the mass balance for the conventional methanol production process
based on the default values. It shows the temperatures, pressures and flowrates of
components in various steams of the process.
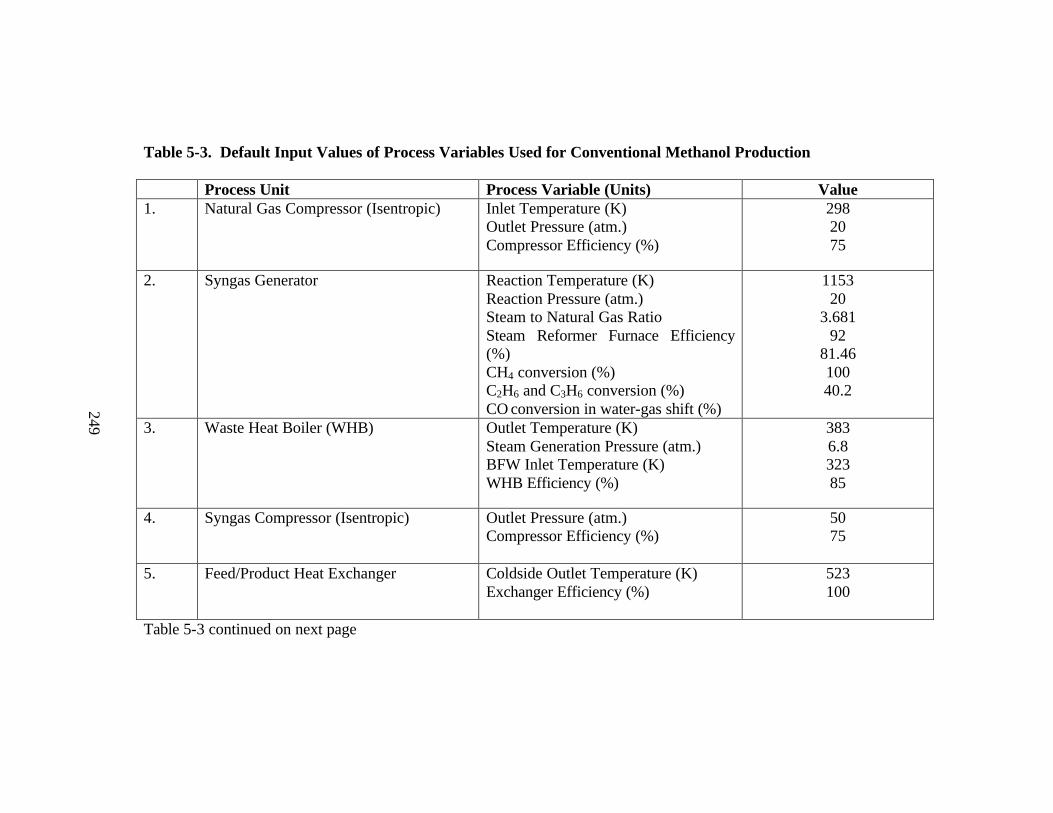
249
Table 5-3. Default Input Values of Process Variables Used for Conventional Methanol Production
Process Unit Process Variable (Units) Value 1. Natural Gas Compressor (Isentropic) Inlet Temperature (K)
Outlet Pressure (atm.) Compressor Efficiency (%)
298 20 75
2. Syngas Generator Reaction Temperature (K) Reaction Pressure (atm.) Steam to Natural Gas Ratio Steam Reformer Furnace Efficiency (%) CH4 conversion (%) C2H6 and C3H6 conversion (%) CO conversion in water-gas shift (%)
1153 20
3.681 92
81.46 100 40.2
3. Waste Heat Boiler (WHB) Outlet Temperature (K) Steam Generation Pressure (atm.) BFW Inlet Temperature (K) WHB Efficiency (%)
383 6.8 323 85
4. Syngas Compressor (Isentropic) Outlet Pressure (atm.) Compressor Efficiency (%)
50 75
5. Feed/Product Heat Exchanger Coldside Outlet Temperature (K) Exchanger Efficiency (%)
523 100
Table 5-3 continued on next page
249

250
Table 5-3 continued
Process Unit Process Variable (Units) Value 6. Methanol Reactor Reactor Temperature (K)
Reactor Pressure (atm.) Steam Generation Pressure (atm.) Reactor Steam Boiler Efficiency (%) CO and CO2 conversion (%) DME Production (% of methanol production)
533 50 40 85 95 2
7. Condenser Outlet temperature (K) Condenser Efficiency (%)
318 85
8. Pre-Flash Drum Pressure Relief Valve Outlet Pressure (atm.) 11.2 9. DME Distillation Column Operating Pressure (atm.)
Feed Temperature (K) Reflux Ratio Steam Pressure Used in Reboiler (atm.)
11.2 318 20 6.8
10. Pre-Methanol Distillation Pressure Relief Valve
Outlet Pressure (atm.) 3.4
11. Methanol Distillation Column Operating Pressure (atm.) Feed Temperature (K) Reflux Ratio Steam Pressure Used in Reboiler (atm.)
3.4 318 1.5 6.8
250
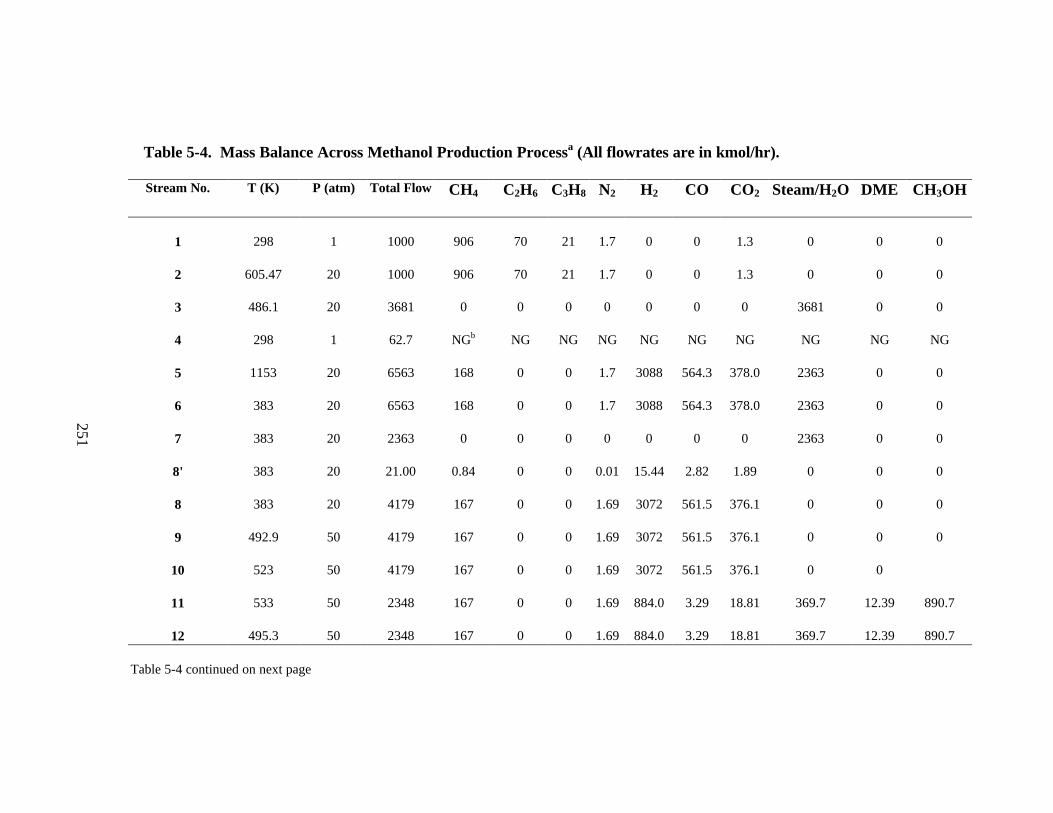
251
Table 5-4. Mass Balance Across Methanol Production Processa (All flowrates are in kmol/hr). Stream No. T (K) P (atm) Total Flow CH4 C2H6 C3H8 N2 H2 CO CO2 Steam/H2O DME CH3OH
1 298 1 1000 906 70 21 1.7 0 0 1.3 0 0 0 2 605.47 20 1000 906 70 21 1.7 0 0 1.3 0 0 0 3 486.1 20 3681 0 0 0 0 0 0 0 3681 0 0 4 298 1 62.7 NGb NG NG NG NG NG NG NG NG NG 5 1153 20 6563 168 0 0 1.7 3088 564.3 378.0 2363 0 0 6 383 20 6563 168 0 0 1.7 3088 564.3 378.0 2363 0 0 7 383 20 2363 0 0 0 0 0 0 0 2363 0 0
8' 383 20 21.00 0.84 0 0 0.01 15.44 2.82 1.89 0 0 0 8 383 20 4179 167 0 0 1.69 3072 561.5 376.1 0 0 0 9 492.9 50 4179 167 0 0 1.69 3072 561.5 376.1 0 0 0
10 523 50 4179 167 0 0 1.69 3072 561.5 376.1 0 0
11 533 50 2348 167 0 0 1.69 884.0 3.29 18.81 369.7 12.39 890.7
12 495.3 50 2348 167 0 0 1.69 884.0 3.29 18.81 369.7 12.39 890.7 Table 5-4 continued on next page
251
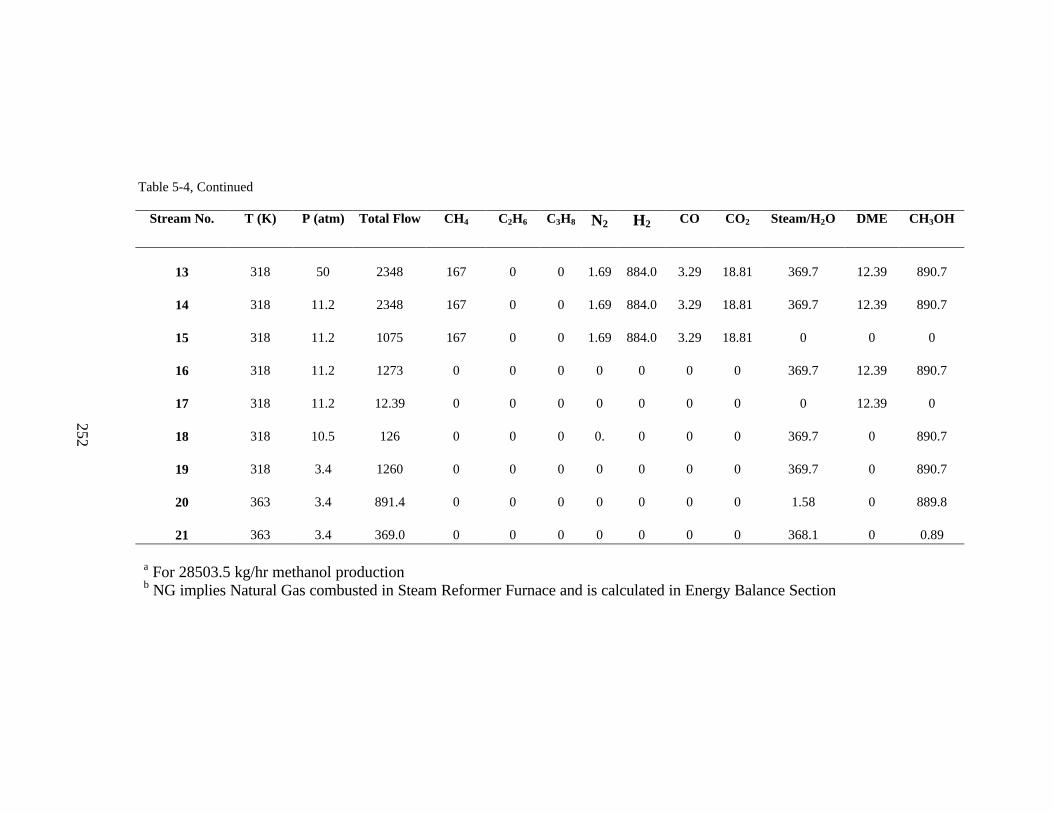
252
Table 5-4, Continued
Stream No. T (K) P (atm) Total Flow CH4 C2H6 C3H8 N2 H2 CO CO2 Steam/H2O DME CH3OH
13 318 50 2348 167 0 0 1.69 884.0 3.29 18.81 369.7 12.39 890.7
14 318 11.2 2348 167 0 0 1.69 884.0 3.29 18.81 369.7 12.39 890.7
15 318 11.2 1075 167 0 0 1.69 884.0 3.29 18.81 0 0 0
16 318 11.2 1273 0 0 0 0 0 0 0 369.7 12.39 890.7
17 318 11.2 12.39 0 0 0 0 0 0 0 0 12.39 0
18 318 10.5 126 0 0 0 0. 0 0 0 369.7 0 890.7
19 318 3.4 1260 0 0 0 0 0 0 0 369.7 0 890.7
20 363 3.4 891.4 0 0 0 0 0 0 0 1.58 0 889.8
21 363 3.4 369.0 0 0 0 0 0 0 0 368.1 0 0.89
a For 28503.5 kg/hr methanol production b NG implies Natural Gas combusted in Steam Reformer Furnace and is calculated in Energy Balance Section
252

253
5.3.2 Energy Balance Across the Process
Energy balance section documents the energy balance across each process section
including all assumptions and relevant equations implemented in an EXCEL spreadsheet.
As stated in mass balance section, 1000 kmol/hr of desulfurized natural gas was assumed
as a starting raw material for methanol production. From mass balance, 891.43 kmol/hr
(28503.5 kg/hr) of 99.9 percent methanol by weight is produced from that much natural
gas. Since the function of each process unit has been discussed in the overview of the
process and the mass balance section, only the information pertaining to energy will be
addressed in this section. The following subsections present the energy balance across
each process unit.
5.3.2.1 Natural Gas Compressor
The compressor used in the process utilizes electrical energy for its operation. The
energy used in the compressor can be calculated by obtaining the work required in
compressing the natural gas feed from 1 atm to 20 atm, the pressure at which steam
reformer operates (Twigg, 1989). Work done in compressing the natural gas can be then
divided by a user defined compressor efficiency, η, to obtain the power consumption by
the compressor. Equations 5-39 through 5-43 were used to calculate compressor power
requirements. The compressor is assumed to operate isentropically with a default
compressor efficiency of 75 percent (Overcash, 1999)
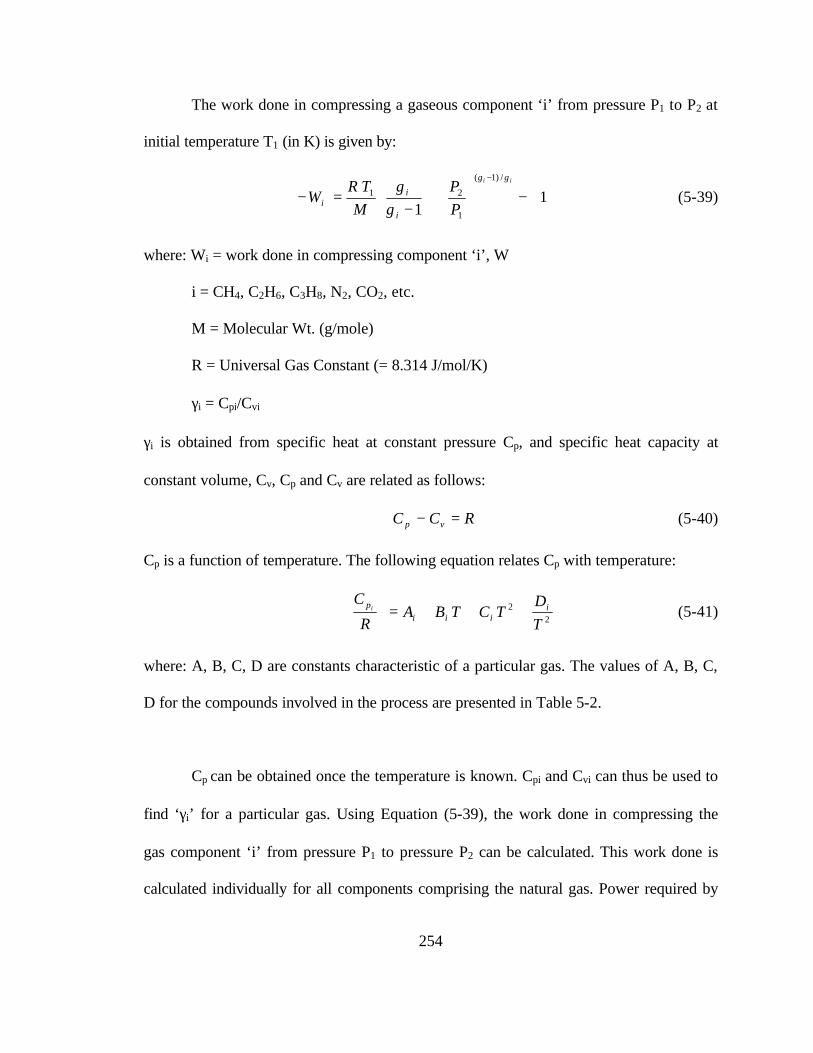
254
The work done in compressing a gaseous component ‘i’ from pressure P1 to P2 at
initial temperature T1 (in K) is given by:
−
−
=−−
11
/)1(
1
21
ii
P
P
M
TRW
i
ii
γγ
γγ
(5-39)
where: Wi = work done in compressing component ‘i’, W
i = CH4, C2H6, C3H8, N2, CO2, etc.
M = Molecular Wt. (g/mole)
R = Universal Gas Constant (= 8.314 J/mol/K)
γi = Cpi/Cvi
γi is obtained from specific heat at constant pressure Cp, and specific heat capacity at
constant volume, Cv, Cp and Cv are related as follows:
RCC vp =− (5-40)
Cp is a function of temperature. The following equation relates Cp with temperature:
22
T
DTCTBA
R
Ci
iii
pi +++=
(5-41)
where: A, B, C, D are constants characteristic of a particular gas. The values of A, B, C,
D for the compounds involved in the process are presented in Table 5-2.
Cp can be obtained once the temperature is known. Cpi and Cvi can thus be used to
find ‘γi’ for a particular gas. Using Equation (5-39), the work done in compressing the
gas component ‘i’ from pressure P1 to pressure P2 can be calculated. This work done is
calculated individually for all components comprising the natural gas. Power required by

255
the compressor can be calculated from the flow rate, in kg/s, of the component by using
Equation (5-42).
compressor
cii
i
mWBHP
η1000
−= (5-42)
where: mic = mass flow rate of component in kg/s
ηcompressor = Efficiency of compressor (Default value = 0.75).
The total power requirement of the compressor is given by Equation (5-43)
∑=
=n
iiTOTAL kWBHPPowerCompressor
1
),()_( (5-43)
where: n = number of components
Compressor_Power = Compressor power in kW.
The temperature of the natural gas rises as it is compressed from 1 atm to 20 atm
under isentropic conditions assumed. The exit temperature of natural gas, T2, is given by
Equation 5-44
av
av
P
PTT
γ
γ 1
1
212
−
= (5-44)
where: γav = average γ ≅ γ of major component (CH4)
Total electrical power calculated in Equation 5-43 is linked to the electricity sub-
model to calculate theLCI parameters associated with power consumption.
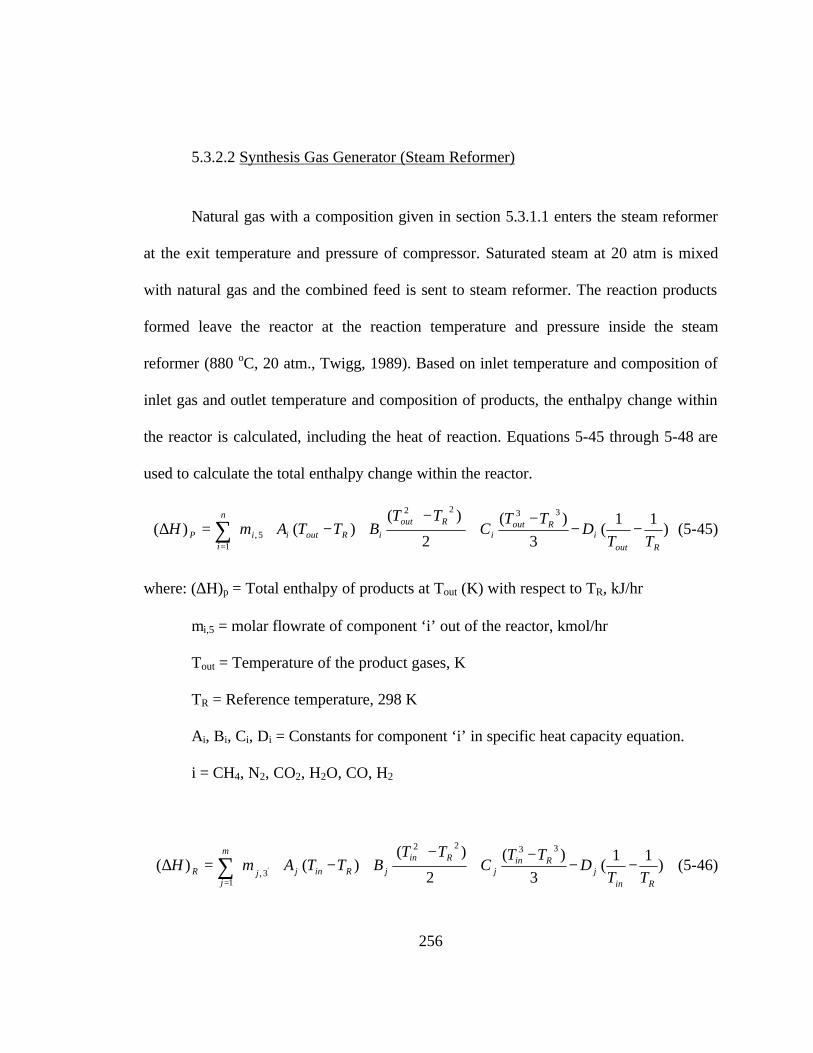
256
5.3.2.2 Synthesis Gas Generator (Steam Reformer)
Natural gas with a composition given in section 5.3.1.1 enters the steam reformer
at the exit temperature and pressure of compressor. Saturated steam at 20 atm is mixed
with natural gas and the combined feed is sent to steam reformer. The reaction products
formed leave the reactor at the reaction temperature and pressure inside the steam
reformer (880 oC, 20 atm., Twigg, 1989). Based on inlet temperature and composition of
inlet gas and outlet temperature and composition of products, the enthalpy change within
the reactor is calculated, including the heat of reaction. Equations 5-45 through 5-48 are
used to calculate the total enthalpy change within the reactor.
−−
−+
−+−=∆ ∑
=
)11
(3
)(
2
)()()(
3322
15,
Routi
Routi
Rout
iRouti
n
iiP TT
DTT
CTT
BTTAmH (5-45)
where: (∆H)p = Total enthalpy of products at Tout (K) with respect to TR, kJ/hr
mi,5 = molar flowrate of component ‘i’ out of the reactor, kmol/hr
Tout = Temperature of the product gases, K
TR = Reference temperature, 298 K
Ai, Bi, Ci, Di = Constants for component ‘i’ in specific heat capacity equation.
i = CH4, N2, CO2, H2O, CO, H2
−−
−+
−+−=∆ ∑
=
)11
(3
)(
2
)()()(
3322
13, '
Rinj
Rinj
Rin
jRinj
m
jjR TT
DTT
CTT
BTTAmH (5-46)

257
where: (∆H)R = Total enthalpy of reactants at Tin (K) with respect to TR, kJ/hr
mj,3’ = molar flowrate of component ‘j’ in to the reactor, kmol/hr
Tin = Temperature of the inlet reactants, K
TR = Reference temperature, 298 K
Aj, Bj, Cj, Dj = Constants for component ‘j’ in specific heat capacity equation.
j = CH4, C2H6, C3H8, N2, CO2, H2O
[ ]∑=
∆=∆l
kkRXNkRXN HmH
1
)( (5-47)
where: (∆H)RXN = Total enthalpy of Reactions k=1 to l, kJ/hr
mk = moles of the reactant ‘k’consumed in reaction ‘k’, kmol/hr
[(∆H)RXN]k = enthalpy of reaction ‘k’, kJ/mole ‘k’ reacted
k = reactions 5-1 to 5-4 (CH4 conversion, C2H6 conversion, C3H8 conversion, and
water gas shift).
RRXNPSR HHHH )()()()( ∆−∆+∆=∆ (5-48)
where: (∆H)SR = Enthalpy change in Steam Reformer (SR), kJ/hr
Since the reactions occurring in the steam reformer are endothermic, (∆H)SR is
positive and this much energy must be supplied, externally, for reforming reactions to
occur. Purge gases are combusted in the steam reformer furnace to supply this heat. If the
required heat is more than the heat available after purge combustion, then the remaining
heat is supplied by natural gas combustion. The furnace is assumed to operate at 980oC,
258
100 oC higher than the temperature inside the steam reformer, which is a typical steam
reformer furnace firebox temperature (Cheng and Kung, 1994). The combustion heat
raises the temperature of reactant gases and supplies the heat for the reforming reactions.
The following purge combustion reactions occur in the furnace. N2 and CO2 just undergo
the change in enthalpy.
H2 + ½ O2 → H2O; ∆hro = -2.418 x 10⁵ kJ/kmol (5-49)
CO + ½ O2 → CO; ∆hro = -2.83 x 10⁵ kJ/kmol (5-50)
CH4 + 2 O2 → CO2 + 2 H2O; ∆hro = -8.026 x 10⁵ kJ/kmol (5-51)
∆hro is the enthalpy of reaction at standard temperature and pressure (298K and 1
atm; Perry and Green, 1997). Ninety nine percent thermal oxidation of purge gases
(separated in flash drum) is assumed to occur in steam reformer furnace. One percent
unconverted purge gases are included in the overall LCI. Overall furnace heat transfer
efficiency of 92 percent is assumed as a default value (Cheng and Kung, 1994).
∑=
∆=∆q
pppPurge HmH
1
)()( (5-52)
where: (∆H)Purge = Total heat supplied by purge gas combustion, kJ/hr
mp = kmol of reactant ‘p’ in purge combusted in reaction ‘p’, kmol/hr
(∆H)p = Heat of reaction of reaction ‘p’, kJ/kmol.
p = H2, CH4, CO
259
This heat with certain efficiency (default = 92 percent), ηf, is available to steam
reforming reactions inside the steam reformer tubes. The enthalpy difference between the
heat required and heat supplied by purge is given by Equation 5-53.
PfSRBalance HHH )()()( ∆−∆=∆ η (5-53)
where: ηf = Furnace efficiency.
The remaining heat is supplied by natural gas combustion (Cheng and Kung,
1994). The amount of natural gas (in 106 ft3) combusted to supply this heat with furnace
efficiency of ηf is calculated by Equation (5-54).
NGf
BalanceNG HV
HV
)(
)(
η∆
= (5-54)
where: VNG = amount of natural gas to be combusted, 106 ft3/hr
HVNG = Heating value of natural gas (=1.0752 x 10⁹ kJ/106 ft3)
Mass flowrate of natural gas can be calculated by multiplying the volumetric
flowrate by the density (=19051.2 kg/106 cuft.). The flowrate of natural gas will be used
to calculate the pre-combustion and combustion emissions for the purpose of the LCI of
methanol. If (∆H)Balance is negative, then no natural gas is required to be burned in steam
reformer furnace and the additional heat generated by purge gases can be used as
appropriate.
260
5.3.2.3 Waste Heat Boiler
Hot product gases from the steam reformer at 880 oC enter the waste heat boiler
for excess process heat recovery. Saturated steam at100-psia is assumed to be generated
from BFW at 50oC as a result of non-contact heat exchange with hot gases. The
temperature of the product gases is reduced to 110 oC. Change in enthalpy of the product
gases in going from 880 oC to 110 oC can be calculated by Equation 5-55. It should be
noted that water undergoes a phase change at its saturation temperature (Tsat) at 50 atm.
Therefore its enthalpy change is evaluated separately.
−−
−+
−+−=∆ ∑
=
)11
(3
)(
2
)()()(
3322
1,
ioj
ioj
io
jioj
m
jjGWHB TT
DTT
CTT
BTTAmH (5-55)
where: (∆H)WHB,G = Enthalpy change associated with non-condensables, kJ/hr
mj = flowrate of component ‘j’ through WHB, kmol/hr.
To = Outlet temperature of gases from WHB, K (default value = 383 K)
Ti = Inlet temperature of gases into WHB, K (default value = 1153 K)
j = CH4, N2, H2, CO, CO2 (H2O considered separately).
In order to evaluate the enthalpy change of H2O, its saturation temperature (Tsat)
is required. Enthalpy change for water occurs in two parts: H2O going from 880 oC to its
Tsat in vapor phase and from Tsat to 110 oC in liquid phase. Both of these enthalpies are
added to calculate the enthalpy change associated with H2O. Saturation temperature of
261
water is calculated using Antoine’s equation, which is inverted to find the saturation
temperature (in K):
273)760(log
)760(log
10
10 +
−
−−=
oi
oioioioisat
AP
PCBCAT (5-56)
where: P = Partial pressure of the component in mm of Hg
Aoi, Boi, are Coi = constants depending on the component (H2O in this case).
Based on above equation, it can be determined that no other component
undergoes a phase change and therefore their change in enthalpy is accounted in Equation
5-55. Enthalpy change associated with water is given by equations 5-57 to 5-59
−−
−+
−+−=∆ )
11(
3
)(
2
)()()(
3322
2
isati
isati
isat
iisatiOH TTD
TTC
TTBTTAmH
iV (5-57)
)()(2 satoPLiOH TTCmH
L−=∆ (5-58)
where: mi = molar flowrate of water, kmol/hr
CPL = liquid specific heat capacity of water, kJ/kmol/K
LV OHOHOH HHH222
)()()( ∆+∆=∆ (5-59)

262
The total enthalpy change of syngas in WHB is given by Equation 5-60.
OHGWHBWHB HHH2
)()()( , ∆+∆=∆ (5-60)
Equation 5-61 calculates the enthalpy carried by the steam generated. Amount of
100-psia steam generated is calculated by Equation 5-62.
WHBWHBSteamWHB HH )(_ ∆= η (5-61)
)(_
lv
SteamWHBWHB hh
HS
−= (5-62)
where: HWHB_Steam = Enthalpy carried by steam, kJ/hr
ηWHB = Efficiency of heat exchange in WHB (default value = 85 percent).
hv = Enthalpy of 100 psia saturated steam, kJ/kg
hl = Enthalpy of water at 50oC, kJ/kg
SWHB = Flowrate of steam generated, kg/hr.
The steam produced in WHB is avoided being produced by conventional means
and therefore offsets the LCI emissions due to steam.
5.3.2.4 Water Removal and Knock-out Drum
In this process section, condensed water is removed from the syngas to produce
dry syngas. No significant enthalpy change takes place. Thus the enthalpy change is
assumed to be zero for this process section.

263
5.3.2.5 Syngas Compressor
In this section, dry syngas is compressed to 50 atm from 20 atm. The compressor
used in the process utilizes electrical energy for its operation. Power consumed by the
compressor and the outlet temperature of syngas are calculated using Equations 5-39
through 5-44. The components, i’s, in this case are CH4, N2, H2, CO, and CO2. γav for the
calculation of compressor outlet temperature is taken as a weighted average based on
mole fractions of the components. The default compressor efficiency is 75 percent
(Overcash, 1999). For simplicity, the compressor is assumed to operate isentropically.
Total electrical power calculated by Equation 5-43 is linked to the electricity sub-model
to calculate LCI parameters associated with it.
5.3.2.6 Syngas Feed/Product Heat Exchanger (Feed-Preheater)
In this process section, hot product gases from the methanol reactor at 260 oC and
50 atm exchange heat with exit gases from syngas compressor to heat them to 250 oC
before sending them to methanol reactor. The cold side inlet temperature is fixed by the
outlet temperature from the syngas compressor. The hot side outlet temperature is
determined by an enthalpy balance. Since gas-gas non-contact heat exchange can occur at
very high efficiency, it is assumed that heat supplied by hot stream is completely
transferred to the cold stream. Following equations present the enthalpy balance across
this process section.
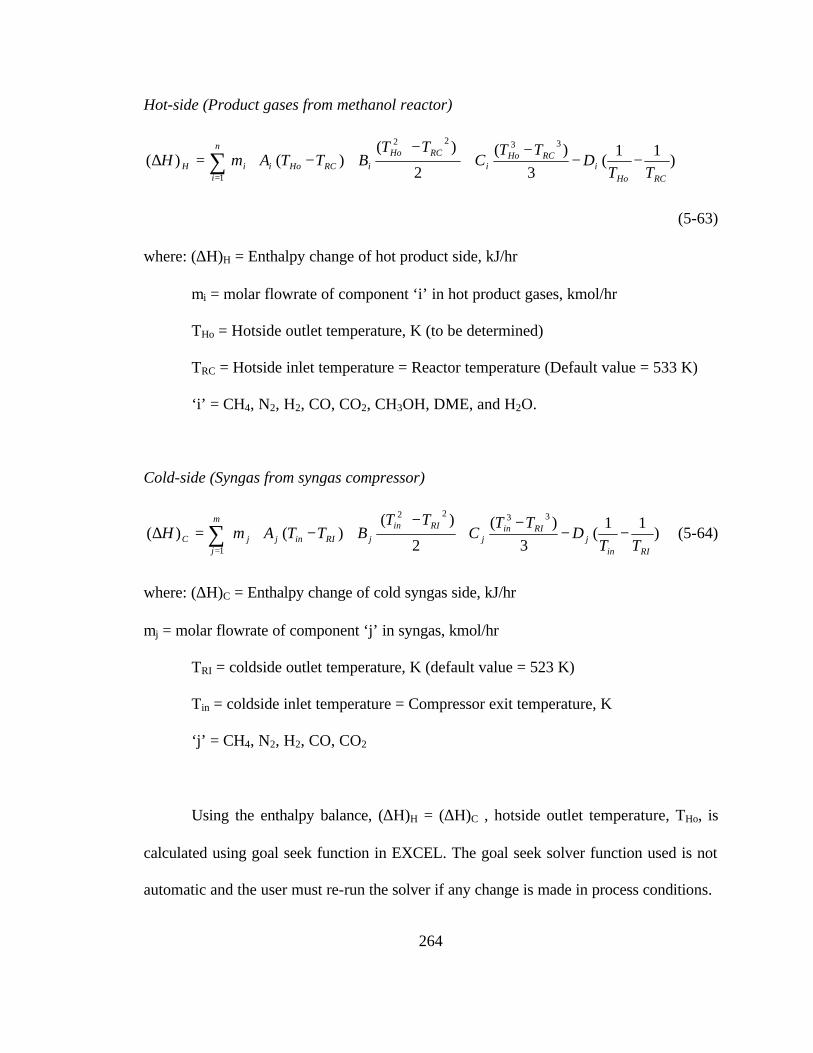
264
Hot-side (Product gases from methanol reactor)
−−
−+
−+−=∆ ∑
=
)11
(3
)(
2
)()()(
3322
1 RCHoi
RCHoi
RCHo
iRCHoi
n
iiH TT
DTT
CTT
BTTAmH
(5-63)
where: (∆H)H = Enthalpy change of hot product side, kJ/hr
mi = molar flowrate of component ‘i’ in hot product gases, kmol/hr
THo = Hotside outlet temperature, K (to be determined)
TRC = Hotside inlet temperature = Reactor temperature (Default value = 533 K)
‘i’ = CH4, N2, H2, CO, CO2, CH3OH, DME, and H2O.
Cold-side (Syngas from syngas compressor)
−−
−+
−+−=∆ ∑
=
)11
(3
)(
2
)()()(
3322
1 RIinj
RIinj
RIin
jRIinj
m
jjC TT
DTT
CTT
BTTAmH (5-64)
where: (∆H)C = Enthalpy change of cold syngas side, kJ/hr
mj = molar flowrate of component ‘j’ in syngas, kmol/hr
TRI = coldside outlet temperature, K (default value = 523 K)
Tin = coldside inlet temperature = Compressor exit temperature, K
‘j’ = CH4, N2, H2, CO, CO2
Using the enthalpy balance, (∆H)H = (∆H)C , hotside outlet temperature, THo, is
calculated using goal seek function in EXCEL. The goal seek solver function used is not
automatic and the user must re-run the solver if any change is made in process conditions.
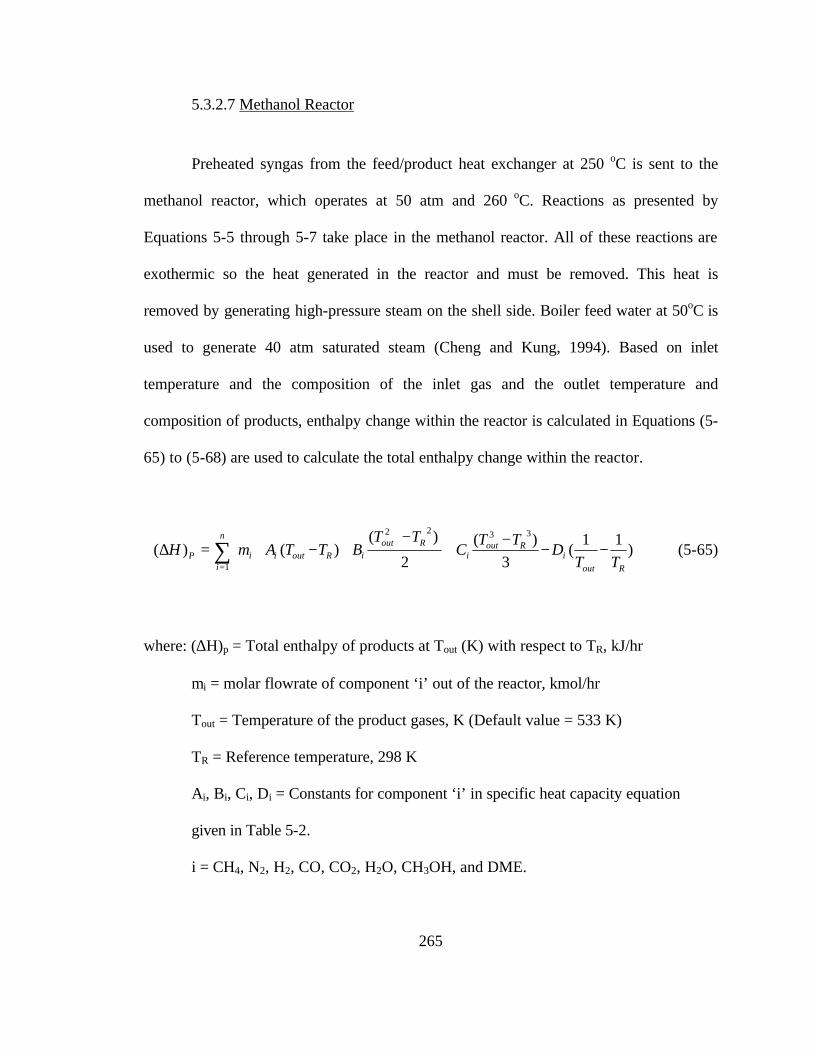
265
5.3.2.7 Methanol Reactor
Preheated syngas from the feed/product heat exchanger at 250 oC is sent to the
methanol reactor, which operates at 50 atm and 260 oC. Reactions as presented by
Equations 5-5 through 5-7 take place in the methanol reactor. All of these reactions are
exothermic so the heat generated in the reactor and must be removed. This heat is
removed by generating high-pressure steam on the shell side. Boiler feed water at 50oC is
used to generate 40 atm saturated steam (Cheng and Kung, 1994). Based on inlet
temperature and the composition of the inlet gas and the outlet temperature and
composition of products, enthalpy change within the reactor is calculated in Equations (5-
65) to (5-68) are used to calculate the total enthalpy change within the reactor.
−−
−+
−+−=∆ ∑
=
)11
(3
)(
2
)()()(
3322
1 Rout
iRout
i
Rout
iRouti
n
iiP TT
DTT
CTT
BTTAmH (5-65)
where: (∆H)p = Total enthalpy of products at Tout (K) with respect to TR, kJ/hr
mi = molar flowrate of component ‘i’ out of the reactor, kmol/hr
Tout = Temperature of the product gases, K (Default value = 533 K)
TR = Reference temperature, 298 K
Ai, Bi, Ci, Di = Constants for component ‘i’ in specific heat capacity equation
given in Table 5-2.
i = CH4, N2, H2, CO, CO2, H2O, CH3OH, and DME.

266
−−
−+
−+−=∆ ∑
=
)11
(3
)(
2
)()()(
3322
1 Rinj
Rinj
Rin
jRinj
m
jjR TT
DTT
CTT
BTTAmH (5-66)
where: (∆H)R = Total enthalpy of reactants at Tin (K) with respect to TR, kJ/hr
mj = molar flowrate of component ‘j’ in to the reactor, kmol/hr
Tin = Temperature of the inlet reactants, K (Default value = 523 K)
TR = Reference temperature, 298 K
Aj, Bj, Cj, Dj = Constants for component ‘j’ in specific heat capacity equation
given in Table 5-2.
j = CH4, N2, H2, CO, and CO2.
[ ]∑=
∆=∆l
kkRXNkRXN HmH
1
)( (5-67)
where: (∆H)RXN = Total enthalpy of Reactions k=1 to l, kJ/hr
mk = moles of the reactant ‘k’consumed in reaction ‘k’, kmol/hr
[(∆H)RXN]k = enthalpy of reaction ‘k’, kJ/mole ‘k’ reacted
k = reactions 5-5 to 5-7 (CO conversion to CH3OH, CO2 conversion to CH3OH,
DME production).
RRXNPMeOH HHHH )()()()( ∆−∆+∆=∆ (5-68)
where: (∆H)MeOH = enthalpy change in methanol (MeOH) reactor, kJ/hr
Equation 5-69 calculates the enthalpy carried by the steam generated. The amount
of 588-psia (40atm) saturated steam generated is calculated by Equation 5-70.

267
MeOHMeOHSteamMR HH )(_ ∆= η (5-69)
)(_
lv
SteamMRMR hh
HS
−= (5-70)
where: HMR_Steam = enthalpy carried by steam, kJ/hr
ηWHB = Efficiency of heat exchange in MeOH reactor (default value = 0.85)
hv = Enthalpy of 588 psia (40 atm) saturated steam, kJ/kg
hl = Enthalpy of water at 50oC, kJ/kg
SWHB = Flowrate of steam generated, kg/hr.
5.3.2.8 Methanol Condenser
Product gases from the methanol reactor enter the methanol condenser after heat
exchange with feed syngas. In methanol condenser, water at 20 oC is used for condensing
methanol, DME, and water. Exit temperature of cooling water is limited to 50 oC
(Overcash, 1999). The outlet temperature of product gases in 45 oC (Overcash, 1999). At
this temperature, complete condensation of methanol, DME and water takes place. It
should be noted that the enthalpy change in the condenser is calculated using similar set
of equations as used for the WHB in Equations (5-55) to (5-60). The enthalpy change for
non-condensable gases, CH4, N2, H2, CO, CO2 is calculated using Equation (5-55) taking
regard of changed components. The enthalpy change associated with CH3OH, DME and
H2O is calculated using equations 5-56 to 5-59. The saturation temperature, Tsat, for
methanol, DME, and water is calculated at their respective partial pressures. Equation 5-
71 calculates the total enthalpy change occurring in the condenser.

268
OHDMEOHCHGCondenserCondenser HHHHH23
)()()()()( , ∆+∆+∆+∆=∆ (5-71)
where: (∆H)Condenser,G = Enthalpy change associated with non-condensables, kJ/hr
(∆H)CH3OH = Enthalpy change associated with CH3OH, kJ/hr
(∆H)H2O = Enthalpy change associated with H2O, kJ/hr
(∆H)DME = Enthalpy change associated with DME, kJ/hr
The flowrate of water required for the removal of this enthalpy is calculated by
Equation 5-72.
OHPCondenser
CondenserCondenser TC
HW
OH 22)(
)(
∆∆
=η
(5-72)
where: WCondenser = Flowrate of cooling water, kg/hr
CpH2O = Specific heat capacity of water (4.18 J/kg/K)
(∆T)H2O = Change in temperature of water (Default value = 50-20 = 30 K)
ηCondenser = Condenser heat exchange efficiency (Default value = 0.85)
It should be noted that the heat removed by cooling water in methanol condenser
is not recoverable and therefore does not contribute to the LCI of methanol. The flowrate
of water is calculated just for the sake of completeness of energy balance.

269
5.3.2.9 Pre-Flash Drum Pressure Relief Valve
In pre-flash drum pressure relief valve, the pressure of the condenser outlet is
reduced from 50 atm to 11.2 atm before sending it to flash drum for the removal of non-
condensable gases. No useful work is recovered and therefore energy change in this
process section does not contribute to the LCI of methanol.
5.3.2.10 Flash Drum
The flash drum is a simple gas liquid separator. Non-condensable gases, CH4, N2,
H2, CO, and CO2 are removed at the top and sent to steam reformer furnace for
combustion while liquid fraction consisting of CH3OH, DME and H2O is sent to DME
distillation column. No significant energy changes occur in this section.
5.3.2.11 DME Distillation Column
The liquid fraction from flash drum enters this column at 45 oC and 11.2 atm. As
stated in mass balance section, it is assumed that complete recovery of DME takes place
as top product. Methanol and water leave as the bottoms of the distillation column.
Reflux ratio used in the column is 20 (US patent 3,920,717). If ‘DDME’ is the distillate
(DME) flowrate of this distillation column, then the flowrate of vapor to the condenser of
distillation column is given by:
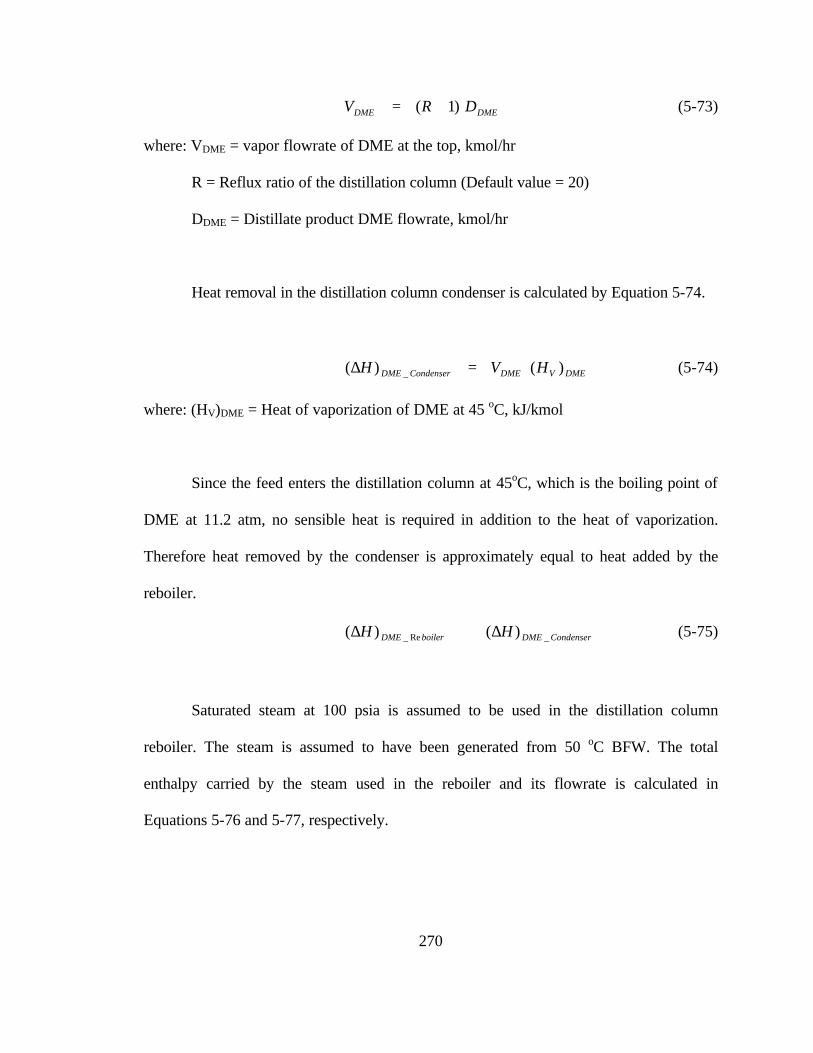
270
DMEDME DRV )1( += (5-73)
where: VDME = vapor flowrate of DME at the top, kmol/hr
R = Reflux ratio of the distillation column (Default value = 20)
DDME = Distillate product DME flowrate, kmol/hr
Heat removal in the distillation column condenser is calculated by Equation 5-74.
DMEVDMECondenserDME HVH )()( _ =∆ (5-74)
where: (HV)DME = Heat of vaporization of DME at 45 oC, kJ/kmol
Since the feed enters the distillation column at 45oC, which is the boiling point of
DME at 11.2 atm, no sensible heat is required in addition to the heat of vaporization.
Therefore heat removed by the condenser is approximately equal to heat added by the
reboiler.
CondenserDMEboilerDME HH _Re_ )()( ∆≅∆ (5-75)
Saturated steam at 100 psia is assumed to be used in the distillation column
reboiler. The steam is assumed to have been generated from 50 oC BFW. The total
enthalpy carried by the steam used in the reboiler and its flowrate is calculated in
Equations 5-76 and 5-77, respectively.
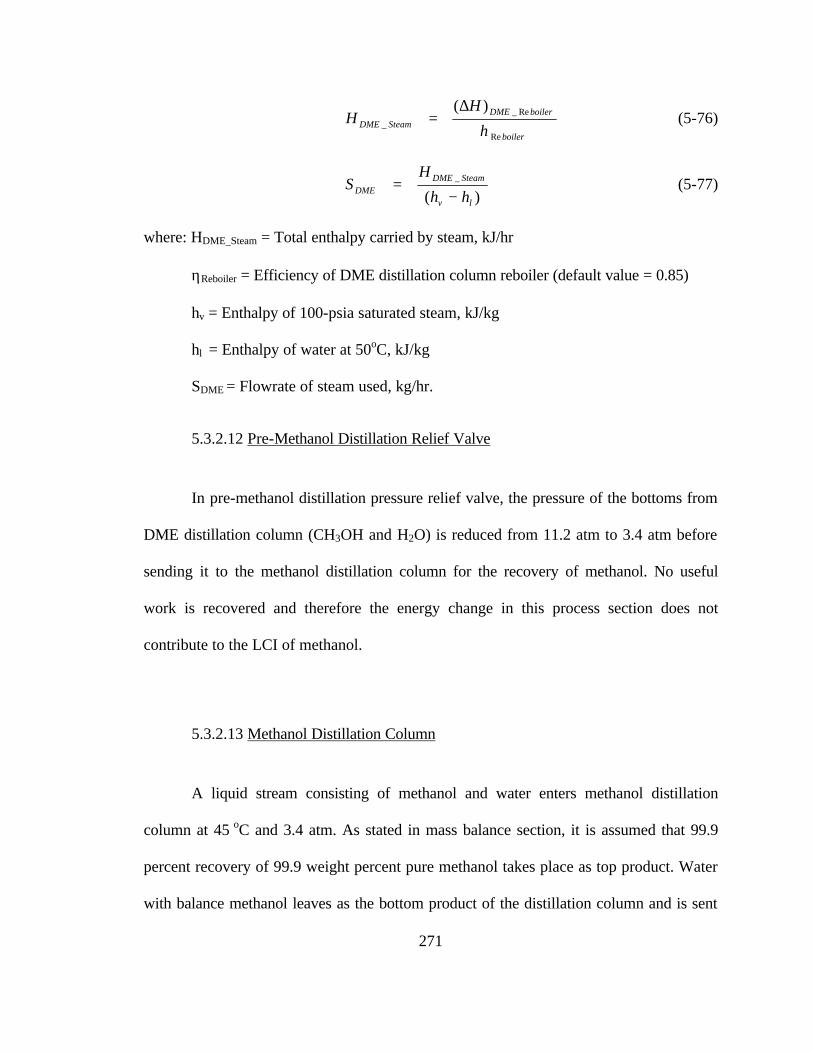
271
boiler
boilerDMESteamDME
HH
Re
Re__
)(
η
∆= (5-76)
)(_
lv
SteamDMEDME hh
HS
−= (5-77)
where: HDME_Steam = Total enthalpy carried by steam, kJ/hr
ηReboiler = Efficiency of DME distillation column reboiler (default value = 0.85)
hv = Enthalpy of 100-psia saturated steam, kJ/kg
hl = Enthalpy of water at 50oC, kJ/kg
SDME = Flowrate of steam used, kg/hr.
5.3.2.12 Pre-Methanol Distillation Relief Valve
In pre-methanol distillation pressure relief valve, the pressure of the bottoms from
DME distillation column (CH3OH and H2O) is reduced from 11.2 atm to 3.4 atm before
sending it to the methanol distillation column for the recovery of methanol. No useful
work is recovered and therefore the energy change in this process section does not
contribute to the LCI of methanol.
5.3.2.13 Methanol Distillation Column
A liquid stream consisting of methanol and water enters methanol distillation
column at 45 oC and 3.4 atm. As stated in mass balance section, it is assumed that 99.9
percent recovery of 99.9 weight percent pure methanol takes place as top product. Water
with balance methanol leaves as the bottom product of the distillation column and is sent

272
to a wastewater treatment facility. The reflux ratio used in the column is 1.5 (US patent
3,920,717). If ‘DT’ is the distillate (methanol and water) flowrate of this distillation
column, then the flowrate of vapor to the condenser of distillation column is given by:
TT DRV )1( += (5-78)
or OHCHOHCH DRV33
)1( += and OHOH DRV22
)1( += (5-79)
where: DT = DCH3OH + DH2O
VT = vapor flowrate of methanol and water at the top, kmol/hr
VCH3OH = vapor flowrate of methanol at the top, kmol/hr
VH2O = vapor flowrate of water at the top, kmol/hr
R = Reflux ration of the distillation column (Default value = 1.5)
DT = Distillate product (99.9 percent methanol and 0.1 percent water; wt. basis)
flowrate, kmol/hr
DCH3OH = Distillate flow rate of methanol, kmol/hr
DH2O = Distillate flow rate of water, kmol/hr
Heat removal in the distillation column condenser is calculated by Equation 5-80.
OHVOHOHCHVOHCHCondenserT HVHVH2233
)()()( _ +=∆ (5-80)
where: (HV)CH3OH = Heat of vaporization of CH3OH at 90 oC.
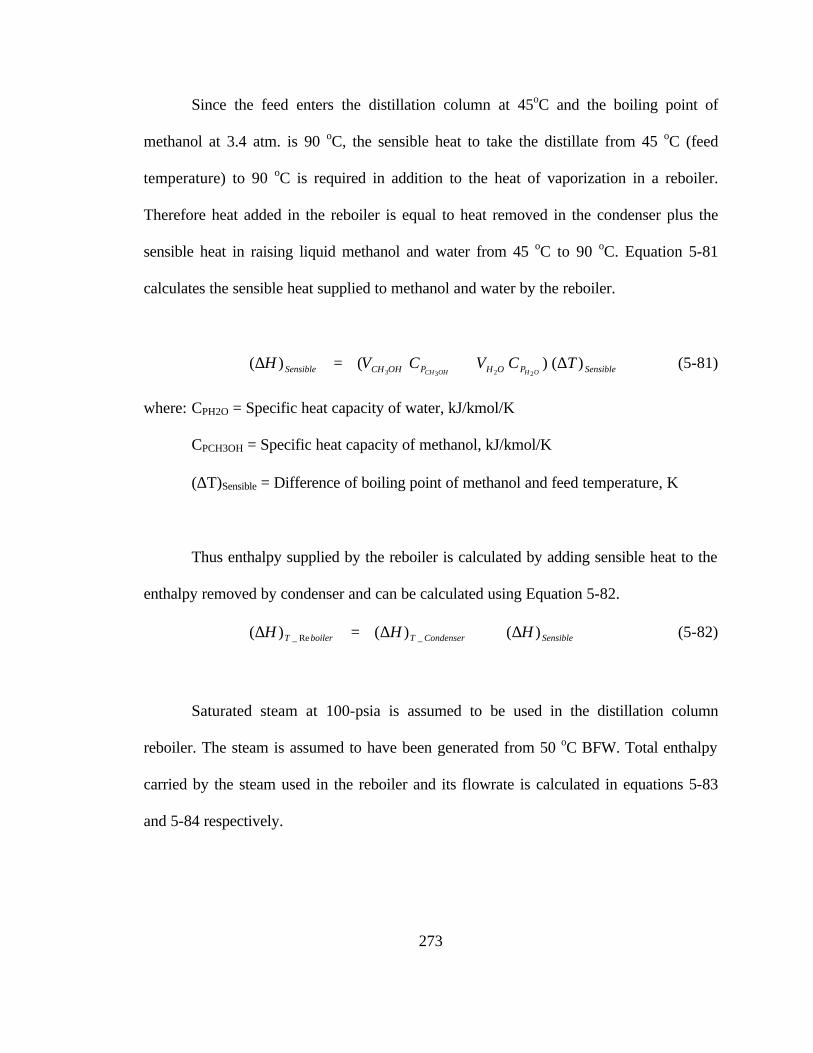
273
Since the feed enters the distillation column at 45oC and the boiling point of
methanol at 3.4 atm. is 90 oC, the sensible heat to take the distillate from 45 oC (feed
temperature) to 90 oC is required in addition to the heat of vaporization in a reboiler.
Therefore heat added in the reboiler is equal to heat removed in the condenser plus the
sensible heat in raising liquid methanol and water from 45 oC to 90 oC. Equation 5-81
calculates the sensible heat supplied to methanol and water by the reboiler.
SensiblePOHPOHCHSensible TCVCVHOHOHCH
)()()(2233
∆+=∆ (5-81)
where: CPH2O = Specific heat capacity of water, kJ/kmol/K
CPCH3OH = Specific heat capacity of methanol, kJ/kmol/K
(∆T)Sensible = Difference of boiling point of methanol and feed temperature, K
Thus enthalpy supplied by the reboiler is calculated by adding sensible heat to the
enthalpy removed by condenser and can be calculated using Equation 5-82.
SensibleCondenserTboilerT HHH )()()( _Re_ ∆+∆=∆ (5-82)
Saturated steam at 100-psia is assumed to be used in the distillation column
reboiler. The steam is assumed to have been generated from 50 oC BFW. Total enthalpy
carried by the steam used in the reboiler and its flowrate is calculated in equations 5-83
and 5-84 respectively.
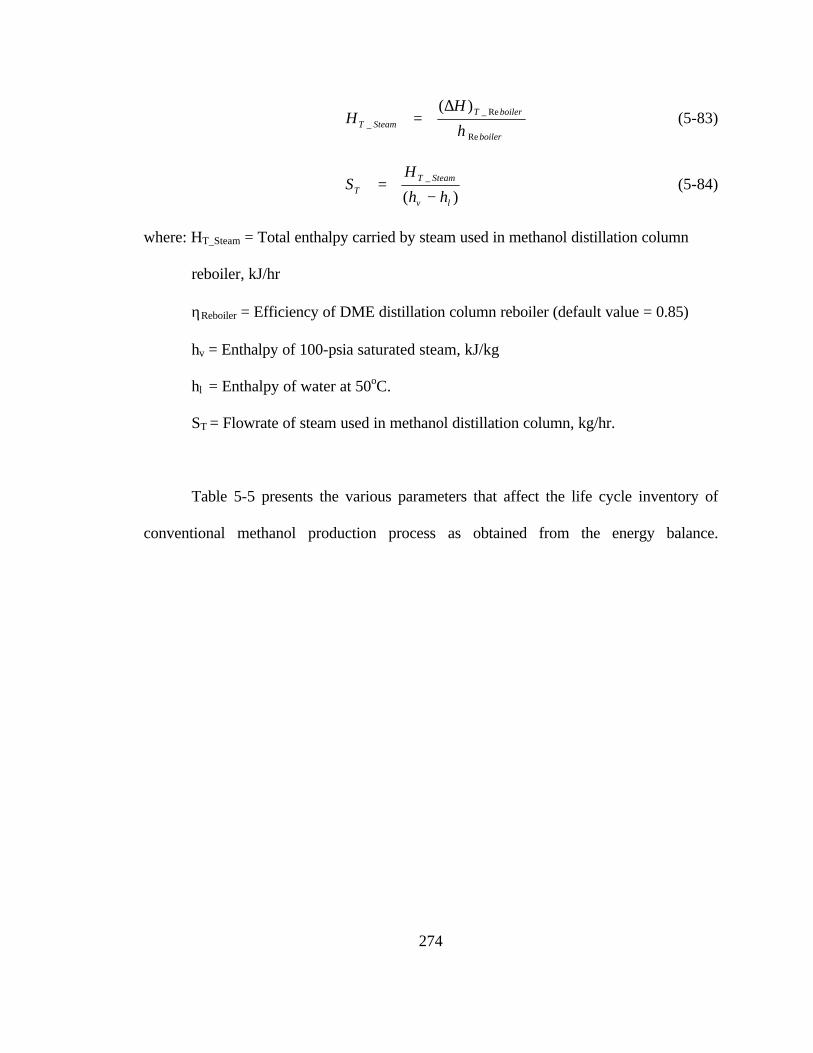
274
boiler
boilerTSteamT
HH
Re
Re__
)(
η
∆= (5-83)
)(_
lv
SteamTT hh
HS
−= (5-84)
where: HT_Steam = Total enthalpy carried by steam used in methanol distillation column
reboiler, kJ/hr
ηReboiler = Efficiency of DME distillation column reboiler (default value = 0.85)
hv = Enthalpy of 100-psia saturated steam, kJ/kg
hl = Enthalpy of water at 50oC.
ST = Flowrate of steam used in methanol distillation column, kg/hr.
Table 5-5 presents the various parameters that affect the life cycle inventory of
conventional methanol production process as obtained from the energy balance.
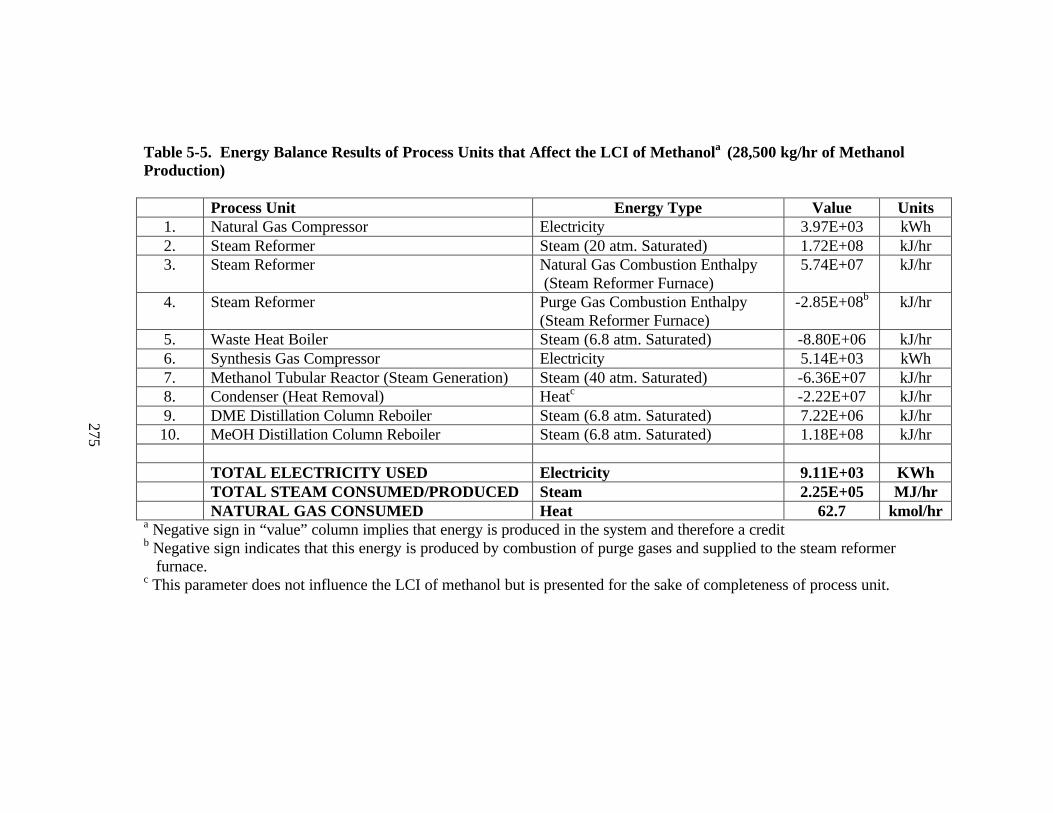
275
Table 5-5. Energy Balance Results of Process Units that Affect the LCI of Methanola (28,500 kg/hr of Methanol
Production)
Process Unit Energy Type Value Units 1. Natural Gas Compressor Electricity 3.97E+03 kWh 2. Steam Reformer Steam (20 atm. Saturated) 1.72E+08 kJ/hr 3. Steam Reformer Natural Gas Combustion Enthalpy
(Steam Reformer Furnace) 5.74E+07 kJ/hr
4. Steam Reformer Purge Gas Combustion Enthalpy (Steam Reformer Furnace)
-2.85E+08b kJ/hr
5. Waste Heat Boiler Steam (6.8 atm. Saturated) -8.80E+06 kJ/hr 6. Synthesis Gas Compressor Electricity 5.14E+03 kWh 7. Methanol Tubular Reactor (Steam Generation) Steam (40 atm. Saturated) -6.36E+07 kJ/hr 8. Condenser (Heat Removal) Heatc -2.22E+07 kJ/hr 9. DME Distillation Column Reboiler Steam (6.8 atm. Saturated) 7.22E+06 kJ/hr 10. MeOH Distillation Column Reboiler Steam (6.8 atm. Saturated) 1.18E+08 kJ/hr
TOTAL ELECTRICITY USED Electricity 9.11E+03 KWh TOTAL STEAM CONSUMED/PRODUCED Steam 2.25E+05 MJ/hr NATURAL GAS CONSUMED Heat 62.7 kmol/hr
a Negative sign in “value” column implies that energy is produced in the system and therefore a credit b Negative sign indicates that this energy is produced by combustion of purge gases and supplied to the steam reformer furnace. c This parameter does not influence the LCI of methanol but is presented for the sake of completeness of process unit.
275
276
5.3.3 Calculation of the LCI of Methanol Production from a Conventional Process
This section presents the methodology by which the LCI parameters are
calculated using the results obtained from mass and energy balance of the process which
are based on 891.4 kmol/hr (28500 kg/hr) of methanol produced. The methodology
considers emissions from the process as well as the emissions that are associated with the
LCI of electricity and steam used in the process. The LCI parameters associated with
steam and electricity are imported from Chapters 2 and 3, respectively.
The LCI of methanol using a conventional process includes all activities
associated with the process starting from desulfurized natural gas. The LCI parameters
considered include gaseous and liquid releases as well as solid waste. The LCI
parameters considered include particulate matter (PM), SO2, NOx, CO, CO2,
hydrocarbons (HCs), CH4, HCl, VOCs and 12 trace metals, liquid emissions and solid
waste. The emission factors are presented in units of kg pollutant/kg methanol produced.
The following subsections present the various components of overall LCI of methanol.
5.3.3.1 Emissions Associated with LCI of Steam used in the Process
Steam production/consumption has been calculated in the energy balance section
of the process for the total production of 28,500 kg/hr of methanol. Steam is consumed in
the steam reformer (20 atm, saturated), DME distillation column (6.8 atm, saturated) and
methanol distillation column (6.8 atm, saturated). Steam is produced in the WHB (6.8

277
atm, saturated) and methanol reactor (40 atm, saturated). Enthalpy associated with each
of these has been calculated in the energy balance section. Enthalpy associated with
steam produced is considered negative while enthalpy associated with steam consumption
is considered positive. All of the energy contributions from these are added to calculate
the net steam energy consumed or produced. Equation 5-85 calculates the net enthalpy of
steam (in MJ/hr) in the methanol process for 28,500 kg/hr methanol production.
1000
)( ___ SteamTSteamDMESteamMRWHBSROverall
HHHHHH
++++= (5-85)
where: HOverall = Net enthalpy of steam, MJ/hr
HSR = Enthalpy associated with steam to steam reformer, kJ/hr (Positive)
HWHB = Enthalpy associated with steam generated in WHB, kJ/hr (Negative)
HMR_Steam = Enthalpy associated with steam generated in methanol reactor, kJ/hr
(Negative)
HDME_Steam = Enthalpy associated with steam used in DME distillation column,
kJ/hr (Positive)
HT_Steam = Enthalpy associated with steam used in methanol distillation column,
kJ/hr (Positive)
Chapter 2 presents the emissions associated with steam (LCI of steam) in the units
of kg/MJ of steam. Emissions due to net enthalpy of steam in Equation 5-85 are
calculated by Equation 5-86.
278
)()( _''
OverallLCISteamjj Hmm = (5-86)
where: j = Emission of type ‘j’ (PM, SO2, CO, NOx, etc.)
m’j = Emission of type ‘j’, kg/hr
(m’j)Steam_LCI = Emission of type ‘j’ from LCI of steam, kg/MJ steam.
Emissions due to steam usage/generation in the process per kg of methanol
produced are calculated using Equation 5-87.
oducedOHCH
mm j
j Pr_3
'
= (5-87)
where: mj = Emission of type ‘j’ per kg of methanol produced, kg/kg methanol
CH3OH_Produced = Methanol production, kg/hr
Table 5-6 presents the emissions due to steam usage/production in the process per
kg of methanol produced.
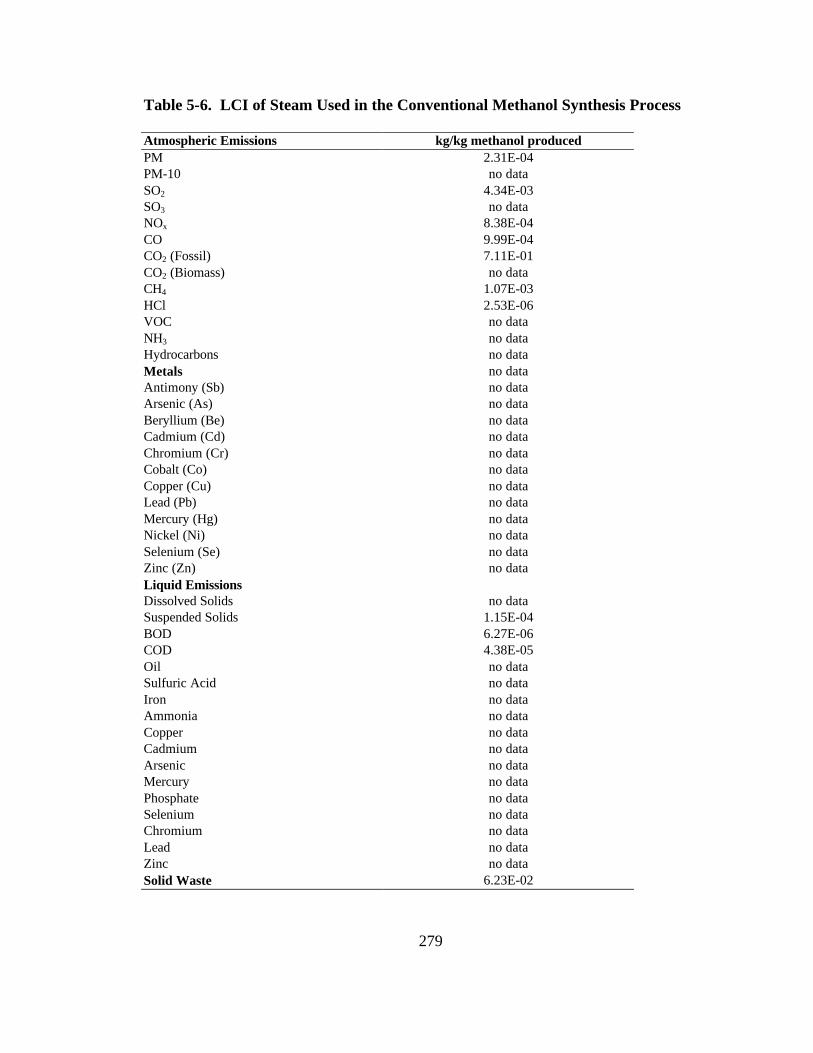
279
Table 5-6. LCI of Steam Used in the Conventional Methanol Synthesis Process Atmospheric Emissions kg/kg methanol produced PM 2.31E-04 PM-10 no data SO2 4.34E-03 SO3 no data NOx 8.38E-04 CO 9.99E-04 CO2 (Fossil) 7.11E-01 CO2 (Biomass) no data CH4 1.07E-03 HCl 2.53E-06 VOC no data NH3 no data Hydrocarbons no data Metals no data Antimony (Sb) no data Arsenic (As) no data Beryllium (Be) no data Cadmium (Cd) no data Chromium (Cr) no data Cobalt (Co) no data Copper (Cu) no data Lead (Pb) no data Mercury (Hg) no data Nickel (Ni) no data Selenium (Se) no data Zinc (Zn) no data Liquid Emissions Dissolved Solids no data Suspended Solids 1.15E-04 BOD 6.27E-06 COD 4.38E-05 Oil no data Sulfuric Acid no data Iron no data Ammonia no data Copper no data Cadmium no data Arsenic no data Mercury no data Phosphate no data Selenium no data Chromium no data Lead no data Zinc no data Solid Waste 6.23E-02
280
5.3.3.2 Emissions Associated with Electricity Used in the Process
Electrical energy is used in the methanol production process in the natural gas and
syngas compressors. The electrical power used in each compressor was calculated based
on 28,500 kg/hr methanol of production. Electrical power used in both the compressors is
added to calculate the total electrical power consumed in the process.
SyngasNGTOTAL PowerCompressorPowerCompressorE )_()_( += (5-88)
where: ETOTAL = Total electrical energy used in the process, kWh (based on 1-hr)
(Compressor_Power)NG = Electrical power used in natural gas compressor, kW
(Compressor_Power)Syngas = Electrical power used in syngas compressor, kW
Chapter 3 presents the emissions associated with electricity (LCI of electricity) in
the units of kg/kWh of electricity. Emissions due to electricity consumption in Equation
5-88 are calculated by Equation 5-89.
)()( _''
TOTALLCIyElectricitii Emm = (5-89)
where: i = Emission of type ‘i’ (PM, SO2, CO, NOx, etc.)
m’i = Emission of type ‘i’, kg
(m’i)Electricity_LCI = Emission of type ‘i’ from LCI of Electricity, kg/kWh
281
Emissions due to electricity usage in the process per kg of methanol produced are
calculated using equation 5-90.
oducedOHCH
mm i
i Pr_3
'
= (5-90)
where: mi = Emission of type ‘i’ per kg of methanol produced, kg/kg methanol
CH3OH_Produced = Methanol production, kg (1-hr basis).
Table 5-7 presents the emissions due to electricity usage in the process per kg of
methanol produced.
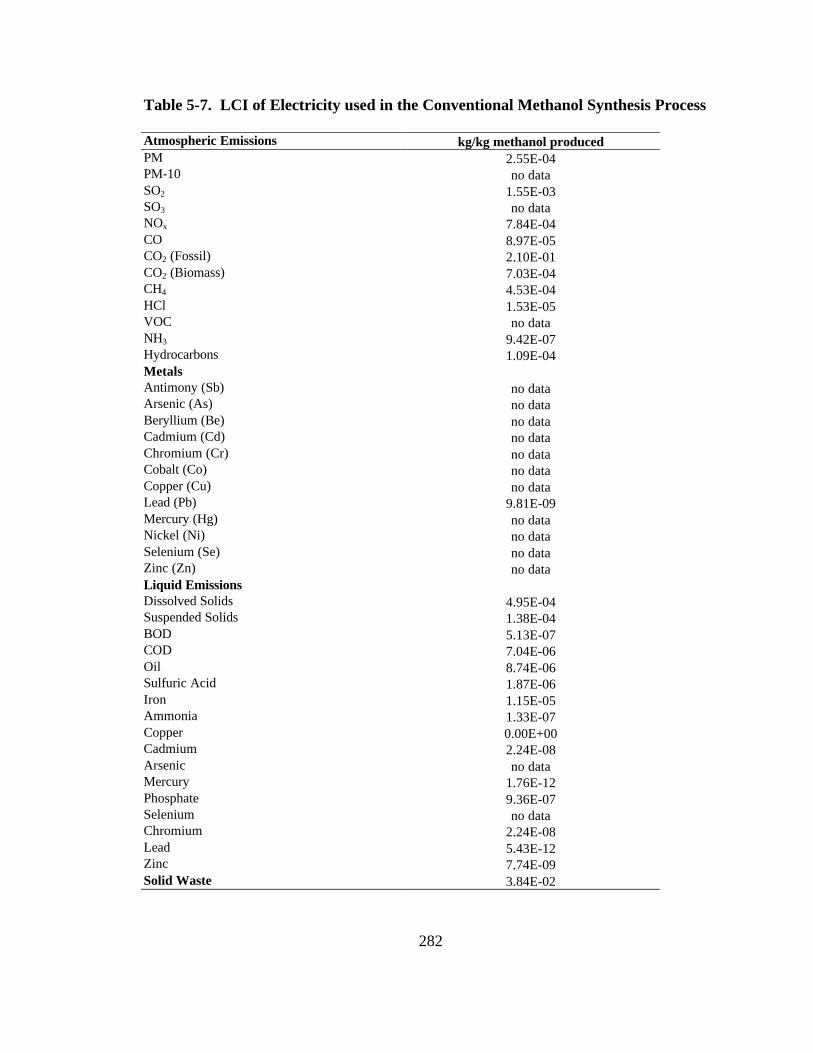
282
Table 5-7. LCI of Electricity used in the Conventional Methanol Synthesis Process Atmospheric Emissions kg/kg methanol produced PM 2.55E-04 PM-10 no data SO2 1.55E-03 SO3 no data NOx 7.84E-04 CO 8.97E-05 CO2 (Fossil) 2.10E-01 CO2 (Biomass) 7.03E-04 CH4 4.53E-04 HCl 1.53E-05 VOC no data NH3 9.42E-07 Hydrocarbons 1.09E-04 Metals Antimony (Sb) no data Arsenic (As) no data Beryllium (Be) no data Cadmium (Cd) no data Chromium (Cr) no data Cobalt (Co) no data Copper (Cu) no data Lead (Pb) 9.81E-09 Mercury (Hg) no data Nickel (Ni) no data Selenium (Se) no data Zinc (Zn) no data Liquid Emissions Dissolved Solids 4.95E-04 Suspended Solids 1.38E-04 BOD 5.13E-07 COD 7.04E-06 Oil 8.74E-06 Sulfuric Acid 1.87E-06 Iron 1.15E-05 Ammonia 1.33E-07 Copper 0.00E+00 Cadmium 2.24E-08 Arsenic no data Mercury 1.76E-12 Phosphate 9.36E-07 Selenium no data Chromium 2.24E-08 Lead 5.43E-12 Zinc 7.74E-09 Solid Waste 3.84E-02
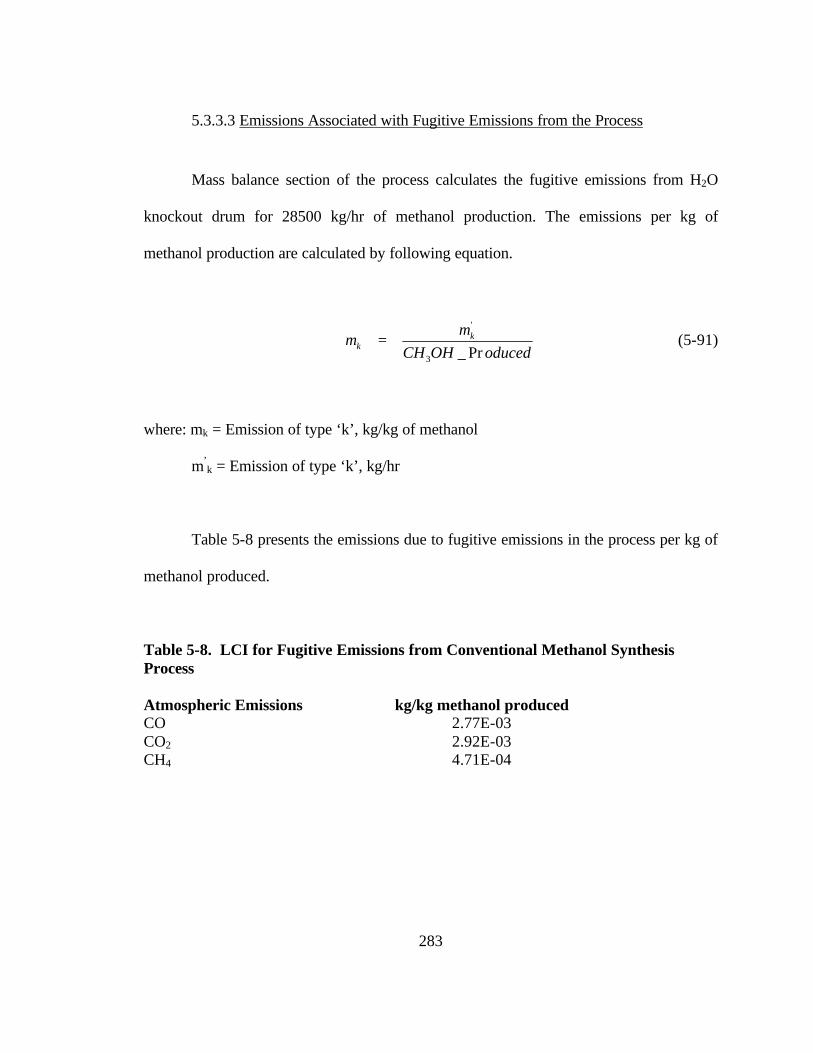
283
5.3.3.3 Emissions Associated with Fugitive Emissions from the Process
Mass balance section of the process calculates the fugitive emissions from H2O
knockout drum for 28500 kg/hr of methanol production. The emissions per kg of
methanol production are calculated by following equation.
oducedOHCH
mm k
k Pr_3
'
= (5-91)
where: mk = Emission of type ‘k’, kg/kg of methanol
m’k = Emission of type ‘k’, kg/hr
Table 5-8 presents the emissions due to fugitive emissions in the process per kg of
methanol produced.
Table 5-8. LCI for Fugitive Emissions from Conventional Methanol Synthesis Process Atmospheric Emissions kg/kg methanol produced CO 2.77E-03 CO2 2.92E-03 CH4 4.71E-04
284
5.3.3.4 Emissions From Methanol Storage Tanks
Due to non-availability of data, the emissions from methanol storage tanks are
assumed to be same as that in the LCI of methanol using LPMEOH process. Similar
storage tanks are assumed for methanol storage in both cases. The emission factor for
methanol is 8.65E-07 kg/kg of methanol produced.
5.3.3.5 Emissions Associated with Purge Gas Combustion
Purge gases are the non-condensable gases removed from flash drum in the
process as modeled. As stated in energy balance section of the process, the purge gases
are combusted in a steam reforming furnace with assumed 99 percent combustion
efficiency (user input) to supply the heat for reforming reactions to take place. In most
cases, this heat is less than what is required for the endothermic reactions in steam
reformer (Cheng and Kung, 1994). Balance heat required is supplied by natural gas
combustion (Cheng and Kung, 1994). Emissions associated with balance natural gas
combustion in a process heater such as a steam reformer furnace are considered in a
separate section. Emissions due to purge gas combustion are one percent uncombusted
purge gases and the products of purge gas combustion (CO2 and H2O) as
stoichiometrically presented in equations 5-8 to 5-10. Table 5-9 presents the emissions
associated with purge combustion in steam reformer furnace. It should be noted that
purge gas combustion efficiency may vary and is defined as a user input in the
spreadsheet. Ninety nine percent efficiency is used as a default. NOx emissions are
expected but could not be included because of no availability of data.

285
Table 5-9. Emissions Associated with Purge Gas Combustion Atmospheric Emissions kg/kg of methanol produced CO 3.23E-05 CO2 2.89E-01 CH4 9.38E-04
5.3.3.6 Emissions Associated with Natural Gas Combustion in the Steam Reformer Furnace
The energy balance section calculates the amount of natural gas combusted in
steam reformer furnace. Since the steam reformer furnace operates at 980 oC (Cheng and
Kung, 1994), natural gas combustion in it comes under the fired heaters source category.
Uncontrolled emissions factors for all combustion sources burning natural gas have been
presented in AP-42 (US EPA, 1998). A NOx emission factor from natural gas combustion
in fired heaters, both natural air draft and mechanical air draft, is presented in NOx
Control Options Book (STAPPA and ALAPCO, 1994). CO emission factor for
combustion of natural gas in fired heaters is assumed to be same as that in an industrial
furnace. Table 5-10 presents the uncontrolled emission factors for natural gas combustion
from fired heaters (e.g. steam reforming furnace). Since natural gas is a clean fuel with
very low sulfur content, no control factors are applied to SO2 and PM. Low NOx burner
technology is assumed for NOx control. 50 percent reduction in uncontrolled NOx
emissions is assumed, which is typical of low NOx burner (US EPA, 1998). No control
factors are applied to CO, CO2, CH4, and VOCs. Ninety-nine percent removal of metals
is assumed as a default. No liquid discharges and solid residues occur. Table 5-10 also
presents the controlled emissions from natural gas combustion for fired heaters. Pre-
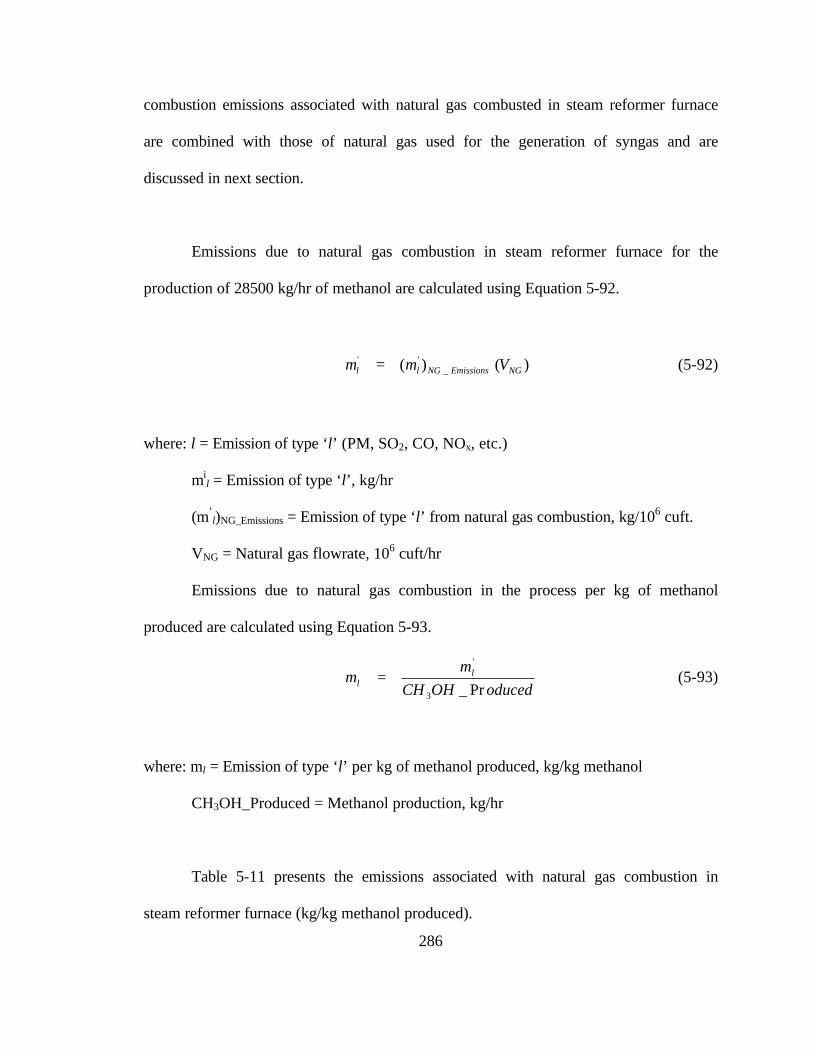
286
combustion emissions associated with natural gas combusted in steam reformer furnace
are combined with those of natural gas used for the generation of syngas and are
discussed in next section.
Emissions due to natural gas combustion in steam reformer furnace for the
production of 28500 kg/hr of methanol are calculated using Equation 5-92.
)()( _''
NGEmissionsNGll Vmm = (5-92)
where: l = Emission of type ‘l’ (PM, SO2, CO, NOx, etc.)
mil = Emission of type ‘l’, kg/hr
(m’l)NG_Emissions = Emission of type ‘l’ from natural gas combustion, kg/106 cuft.
VNG = Natural gas flowrate, 106 cuft/hr
Emissions due to natural gas combustion in the process per kg of methanol
produced are calculated using Equation 5-93.
oducedOHCH
mm l
l Pr_3
'
= (5-93)
where: ml = Emission of type ‘l’ per kg of methanol produced, kg/kg methanol
CH3OH_Produced = Methanol production, kg/hr
Table 5-11 presents the emissions associated with natural gas combustion in
steam reformer furnace (kg/kg methanol produced).

287
Table 5-10. Uncontrolled and Controlled Emissions from Fired Heaters Firing Natural Gasa (AP-42, US EPA, 1998)
Air Emissions Uncontrolled (lb/106 cuft)
Controlled (lb/106 cuft)
PM 7.6 7.6 PM-10 no data no data SO2 0.6 0.6 SO3 no data no data NOx 142.8 71.4 CO 40 40 CO2 (Fossil) 120,000 120,000 CO2 (Biomass) no data no data CH4 2.3 2.3 HCl no data no data VOC 5.5 5.5 NH3 no data no data Hydrocarbons no data no data Metals Antimony (Sb) no data no data Arsenic (As) 2.00E-04 2.00E-06 Beryllium (Be) 1.20E-05 1.20E-07 Cadmium (Cd) 1.10E-03 1.10E-05 Chromium (Cr) 1.40E-03 1.40E-05 Cobalt (Co) 8.40E-05 8.40E-07 Copper (Cu) 8.50E-04 8.50E-06 Lead (Pb) 5.00E-04 5.00E-06 Mercury (Hg) 2.60E-04 2.60E-06 Nickel (Ni) 2.10E-03 2.10E-05 Selenium (Se) 2.40E-05 2.40E-07 Zinc (Zn) 2.90E-02 2.90E-04
a A control factor is applied only to NOx emissions (50% reduction) and trace metals (99% reduction). Controlled emissions for all others are same as their uncontrolled emissions.
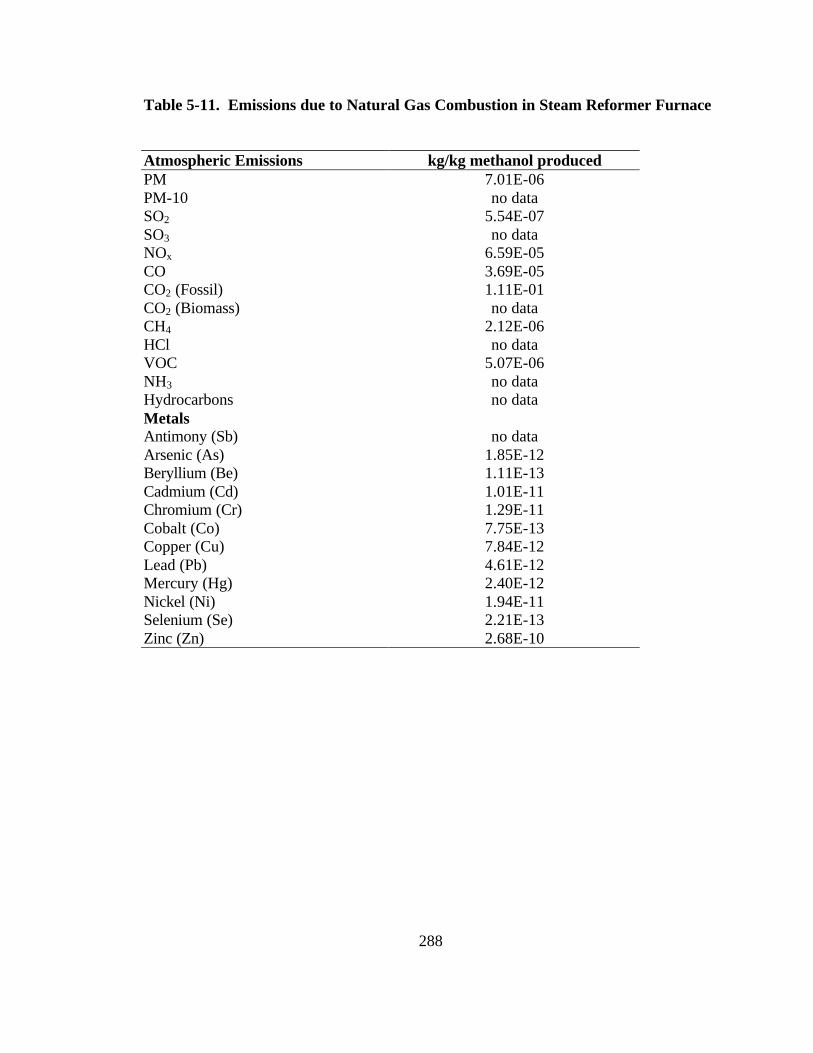
288
Table 5-11. Emissions due to Natural Gas Combustion in Steam Reformer Furnace
Atmospheric Emissions kg/kg methanol produced PM 7.01E-06 PM-10 no data SO2 5.54E-07 SO3 no data NOx 6.59E-05 CO 3.69E-05 CO2 (Fossil) 1.11E-01 CO2 (Biomass) no data CH4 2.12E-06 HCl no data VOC 5.07E-06 NH3 no data Hydrocarbons no data Metals Antimony (Sb) no data Arsenic (As) 1.85E-12 Beryllium (Be) 1.11E-13 Cadmium (Cd) 1.01E-11 Chromium (Cr) 1.29E-11 Cobalt (Co) 7.75E-13 Copper (Cu) 7.84E-12 Lead (Pb) 4.61E-12 Mercury (Hg) 2.40E-12 Nickel (Ni) 1.94E-11 Selenium (Se) 2.21E-13 Zinc (Zn) 2.68E-10
289
5.3.3.7 Pre-Combustion Emissions Associated with Natural Gas used in Process
Pre-combustion emissions associated with natural gas are presented in the electric
energy process model (Dumas, 1998). Natural gas used in a steam reformer for the
production of syngas has a flowrate of 1000 kmol/hr for the production of 28,500 kg/hr
methanol. This is the input flowrate of natural gas assumed to calculate the overall LCI of
methanol. Natural gas combusted in a steam reformer furnace is calculated in energy
balance section of process. Both of these are added to get the total natural gas used in the
process assuming that both have approximately same composition and density. Table 5-
12 presents the pre-combustion emissions per 1000 cuft of natural gas (Dumas, 1998) It
also presents the pre-combustion emissions associated with natural gas used in the
process per kg of methanol produced as calculated by Equation 5-94.
oducedOHCH
VVmm NGFEEDn
n Pr_
)(
3
''' += (5-94)
where: mn = Emission of type ‘n’, kg/kg of methanol produced
m’n = Emission of type ‘n’, kg/1000 cuft natural gas (Dumas, 1998)
V’FEED = Natural gas used in generation of syngas, 1000 cuft/hr
V’NG = Natural gas combusted in steam reformer furnace, 1000 cuft/hr
CH3OH_Produced = Methanol production, kg/hr
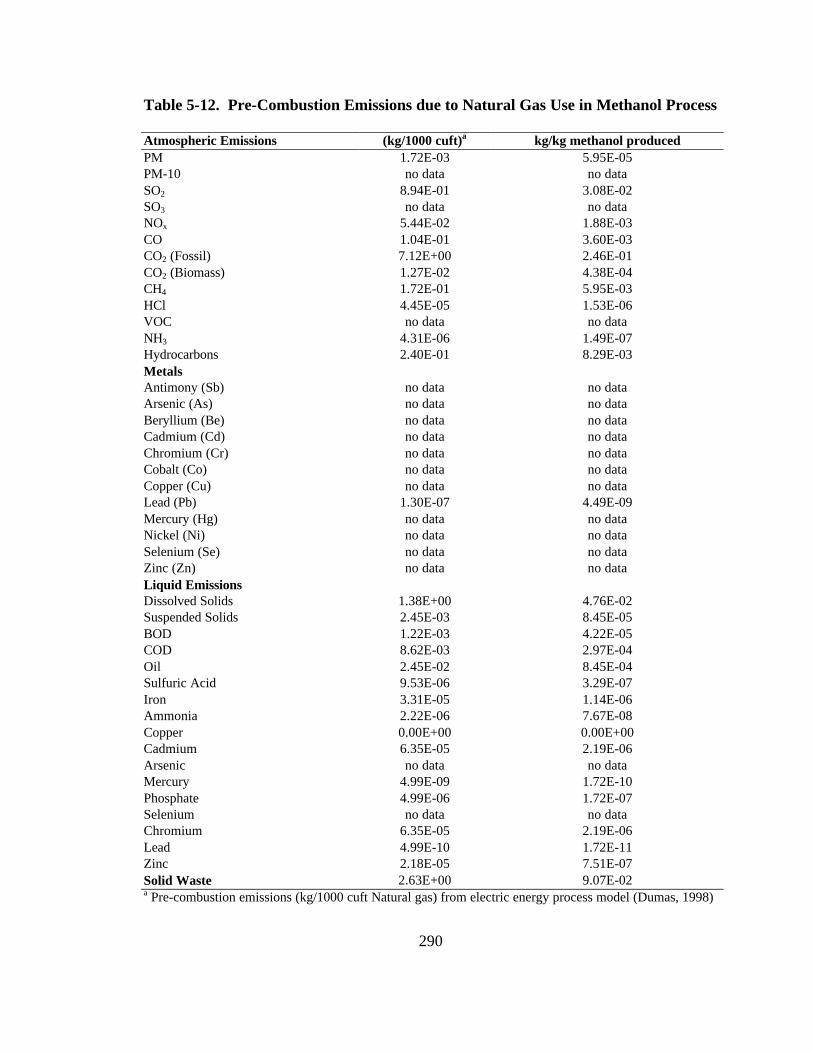
290
Table 5-12. Pre-Combustion Emissions due to Natural Gas Use in Methanol Process Atmospheric Emissions (kg/1000 cuft)a kg/kg methanol produced PM 1.72E-03 5.95E-05 PM-10 no data no data SO2 8.94E-01 3.08E-02 SO3 no data no data NOx 5.44E-02 1.88E-03 CO 1.04E-01 3.60E-03 CO2 (Fossil) 7.12E+00 2.46E-01 CO2 (Biomass) 1.27E-02 4.38E-04 CH4 1.72E-01 5.95E-03 HCl 4.45E-05 1.53E-06 VOC no data no data NH3 4.31E-06 1.49E-07 Hydrocarbons 2.40E-01 8.29E-03 Metals Antimony (Sb) no data no data Arsenic (As) no data no data Beryllium (Be) no data no data Cadmium (Cd) no data no data Chromium (Cr) no data no data Cobalt (Co) no data no data Copper (Cu) no data no data Lead (Pb) 1.30E-07 4.49E-09 Mercury (Hg) no data no data Nickel (Ni) no data no data Selenium (Se) no data no data Zinc (Zn) no data no data Liquid Emissions Dissolved Solids 1.38E+00 4.76E-02 Suspended Solids 2.45E-03 8.45E-05 BOD 1.22E-03 4.22E-05 COD 8.62E-03 2.97E-04 Oil 2.45E-02 8.45E-04 Sulfuric Acid 9.53E-06 3.29E-07 Iron 3.31E-05 1.14E-06 Ammonia 2.22E-06 7.67E-08 Copper 0.00E+00 0.00E+00 Cadmium 6.35E-05 2.19E-06 Arsenic no data no data Mercury 4.99E-09 1.72E-10 Phosphate 4.99E-06 1.72E-07 Selenium no data no data Chromium 6.35E-05 2.19E-06 Lead 4.99E-10 1.72E-11 Zinc 2.18E-05 7.51E-07 Solid Waste 2.63E+00 9.07E-02 a Pre-combustion emissions (kg/1000 cuft Natural gas) from electric energy process model (Dumas, 1998)
291
5.3.3.8 Overall LCI of Methanol Production Using Conventional Process
All of the LCI parameters associated with different operations in production of
methanol as documented in previous sections are summed to yield an overall LCI of
methanol production. The LCI parameters are presented in units of kg pollutant/kg of
methanol produced. Table 5-13 presents the LCI associated with various sections of
methanol production (steam, electricity, pre-combustion, etc.) and the overall LCI of
methanol.
There are three major contributors to the LCI of methanol: (1) the emissions
associated with natural gas pre-combustion; (2) the LCI of steam; and (3) the LCI of
electricity. For most LCI parameters, emissions associated with natural gas pre-
combustions seem to drive the overall LCI of methanol. SO2, NOx, CO, CH4, BOD, COD
and solid waste emissions are higher for natural gas pre-combustions that any other
contributor. PM emissions due to the LCI of steam and electricity are comparable with
each other and higher than any other contributor. CO2 emissions are more governed by
the LCI of electricity. Suspended solid liquid emissions due to the LCI of steam and
electricity are comparable with each other and are higher than any other contributor. Thus
different contributors govern different LCI parameters; however; natural gas pre-
combustions emissions, the LCI of steam, and the LCI of electricity are the main
contributors dictating the overall LCI of methanol.
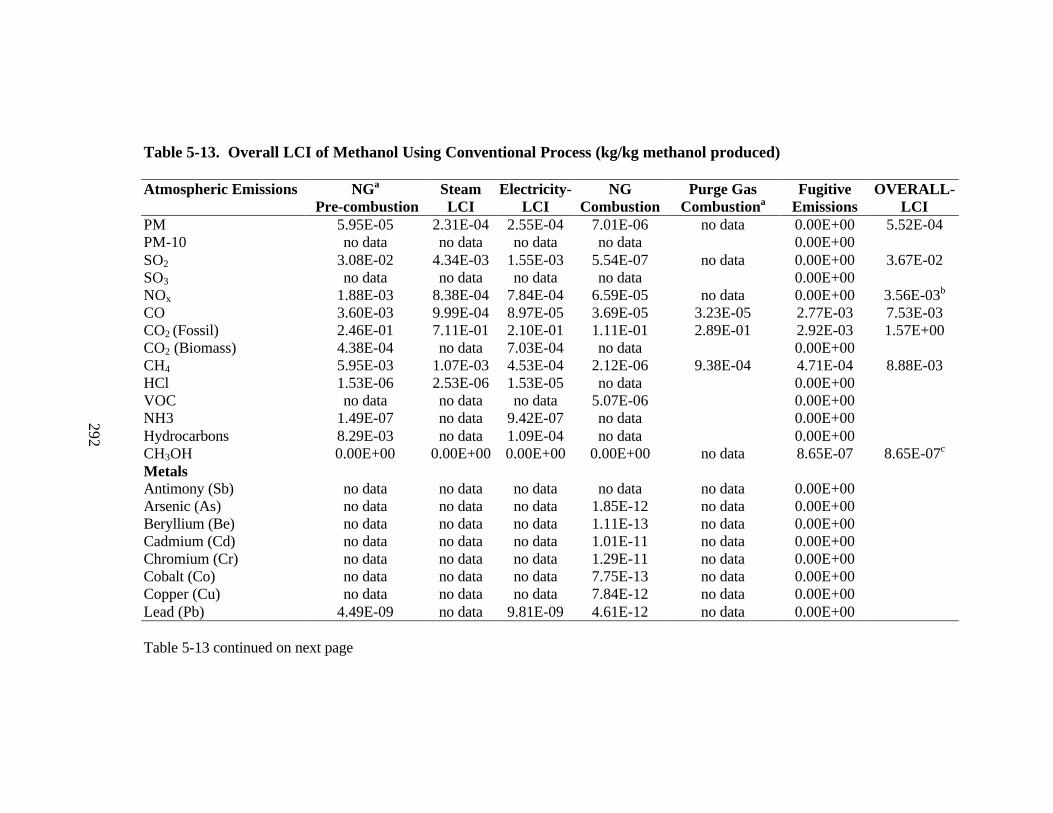
292
Table 5-13. Overall LCI of Methanol Using Conventional Process (kg/kg methanol produced) Atmospheric Emissions NGa
Pre-combustion Steam LCI
Electricity-LCI
NG Combustion
Purge Gas Combustiona
Fugitive Emissions
OVERALL-LCI
PM 5.95E-05 2.31E-04 2.55E-04 7.01E-06 no data 0.00E+00 5.52E-04 PM-10 no data no data no data no data 0.00E+00 SO2 3.08E-02 4.34E-03 1.55E-03 5.54E-07 no data 0.00E+00 3.67E-02 SO3 no data no data no data no data 0.00E+00 NOx 1.88E-03 8.38E-04 7.84E-04 6.59E-05 no data 0.00E+00 3.56E-03b
CO 3.60E-03 9.99E-04 8.97E-05 3.69E-05 3.23E-05 2.77E-03 7.53E-03 CO2 (Fossil) 2.46E-01 7.11E-01 2.10E-01 1.11E-01 2.89E-01 2.92E-03 1.57E+00 CO2 (Biomass) 4.38E-04 no data 7.03E-04 no data 0.00E+00 CH4 5.95E-03 1.07E-03 4.53E-04 2.12E-06 9.38E-04 4.71E-04 8.88E-03 HCl 1.53E-06 2.53E-06 1.53E-05 no data 0.00E+00 VOC no data no data no data 5.07E-06 0.00E+00 NH3 1.49E-07 no data 9.42E-07 no data 0.00E+00 Hydrocarbons 8.29E-03 no data 1.09E-04 no data 0.00E+00 CH3OH 0.00E+00 0.00E+00 0.00E+00 0.00E+00 no data 8.65E-07 8.65E-07c
Metals Antimony (Sb) no data no data no data no data no data 0.00E+00 Arsenic (As) no data no data no data 1.85E-12 no data 0.00E+00 Beryllium (Be) no data no data no data 1.11E-13 no data 0.00E+00 Cadmium (Cd) no data no data no data 1.01E-11 no data 0.00E+00 Chromium (Cr) no data no data no data 1.29E-11 no data 0.00E+00 Cobalt (Co) no data no data no data 7.75E-13 no data 0.00E+00 Copper (Cu) no data no data no data 7.84E-12 no data 0.00E+00 Lead (Pb) 4.49E-09 no data 9.81E-09 4.61E-12 no data 0.00E+00 Table 5-13 continued on next page
292

293
Table 5-13 continued Atmospheric Emissions NG
Pre-combustion Steam LCI
Electricity-LCI
NG Combustion
Purge Gas Combustiona
Fugitive Emissions
OVERALL-LCI
Mercury (Hg) no data no data no data 2.40E-12 no data 0.00E+00 Nickel (Ni) no data no data no data 1.94E-11 no data 0.00E+00 Selenium (Se) no data no data no data 2.21E-13 no data 0.00E+00 Zinc (Zn) no data no data no data 2.68E-10 no data 0.00E+00 Liquid Emissionsd Dissolved Solids 4.76E-02 no data 4.95E-04 0.00E+00 0.00E+00 0.00E+00 Suspended Solids 8.45E-05 1.15E-04 1.38E-04 0.00E+00 0.00E+00 0.00E+00 3.37E-04 BOD 4.22E-05 6.27E-06 5.13E-07 0.00E+00 0.00E+00 0.00E+00 4.90E-05 COD 2.97E-04 4.38E-05 7.04E-06 0.00E+00 0.00E+00 0.00E+00 3.48E-04 Oil 8.45E-04 no data 8.74E-06 0.00E+00 0.00E+00 0.00E+00 Sulfuric Acid 3.29E-07 no data 1.87E-06 0.00E+00 0.00E+00 0.00E+00 Iron 1.14E-06 no data 1.15E-05 0.00E+00 0.00E+00 0.00E+00 Ammonia 7.67E-08 no data 1.33E-07 0.00E+00 0.00E+00 0.00E+00 Copper 0.00E+00 no data 0.00E+00 0.00E+00 0.00E+00 0.00E+00 Cadmium 2.19E-06 no data 2.24E-08 0.00E+00 0.00E+00 0.00E+00 Arsenic no data no data no data 0.00E+00 0.00E+00 0.00E+00 Mercury 1.72E-10 no data 1.76E-12 0.00E+00 0.00E+00 0.00E+00 Phosphate 1.72E-07 no data 9.36E-07 0.00E+00 0.00E+00 0.00E+00 Selenium no data no data no data 0.00E+00 0.00E+00 0.00E+00 Chromium 2.19E-06 no data 2.24E-08 0.00E+00 0.00E+00 0.00E+00 Lead 1.72E-11 no data 5.43E-12 0.00E+00 0.00E+00 0.00E+00 Zinc 7.51E-07 no data 7.74E-09 0.00E+00 0.00E+00 0.00E+00 Solid Waste 9.07E-02 6.23E-02 3.84E-02 0.00E+00 0.00E+00 0.00E+00 1.91E-01 a Based on purge gas combustion efficiency of 99 percent (user input) b Does not include NOx emissions from purge gas combustion c Does not include methanol emissions from purge gas LCI dNo liquid discharges and solid waste are assumed to occur in case of purge gas LCI.
293
294
5.4 Sensitivity Analysis of the Conventional Methanol Process Model
This section presents a sensitivity analysis of the conventional methanol process
model. Four parameters were selected for study in the sensitivity analysis: (1) natural gas
composition; (2) methane conversion is the steam reformer; (3) methanol reactor
conversion; and (4) purge gas combustion efficiency. These parameters were selected for
study based on a judgment that they had the potential to significantly impact the overall
LCI of methanol production by conventional process. Each of these parameters was
varied individually over the range considered to be representative of the typical variation.
Other parameters, such as process conditions like temperatures and pressures are
typically constant for the conventional process (Cheng and Kung, 1994; Twigg, 1989).
Furthermore a small change in temperature or pressure was not expected to alter the LCI
significantly. The following subsections present the results of the sensitivity analysis for
natural gas composition, CH4 conversion in steam reformer, CO and CO2 conversion in
the methanol reactor, and purge gas combustion efficiency.
5.4.1 Sensitivity of Methanol LCI to Natural Gas Composition
Natural gas composition varies from place to place in the U.S. Table 5-14
represents the composition of natural gas found in various U.S. fields (Babcock and
Wilcox, 1972). The conventional methanol process model has the composition of natural
gas as a user input. To examine the sensitivity of the overall LCI to natural gas
composition, the natural gas composition was varied to represent each of the

295
compositions in Table 5-14, while all other parameters were held constant. Selected
model results for the various natural gas compositions are presented in Table 5-15. It
should be noted that only the results that affect the LCI of methanol are presented. Table
5-16 presents the results on per kg of methanol produced basis.
Table 5-14. Natural Gas Compositions from Various U.S. Fields (Babcock and Wilcox, 1972) Mole percent Component
Base Case (0)
Pennsylvania (1)
S. California
(2)
Ohio (3)
Los Angeles
(4)
Oklahoma (5)
CH4 90.6 83.4 84.0 93.82 90.0 84.1 C2H6 7.0 15.8 14.8 0.25 5.0 6.7 C3H8 2.1 0.0 0.0 0.00 0.0 0.0 N2 0.17 0.8 0.5 3.42 5.0 8.4 H2 0.0 0.0 0.0 1.83 0.0 0.0 CO 0.0 0.0 0.0 0.45 0.0 0.0 CO2 0.13 0.0 0.7 0.23 0.0 0.8

296
Table 5-15. Selected Model Results for Various Natural Gas Compositions Given in Table 5-14a
Model Results Base Case (0)
Pennsylvania (1)
S. California
(2)
Ohio (3)
Los Angeles
(4)
Oklahoma (5)
Methanol (kg/hr) 28500 30110 29860 23470 25200 25020 Steam Consumption (kJ/hr)b 2.24E+08 2.28E+08 2.27E+08 2.11E+08 2.16E+08 2.15E+08 Electricity Consumption (kWh) 9.11E+03 9.31E+03 9.25E+03 8.44E+03 8.70E+03 8.64E+03 Natural Gas used in Steam Reformer Furnace (106 ft3/hr) 5.80E-02
5.20E-02 5.51E-02 5.00E-02 5.10E-02 6.00E-02
Fugitive Emissions (kg/hr)c 2.07E+02 2.17E+02 2.15E+02 1.78E+02 1.91E+02 1.94E+02 Purge gas Emissionsd kg/hr kg/hr kg/hr kg/hr kg/hr kg/hr
CH4 2.67E+01 2.46E+01 2.48E+01 2.77E+01 2.66E+01 2.48E+01 H2 1.77E+01 1.80E+01 1.75E+01 1.61E+01 1.67E+01 1.56E+01 CO 9.21E-01 9.84E-01 9.18E-01 7.73E-01 8.24E-01 7.95E-01
CO2e 8.25E+03 7.73E+03 7.77E+03 8.34E+03 8.09E+03 7.61E+03
a All Columns are based on 1000 kmol/hr of Natural Gas as a starting material b Positive sign means that there is net steam consumption in methanol production process c Fugitive emissions are 0.5 percent of syngas leaving the water knockout drum. d Based on 99 percent (default) purge gas combustion in steam reformer furnace (User input) e Includes CO2 produced by percent purge gas combustion at 99 percent efficiency Table 5-16. Selected Model Results for Various Natural Gas Compositions Given in Table 5-14a on per kg of Methanol Produced Basis Model Results Base Case
(0) Pennsylvania
(1) S.
California (2)
Ohio (3)
Los Angeles (4)
Oklahoma
(5) Steam Consumption (kJ/kg)b 7.86E+03 7.58E+03 7.62E+03 9.00E+03 8.56E+03 8.61E+03 Electricity Consumption (kWh/kg) 3.20E-01 3.09E-01 3.10E-01 3.60E-01 3.45E-01 3.46E-01 Natural Gas used in Steam Reformer Furnace (106 ft3/kg) 2.03E-06 1.70E-06 1.85E-06 2.17E-06 2.02E-06 2.42E-06 Fugitive Emissions (kg/kg)c 7.25E-03 7.21E-03 7.21E-03 7.60E-03 7.60E-03 7.76E-03 Purge gas Emissionsd kg/kg kg/kg kg/kg kg/kg kg/kg kg/kg
CH4 9.38E-04 8.18E-04 8.30E-04 1.18E-03 1.05E-03 9.92E-04 H2 6.20E-04 5.98E-04 5.85E-04 6.85E-04 6.63E-04 6.24E-04 CO 3.23E-05 3.27E-05 3.07E-05 3.29E-05 3.27E-05 3.00E-05
CO2e 2.89E-01 2.57E-01 2.60E-01 3.55E-01 3.21E-01 3.04E-01
a All Columns are based on 1000 kmol/hr of Natural Gas as a starting material b Positive sign means that there is net steam consumption in methanol production process c Fugitive emissions are 0.5 percent of syngas leaving the water knockout drum. d Based on 99 percent (default) purge gas combustion in steam reformer furnace (User input) e Includes CO2 produced by percent purge gas combustion at 99 percent efficiency

297
From the results in Table 5-15, it is clear that Pennsylvania natural gas produces
the maximum amount of methanol among natural gas compositions considered on per
hour basis. This is because it has the maximum amount of ethane, which produces more
syngas per mole (two moles of CO and 5 moles of H2) as opposed to methane which
produces only one mole CO and 3 moles H2 per mole. Ohio natural gas produces the least
amount of methanol because of its high methane content and low ethane content.
The amount of steam required in the process increases with methanol production.
This increase is not in the same proportion as the methanol production since the net steam
required is the difference of steam consumed in steam reformer, methanol and DME
distillation; and steam produced in waste heat boiler and methanol reactor. Steam
consumed in the steam reformer is constant since the flowrate of raw material natural gas
is held constant at 1000 kmol/hr for all the cases. The steam produced in waste heat
boiler depends on the flowrate of syngas produced and is maximum in case of
Pennsylvania natural gas. Also the steam produced in the methanol reactor is maximum
for Pennsylvania natural gas because more syngas is converted to the methanol product.
So even though Pennsylvania natural gas has maximum steam demand in methanol
distillation, the overall steam demand does not change proportionally with methanol
production. Table 5-16 shows that for the case of Pennsylvania natural gas, the steam
demand per kg of methanol is less since highest quantity of methanol is produced by it.
For the case of Ohio natural gas, there is maximum steam demand per kg of methanol
because least amount of methanol is produced by it whereas there is not a major change
in its net steam demand as compared with other natural gas compositions.
298
Electricity is consumed in the natural gas compressor and syngas compressor. The
variation in electricity consumption on per hour basis is not wide among various natural
gas compositions considered because there is not a major difference in the flowrate of
natural gas and syngas. Electricity demand for the case of Pennsylvania natural gas is
highest on per hour basis but it is not in same proportion as the methanol production. As a
result, the electricity consumption is the least on per kg of methanol produced basis for
the case of Pennsylvania natural gas. For the case of Ohio natural gas, there is maximum
electricity demand per kg of methanol because least amount of methanol is produced by it
whereas there is not a major change in the electricity demand as compared with other
natural gas compositions.
Fugitive emissions occur in water knockout drum of the methanol production
process and are 0.5 mole percent of the syngas entering the water knock out drum. Thus
more the syngas production per hour more would be the fugitive emissions. Since
Pennsylvania natural gas produces more syngas (on molar basis) for the same molar
flowrate of natural gas, it has highest fugitive emissions on per hour basis. However, on
per kg of methanol basis, Pennsylvania natural gas has least amount of fugitive emissions
because fugitive emissions do not vary widely among various natural gas compositions
whereas methanol production does.
The purge gas combustion efficiency in the steam reformer furnace has been
assumed to be 99 percent for all the natural gas compositions considered. This is a user-

299
defined input and can be altered. The natural gas that has a higher N2 and CO2 content
also has a higher N2 and CO2 content in purge gas on per hour basis. Both of these gases
are non-combustible and do not contribute to heating when purge gas is combusted. As a
result, the purge gas with higher content of these of N2 and CO2 produces less heat on
combustion due to which more natural gas has to be supplied to the steam reformer
furnace on per hour basis to provide the heat for reforming reactions. Thus, the Oklahoma
natural gas with the highest N2 and CO2 content uses the highest amount of natural gas in
the steam reformer whereas Los Angles and Ohio natural gases having lower N2 and CO2
content use lower amounts of natural gas in the steam reforming furnace on per hour
basis. Table 5-16 presents the purge gas emissions and natural gas combustion on per kg
of methanol produced basis. The trends in Table 5-16 change from that in Table 5-15
because of wide variation in the methanol production.
Table 5-17 presents the LCI of methanol for the base case natural gas
composition. Some of the parameters in the total methanol LCI are blank due to no
availability of data for those parameters in the contributing columns. Only the parameters
that appear in the total methanol LCI are presented. Table 5-18 presents the LCI of
methanol based on Pennsylvania natural gas and the percentage difference with respect to
the base case LCI. Pennsylvania natural gas was selected for comparison because its
composition varies widely from the base case natural gas composition.
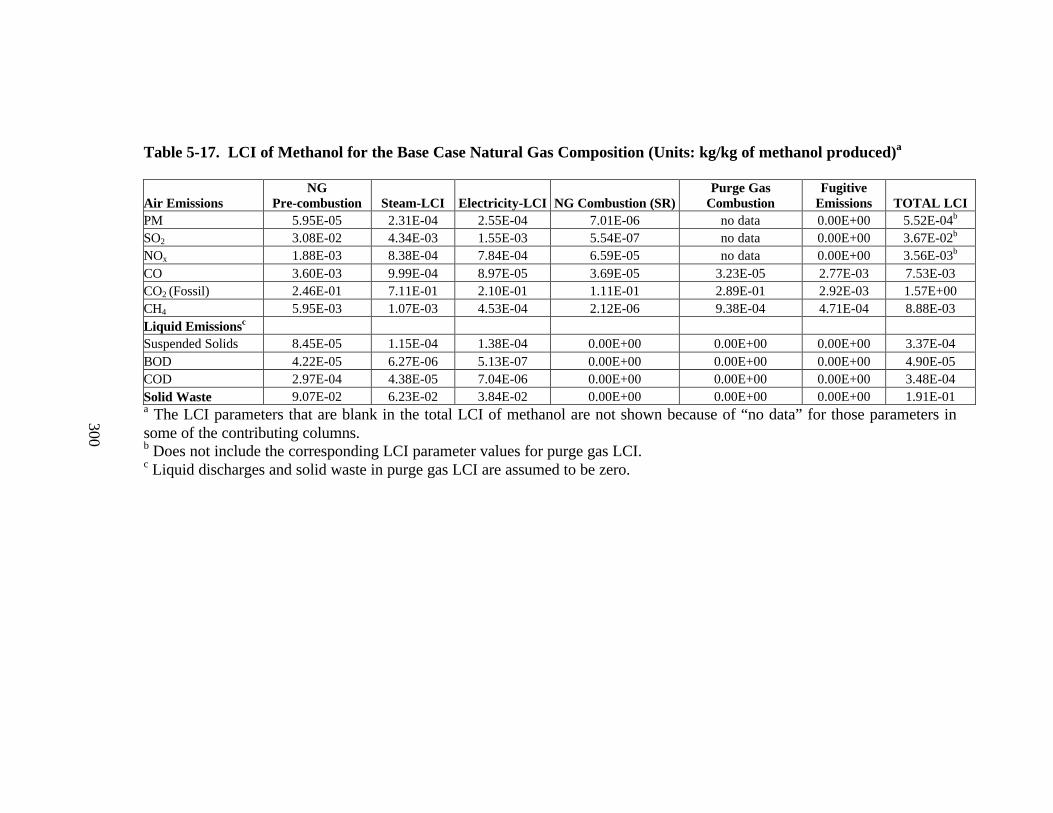
Table 5-17. LCI of Methanol for the Base Case Natural Gas Composition (Units: kg/kg of methanol produced)a
Air Emissions NG
Pre-combustion Steam-LCI Electricity-LCI NG Combustion (SR) Purge Gas
Combustion Fugitive
Emissions TOTAL LCI PM 5.95E-05 2.31E-04 2.55E-04 7.01E-06 no data 0.00E+00 5.52E-04b
SO2 3.08E-02 4.34E-03 1.55E-03 5.54E-07 no data 0.00E+00 3.67E-02b
NOx 1.88E-03 8.38E-04 7.84E-04 6.59E-05 no data 0.00E+00 3.56E-03b
CO 3.60E-03 9.99E-04 8.97E-05 3.69E-05 3.23E-05 2.77E-03 7.53E-03 CO2 (Fossil) 2.46E-01 7.11E-01 2.10E-01 1.11E-01 2.89E-01 2.92E-03 1.57E+00 CH4 5.95E-03 1.07E-03 4.53E-04 2.12E-06 9.38E-04 4.71E-04 8.88E-03 Liquid Emissionsc Suspended Solids 8.45E-05 1.15E-04 1.38E-04 0.00E+00 0.00E+00 0.00E+00 3.37E-04 BOD 4.22E-05 6.27E-06 5.13E-07 0.00E+00 0.00E+00 0.00E+00 4.90E-05 COD 2.97E-04 4.38E-05 7.04E-06 0.00E+00 0.00E+00 0.00E+00 3.48E-04 Solid Waste 9.07E-02 6.23E-02 3.84E-02 0.00E+00 0.00E+00 0.00E+00 1.91E-01 a The LCI parameters that are blank in the total LCI of methanol are not shown because of “no data” for those parameters in some of the contributing columns. b Does not include the corresponding LCI parameter values for purge gas LCI. c Liquid discharges and solid waste in purge gas LCI are assumed to be zero.
300
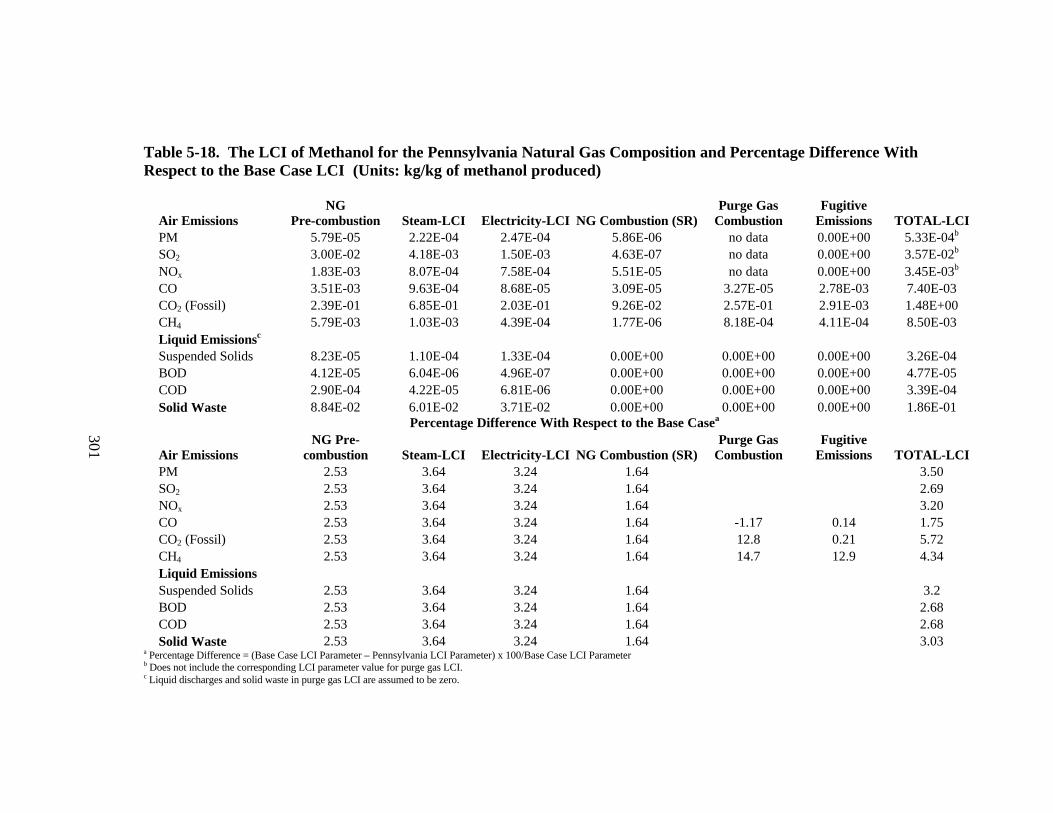
301
Table 5-18. The LCI of Methanol for the Pennsylvania Natural Gas Composition and Percentage Difference With Respect to the Base Case LCI (Units: kg/kg of methanol produced)
Air Emissions NG
Pre-combustion Steam-LCI Electricity-LCI NG Combustion (SR) Purge Gas
Combustion Fugitive
Emissions TOTAL-LCI PM 5.79E-05 2.22E-04 2.47E-04 5.86E-06 no data 0.00E+00 5.33E-04b SO2 3.00E-02 4.18E-03 1.50E-03 4.63E-07 no data 0.00E+00 3.57E-02b NOx 1.83E-03 8.07E-04 7.58E-04 5.51E-05 no data 0.00E+00 3.45E-03b CO 3.51E-03 9.63E-04 8.68E-05 3.09E-05 3.27E-05 2.78E-03 7.40E-03 CO2 (Fossil) 2.39E-01 6.85E-01 2.03E-01 9.26E-02 2.57E-01 2.91E-03 1.48E+00 CH4 5.79E-03 1.03E-03 4.39E-04 1.77E-06 8.18E-04 4.11E-04 8.50E-03 Liquid Emissionsc Suspended Solids 8.23E-05 1.10E-04 1.33E-04 0.00E+00 0.00E+00 0.00E+00 3.26E-04 BOD 4.12E-05 6.04E-06 4.96E-07 0.00E+00 0.00E+00 0.00E+00 4.77E-05 COD 2.90E-04 4.22E-05 6.81E-06 0.00E+00 0.00E+00 0.00E+00 3.39E-04 Solid Waste 8.84E-02 6.01E-02 3.71E-02 0.00E+00 0.00E+00 0.00E+00 1.86E-01
Percentage Difference With Respect to the Base Casea
Air Emissions NG Pre-
combustion Steam-LCI Electricity-LCI NG Combustion (SR) Purge Gas
Combustion Fugitive
Emissions TOTAL-LCI PM 2.53 3.64 3.24 1.64 3.50 SO2 2.53 3.64 3.24 1.64 2.69 NOx 2.53 3.64 3.24 1.64 3.20 CO 2.53 3.64 3.24 1.64 -1.17 0.14 1.75 CO2 (Fossil) 2.53 3.64 3.24 1.64 12.8 0.21 5.72 CH4 2.53 3.64 3.24 1.64 14.7 12.9 4.34 Liquid Emissions Suspended Solids 2.53 3.64 3.24 1.64 3.2 BOD 2.53 3.64 3.24 1.64 2.68 COD 2.53 3.64 3.24 1.64 2.68 Solid Waste 2.53 3.64 3.24 1.64 3.03
a Percentage Difference = (Base Case LCI Parameter – Pennsylvania LCI Parameter) x 100/Base Case LCI Parameter b Does not include the corresponding LCI parameter value for purge gas LCI. c Liquid discharges and solid waste in purge gas LCI are assumed to be zero.
301

302
From Table 5-18 it is clear that percentage variation between the components of
the overall LCI among base case natural gas composition and Pennsylvania natural gas
composition is quite small. The difference occurs due to more steam consumption, more
electricity consumption, more natural gas consumption in steam reformer furnace, more
purge gas and fugitive emissions per kg of methanol in the base case as compared to
Pennsylvania natural gas as presented in Table 5-16. The variation in CH4 content from
purge gas combustion and fugitive emissions is high because base case natural gas has
higher CH4 content as compared to Pennsylvania natural gas that ends up in purge and
fugitive emissions. Also variation in CO2 content from purge gas combustion is high
because more CH4 in purge gases is combusted to produce higher CO2 in case of the base
case. The variation in overall LCI is quite small and within ± 10 to 15 percent. It should
be noted that methanol emission from storage tanks has not been included as a LCI
parameter in the sensitivity analysis because it remains constant for all the cases
considered (8.65E-07 kg/kg methanol produced).
Natural gas pre-combustion emissions (on per 1000 ft3 basis) are assumed to be
the same for all the natural gases considered. This is one of the sources of uncertainty.
Purge gas combustion efficiency is a user-input as is assumed to be 99 percent. This
efficiency may vary thereby contributing another source of uncertainty. Fugitive
emissions are estimated to be 0.5 percent of syngas entering the water knockout drum
(Overcash, 1999). This is another factor that is uncertain. So given the uncertainties
involved in the calculating the LCI of methanol, it can be said that the LCI of methanol is
not very sensitive to the natural gas composition used. Table 5-19 presents the overall
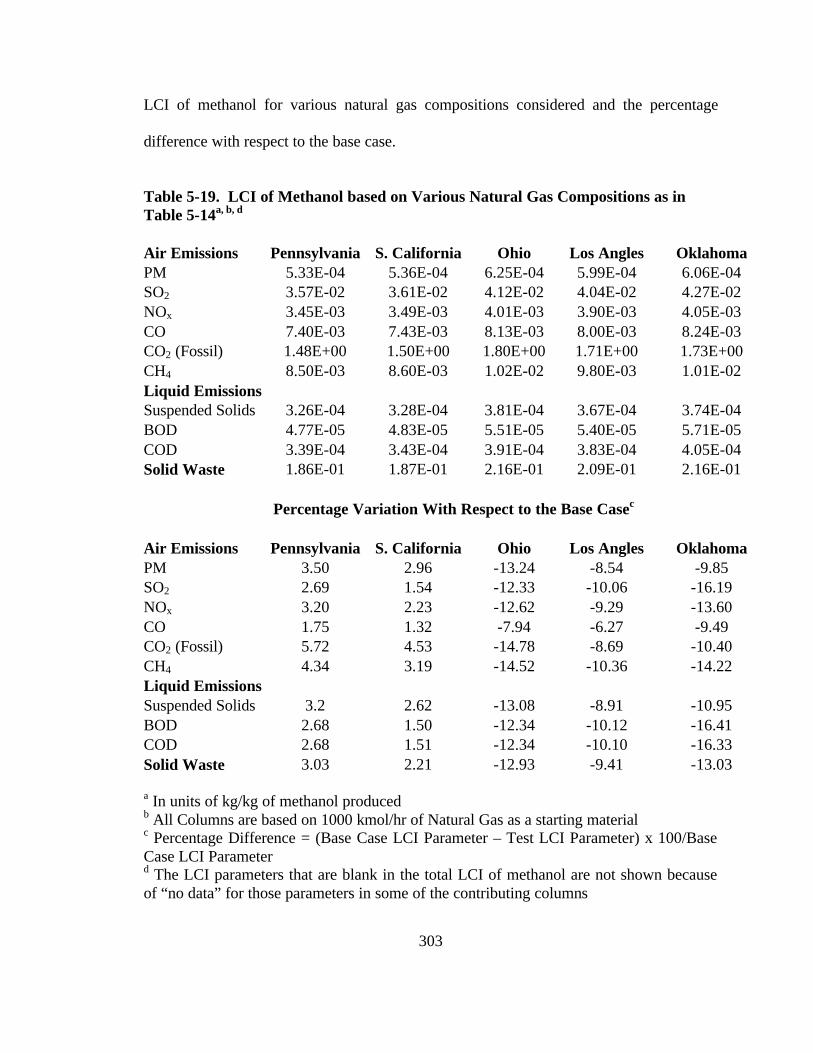
303
LCI of methanol for various natural gas compositions considered and the percentage
difference with respect to the base case.
Table 5-19. LCI of Methanol based on Various Natural Gas Compositions as in Table 5-14a, b, d Air Emissions Pennsylvania S. California Ohio Los Angles Oklahoma PM 5.33E-04 5.36E-04 6.25E-04 5.99E-04 6.06E-04 SO2 3.57E-02 3.61E-02 4.12E-02 4.04E-02 4.27E-02 NOx 3.45E-03 3.49E-03 4.01E-03 3.90E-03 4.05E-03 CO 7.40E-03 7.43E-03 8.13E-03 8.00E-03 8.24E-03 CO2 (Fossil) 1.48E+00 1.50E+00 1.80E+00 1.71E+00 1.73E+00 CH4 8.50E-03 8.60E-03 1.02E-02 9.80E-03 1.01E-02 Liquid Emissions Suspended Solids 3.26E-04 3.28E-04 3.81E-04 3.67E-04 3.74E-04 BOD 4.77E-05 4.83E-05 5.51E-05 5.40E-05 5.71E-05 COD 3.39E-04 3.43E-04 3.91E-04 3.83E-04 4.05E-04 Solid Waste 1.86E-01 1.87E-01 2.16E-01 2.09E-01 2.16E-01
Percentage Variation With Respect to the Base Casec Air Emissions Pennsylvania S. California Ohio Los Angles Oklahoma PM 3.50 2.96 -13.24 -8.54 -9.85 SO2 2.69 1.54 -12.33 -10.06 -16.19 NOx 3.20 2.23 -12.62 -9.29 -13.60 CO 1.75 1.32 -7.94 -6.27 -9.49 CO2 (Fossil) 5.72 4.53 -14.78 -8.69 -10.40 CH4 4.34 3.19 -14.52 -10.36 -14.22 Liquid Emissions Suspended Solids 3.2 2.62 -13.08 -8.91 -10.95 BOD 2.68 1.50 -12.34 -10.12 -16.41 COD 2.68 1.51 -12.34 -10.10 -16.33 Solid Waste 3.03 2.21 -12.93 -9.41 -13.03
a In units of kg/kg of methanol produced b All Columns are based on 1000 kmol/hr of Natural Gas as a starting material c Percentage Difference = (Base Case LCI Parameter – Test LCI Parameter) x 100/Base Case LCI Parameter d The LCI parameters that are blank in the total LCI of methanol are not shown because of “no data” for those parameters in some of the contributing columns
304
In Table 5-19, for the cases of Ohio, Los Angles and Oklahoma natural gas, the
LCI parameters vary up to 17 percent with respect to the base case. This trend is
explained by Table 5-16 which shows higher consumption of steam, electricity, and
natural gas in steam reformer for these cases with respect to the base case on per kg of
methanol produced basis. The variation can be explained in similar fashion as for the case
of Pennsylvania natural gas in Table 5-18.
5.4.2 Sensitivity of Methanol LCI to Methane Conversion in the Steam Reformer
The conversion of CH4 in a steam reformer is reported to vary from 80 to 95
percent in a conventional methanol production process (Cheng and Kung, 1994; Twigg,
1989). The conversion of CH4 is defined as a user input in the mass balance sub-model in
the EXCEL spreadsheet. The CH4 conversion in steam reformer was varied from 80 to 95
percent (80, 85, and 95 percent), while holding other process parameters such as
temperature and pressures at their default values. The natural gas composition used is the
same as in the base case (Section 5.3.1). Table 5-20 presents the results of parameters that
affect the LCI of methanol as the CH4 conversion in steam reformer changes. Table 5-21
presents the same results on per kg of methanol produced basis.

305
Table 5-20. Model Results for Various CH4 Conversions in the Steam Reformera
CH4 Conversion in Steam Reformer Model Results 80 percent 81.46 percent
(Base Case) 90 percent 95 percent
Methanol (kg/hr) 28100 28500 30800 32200 Net Steam Consumption (kJ/hr)b 2.23E+08 2.24E+08 2.29E+08 2.33E+08 Electricity Consumption (kWh) 9.05E+03 9.11E+03 9.43E+03 9.62E+03 Natural Gas used in Steam Reformer Furnace (106 ft3/hr) 4.84E-02 5.80E-02 1.14E-01 1.46E-01 Fugitive Emissions (kg/hr)c 2.05E+02 2.07E+02 2.16E+02 2.22E+02 Purge Gas Emissionsd kg/hr kg/hr kg/hr kg/hr
CH4 2.88E+01 2.67E+01 1.44E+01 7.21E+00 H2 1.74E+01 1.77E+01 1.93E+01 2.03E+01 CO 9.08E-01 9.21E-01 9.98E-01 1.04E+00
CO2e 8.81E+03 8.25E+03 4.98E+03 3.06E+03
a Based on 1000 kmol/hr of natural gas used with the base case composition b Positive sign means that there is a net steam consumption in methanol production c 0.5 percent of syngas entering the water knockout drum. d Based on 99 percent (default) purge gas combustion in steam reformer furnace (user- input) e Includes CO2 produced by purge gas combustion at 99 percent efficiency.
Table 5-21. Model Results for Various CH4 Conversions in the Steam Reformer on per kg of Methanol Produced Basis CH4 Conversion in Steam Reformer Model Results 80 percent 81.46 percent
(Base Case) 90 percent 95 percent
Net Steam Consumption (kJ/kg)a 7.94E+03 7.86E+03 7.45E+03 7.24E+03 Electricity Consumption (kWh/kg) 3.22E-01 3.20E-01 3.06E-01 2.99E-01 Natural Gas used in Steam Reformer Furnace (106 ft3/kg) 1.72E-06 2.03E-06 3.69E-06 4.55E-06 Fugitive Emissions (kg/kg)b 7.30E-03 7.25E-03 7.02E-03 6.90E-03 Purge Gas Emissionsc kg/kg kg/kg kg/kg kg/kg
CH4 1.03E-03 9.38E-04 4.68E-04 2.24E-04 H2 6.19E-04 6.20E-04 6.26E-04 6.30E-04 CO 3.23E-05 3.23E-05 3.23E-05 3.24E-05
CO2d 3.14E-01 2.89E-01 1.61E-01 9.50E-02
a Positive sign means that there is a net steam consumption in methanol production b 0.5 percent of syngas entering the water knockout drum. c Based on 99 percent (default) purge gas combustion in steam reformer furnace (user- input) d Includes CO2 produced by purge gas combustion at 99 percent efficiency.

306
As seen in Table 5-20, methanol production increases with the increase in CH4
conversion in the reactor due to production of more quantity of syngas. Steam
consumption also increases but the variation in steam demand in not large due to the fact
that if more steam is consumed in methanol distillation because of higher methanol
production, more steam is produced in the waste heat boiler and the methanol reactor so
the net effect is a small increase in overall steam demand with CH4 conversion. Steam
demand per kg of methanol produced decreases with increase in CH4 conversion since
variation in steam demand is small whereas variation in methanol production is great
(Table 5-21). Electricity demand also increases with more CH4 conversion since syngas
compressor consumes more power to compress higher amount of syngas. However the
increase in electricity demand is not in same proportion as methanol production. As a
result, the electricity consumed per kg of methanol produced decreases (Table 5-21).
As the CH4 conversion increases, less amount of CH4 is available in the purge gas
and therefore less heat is produced by purge gas on combustion. Hence more natural gas
needs to be supplied in the steam reformer furnace. Thus natural gas increases per kg of
methanol produced as the CH4 conversion increases (Table 5-21). With increasing CH4
conversion, more syngas is produced and therefore the amount of H2 in the purge gas
increases and CO remains the same per kg of methanol produced (Table 5-21). CO2
emissions in purge gas decrease because the amount of CH4 combusted in the steam
reformer furnace to produce CO2 decreases. Fugitive emissions (equal to 0.5 mole
percent of syngas entering the water knockout drum) increase because the molar flowrate
of syngas increases with increasing CH4 conversion.

307
Table 5-22 presents the overall LCI of methanol for various CH4 conversions and
percentage difference with respect to the base case.
Table 5-22. Overall LCI of Methanol for Different CH4 Conversions and the Percentage Difference With Respect to the Base Case (Units: kg/kg of methanol) CH4 Conversion in Steam Reformer Air Emissions 80 Percent 90 Percent 95 Percent PM 5.56E-04 5.34E-04 5.24E-04 SO2 3.69E-02 3.57E-02 3.52E-02 NOx 3.58E-03 3.50E-03 3.46E-03 CO 7.55E-03 7.42E-03 7.36E-03 CO2 (Fossil) 1.59E+00 1.48E+00 1.43E+00 CH4 9.05E-03 7.96E-03 7.49E-03 Liquid Emissions Suspended Solids 3.40E-04 3.23E-04 3.16E-04 BOD 4.93E-05 4.77E-05 4.70E-05 COD 3.50E-04 3.39E-04 3.34E-04 Solid Waste 1.93E-01 1.84E-01 1.81E-01
Percentage Difference With Respect to the Base Casea Air Emissions 80 Percent 90 Percent 95 Percent PM -0.63 3.36 5.11 SO2 -0.52 2.76 4.19 NOx -0.35 1.89 2.87 CO -0.27 1.46 2.21 CO2 (Fossil) -1.07 5.71 8.67 CH4 -1.94 10.35 15.72 Liquid Emissions Suspended Solids -0.77 4.10 6.23 BOD -0.51 2.73 4.14 COD -0.51 2.74 4.16 Solid Waste -0.69 3.66 5.55
a Percentage Difference = (Base Case LCI Parameter – Test LCI Parameter) x 100/Base Case LCI Parameter
308
In Table 5-22, as the CH4 conversion increases the LCI parameters show a small
decrease with respect to the base case as can be expected based on Table 5-21. The
variation in CH4 is large mainly because as the CH4 conversion increases, less CH4 is
available in purge gas and fugitive emissions, so CH4 emissions decrease with respect to
the base case. Overall the LCI parameters vary within ± 10 to 15 percent with respect to
the base case LCI.
5.4.3 Sensitivity of Methanol LCI to CO and CO2 Conversion in Methanol Reactor
The conversion of CO and CO2 in a methanol reactor is reported to vary from 95
to 99 percent in a conventional methanol production process (Cheng and Kung, 1994).
The conversion of CO and CO2 is defined as a user input in the mass balance sub-model
in the EXCEL spreadsheet. The conversion was varied from 95 to 99 percent, while
holding other process parameters, such as temperatures and pressures at their default
values. The natural gas composition used is the same as in the base case (Section 5.3.1).
Table 5-23 presents the results of parameters that affect the LCI of methanol as the
reactor conversion changes. Table 5-24 presents the same results per kg of methanol
produced.
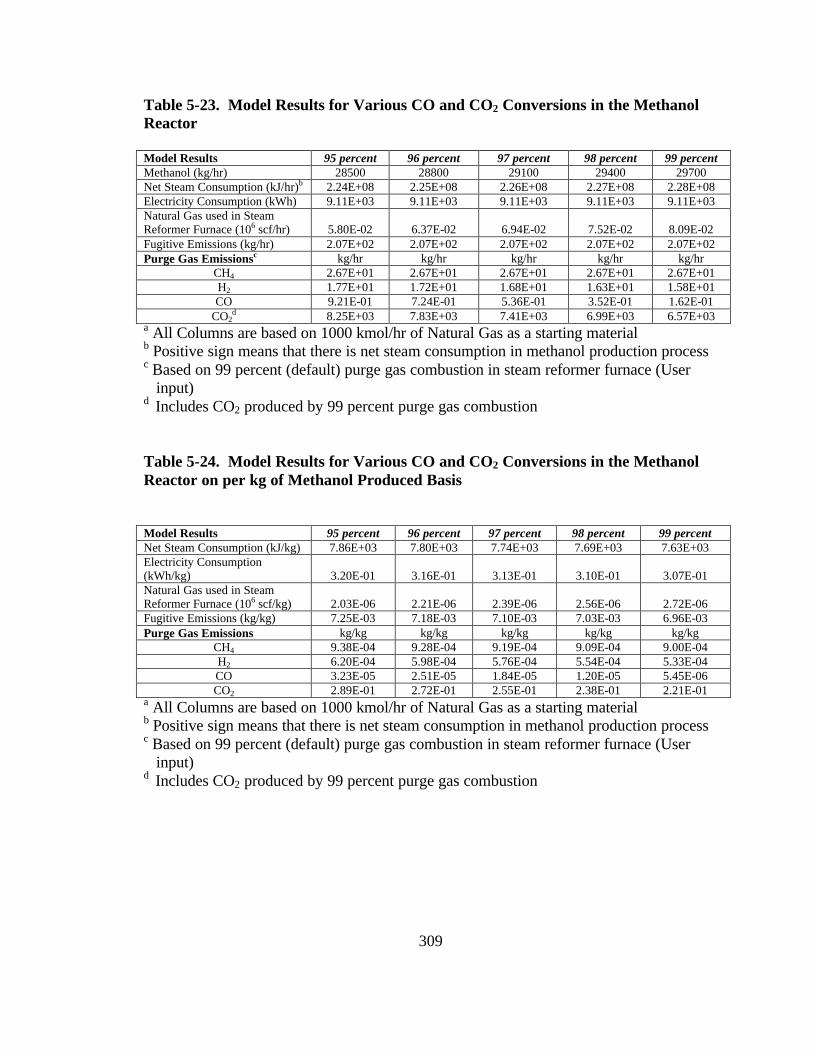
309
Table 5-23. Model Results for Various CO and CO2 Conversions in the Methanol Reactor Model Results 95 percent 96 percent 97 percent 98 percent 99 percent Methanol (kg/hr) 28500 28800 29100 29400 29700 Net Steam Consumption (kJ/hr)b 2.24E+08 2.25E+08 2.26E+08 2.27E+08 2.28E+08 Electricity Consumption (kWh) 9.11E+03 9.11E+03 9.11E+03 9.11E+03 9.11E+03 Natural Gas used in Steam Reformer Furnace (106 scf/hr) 5.80E-02 6.37E-02 6.94E-02 7.52E-02 8.09E-02 Fugitive Emissions (kg/hr) 2.07E+02 2.07E+02 2.07E+02 2.07E+02 2.07E+02 Purge Gas Emissionsc kg/hr kg/hr kg/hr kg/hr kg/hr
CH4 2.67E+01 2.67E+01 2.67E+01 2.67E+01 2.67E+01 H2 1.77E+01 1.72E+01 1.68E+01 1.63E+01 1.58E+01 CO 9.21E-01 7.24E-01 5.36E-01 3.52E-01 1.62E-01
CO2d 8.25E+03 7.83E+03 7.41E+03 6.99E+03 6.57E+03
a All Columns are based on 1000 kmol/hr of Natural Gas as a starting material b Positive sign means that there is net steam consumption in methanol production process c Based on 99 percent (default) purge gas combustion in steam reformer furnace (User input) d Includes CO2 produced by 99 percent purge gas combustion
Table 5-24. Model Results for Various CO and CO2 Conversions in the Methanol Reactor on per kg of Methanol Produced Basis
Model Results 95 percent 96 percent 97 percent 98 percent 99 percent Net Steam Consumption (kJ/kg) 7.86E+03 7.80E+03 7.74E+03 7.69E+03 7.63E+03 Electricity Consumption (kWh/kg) 3.20E-01 3.16E-01 3.13E-01 3.10E-01 3.07E-01 Natural Gas used in Steam Reformer Furnace (106 scf/kg) 2.03E-06 2.21E-06 2.39E-06 2.56E-06 2.72E-06 Fugitive Emissions (kg/kg) 7.25E-03 7.18E-03 7.10E-03 7.03E-03 6.96E-03 Purge Gas Emissions kg/kg kg/kg kg/kg kg/kg kg/kg
CH4 9.38E-04 9.28E-04 9.19E-04 9.09E-04 9.00E-04 H2 6.20E-04 5.98E-04 5.76E-04 5.54E-04 5.33E-04 CO 3.23E-05 2.51E-05 1.84E-05 1.20E-05 5.45E-06 CO2
2.89E-01 2.72E-01 2.55E-01 2.38E-01 2.21E-01 a All Columns are based on 1000 kmol/hr of Natural Gas as a starting material b Positive sign means that there is net steam consumption in methanol production process c Based on 99 percent (default) purge gas combustion in steam reformer furnace (User input) d Includes CO2 produced by 99 percent purge gas combustion

310
The results of sensitivity analysis with CO and CO2 conversion as a variable
varying from 95 to 99 percent are independent of the unit operations before methanol
reactor. Thus, electricity consumed in natural gas and syngas compressors is same since
same amount of natural gas with same composition is used for all the 5 cases. As the
conversion increases from 95 percent to 99 percent, the methanol production increases
(Table 5-23). Also since net steam consumption is controlled by the amount of steam
used in distillation of methanol and DME, the net steam consumption increases with
small variation as the CO and CO2 conversion increases from 95 to 99 percent. However,
steam consumed per kg of methanol produced decreases (Table 5-24). As the CO and
CO2 conversion increases, less unconverted syngas remains. Therefore the amount of
total purge gas decreases and less of it is available for combustion in steam reforming
furnace. Hence the amount of natural gas to be supplied to the steam reformer furnace to
maintain the heat for steam reforming reactions increases.
Fugitive emissions are a function of the syngas molar flowrate (0.5 mole percent
of syngas flowrate) and remain the same since same natural gas flowrate and composition
is used for all the cases generating same amount of syngas (Table 5-23). However, the
fugitive emissions per kg of methanol produced decrease due to increase in methanol
production (Table 5-24). All the components of purge gas except CH4 decrease with an
increase in the conversion since less purge gas remains due to higher conversion.
Methane emissions remain constant because it does not take part in the methanol
production reaction. However, CH4 emissions per kg of methanol decrease since more
methanol is produced with increasing conversion (Table 5-24).

311
Table 5-25 presents the overall LCI of methanol for various CO and CO2
conversions in methanol reactor. The case with 95 percent CO and CO2 in the reactor is
the base case. It can be seen in that as the reactor conversion increases from 95 to 99
percent, the overall LCI parameters decrease with respect to the base case. The reason for
this decrease is evident in Table 5-24, where net steam consumption, electricity
consumption, fugitive emissions and purge gas emissions decrease with increase in the
reactor conversion.
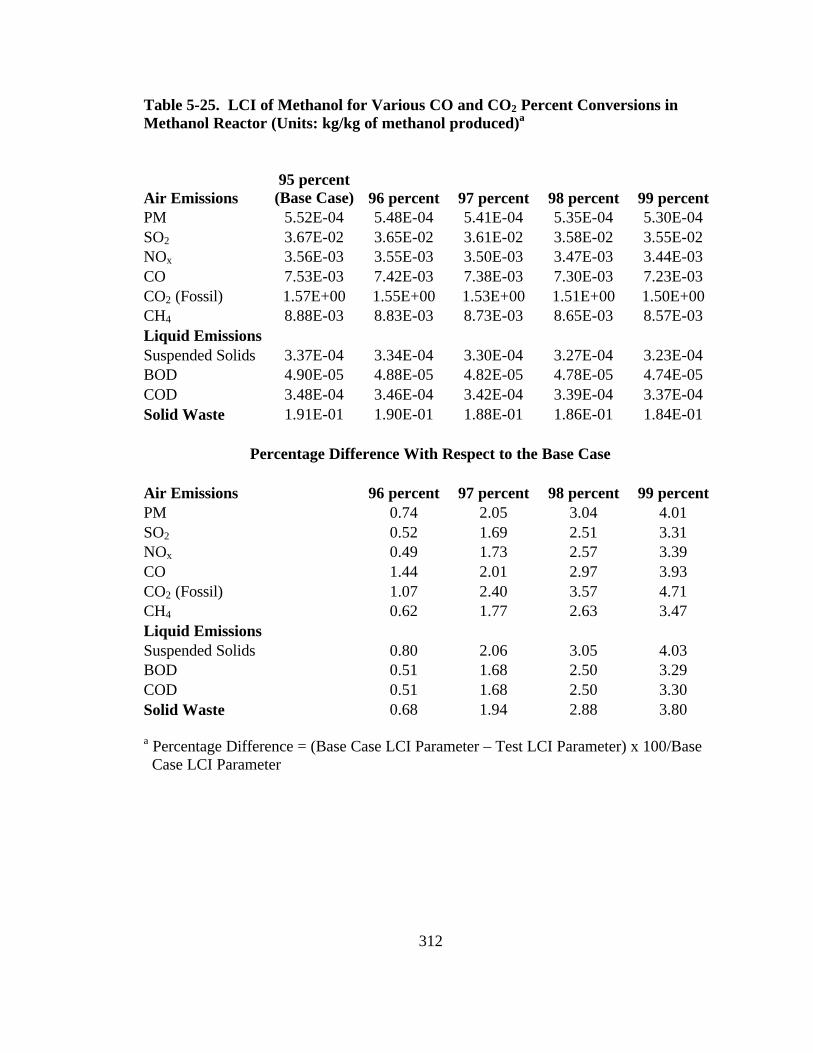
312
Table 5-25. LCI of Methanol for Various CO and CO2 Percent Conversions in Methanol Reactor (Units: kg/kg of methanol produced)a
Air Emissions 95 percent
(Base Case) 96 percent 97 percent 98 percent 99 percent PM 5.52E-04 5.48E-04 5.41E-04 5.35E-04 5.30E-04 SO2 3.67E-02 3.65E-02 3.61E-02 3.58E-02 3.55E-02 NOx 3.56E-03 3.55E-03 3.50E-03 3.47E-03 3.44E-03 CO 7.53E-03 7.42E-03 7.38E-03 7.30E-03 7.23E-03 CO2 (Fossil) 1.57E+00 1.55E+00 1.53E+00 1.51E+00 1.50E+00 CH4 8.88E-03 8.83E-03 8.73E-03 8.65E-03 8.57E-03 Liquid Emissions Suspended Solids 3.37E-04 3.34E-04 3.30E-04 3.27E-04 3.23E-04 BOD 4.90E-05 4.88E-05 4.82E-05 4.78E-05 4.74E-05 COD 3.48E-04 3.46E-04 3.42E-04 3.39E-04 3.37E-04 Solid Waste 1.91E-01 1.90E-01 1.88E-01 1.86E-01 1.84E-01
Percentage Difference With Respect to the Base Case
Air Emissions 96 percent 97 percent 98 percent 99 percent PM 0.74 2.05 3.04 4.01 SO2 0.52 1.69 2.51 3.31 NOx 0.49 1.73 2.57 3.39 CO 1.44 2.01 2.97 3.93 CO2 (Fossil) 1.07 2.40 3.57 4.71 CH4 0.62 1.77 2.63 3.47 Liquid Emissions Suspended Solids 0.80 2.06 3.05 4.03 BOD 0.51 1.68 2.50 3.29 COD 0.51 1.68 2.50 3.30 Solid Waste 0.68 1.94 2.88 3.80
a Percentage Difference = (Base Case LCI Parameter – Test LCI Parameter) x 100/Base Case LCI Parameter
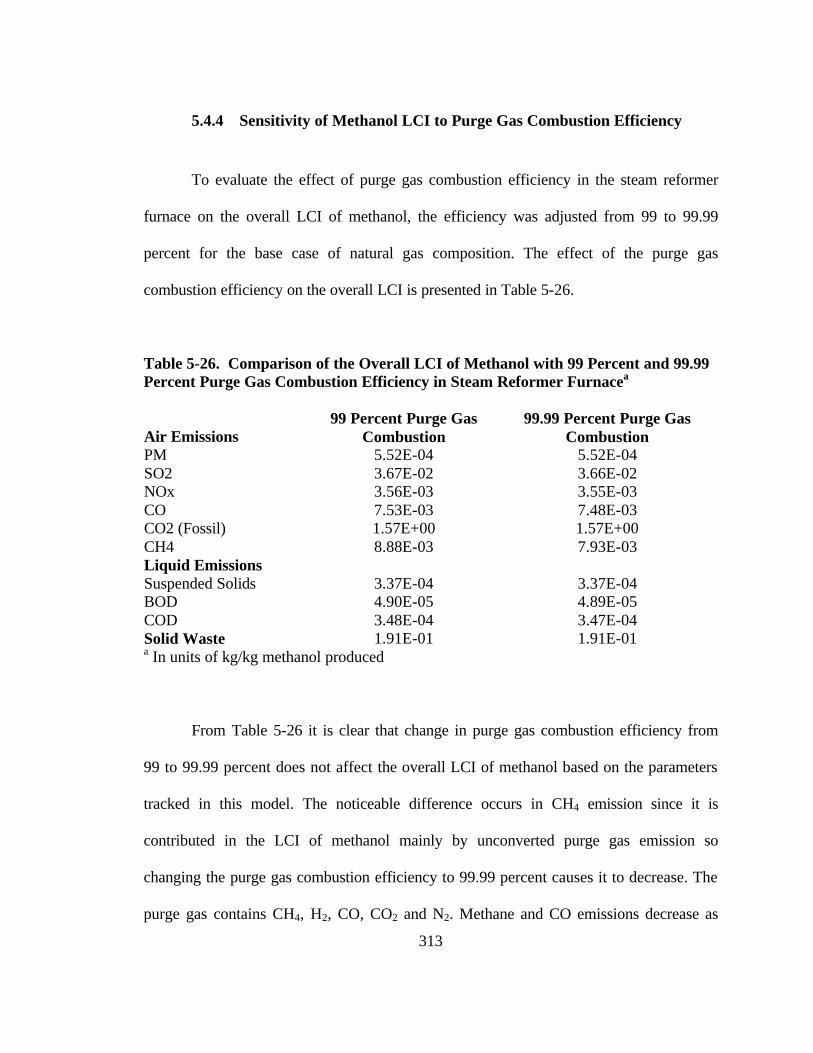
313
5.4.4 Sensitivity of Methanol LCI to Purge Gas Combustion Efficiency
To evaluate the effect of purge gas combustion efficiency in the steam reformer
furnace on the overall LCI of methanol, the efficiency was adjusted from 99 to 99.99
percent for the base case of natural gas composition. The effect of the purge gas
combustion efficiency on the overall LCI is presented in Table 5-26.
Table 5-26. Comparison of the Overall LCI of Methanol with 99 Percent and 99.99 Percent Purge Gas Combustion Efficiency in Steam Reformer Furnacea
Air Emissions 99 Percent Purge Gas
Combustion 99.99 Percent Purge Gas
Combustion PM 5.52E-04 5.52E-04 SO2 3.67E-02 3.66E-02 NOx 3.56E-03 3.55E-03 CO 7.53E-03 7.48E-03 CO2 (Fossil) 1.57E+00 1.57E+00 CH4 8.88E-03 7.93E-03 Liquid Emissions Suspended Solids 3.37E-04 3.37E-04 BOD 4.90E-05 4.89E-05 COD 3.48E-04 3.47E-04 Solid Waste 1.91E-01 1.91E-01 a In units of kg/kg methanol produced
From Table 5-26 it is clear that change in purge gas combustion efficiency from
99 to 99.99 percent does not affect the overall LCI of methanol based on the parameters
tracked in this model. The noticeable difference occurs in CH4 emission since it is
contributed in the LCI of methanol mainly by unconverted purge gas emission so
changing the purge gas combustion efficiency to 99.99 percent causes it to decrease. The
purge gas contains CH4, H2, CO, CO2 and N2. Methane and CO emissions decrease as
314
shown in Table 5-26. However the overall effect on the LCI is small because there are
other sources of CO and CH4 as illustrated in Table 5-17.
Based on the above four cases of sensitivity analysis in which natural gas
composition, CH4 conversion in the steam reformer, CO and CO2 conversion in methanol
reactor, and purge gas destruction efficiency was varied, the LCI of methanol varied
roughly within ± 10 to 15 percent with respect to the base case. Variation in natural gas
composition had the most impact on the overall LCI of methanol as compared to the
other sensitivity cases. However, given the uncertainties involved in the LCI parameters
such as estimation of fugitive emissions, natural gas pre-combustion emissions, and
purge gas destruction efficiency, the variation in overall LCI parameters is quite low.
315
6.0 CONCLUSIONS
This study documents the development of models for calculating the LCI of
methanol production from the LPMEOH and conventional production processes. The
LPMEOH process for methanol production has been modeled in ASPEN PLUS and the
results obtained from it have been used to calculate the LCI of methanol. The
conventional process of methanol production has been modeled in an EXCEL
spreadsheet in which the mass and energy balances of the process have been calculated.
The LCI of methanol produced by conventional process has been calculated in the same
spreadsheet using mass and energy balances.
The LPMEOH process model has syngas as an input to the process model. The
process model can be used to simulate methanol production from a wide variety of
syngases obtained from different sources ranging from natural gas to MSW. The LCI of
methanol is calculated using the results from the process model. The system model for
the LPMEOH process can be integrated with an IGCC system model in ASPEN PLUS to
represent the complete system for co-generation of power and methanol to study the
performance, sensitivity, and LCI of the combined system.
The sensitivity analysis on LPMEOH process model provides some insights about
the key process issues associated with it. Based on the sensitivity analysis results, it is
found that:

316
1) The performance of LPMEOH process model is sensitive to the syngas
conversion in methanol reactor.
2) Syngas conversion is shown to be dependent on reactor pressure, syngas space
velocity in methanol reactor, H2/CO molar ratio in the syngas feed, and recycle
ratio (moles recycle gas/moles fresh syngas feed).
3) For syngas compositions limited in hydrogen content, the methanol reactor must
be operated at or above 750 psig.
4) Recycling the unreacted gases back to methanol reactor has an advantage of more
methanol production compared to the case with no recycle. This is true for all
syngas compositions.
5) Syngas feeds with low H2/CO ratio has lower methanol production and higher
purge gas production than the syngas composition with high H2/CO ratio. It is
therefore recommended that the syngas compositions with lower H2/CO ratios be
adjusted via water-gas shift reaction such that H2/CO ratio increases thereby
resulting in higher methanol production and lower purge gas emissions.
6) Net steam demand in the LPMEOH process increases as the syngas becomes
leaner in hydrogen content.
Based on the sensitivity analysis of the LPMEOH process, key parameters that are
important in integrating the LPMEOH process model with an IGCC system are: (1) net
steam demand in the LPMEOH process; (2) electricity consumption in the LPMEOH
process; (3) purge gas production in the LPMEOH process; and (4) the composition of
syngas produced in a gasifier. First two parameters are important because electricity and

317
steam demands of the LPMEOH process are expected to be met by power and steam
generation in an IGCC system. Purge gas production becomes important if it is
combusted in the IGCC system to generate additional power and steam. Syngas
composition depends on the type of fuel gasified in a gasifier and relates directly to the
production of methanol as discussed previously. If an IGCC system operates on a fuel
that is derived from waste such as refuse derived fuel or RDF, the syngas generated is
limited in its hydrogen content. For a syngas limited in its hydrogen content, it is
recommended to include a water-gas shift reactor prior to the LPMEOH process so that
the H2/CO ratio of the syngas increases thereby resulting in higher methanol production.
The effect of an LPMEOH process model on gasification system would be an
incremental increase in fuel use. The incremental increase in fuel use would cause
increase in sulfur recovered, slag production, and perhaps some incremental air pollution
emission. The steam usage in the LPMEOH process would be internal to the plant since
input to the gasification co-production plant is raw water. The purge gas generated in the
LPMEOH process would be combusted with very high combustion efficiency in gas
turbine section of the IGCC plant. Electricity demand in the LPMEOH process would be
met by gross power production in the combined system.
For the LCI of methanol using LPMEOH process starting with syngas, purge gas
LCI controls most LCI parameters. The negative LCI parameters in the overall LCI are
due to steam production offsets. The second largest contributor to the overall LCI is the
LCI associated with steam consumption and the third largest contributor is the LCI

318
associated with electricity consumption. The contribution of the LCI associated with
BOD removal is lower than the contributions from above three but is higher for one LCI
parameter, BOD. The contributions from the LCI associated with fugitive emissions and
storage tank emissions are quite low. It should be noted, however, that the LCI of purge
gas combustion is highly uncertain since a default combustion efficiency of 99 percent
has been assumed for the purge gas. The purge gas combustion efficiency is a user
specified input and can be altered if a better combustion efficiency data is available.
The sensitivity analysis of methanol LCI in case of LPMEOH process shows that
overall methanol LCI varies widely with change in syngas composition and process
conditions such as reactor pressure, syngas space velocity in methanol reactor, and the
recycle ratio. The main contribution to the overall LCI occurs from the purge gas
combustion to produce steam in a boiler. The steam so generated offsets the emissions
from other contributors of LCI. As discussed in previous paragraph, the LCI of purge gas
is quite uncertain and therefore the judgment regarding the sensitivity to LCI parameters
cannot be based on it.
The EXCEL spreadsheet model for conventional methanol production can be used
to calculate the LCI of methanol from conventional process. For the LCI of methanol
using the conventional process, there are three main contributors: (1) the LCI parameters
associated with natural gas pre-combustion; (2) the LCI of steam; and (3) the LCI of
electricity. For most LCI parameters, emissions associated with natural gas pre-
combustion drive the overall LCI of methanol. Sulfur dioxide, NOx, CO, CH4, BOD,
319
COD and solid waste emissions are higher for natural gas pre-combustion than any other
contributor. Particulate matter emissions due to the LCI of steam and electricity are
comparable with each other and are higher than any other contributor. Carbon dioxide
emissions are governed by the LCI of electricity. Suspended solid emissions, in liquid
discharge, due to the LCI of steam and electricity are comparable with each other and are
higher than any other contributor. Thus different contributors govern different LCI
parameters; however; natural gas pre-combustion emissions, the LCI of steam, and the
LCI of electricity are the main contributors in the overall LCI of methanol by
conventional process. Particulate emissions in case of steam are based on the user
specified control efficiency and can be expected to be uncertain. PM emissions may
therefore be a weak LCI parameter.
Syngas in the conventional process is obtained from steam reforming of natural
gas. The model has the capability to calculate the LCI of conventional methanol for a
scenario in which natural gas composition, methane conversion, and methanol reactor
conversion change. The sensitivity analysis of the conventional methanol process reveals
that the LCI parameters are not very sensitive to the variations in natural gas
composition, methane conversion in steam reformer, syngas conversion in methanol
reactor, and purge gas combustion efficiency. The LCI parameters vary within ± 10 to 15
percent for a typical variation in natural gas composition, methane conversion in steam
reformer, syngas conversion in methanol reactor, and purge gas combustion efficiency.
320
Since the LCI of methanol, both from LPMEOH and conventional process,
require the LCI of steam, it is also developed and documented. Watertube boiler was
chosen to be the representative boiler for steam generation and coal, fuel oil, and natural
gas were the typical fuels considered for steam generation. The controlled emissions were
estimated based on steam allocation to various boilers (by fuel type) depending on the
boiler population. The LCI associated with boiler feed water pretreatment and air
pollution control equipment was included to evaluate the overall LCI of steam. The LCI
of electricity has also been presented and can be used wherever electricity is an input or
output.
Ultimately it is necessary to compare the LCI of methanol produced by
conventional process with that by the LPMEOH process to determine if there is any
advantage to methanol production by using LPMEOH technology on syngas derived
from MSW gasification. To calculate the overall LCI of methanol by the LPMEOH
process, the LCI associated with gasification must be included once it is complete.
However, preliminary comparison of the LCI of LPMEOH process (not including
gasification) with the LCI of conventional methanol reveals that CO emissions in the case
of LPMEOH process have same order of magnitude as CO emissions from conventional
process. The BOD emissions in case of LPMEOH process are higher than that from
conventional process even when gasification emissions are not included. The key things
that need to be known in calculating the LCI associated with gasification are:
1) The pre-combustion emissions associated with the fuel gasified.
321
2) The LCI associated with oxygen separation plant for oxygen supply to the
gasifier.
3) Emission offsets associated with sulfur and slag production.
Carbon monoxide and BOD emissions may compare differently with the
conventional LCI once the LCI of overall system is calculated for the LPMEOH process.
If the fuel pre-combustion emissions and the LCI associated with oxygen separation plant
are not significant, the combined methanol production would prove to be more
environmentally benign as compared to the conventional process. Accurate assessment
cannot be made because of the non-availability of the LCI associated with the above three
contributors in case of gasification
Based on certain limitations of this study, following recommendation/suggestions
for future work are made:
1) A need for more accurate data for purge gas combustion efficiency. The data can
be obtained from industrial sources. Also, the typical NOx emissions can be
estimated from flue gas emissions test for purge gas combustion in a process
industry.
2) A need for fuel pre-combustion emissions data for fuel gasified in an IGCC
system.
3) A need for the LCI of sulfur and slag for calculation of emission offset associated
with their production.

322
4) It would be important to combine the process model of LPMEOH process and the
IGCC system for doing the overall sensitivity analysis of the system. This will
provide insights into the overall performance and the LCI of the methanol
produced form the LPMEOH process.
323
7.0 REFERENCES
40 CFR Part 60 (1999); Standards of Performance for Small Industrial-Commercial-
Institutional Steam Generating Units, subpart Dc – Standards of Performance for steam
generating unit for which construction, modification, or reconstruction is commenced
after June 9, 1989, July.
Air Products and Chemicals, Inc. (1996). “LPMEOHTM – Environmental Information
Volume”, Prepared by Air Products and Chemicals, Inc. for U.S. DOE. Work performed
under contract DE-FC22-92PC-90543, Kingsport, TN, May.
Air Products and Chemicals, Inc. (1997), “Commercial Scale Demonstration of Liquid
Phase Methanol (LPMEOHTM) Process”, Quarterly Report, Prepared by Air Products and
Chemicals, Inc. for U.S. Department of Energy, Work performed under contract no. DE-
FC22-92PC90543, July 1 – September 30.
Air Products and Chemicals, Inc. (1998). “Economic Analysis of LPMEOHTM Process as
an add-on to Integrated Gasification Combined Cycle (IGCC) for Coproduction”.
Prepared by Air Products and Chemicals, Inc. for the Air Products Liquid Phase
Conversion Company, L.P. under Cooperative Agreement No. DE-FC22-92PC90543,
Allentown, PA.
324
Akunuri, N. V. (1999). “Modeling the Performance, Emissions, and Costs of Texaco
Gasifier-Based Integrated Gasification Combined Cycle Systems”. M.S. thesis,
Department of Civil Engineering, North Carolina State University, Raleigh.
American Methanol Institute (1998). “World Methanol Plants (Through December
1998)” URL: http://www.methanol.org/methanol/fact/Meohcap.pdf
Aspen Technology, Inc. (1996). ASPEN PLUS Release 9.3, - User Guide Volume–1,
Aspen Technology, Inc., Cambridge, MA
Babcock, G.H. and Wilcox, S. (1972). Steam – Its Generation and Use. Babcock and
Wilcox Company, NY.
Brown, W.R. and Frenduto, F.S. (1992). “Fuel and Power Co-production – The
Integrated Gasification/Liquid Phase Methanol (LPMEOH) Demonstration Project”,
Presented at First Annual Clean Coal Technology Conference, Cleveland, Ohio,
September 22-24.
Chen, J.S. (1995) The Production of Methanol and Hydrogen Fuels from Municipal Solid
Waste. PU/CEES Report No. 289, Princeton University, March.
Cheng, W. and Kung, H.H. (1994). Methanol Production and Use, Marcel Dekker, Inc.
NY.
325
Cook, S. L. (1995). “Commercial-Scale Demonstration of a Liquid Phase Methanol
Process”, Preprints of papers, American Chemical Society, Division of Fuel Chemistry,
40 (1), 124-8.
Cooper, D.C. and Alley, F.C. (1994). Air Pollution Control – A Design Approach, 2nd
Edition, Waveland Press, Inc, IL.
Coulson Dijk, van et al. (1983) US Patent 4,407,973, “Methanol from Coal and Natural
Gas”.
Drown, D. P. (1997), “The Liquid Phase Methanol (LPMEOHTM) Process Demonstration
at Kingsport”, Fifth Annual DOE Clean Coal Technology Conference, Tampa, Florida,
January 7 – 9.
Dry, R. J. (1988), “Possibilities for the Development of Large-Capacity Methanol
Synthesis Reactors for Synfuel Production”. Industrial and Engineering Chemistry
Research, 27, 616-624.
Dumas, R. D. (1997). “Energy consumption and emissions related to electricity
generation and remanufacturing processes in a life cycle inventory of solid waste
management”, M.S. thesis, Department of Civil Engineering, North Carolina State
University, Raleigh.
326
Dumas, R. D. (1998) “Energy usage and Emissions associated with Electric Energy
Consumption as part of a Solid Waste Management Life Cycle Inventory Model”,
Internal Report, Department of Civil Engineering, North Carolina State University,
Raleigh.
Ecobalance, Inc. (1999), "Life Cycle Inventory of a Modern Municipal Solid Waste
Landfill", on behalf of Environmental Research and Education Foundation,
June.
Elvers, B and Hawkins, S. (1989). Ullmann’s Encyclopedia of Industrial Chemistry, Vol.
A13, VCH Germany.
Energy Information Administration (1995). “1994 Annual Electric Generator Report,”
EIA-860.
Energy Information Administration (1995). “1994 Monthly Power Plant Report,” EIA-
795.
Felder, R.M., and H.H. Lamb, (1991) Steady State Flowsheet Simulation with ASPEN
PLUS. I. Material and Energy Balance Calculations, CHE-225 Class Notes, Department
of Chemical Engineering, North Carolina State University, Raleigh.
327
Franklin Associates (1998). Energy Requirements and Environmental Emissions for Fuel
Consumption (project data for electric energy, unpublished data).
Frey, H.C. (June 9, 2000). Personal Communication. Department of Civil Engineering,
North Carolina State University, Raleigh, NC 27695.
Frey, H.C., and Rubin, E.S. (1992) “Integration of Coal Utilization and Environmental
Control in Integrated Gasification Combined Cycle Systems,” Environmental Science
and Technology, Volume 26 (10), October.
González, J.C. and Overcash, M. (1999) “Energy sub-modules applied in life-cycle
inventory of processes”, accepted for publication in Clean Products and Processes 2,
November.
Harrison, K.W., Dumas, R.D., Nishtala, S.R., Barlaz, M.A (1999). “A Life Cycle
Inventory Model of Municipal Solid Waste Combustion”. Internal Report, Department of
Civil Engineering, North Carolina State University, Raleigh, NC, July.
Heydorn, E.C., Stein, V.E., Tijm, P.J.A (APCI), Street, B.T. (Eastman), Kornosky, R.M.
(U.S. DOE) (1998). “Liquid Phase Methanol (LPMEOHTM) Project Operational
Experience”, Presented at the Gasification Technology Council Meeting in San
Francisco, October 4-7.

328
Imperial Chemical Inc. (1979). “Methanol”. Hydrocarbon Processing, vol. 12, November,
pages 191-92.
Kirk-Othmer (1990). Encyclopedia of Chemical Technology, Vol. 11, 3rd Edition. John
Wiley and Sons, NY.
LeBlanc et al. (1984), US Patent 4,443,560, “Adiabatically Reforming a Reformed Gas
for Producing Methanol”.
Lee, S (1990). “Methanol Synthesis Technology”, CRC Press, Inc., Boca Raton Florida.
Lurgi Corp. (1979). “Methanol (Lurgi low-pressure Process)”, Hydrocarbon Processing,
November.
Marion, C.P. (1975), US Patent 3,920,717, “Production of Methanol”.
Meyers, R.A. (1984), Handbook of Synfuels Technology, McGraw-Hill book Company.
Niessen, W.R., C.H. Marks, R.E. Sommerlad, P. Shepherd (1996) “Evaluation of
Gasification and Novel Thermal Processes for the Treatment of Municipal Solid Waste,”
Prepared by Camp, Dresser & McKee for National Renewable Energy Laboratories, DE-
AC36-83CH10093, Golden CO.
329
Nunn, R.C. (1997). Water Treatment Essentials for Boiler Plant Operation. McGraw
Hill, NY
Overcash, M. R. (October 15, 1999). Personal Communication. Department of Chemical
Engineering, North Carolina State University, Raleigh, NC 27695.
Perry, R.H. and Green, D.W. (1997). Perry’s Chemical Engineer’s Handbook, Seventh
Edition, McGraw-Hill Book Company, NY.
Pistikopulos, E.N. (1994) A methodology for minimum environmental impact analysis.
In: El-Halwagi, Petrides (eds) Pollution prevention via process modifications. The
pollution Prevention Resource Center, NY.
Shen, J. et al. (1996). “DOE Indirect Coal Liquefaction Program – An Overview”, Fuel
Science & Technology International, 14(4), 559-576.
Sherwin, M and Blum, D. (1979). “Liquid-Phase Methanol: Final Report”, prepared by
Chem Systems Inc. for Electric Power Research Institute, December.
Sherwin, M.B. and Frank, M.E (1976). “Make Methanol by three phase reaction”,
Hydrocarbon Processing, November.

330
Simbeck, D. R., R. L. Dickinson, E.D. Oliver (1983) “Coal Gasification Systems: A
Guide to Status, Applications, and Economics”. AP-3109 Prepared by Synthetic Fuel
Associates, Inc for Electric Power Research Institute, Palo Alto, CA
Sinnott, R.K. (1996). Coulson & Richardson’s Chemical Engineering, Vol. 6, 2nd edition,
Butterworth Heinemann, Oxford.
Stanford Research Institute (1999), “Methanol”, Chemical Economics Handbook, SRI
International.
STAPPA/ALAPCO (1994). NOx Control Options Handbook, Preliminary Draft, April.
Stiegel, G.J. (2000) “Integrated Gasification Combined Cycle,” Department of Energy:
Fossil Energy Division; United States Department of Energy, URL:
http://www.fe.doe.gov/coal_power/igcc/igcc_sum.html
Street, B. (1999). Personal Communication (Eastman Chemical).
Supp. E. (1973) “Technology of Lurgi’s low-pressure Methanol Process”, CHEMTECH,
July.
Supp, E. (1990), How to produce Methanol from Coal, Springer-Verlag. NY.
331
Tchobanoglous, G; Theisen, H; Vigil, S. (1993). Integrated Solid Waste Management –
Engineering Principles and Management Issues. McGraw-Hill, NY.
Tijm, P.J.A. et al. (1997) “Overview of the Liquid Phase Methanol (LPMEOHTM)
Technology”, Presented at American Institute of Chemical Engineers Spring Meeting,
Houston, Texas, March 9-13.
Tijm, P.J.A. et al. (1999) “ Liquid Phase Methanol (LPMEOH) Project: Operating
Experience Update”, paper presented at the 1999 Gasification Technologies Conference,
San Francisco, CA, October 17-20.
Tsao, T.R. and Rao, P. (1987). “The Development of Liquid Phase Methanol Process: An
Update”, Eleventh Annual EPRI Contractors’ Conference on Clean Liquid and Solid
Fuels, Proceedings, April.
Twigg, M.V. (1989), Catalyst Handbook – 2nd Edition. Wolfe Publishing Ltd, England.
U.S Department of Energy (1999). “Commercial Scale demonstration of the Liquid Phase
Methanol (LPMEOHTH) Process”, Topical Report number 11, Clean Coal Technology,
April.
Ulrich, G.D. (1984). A Guide to Chemical Engineering Process Design and Economics,
Wiley, NY.

332
United States Environmental Protection Agency (1982). Fossil Fuel Fired Industrial
Boilers – Background Information, Volume 1: Chapters 1-9, EPA-450/3-82-006a, Work
performed by Research Triangle Park, NC for U.S. EPA, March.
United States Environmental Protection Agency (1998a). Background information on
Bituminous and Subbituminous Coal Combustion (Supplement E), AP-42 section 1.1,
September. URL: http://www.epa.gov/ttn/chief/fbgdocs/ b01s01.pdf
United States Environmental Protection Agency (1998b). Background information on
Fuel Oil Combustion (Supplement E), AP-42 section 1.3, September. URL:
http://www.epa.gov/ttn/chief/fbgdocs/b01s03.pdf.
United States Environmental Protection Agency (1998c). Background information on
Natural Gas Combustion (Supplement D), AP-42 section 1.4, July. URL:
http://www.epa.gov/ttn/chief/fbgdocs/b01s04.pdf
Van Wylen, G.J. and Sonntag, R.E. (1973), Fundamentals of Classical Thermodynamics,
John Wiley and Sons, Inc.: New York.
333
8.0 APPENDICES
APPENDIX A: CALCULATION OF NATURAL GAS COMPOSITION IN CONVENTIONAL PROCESS OF METHANOL PRODUCTION (US PATENT 4,407,973)
This appendix provides the methodology to calculate the composition of natural
gas used in the conventional process of methanol production (in Chapter 5). The
following at the four main reactions occurring in the steam reformer process unit of
conventional process:
Reforming reactions
CH4 + H2O → CO + 3H2; ∆hr* = 234.66 kJ/mol (A-1)
C2H6 + 2H2O → 2CO + 5H2; ∆hr* = 131.68 kJ/mol (A-2)
C3H8 + 3H2O → 3CO + 7H2; ∆hr* = 563.64 kJ/mol (A-3)
Shift reaction
CO + H2O → CO2 + H2; ∆hr* = - 34.6 kJ/mol (A-4)
(∆hr* indicates the heat of reaction at typical reformer operating conditions: 2.0 MPa and
870 oC – Elvers et. al., 1989).
In US patent 4,407,973, a mass balance across the steam reformer is presented but
natural gas composition is not listed. However, it is known that desulfurized natural gas
consists of CH4, C2H6, C3H8, N2, and CO2. In the patent, 3865 lbmol/hr of desulfurized
natural gas is mixed with 14228 lbmol/hr of steam and the mixture is fed to a

334
conventional steam reformer. The composition of dry exit gas (16271 lbmol/hr) from the
reformer is reported as: 73.38 mole percent H2, 13.61 mole percent CO, 8.98 mole
percent CO2, 3.99 mole percent CH4 and 0.04 mole percent N2. This mass balance is set-
up in an EXCEL spreadsheet. C2H6 and C3H8 are completely reformed in the steam
reformer since they are not present in the reformer exit gas. Thus the CH4 present in the
exit gas is the unconverted CH4 from natural gas. The product gas from steam reformer
consists of CO, H2, CO2, CH4, H2O and N2. Nitrogen and CO2 present in natural gas are
inerts in steam reforming reactions. CO and H2 produced in first three reactions come
from CH4, C2H6 and C3H8.
An arbitrary composition of natural gas is selected and based on the known
percent conversion of reactants in above four reactions, the composition of the exit gas is
calculated. The composition of natural gas can be altered in the spreadsheet. By trial and
error, that composition of natural gas is calculated, which gives the same mass balance as
presented in the patent. Table A-1 shows the EXCEL spreadsheet used for the calculation
of composition. In broader sense, this method used to calculate the composition of natural
gas is just back calculating the mass of reactants when mass of products is known.
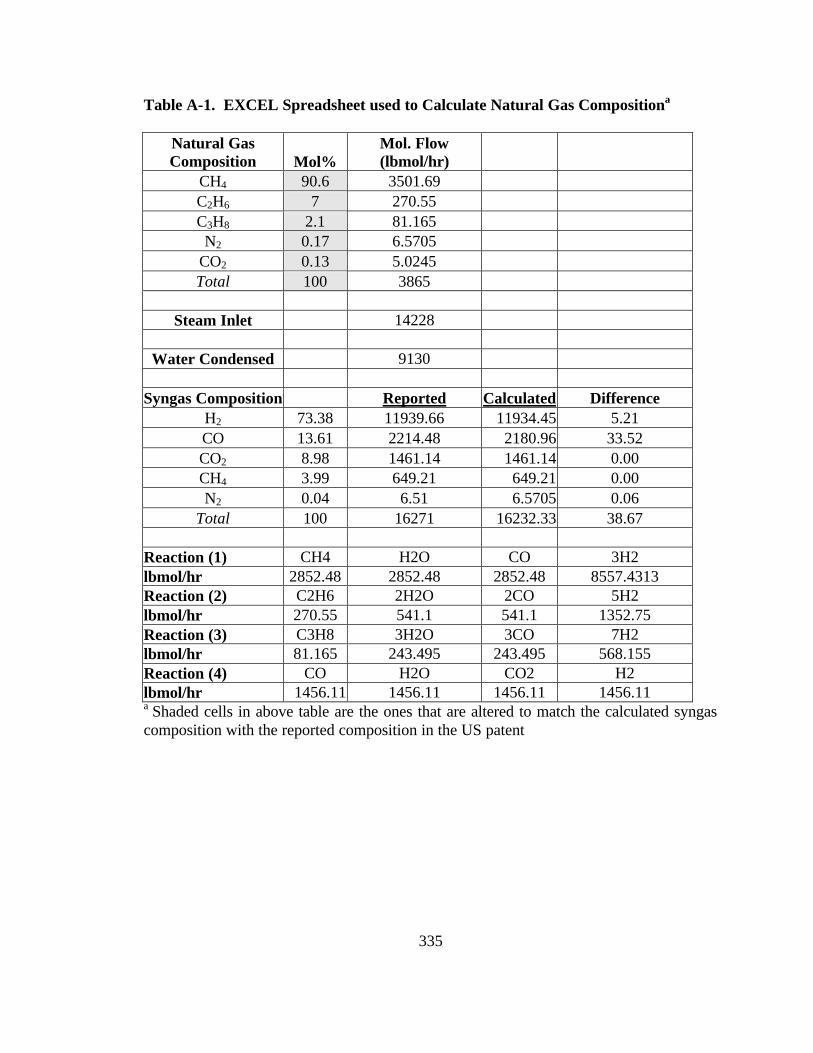
335
Table A-1. EXCEL Spreadsheet used to Calculate Natural Gas Compositiona
Natural Gas Composition Mol%
Mol. Flow (lbmol/hr)
CH4 90.6 3501.69 C2H6 7 270.55 C3H8 2.1 81.165 N2 0.17 6.5705
CO2 0.13 5.0245 Total 100 3865
Steam Inlet 14228
Water Condensed 9130
Syngas Composition Reported Calculated Difference
H2 73.38 11939.66 11934.45 5.21 CO 13.61 2214.48 2180.96 33.52 CO2 8.98 1461.14 1461.14 0.00 CH4 3.99 649.21 649.21 0.00 N2 0.04 6.51 6.5705 0.06
Total 100 16271 16232.33 38.67 Reaction (1) CH4 H2O CO 3H2 lbmol/hr 2852.48 2852.48 2852.48 8557.4313 Reaction (2) C2H6 2H2O 2CO 5H2 lbmol/hr 270.55 541.1 541.1 1352.75 Reaction (3) C3H8 3H2O 3CO 7H2 lbmol/hr 81.165 243.495 243.495 568.155 Reaction (4) CO H2O CO2 H2 lbmol/hr 1456.11 1456.11 1456.11 1456.11 a Shaded cells in above table are the ones that are altered to match the calculated syngas composition with the reported composition in the US patent