Embed Size (px)
Citation preview

ABSTRACT
MECK, ELIJAH DANIEL. Management of the Twospotted Spider Mite Tetranychus urticae
(Acari: Tetranychidae) in North Carolina Tomato Systems. (Under the direction of James F.
Walgenbach and George G. Kennedy.)
In recent years the twospotted spider mite Tetranychus urticae Koch has become an
important pest of vegetables in central and western North Carolina, particularly on tomatoes.
The objectives of this project were to 1) determine the effect of T. urticae feeding on tomato
fruit, 2) determine the effects of T. urticae on total and marketable tomato yields, and 3) to
develop economic injury levels and economic thresholds as well as determine the spatial
distribution of T. urticae in tomato fields and develop a sampling plan. A series of
experiments were untaken in the greenhouse, field, and laboratory to assess feeding damage
known as gold fleck. Caged T. urticae on tomato fruit in the greenhouse were found to
damage fruit. Fields trials showed that as T. urticae density increased, the proportion of fruit
affected by gold fleck also increased. Laboratory studies showed that placing T. urticae
directly on mature green and breaker stage fruit for 14 days resulted in gold fleck damage.
Yields from small plot studies were evaluated from five different T. urticae threshold
densities in 2007 (0, 1, 25, 50 mites per leaflet, and non-treated control) and seven in 2008
and 2009 (0, 1, 8, 17, 25, 50, and non-treated control). Results from 2007 and 2008 showed
that total and marketable yield was higher in plots with low versus high densities of T.
urticae, and that yield differences were mostly due to number of fruit harvested. In 2009
there were no differences in yields between treatments. Yield response of tomatoes was used
to establish economic injury levels for T. urticae. Resulting economic thresholds were very
low (<1-2.4 T. urticae per leaflet), indicating little tolerance for T. urticae feeding. Sampling

was conducted in commercial tomato fields, and T. urticae populations were found to be
highly aggregated. The numbers of random samples required for 60, 80, and 90% precision
levels were too large for sampling to be economically practical.
Management of the Twospotted Spider Mite Tetranychus urticae (Acari: Tetranychidae) in
North Carolina Tomato Systems
by
Elijah Daniel Meck
A dissertation submitted to the Graduate Faculty of
North Carolina State University
in partial fulfillment of the
requirements for the Degree of
Doctor of Philosophy
Entomology
Raleigh, North Carolina
2010
APPROVED BY:
_________________________ _________________________
James F. Walgenbach George G. Kennedy
Co-Chair of Advisory Committee Co-Chair of Advisory Committee
_________________________ _________________________
Mark R. Abney Chris Gunter
ii
BIOGRAPHY
Elijah Daniel Meck was born on December 17, 1981, and is the son of Mr. and Mrs.
Steven Daniel Meck. He was raised in a small rural town in southeastern Pennsylvania along
with his two younger brothers Jeremiah and Josiah. Growing up Elijah developed an
appreciation for the outdoors, and has many fond memories of the hunting and fishing
adventures that have led him through the mountains and valleys of Pennsylvania.
On farm work experience both in crop production and small plot experiments, and
agricultural classes in school pointed the way toward a career in agriculture. After
graduating from Kutztown Area High School in 2000, Elijah continued his studies in
agriculture at the Pennsylvania State University. In 2004 he received a Bachelor of Science
degree in Agroecology.
In pursuit of his ambitions to obtain a degree in Entomology, Elijah applied and was
accepted into the Department of Entomology at North Carolina State University in 2004.
Under the direction of Dr. James Walgenbach and Dr. George Kennedy he began work
towards a Master of Science degree. Upon graduating with his masters in 2007, he continued
his research in pursuit of a Doctor of Philosophy degree. His research revolved around the
population dynamics, spatial distribution, and management of the twospotted spider mite,
Tetranychus urticae, in North Carolina tomato systems.
While attending the North Carolina State University, Elijah met his future wife,
Michelle Giudici who was also pursuing a degree in Entomology. They were married in
October of 2006, and in November of 2009 they had a son, Wyatt Daniel.
iii
ACK�OWLEDGEME�TS
I would like to thank all of the individuals that helped make this work possible. I
would especially like to thank my committee; Dr. James Walgenbach, Dr. George Kennedy,
Dr. Mark Abney, and Dr. Chris Gunter for all of their suggestions and guidance throughout
the past few years. I greatly appreciate the efforts of the 2007, 2008, and 2009 summer
crews at the Mountain Horticultural Crops Research and Extension Center and Mountain
Horticultural Crops Research Station in Mills River, NC. They spent many hours on the road
and in the field. Specifically I would like to thank Jason Livingston for his dedicated effort
through all three summers. I would also like to thank all the grower cooperators for allowing
us sample their fields, and Dr. Consuelo Arellano in the NCSU Department of Statistics for
all of the statistical consultation she offered. Lastly I would like to thank my wife, Michelle,
for all of her help, support, and patience over the past few years.

iv
TABLE OF CO�TE�TS
Page
LIST OF TABLES……………………………………………………………………….. vi
LIST OF FIGURES……………………………………………………………………… viii
MANAGEMENT OF THE TWOSPOTTED
SPIDER MITE TETRA�YCHUS URTICAE
(ACARI: TETRANYCHIDAE) IN NORTH CAROLINA
TOMATO SYSTEMS: AN INTRODUCTION…………………………………………. 1
References………………………………………………………………………... 5
CHAPTER 1: ASSOCIATION OF TWOSPOTTED SPIDER MITE,
TETRA�YCHUS URTICAE (ACARI: TETRANYCHIDAE)
FEEDING AND GOLD FLECK DAMAGE ON TOMATO FRUIT…………… 8
Introduction………………………………………………………………………. 8
Materials and Methods…………………………………………………………… 9
Results……………………………………………………………………………. 12
Discussion………………………………………………………………………... 15
References………………………………………………………………………... 17
CHAPTER 2: IMPACT OF TWOSPOTTED SPIDER MITE,
TETRA�YCHUS URTICAE (ACARI: TETRANYCHIDAE)
ON STAKED TOMATO YIELDS AND MARKETABLE
YIELDS IN WESTERN NORTHCAROLINA…………………………………. 25
Introduction………………………………………………………………………. 25
Materials and Methods…………………………………………………………… 26
Results……………………………………………………………………………. 29
Discussion………………………………………………………………………... 34
References………………………………………………………………………... 39

v
CHAPTER 3: ECONOMIC THRESHOLDS AND SAMPLING PLANS
FOR TWOSPOTTED SPIDER MITE, TETRA�YCHUS URTICAE
(ACARI: TETRANYCHIDAE) IN NORTH CAROLINA
STAKED TOMATOES …………………………………………………………. 55
Introduction………………………………………………………………………. 55
Materials and Methods………………………………………………………….... 56
Results……………………………………………………………………………. 60
Discussion………………………………………………………………………... 61
References………………………………………………………………………... 66
vi
LIST OF TABLES
Page
CHAPTER 1
Table 1. ANOVA results of the total gold fleck that occurred
on tomato fruit after 14 days exposure to T. urticae……………………………... 19
CHAPTER 2
Table 1. ANOVA results for tomato yields in response
to different densities of T. urticae across three years………………………......... 42
Table 2. ANOVA results for profits in response to different
densities of T. urticae across three years……………………………………..….. 43
Table 3. ANOVA results for total yield (all fruit), mean fruit
weights, and fruit numbers in response to different
densities of T. urticae across three years……………………………………….... 44
Table 4. Average (± SEM) total yield, mean fruit weights, and
mean numbers of fruit for seven different T. urticae density
levels in early planted tomatoes across three years…………………………….... 45
Table 5. Average (± SEM) marketable yields, percent marketable
fruit affected by gold fleck, and gold fleck rating for seven
different T. urticae density levels in early planted tomatoes
across three years……………………………………………………………..….. 46
Table 6. Resulting t and P-values from t-tests used to determine
the impact of gold fleck affected fruit on marketable yields
and profits by mite threshold level in early planted tomatoes ………………….... 47
Table 7. Average (± SEM) total yield, mean fruit weights, and
mean numbers of fruit for seven different T. urticae density
levels in late planted tomatoes across three years……………………………..…. 48
Table 8. Average (± SEM) marketable yields, percent marketable
fruit affected by gold fleck, and gold fleck rating for seven
different T. urticae density levels in late planted tomatoes
across three years……………………………………………………….……..…. 49
vii
Table 9. Resulting t and P-values from t-tests used to determine
the impact of gold fleck affected fruit on marketable yields
and profits by mite threshold level in late planted tomatoes ………...………...… 50
CHAPTER 3
Table 1. ANOVA results for tomato yields in response
to different densities of T. urticae across three years……………………..……… 69
Table 2. Economic injury levels (expressed as CMD) for three
different acaricides at five different tomato prices and
three different levels of population reduction………………………..………....... 70
Table 3. Economic thresholds (expressed as mites/leaflet) for
three different acaricides at five different tomato
prices and three different levels of population reduction………………..…….…. 71
viii
LIST OF FIGURES
Page
CHAPTER 1
Figure 1. A bag constructed of organza material for caging
mites on a flower or fruit cluster…………………………………………..……... 20
Figure 2. Proportion of tomato fruit affected by gold fleck
in the early and late planted fields trials in 2007……………………...………….. 21
Figure 3. Proportion of tomato fruit affected by gold fleck
in the early and late planted fields trials in 2008…………………………..…….. 22
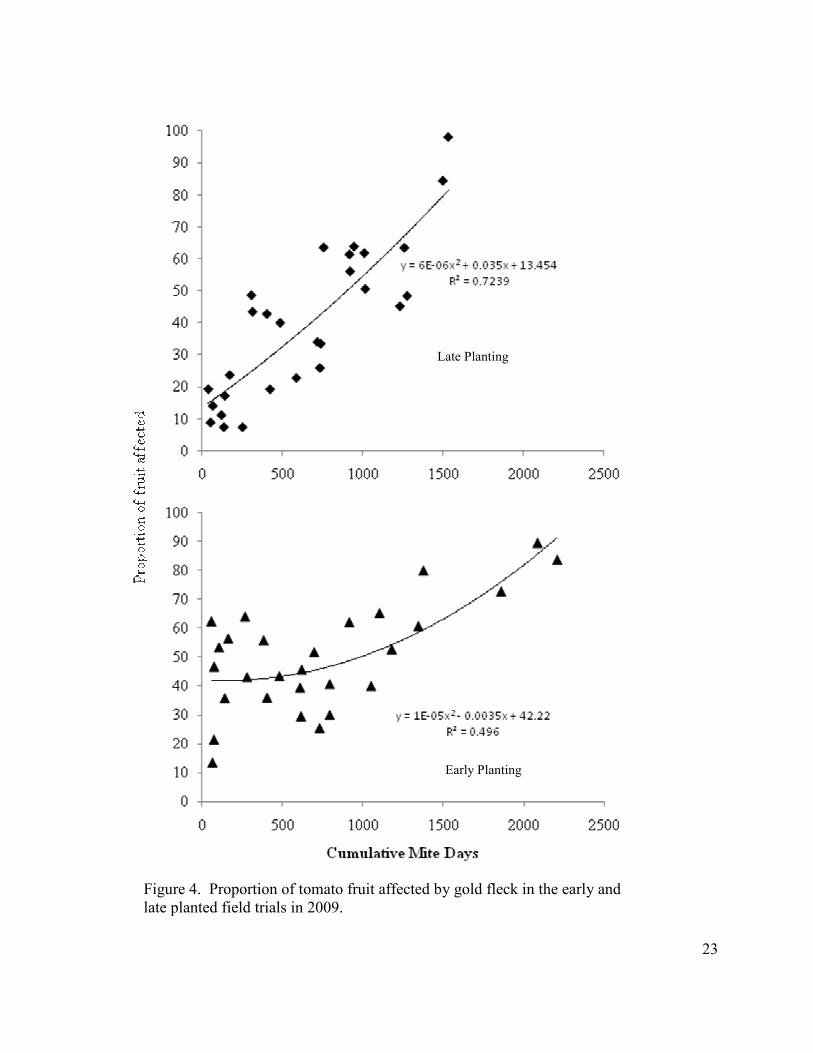
Figure 4. Proportion of tomato fruit affected by gold fleck
in the early and late planted fields trials in 2009……………………………..….. 23
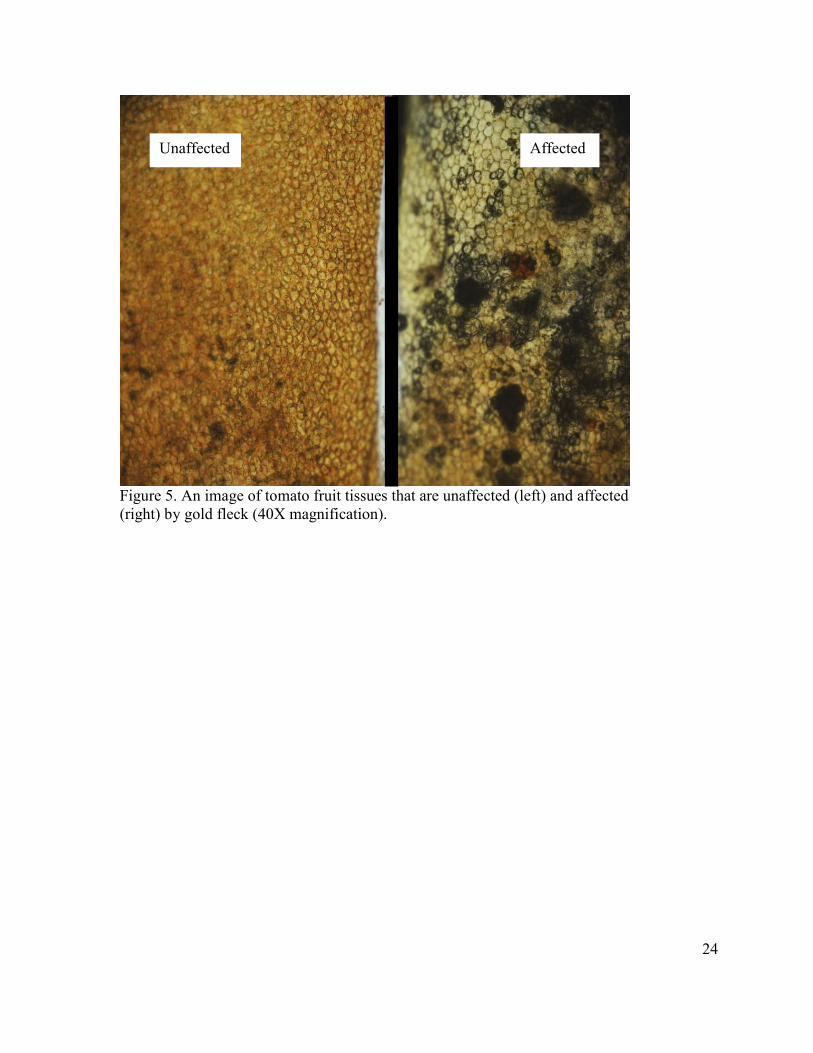
Figure 5. An image of tomato fruit tissues that are unaffected (left)
and affected (right) by gold fleck (40X magnification)………..…………………. 24
CHAPTER 2
Figure 1. Mite days accumulated in the non-treated control
plots for two plantings of tomatoes across three years………………………..…. 51
Figure 2. Average (± SEM) profits from five different
T. urticae densities in two plantings of tomatoes in 2007……………………….. 52
Figure 3. Average (± SEM) profits from seven different
T. urticae densities in two plantings of tomatoes in 2008………………..……… 53
Figure 4. Average (± SEM) profits from seven different
T. urticae densities in two plantings of tomatoes in 2009…………………..…… 54
CHAPTER 3
Figure 1. Change in CMD over time with the fitted fourth
order polynomial line …………………………………..……………...………… 72
Figure 2. Regression of CMD on average number of
mites per leaflet ………………………………………………………..…………. 73
ix
Figure 3. Relationship of log variance to log mean density
for T. urticae motile forms on tomatoes, using a
sample unit of 10 consecutive terminal leaflets………………………………….. 74
Figure 4. Number of 10 consecutive terminal leaflet samples
required to obtain 60, 80, and 90% precision levels
of the mean at various T. urtiace densities…………………………….………… 75
1
Management of the Twospotted Spider Mite Tetranychus urticae (Acari:
Tetranychidae) in �orth Carolina Tomato Systems: An Introduction
The twospotted spider mite, Tetranychus urticae Koch, is a cosmopolitan and highly
polyphagous pest of many fruits, vegetables, ornamentals, and field crops. Given optimal
conditions of high temperatures and low humidity, populations of T. urticae can build to high
densities and cause serious damage to host plants.
Spider mites feed on host plants by inserting their stylets into leaf tissue and remove
cell contents (Tomczyk and Kropczyńska 1985). Feeding results in the loss of leaf
chlorophyll and a reduction in the net photosynthetic rate (Park and Lee 2002; Campbell et
al. 1990; DeAngelis et al. 1982; Sances et al. 1981), and can lead to yellow to white
discoloration of the leaf often referred to as bronzing. Damage to the host plant may cause a
decline in overall plant health or death (Tomczyk and Kropczyńska 1985).
The life cycle of T. urticae consists of an egg, larva, protonymph, deutonymph, and
adult. All three active immature stages feed on the host plant, and are followed by a period
of quiescence called the protochrysalis, deutochrysalis, and teliochrysalis. The time that a
mite remains in each stage depends on temperature and humidity during the specific lifestage
(Herbert 1981; Boudreaux 1958; Cagle 1949). Males develop faster than females, and wait
in close proximity to the female teliochrysalis for the adult female to emerge. Mating occurs
almost immediately after adult female emergence. Parthenogenesis may occur in T. urticae
resulting in the production of haploid males.
2
Spider mites (larvae, nymphs, and adults) produce webs from silk glands located at
each palp. Spider mite females of the genus Tetranychus also lay their eggs within or under
webbing (Gerson 1985). Webbing may be used to protect against climatic factors such as
wind and rain, and also protects the mites from natural enemies and exposure to chemicals
(Davis 1952). Spray droplets may become trapped in webbing and fail to contact the mites.
While T. urticae populations can be kept under control by natural enemies in nature,
modern agriculture creates conditions favorable for T. urticae populations to grow to
extremely high densities. Monocultures of host plants are grown using pesticides that can
directly and indirectly contribute to high mite densities through the elimination of natural
enemies (Roush and Hoy 1978), behavior-modifying effects (Ayyappath et al. 1995; Iftner
and Hall 1984, 1983), as well as through trophobiosis and hormoligosis (James and Price
2002; Margolies et al. 1985; Dittrich et al. 1974). The polyphagous nature of T. urticae
allows it to exploit a diversity of habitats during the year. When the quality of host plants
declines due to high populations, plant senescence, or when a crop is harvested, mites must
disperse to new hosts. Dispersal can occur over short distances by crawling or over longer
distances by wind-assisted aerial dispersal (Kennedy and Smitley 1985). Crawling is
important in the movement of mites from field borders into crop fields (Margolies and
Kennedy 1985; Brandenburg and Kennedy 1982) as well as throughout the plant. Aerial
dispersal of T. urticae is observed mostly in adult females, and occurs when populations are
concentrated in the upper canopy of the plant. In response to wind and light, T. urticae will
orient itself in a negative phototactic manner and raise its forelegs (Smitley and Kennedy
1985). The mite is then caught in wind updrafts resulting in aerial dispersal.
3
Tetranychus urticae can overwinter as reproducing populations on host plants or in a
state of diapause (Veerman 1985). In regions with mild winter climates, such as the
southeastern United States, reproducing populations can remain active throughout the winter
on weeds such as henbit, chickweed, and Carolina geranium (Brandenburg and Kennedy
1981; Meagher and Meyer 1990). Tetranychus urticae adult females will enter a state of
diapause in response to decreased photoperiod and temperature, as well as the condition of
the host plant. Once mites enter a diapause state they move from the host to hibernation sites
(Veerman 1985), such as soil clods (Collingwood 1955; Masse 1942; Weldon 1910), cracks
in poles, and dried leaves (Masse 1942). Diapause is terminated when temperatures and
photoperiod increase. In response to increased temperatures winter weeds can senesce, and
mites will disperse into nearby fields or other non-cultivated host plants (Margolies and
Kennedy 1985).
While T. urticae is a well-documented pest of corn and peanuts in eastern North
Carolina, only recently has it become a consistent and serious pest of vegetables in the
piedmont and mountains of North Carolina. Mites infest a number of vegetables in North
Carolina including tomato, pepper, eggplant, cucurbits, and sweet corn, but tomato is by far
the most seriously affected crop (Meck et al. 2009).
North Carolina fresh market tomato production is ranked number six in the nation
(USDA Economic Research Service 2010) with 1376 hectares harvested in 2008 worth $33.7
million (North Carolina Agricultural Statistics 2010). In conventional tomato production, T.
urticae populations are managed with the use of acaricides. Current recommendations call
for the use of abamectin, bifenazate, or spiromesifen to control T. urticae in North Carolina
4
tomatoes (Abney et al. 2009), however there are no economic thresholds or sampling plans in
place for evaluating T. urticae populations in the field.
Tomatoes are typically planted from April through early July in the piedmont and
mountains of North Carolina. During the course of the growing season some fields may
experience high population densities of twospotted spider mites. Insecticides used to control
a diversity of tomato pests may contribute to high mite populations through the processes of
trophobiosis and hormoligosis. High mite populations may also be due to acaricide
resistance and/or the suspension of acaricide applications later in the season when economic
conditions do not justify their use.
The first objective of this project was to characterize the nature of T. urticae direct
damage to tomato fruit. Preliminary studies suggested that gold fleck of tomato was the
result of spider mite feeding directly on tomato. The second objective was to examine the
effect of T. urticae populations on the yield and economics of tomato production. The third
objective was to sample commercial tomato fields to determine the spatial distribution of T.
urticae and develop a sampling plan for management decisions. The determination of
economic injury levels and thresholds along with a sampling plan should improve current
management strategies for T. urticae in tomatoes and allow for more judicious use of
acaricides.
5
References
Abney, M.R., J.F. Walgenbach, G.G. Kennedy, P. Smith, R. Bessin, A. Sparks, D. Riley,
M. Layton, F.Hale, and A.L. Morgan. 2009. Insect control for commercial vegetables. pp.
116-177, in G.J. Holmes and J.M. Kemble (eds). Vegetable Crop Handbook for Southeastern
United States.
Ayyappath, R., J.F. Witkowski, L.G. Higley, and B.D. Siegfried. 1995. Influence of sublethal doses of permethrin and methyl parathion on dispersal behavior of two species of spider mites (Acari: Tetranychidae) on corn. Environ. Entomol. 24: 226-232.
Boudreaux, H.B. 1958. The effect of relative humidity on egg-laying, hatching, and survival in various spider mites. J. Insect Physiol. 2: 65-72. Brandenburg, R.L. and G.G. Kennedy. 1981. Overwintering of the pathogen Entomophthora floridana and its host, the twospotted spider mite. J. Econ. Entomol. 74: 428-431.
Brandenburg, R.L. and G.G. Kennedy. 1982. Intercrop relationships and spider mite dispersal in a corn/peanut agroecosystem. Ent. exp. appl. 32: 269-276. Cagle, L.R. 1949. Life history of the two-spotted spider mite. Tech. Bul. Virginia Agr. Exp. Sta. 113: 1-31. Campbell R. J., Mobley K. �., Marini R. P. 1990. Growing conditions influence mite damage on apple and peach leaves. HortScience. 25: 445–448.
Collingwood, C.A. 1955. The glasshouse red spider on blackcurrants. Ann. appl. Biol. 43: 144-147. Davis, D.W. 1952. Influence of population density on Tetranychus multisetis. J. Econ. Entomol. 45: 652-654.
DeAngelis, J.D., K.C. Larson, R.E. Berry, G.W. Krantz. 1982. Effects of spider mite injury on transpiration and leaf water status in peppermint. Environ. Entomol. 11: 975-978. Dittrich, V., P. Streibert, and P.A. Bathe. 1974. An old case reopened mite stimulation by insecticide residues. Environ. Entomol. 3: 534-540.
Gerson, U. 1985. Webbing, pp. 223-232, in W. Helle and M.W. Sabelis (eds). Spider Mites, Their Biology, Natural Enemies and Control. Elsevier, Amsterdam, Vol 1A.

6
Herbert, H.J. 1981. Biology, life tables, and innate capacity for increase of the twospotted spider mite, Tetranychus urticae (Acarina: Tetranychidae). Can. Entomol. 113: 371-378. Iftner, D.C. and F.R. Hall. 1984. The effects of fenvalerate and permethrin residues on Tetranychus urticae fecundity and rate of development. J. Agri. Entomol. 1(3): 191-200. Iftner, D.C. and F.R. Hall. 1983. Effects of fenvalerate and permethrin on Tetranychus urticae (Acari: Tetranychidae) dispersal behavior. Environ. Entomol. 12(6): 1782-1786. James, D.J. and T.S. Price. 2002. Fecundity in twospotted spider mite (Acari: Tetranychidae) is increased by direct and systemic exposure to imidacloprid. J. Econ. Entomol. 95(4): 729-732. Kennedy, G.G. and D.R. Smitley. 1985. Dispersal, pp. 233-242, in W. Helle and M.W. Sabelis (eds). Spider Mites, Their Biology, Natural Enemies and Control. Elsevier, Amsterdam, Vol 1A. Margolies, D.C. and G.G. Kennedy. 1985. Movement of the twospotted spider mite, Tetranychus urticae, among hosts in a corn-peanut agroecosystem. Entomol. Exp. Appl. 37: 55-61. Margolies, D.C., G.G. Kennedy, and J.W. Van Duyn. 1985. Effect of three soil-applied insecticides in field corn on spider mite (Acari: Tetranychidae) pest potential. J. Econ. Entomol. 78: 117-120. Masse A.M. 1942. Some important pests of the hop. Ann. appl. Biol. 29: 324-326. Meagher R.L.Jr. and J.R. Meyer. 1990. Influence of ground cover and herbicide treatments on Tetranychus urticae populations in peach orchards. Exp. Appl. Acarol. 9: 149-158. Meck, E.D., J.F. Walgenbach, and G.G. Kennedy. 2009. Effect of vegetation management on autumn dispersal of Tetranychus urticae (Acari: Tetranychidae) from tomato. J. Appl. Entomol. 133: 742-748. �orth Carolina Agricultural Statistics 2010. Agricultural Statistics – Vegetable Summary. North Carolina Department of Agriculture and Consumer Services. http://www.ncagr.gov/stats/crops/vegetablesum.html
Park, Y-L and J-H Lee. 2002. Leaf cell and tissue damage of cucumber caused by twospotted spider mite (Acari: Tetranychidae). J. Econ. Entomol. 95: 952-957.
Roush, R.T. and M.A. Hoy. 1978. Relative toxicity of permethrin to a predator a, Metaseiulus occidentalis, and its prey, Tetranychus urticae. Environ. Entomol. 7: 287-288.
7
Sances, F.V., J.A. Wyman, I.P. Ting, R.A. Van-Steenwyk, E.R. Oatman. 1981. Spider mite interactions with photosynthesis transpiration and productivity of strawberry. Environ. Entomol. 10: 442-448. Smitley, D.R. and G.G. Kennedy. 1985. Photo-oriented aerial dispersal behavior of Tetranychus urticae (Acari: Tetranychidae) enhances escape from the leaf surface. Ann. Entomol. Soc. Am. 78: 609-614. Tomczyk, A and D. Kropczyńska. 1985. Effects on the host plant. pp. 312-330, in W. Helle and M.W. Sabelis (eds). Spider Mites, Their Biology, Natural Enemies and Control. Elsevier, Amsterdam, Vol 1A. USDA Economic Research Service 2010. Briefing Rooms, Vegetables and Melons: Tomatoes. http://www.ers.usda.gov/Briefing/Vegetables/tomatoes.htm. Veerman, A. 1985. Diapause. pp. 279-316, in W. Helle and M.W. Sabelis (eds). Spider Mites, Their Biology, Natural Enemies and Control. Elsevier, Amsterdam, Vol 1A. Weldon, G.P. 1910. Life history and control of the common orchard mites Tetranychus bimaculatus and Bryobia pratensis. J. Econ. Entomol. 3:430-434.
8
Chapter 1: Association of twospotted spider mite, Tetranychus urticae
(Acari: Tetranychidae) feeding and gold fleck damage on tomato fruit
Introduction
The twospotted spider mite, Tetranychus urticae Koch, is a cosmopolitan and highly
polyphagous pest of many fruits, vegetables, ornamentals, and field crops. In recent years its
importance as pest of vegetables in central and western North Carolina has increased
considerably, particularly on tomatoes (Meck et al. 2009).
Spider mites feed on host plants by inserting their stylets into leaf tissue and remove
cell contents (Tomczyk and Kropczyńska 1985). Feeding injury results in the loss of leaf
chlorophyll and a reduction in the net photosynthetic rate (Park and Lee 2002; Campbell et
al. 1990; DeAngelis et al. 1982; Sances et al. 1981), and can lead to yellow to white
discoloration of the leaves, often referred to as bronzing. Damage to the host plant may
cause a decline in overall plant health or death (Tomczyk and Kropczyńska 1985).
Damage caused by T. urticae feeding on tomato is typically considered to be indirect
and results in a decline in plant health which could lead to reduced yields. However,
observations have been made of gold flecking on tomato fruit in plots with high T. urticae
populations. Gold fleck consists of small irregular light-green to white spots that turn yellow
as fruit ripen; this damage can be a serious economic problem due to downgrading or culling
of affected fruit. The cause of gold fleck has been debated, with some attributing it to a
genetic or environmental disorder, the use of certain pesticides, and others to sucking insects.
Insects as a causative agent of gold fleck was substantiated when Ghidiu et al. (2006)
9
demonstrated that western flower thrips, Frankliniella occidentalis (Pergande), feeding on
tomato fruit caused gold fleck. The objective of this study was to assess the relationship
between T. urticae and gold fleck of tomato through a series of experiments in the field and
greenhouse, as well as the laboratory.
Materials and Methods
Greenhouse Study: In June of 2008, 40 five-week old ‘Crista’ tomato plants were
planted into 7.6 L pots and placed into a glasshouse at the Mountain Horticultural Crops
Research Station (MHCRS), Mills River, North Carolina. A 2.54 x 2.54 cm by 1.3 m long
wooden stake was placed in the potting soil adjacent to the transplant. As the plant grew the
main stem was tied to the stake using nylon tomato twine (Gro-Tie, Intergro, Clearwater,
FL).
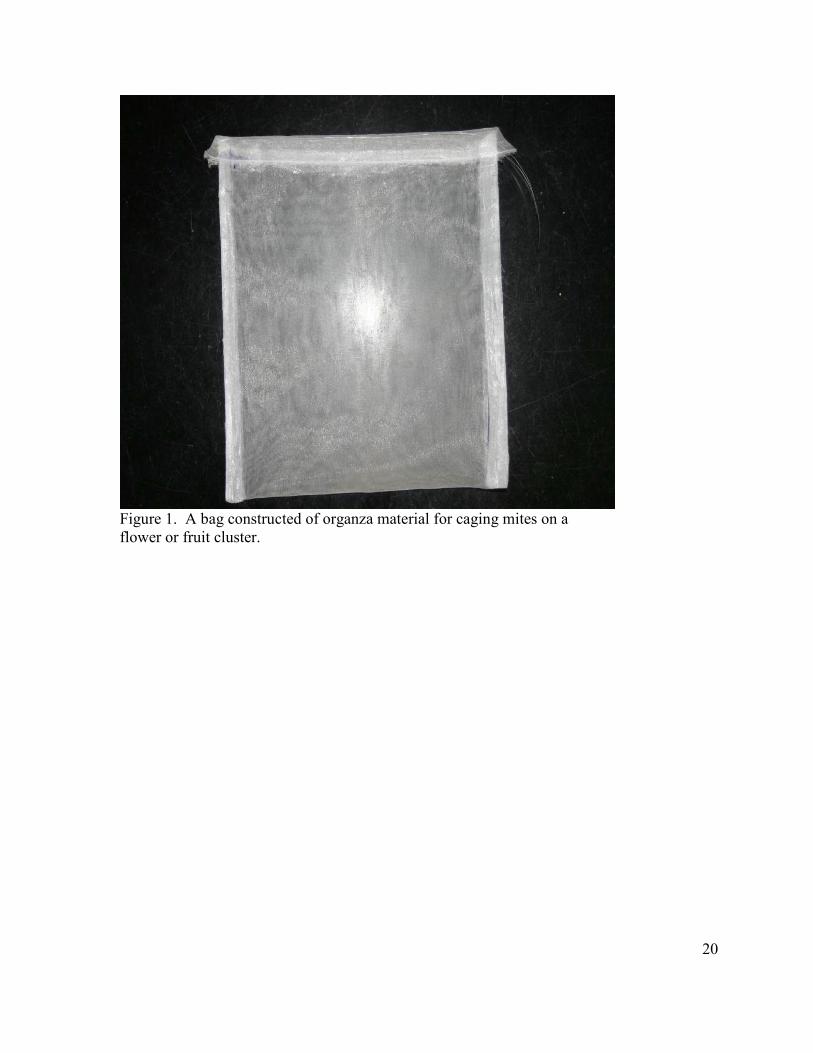
Bags were constructed from organza fabric (BedBug, Green Thumb Group Inc.,
Verona, WI) to contain tomato flower clusters. A 22.9 cm wide by 45.7 cm long piece of
fabric was folded in half lengthwise and the sides were then glued together with fabric glue
(Fabri-Tac, Beacon Adhesives, Mt. Vernon, NY), leaving the uppermost 1.9 cm unglued. A
piece of wax paper was inserted into the bag and the top 1.9 cm was folded down on each
respective side and glued into place leaving a 1.2 cm gap. The wax paper allowed for gluing
on each side without gluing the entire bag together. A 61 cm piece of 0.46 mm diameter
monofilament fishing line (Stren, Spirit Lake, IA) was then threaded through the 1.2 cm gap
on 1 side of the bag then back through the other side creating a bag that could be closed
around the flower cluster (Fig. 1).

10
Flower clusters were tapped onto a piece of white paper to determine the presence of
thrips. Forty thrips free clusters were bagged by tying the bag onto the flower stem using the
monofilament fishing line. Insect trapping adhesive (Tangletrap, Great Lakes IPM Inc.,
Vestaburg, MI) was then spread around the area where the bag was tied to the stem. This
was done to prevent contamination of the flower clusters by other arthropods. Treatments
consisted of the introduction of T. urticae to flowers, immature green fruit, breaker stage
fruit, and a control in which no mites were introduced. Each treatment was replicated 10
times. Twenty-five adult female T. urticae reared on bush beans (Phaseolus vulgaris L.)
were placed on 10 mm bean leaf disks and two disks were introduced into the bags at the
corresponding treatments (i.e., physiological state of fruit development). All clusters were
thinned to two fruit when mites were introduced, with the exception of the flower stage and
the control treatments. These clusters were thinned at the immature green fruit stage. Leaf
disks were placed directly in the flower cluster in the flower treatment and on the calyx in the
fruit treatments. Upon introduction of the mites, the bags were placed back over the cluster
and remained for the duration of the experiment. Fruit were harvested at the red-ripe stage
and examined for the presence or absence of gold fleck.
Field Studies: A factorial experiment consisting of two plantings (early and late) of
tomatoes was conducted in each of three years to determine the proportion of fruit affected
by gold fleck in response to seven different densities of T. urticae.
On 10, 9, and 14 May and 28, 26, and 25 June of 2007, 2008, and 2009, respectively,
6-week old ‘Crista’ variety tomato transplants were planted into single 6 m long rows (2007
and 2009) or 7.6 m long rows (2008) spaced 3 m apart. Plants were grown according to
11
standard recommended practices for western North Carolina (Ivors 2010). Plants were
staked, strung, and irrigated as needed during the growing season, and all treatments received
the same fungicide and insecticide maintenance programs.
Tetranychus urticae were introduced to the transplants from a laboratory colony
grown on bush beans (Phaseolus vulgaris L.) for three days prior to being planted into the
field. The mite density treatments were assigned using a randomized complete block design
with an outside guard row on each side of every block. In 2007, mite density treatments
consisted of 0, 1, 25, and 50 mites per leaflet plus a non-treated control plot. In 2008 and
2009 mite density treatments consisted of 0, 1, 8, 17, 25, and 50 mites per leaflet plus a non-
treated control plot.
Plots were sampled by examining the innermost 10 plants in 2007 and 2009 and the
innermost 12 plants in 2008. Plants were sampled on a weekly basis by using a 10X
optivisor to count the number of motile T. urticae on the underside of the terminal leaflet of
the second or third most recently expanded leaf. If a terminal leaflet was not available the
leaflet located nearest the terminal was sampled. Densities were recorded for each treatment
and averaged across replicates to determine the mean number of mites per leaflet within a
given treatment. Treatments in which T. urticae densities had reached or exceeded the
designated treatment density were then sprayed with an acaricide. Mite densities were
expressed as cumulative mite days, which were calculated by multiplying the average mite
density per leaflet on successive sample dates times the sample interval (days), and
summarizing the weekly mite day values over successive weeks.
Six plants were chosen from those that were being examined for T. urticae to be
12
harvested for yields. Fruit was harvested weekly by removing all fruit in the breaker to red-
ripe stage, and recording the number of fruit affected and unaffected by gold fleck. The
proportion of gold fleck affected fruit was then plotted against cumulative mite days.
Laboratory Study: In August of 2009 breaker-stage and mature green field-grown ‘Crista’
tomato fruit that had no symptoms of gold fleck were collected and brought to the laboratory
where they were wiped clean with a paper towel and blown off with compressed air to
remove all dirt, pesticide residue, and arthropods that may have been present.
Fruit were arranged on trays split into treatments that consisted of 0, 1, 8, or 50 adult
female T. urticae placed on three different fruit type treatments; fruit with an intact calyx,
fruit with the calyx removed, and fruit placed upside down with the calyx end on the tray. A
6.35 cm diameter arena was constructed on the fruit by using a 1 percent clove oil/lanolin
mixture applied with a 10 mL syringe around the top or bottom of fruit depending on
treatment. Tetranychus urticae were placed within the arena and allowed to feed for 14
days. The percentage area affected within the arena was recorded daily for the first seven
days post mite introduction, and a final evaluation at 14 days. These data were than analyzed
using the GLM procedure (SAS Institute 2006).
Results
Greenhouse Study: Of the 18 fruit harvested from the flower infestation treatment,
11 exhibited gold fleck symptoms. Of those infested at the mature green stage, five of 18
had gold fleck symptoms, and three of 16 from the breaker stage treatment exhibited
symptoms. No gold fleck symptoms were observed on the 11 control fruit
13
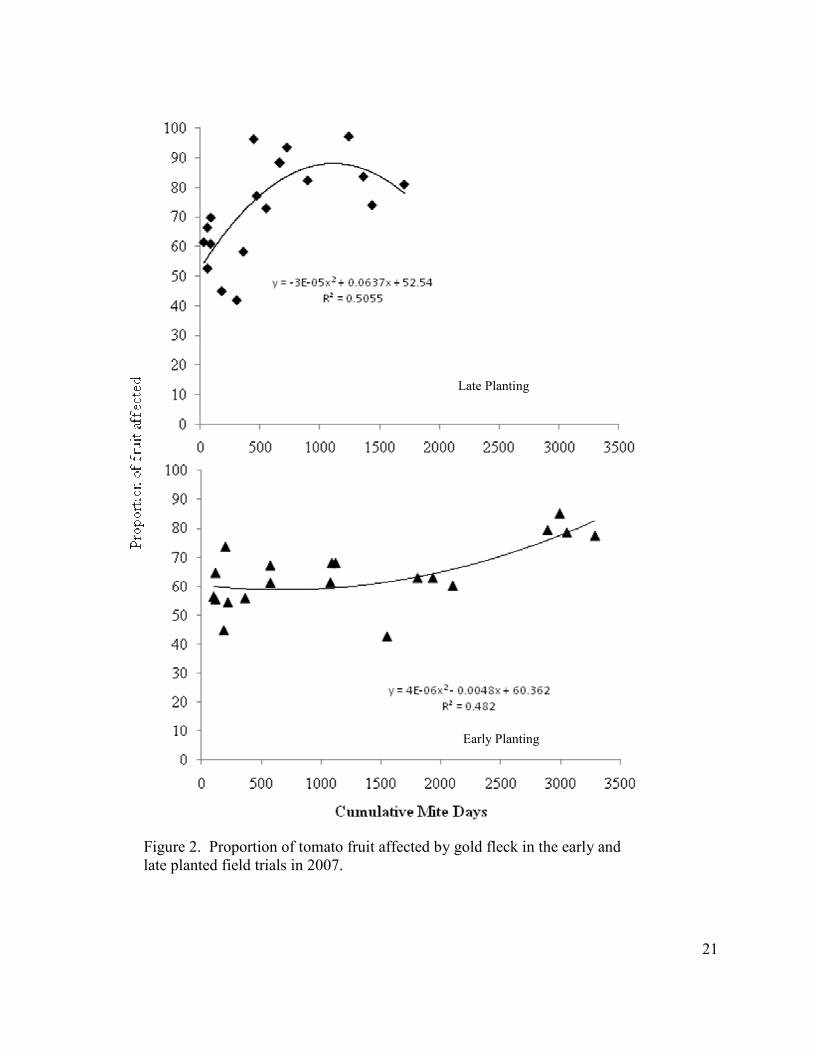
Field Studies: The proportion of fruit affected by gold fleck was highly variable in
2007 with 0 and 1 mite-density treatments ranging from 42 to 74% in the early and late
plantings. However, as cumulative mite-days increased, so did the percentage of fruit
affected by gold fleck (Fig. 2).
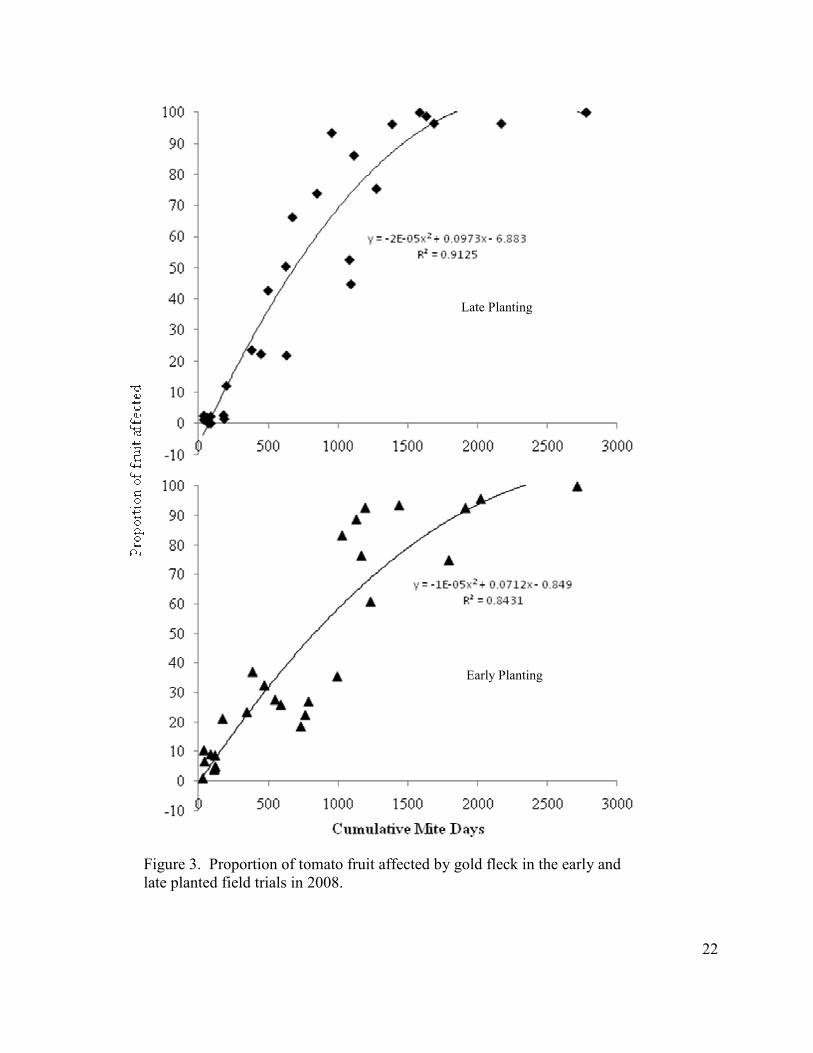
In 2008, the 0 and 1 mite-density treatments of the early planting (< 200 cumulative
mite-days) had ≤ 10% of fruit with gold fleck, and the percentage of fruit with gold fleck
increased with increasing mite density, with 100% of fruit affected at 2700 cumulative mite-
days (Fig. 3). In late-planted tomatoes, no gold fleck was observed in the low threshold
treatments, but the percentage of fruit with gold fleck again increased with increasing mite
density such that > 90% of fruit had gold fleck at mite populations of > 1500 mite-days.
In 2009, there was again high variability in gold fleck incidence at 0 and 1 mite
densities (< 200 mite days), ranging from 13 to 63% in the early planting and 8 to 19% in the
late planting (Fig. 4). But again, the general trend was that the percentage of gold fleck
affected fruit increased with increasing mite-day accumulations.
A second order polynomial line best described the 2008 data and was fitted for each
planting date within each year. From a biological perspective this type of line makes sense
because any increase in CMD beyond the point where 100% of the fruit affected should not
change the proportion of fruit affected.
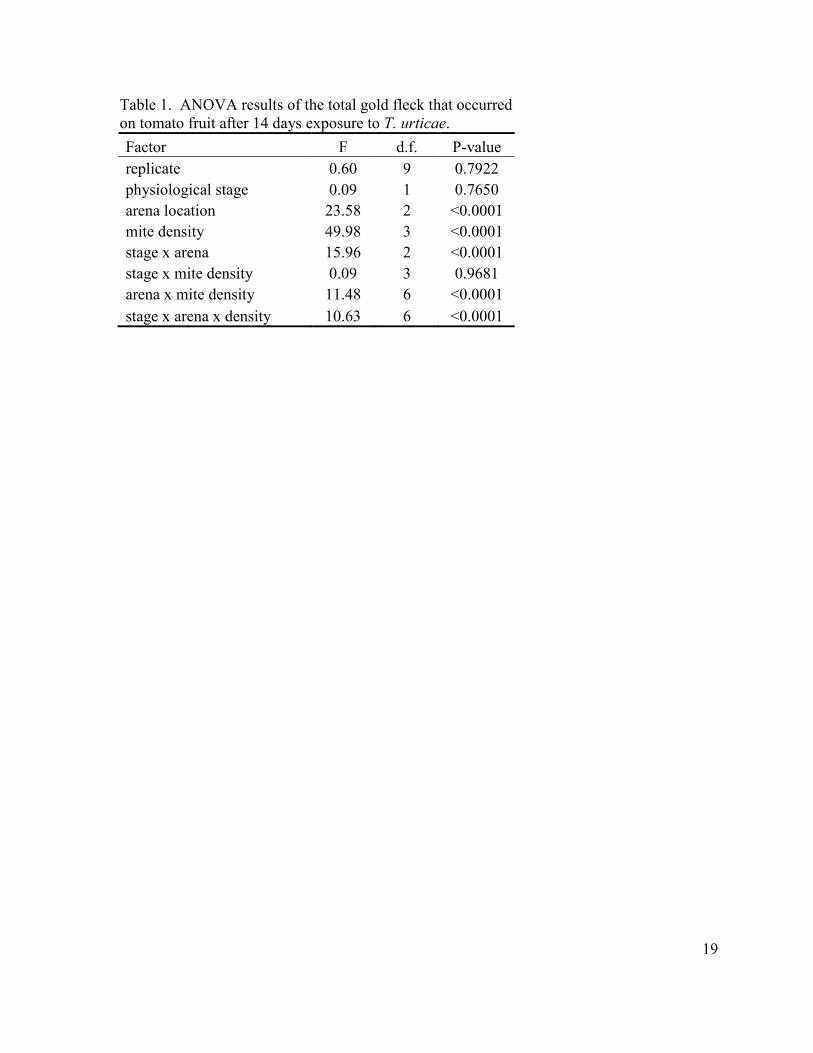
Laboratory Study: The results from the GLM procedure showed that arena type,
mite density, and the interactions of physiological stage and arena location, arena location
and mite density, and physiological stage, arena location, and mite density were all
significant factors affecting the total amount of gold fleck present at the end of 14 days
14
(Table 1). The amount of gold fleck in the vine ripe stage was significantly greater in the
fruit that had arenas that contained no calyx when compared to those that had a calyx (t =
2.61, P = 0.0104) or those that had an arena on the bottom of the fruit (t = 4.94, P < 0.0001).
Fruit which had an arena that contained a calyx had significantly more gold fleck than those
fruit which had an arena on the bottom (t = 2.33, P = 0.0220). Within those fruit that
contained a calyx the 50 mite density had significantly more gold fleck than the 1 (t = -4.99,
P < 0.0001) and 8 mite (t = -3.96, P < 0.0001) densities and the control (t = 5.53, P <
0.0001). The same was also true for those fruit without a calyx. The 50 mite density had
significantly more gold fleck than the 1 (t = -4.78, P < 0.0001) and 8 mite (t= -3.66, P <
0.0001) densities and the control (t = 4.96, P < 0.0001). There was no difference in the
amount of gold fleck in any of mite densities on fruit that had an arena on the bottom of the
fruit.
The amount of gold fleck in the mature green fruit was significantly greater in those
fruit that had an arena that contained a calyx as compared to those with an arena that
contained no calyx (t = 6.50, P < 0.0001) or an area located on the bottom of the fruit
(t = 8.50, P < 0.0001). Fruit with an arena that contained no calyx had significantly more
gold fleck than fruit with an arena on the bottom of the fruit (t = 2.0, P = 0.0477). Within
those fruit that contained a calyx the 50 mite density had significantly more gold fleck than
the 1 (t = -9.79, P < 0.0001) and 8 mite (t = -7.96, P < 0.0001) densities and the control (t =
10.2, P < 0.0001). The 8 mite density also had significantly more gold fleck than the
control (t = 2.24, P = 0.0335). The 50 mite density had significantly more gold fleck than
the control (t = 2.83, P = 0.0086) in the fruit that had the calyx removed. Within the fruit that
15
had an arena on the bottom the 50 mite density had significantly more gold fleck than that of
the 1 mite density (t = -2.79, P = 0.0096) and the control (t = 2.79, P = 0.0096).
Discussion
Gold fleck consists of small irregular light-green to white spots that turn yellow as
fruit ripen and is considered a cosmetic blemish that can affect the marketability of the fruit
resulting in economic losses (Ghidiu et al. 2006). Resulting gold fleck on tomato fruit is the
result of direct feeding on that fruit by sucking insects such as western flower thrips (Ghidiu
et al. 2006), however it has also been observed on tomato fruit from fields containing high
densities of T. urticae.
The greenhouse study demonstrated that confining T. urticae to tomato fruit did
indeed result in gold fleck. The gold fleck symptoms on these fruit did not cover large areas
of the fruit (< 10%), which can be attributed to the fact that there was healthy calyx and stem
material for T. urticae to feed on besides the fruit itself. Based on a preliminary study
conducted in the laboratory, when presented a choice of green foliage and the surface of
tomato fruit, T. urticae preferred to feed on green foliage.
Field trials showed that as T. urticae densities increased there was an increase in the
proportion of fruit that was affected by gold fleck. In these studies, however, a large
proportion of the fruit was affected by gold fleck (up to 74%), even at lower mite densities.
The extensive surface area affected may have been due to other arthropods, in addition to T.
urticae, feeding on the fruit such as thrips (Ghidiu et al. 2006). Thrips pressure was very
high at the MHCRS in 2007 and 2008 (J.F. Walgenbach, unpublished data). In 2007, thrips
16
were managed only after higher numbers were detected. This reactive approach may not
have been sufficient to prevent thrips from feeding on tomato fruit, and may account for the
high proportion of fruit affected by gold fleck in the plots with low mite populations. In
2008 a more preventative approach to thrips management was undertaken by applying
insecticides on a weekly basis. Thrips pressure was not as high in 2009 as previous years
(J.F. Walgenbach, unpublished data), however the plots with the lowest mite populations still
had between 13 and 63 percent of fruit affected by gold fleck.
The laboratory studies provided additional evidence that mites did indeed cause gold
fleck on tomato fruit, however, gold fleck was most apparent when the fruit was exposed to
high densities of T. urticae. The top of the fruit provided T. urticae places of shelter in or
around the calyx and allowed them to successfully colonize and feed on the fruit. The
bottom of the fruit provided no place of refuge and therefore they presumably wandered until
getting caught in the lanolin ring.
The fact that there was no gold fleck on the control fruit suggests that the gold fleck
in this study was a direct result of T. urticae presence on the tomato fruit. These data also
show that both mature green and breaker stage fruit are susceptible to T. urticae feeding.
While Ghidiu et al. (2006) found that it took approximately three weeks for gold fleck to
occur when tomato fruit were exposed to F. occidentalis, our study showed that gold fleck
due to T. urticae can occur within three days at high densities.
The study provides evidence that T. urticae is capable of causing gold fleck on
mature green and breaker stage fruit. When spider mites feed on leaf tissue they penetrate
the plant with their stylets and remove the cell contents, damaging the epidermal cell layers
17
(Tomczyk and Kropczyńska 1985). Feeding symptoms are small light colored punctures
which develop into irregularly shaped white or greyish spots. Sances et al. (1979) found T.
urticae fed mainly in the mesophyll tissue, but injury may also occur in the parenchyma
layers. Some authors have observed open spaces between the mesophyll layers after feeding
by spider mites (Mothes and Seitz 1982; Tanigoshi and Davis 1978). Gold fleck damage to
fruit could be very similar to feeding damage to leaf tissue. Tetranychus urticae feeding on
fruit most likely resulted in damage to the epidermal layer. Cell contents may be removed in
a similar manner and empty cells or spaces between cells may create whitish spots on green
fruit due to the light color of the underlying epidermal layers. As fruit ripen, chlorophyll is
destroyed and there is an increase in carotenoids, which cause the fruit to turn green to
yellow to pink, and finally to red (Saltveit 2005). Empty cells occurring on the surface of
red-ripe fruit would appear to be orange to yellow from the color of the underlying epidermal
cells. Figure 5 shows the difference between a gold fleck affected tissue and an unaffected
red-ripe tomato tissue. Though the mechanism responsible for the appearance of gold fleck
was not investigated, this study demonstrates conclusively that T. urticae feeding on tomato
fruit can result in gold fleck symptoms.
References
Campbell R. J., Mobley K. �., Marini R. P. 1990. Growing conditions influence mite damage on apple and peach leaves. HortScience. 25: 445–448. DeAngelis, J.D., K.C. Larson, R.E. Berry, G.W. Krantz. 1982. Effects of spider mite injury on transpiration and leaf water status in peppermint. Environ. Entomol. 11: 975-978. Ghidiu, G.M., E.M. Hitchner, and J.E. Funderburk. 2006. Goldfleck damage to tomato fruit caused by feeding of Frankliniella occidentalis (Thysanoptera: Thripidae). Florida Entolomogist. 89: 279-281.
18
Ivors, K. 2010. Commercial Production of Staked Tomatoes in the Southeast. NC Coop. Ext. Serv. Publ. AG-405.
Meck, E.D., J.F. Walgenbach, and G.G. Kennedy. 2009. Effect of vegetation management on autumn dispersal of Tetranychus urticae (Acari: Tetranychidae) from tomato. J. Appl. Entomol. 133: 742-748. Mothes, U. and K.A. Seitz 1982. Fine structural alternations of bean plant leaves by feeding injury of Tetranychus urticae Koch (Acari: Tetranychidae). Acarologia. 23: 149-157.
Park, Y-L and J-H Lee. 2002. Leaf cell and tissue damage of cucumber caused by twospotted spider mite (Acari: Tetranychidae). J. Econ. Entomol. 95: 952-957. Saltveit, M.E. 2005. Fruit Ripening and Fruit Quality. pp. 145-170, in Heuvelink, E. (ed.) Tomatoes. CABI Publishing. Wallingford, UK. Sances, F.V., J.A. Wyman, J.P.T. Ting. 1979. Morphological responses of strawberry leaves to infestations of the two-spotted spider mite. J. Econ. Entomol. 72: 710-713. Sances, F.V., J.A. Wyman, I.P. Ting, R.A. Van-Steenwyk, E.R. Oatman. 1981. Spider mite interactions with photosynthesis transpiration and productivity of strawberry. Environ. Entomol. 10: 442-448. SAS Institute. 2006. SAS 9.1 for Windows. SAS Institute, Cary, NC. Tanigoshi, L.K. and R.W. Davis. 1978. An ultrastructural study of Tetranychus mcdanieli feeding injury to the leaves of ‘Red Delicious’ apple (Acari: Tetranychidae). Int. J. Acarol. 4: 47-56. Tomczyk, A and D. Kropczyńska. 1985. Effects on the Host Plant. pp. 312-330, in W. Helle and M.W. Sabelis (eds). Spider Mites, Their Biology, Natural Enemies and Control. Elsevier, Amsterdam, Vol 1A.
19
Table 1. ANOVA results of the total gold fleck that occurred on tomato fruit after 14 days exposure to T. urticae.
Factor F d.f. P-value
replicate 0.60 9 0.7922
physiological stage 0.09 1 0.7650
arena location 23.58 2 <0.0001
mite density 49.98 3 <0.0001
stage x arena 15.96 2 <0.0001
stage x mite density 0.09 3 0.9681
arena x mite density 11.48 6 <0.0001
stage x arena x density 10.63 6 <0.0001
20
Figure 1. A bag constructed of organza material for caging mites on a flower or fruit cluster.
21
Figure 2. Proportion of tomato fruit affected by gold fleck in the early and late planted field trials in 2007.
Late Planting
Early Planting
22
Figure 3. Proportion of tomato fruit affected by gold fleck in the early and late planted field trials in 2008.
Late Planting
Early Planting
23
Figure 4. Proportion of tomato fruit affected by gold fleck in the early and late planted field trials in 2009.
Early Planting
Late Planting
24
Figure 5. An image of tomato fruit tissues that are unaffected (left) and affected (right) by gold fleck (40X magnification).
Unaffected Affected
25
Chapter 2: Impact of twospotted spider Tetranychus urticae (Acari:
Tetranychidae) on staked tomato yields and marketable yields in western
�orth Carolina
Introduction
The yield of a tomato crop is determined by total biomass production, biomass
partitioning, and fruit dry matter content, and can range from 40 to 100 tonnes/ha in field-
grown crops (Heuvelink and Dorais 2005). These attributes may also influence yield by
affecting fruit quality (size and taste). Biomass production is primarily driven by
photosynthesis, which allows the plant to make sugars and other assimilates from carbon
dioxide and water in the presence of sunlight. Fruit set is primarily influenced by assimilate
availability (Heuvelink 2005a). Developing fruits act as sinks that drain photosynthesized
sugars and other nutrients away from nearby leaves, and as more fruits are produced, they
increasingly monopolize the resources of the plant. Tomato plants stressed early in their fruit
development period may be unable to support both additional vegetative growth and
continued fruit development. Such a premature cessation of growth results in smaller plants
and reduced yields (Saltveit 2005). Biotic and abiotic factors that can affect tomato yields
and fruit quality by limiting plant growth and/or the ability to produce photoassimilates
include insects, bacteria, fungi, viruses, nematodes, weeds (Csizinszky et al. 2005), light,
temperature, relative humidity, carbon dioxide, and nutrient availability (Heuvelink and
Dorais 2005).
26
The twospotted spider mite, Tetranychus urticae Koch, is a serious pest of tomatoes in
central and western North Carolina (Meck et al. 2009). Spider mites feed on host plants by
inserting their stylets into leaf tissue and removing cell contents (Tomczyk and Kropczyńska
1985). Loss of stomatal function may result from dehydrated cells limiting tugor in guard
cells (Sances et al. 1979). Feeding injury also results in the destruction of chloroplasts, loss
of leaf chlorophyll, and a reduction in the net photosynthetic rate (Park and Lee 2002;
Campbell et al. 1990; DeAngelis et al. 1982; Sances et al. 1982, 1981), which can cause
yellowish to whitish discoloration of the leaf, often referred to as bronzing (Tomczyk and
Kropczyńska 1985). The resulting injury from spider mite feeding can severely affect the
plant’s physiological processes leading to changes in growth intensity, flowering, and yield
(Tomczyk and Kropczyńska, 1985; Sances et al. 1982, 1981). Tetranychus urticae can also
feed directly on the fruit resulting in a cosmetic blemish known as gold fleck (Chapter 1).
The objective of this study was to determine the impact of different densities of T. urticae on
staked tomato yield and profitability.
Materials and Methods
A randomized complete block design factorial experiment consisting of two planting
dates (early and late) and different densities of T. urticae was conducted at the Mountain
Horticultural Crops Research Station (Mills River, NC) in 2007, 2008, and 2009. Six-week-
old tomato transplants (‘Crista’) were planted into single 6.10 m long bedded rows (2007 and
2009) and 7.62 m long bedded rows (2008) on 3.05 m spacing. Early planting dates were 10,
9, and 14 May, and late planting dates were 28, 26, and 25 June in 2007, 2008, and 2009,

27
respectively. Plants were grown according to North Carolina cooperative extension
recommendations for staked tomato production (Ivors 2010). Raised soil beds were covered
with black polyethylene mulch and fumigated with methyl bromide (224.17 kg/ha Bro-Mean
C-33, 67% methyl bromide + 33% chloropicrin, Reddick Fumigants, Williamston, NC) in
2007 and 2008, and chloropicrin (173.72 kg/ha Pic-Clor60, 59.4% chloropicrin + 39% 1,3-
Dichloropropene, Cardinal Professional Products, Hollister, CA) in 2009, with drip irrigation
placed below the bed surface and offset from the center of the bed. Transplants were spaced
0.46 m apart within the row. Plants were staked, strung, and irrigated as needed during the
growing season, and all treatments received the same fungicide and insecticide maintenance
program. Beginning at fruit set, additional fertilizer in the forms of soluble calcium and
potassium nitrate (5.61 kg N/ha) was applied through the irrigation system and alternated in
their usage from week to week until the plant nitrogen requirement was met.
Tetranychus urticae were introduced to the transplants from a laboratory colony
grown on bush beans (Phaseolus vulgaris L.) three days prior to being planted into the field.
Different mite density treatments were created by applying an acaricide whenever mite
densities reached or exceeded predetermined thresholds of 0 (preventive weekly
applications), 1, 25, and 50 mites per leaflet in 2007, and 0, 1, 8, 17, 25 and 50 mites per
leaflet in 2008 and 2009. A non-treated control was also included. Mite counts were
recorded weekly from the innermost 10 plants in 2007 and 2009 and the innermost 12 plants
in 2008. On each sample date, mite populations were estimated by using a 10X optivisor to
count the number of motile T. urticae on the underside of the terminal leaflet of the second or
third most recently expanded leaf. If a terminal leaflet was not available the leaflet located
28
nearest the terminal was sampled. Densities averaged across replicates were used to
determine the need for an acaricide application in a given treatment. Acaricides used
included 0.01 kg/ha abamectin (Agrimek 0.15EC, Syngenta, Greensboro, NC), 0.45 kg/ha
bifenazate (Acramite 50WS, Chemtura, Middlebury, CT), and 0.11 kg/ha spiromesifen
(Oberon 2SC, Bayer, Research Triangle Park, NC). In order to measure seasonal mite
intensity, cumulative mite days (CMD) were calculated for each treatment by multiplying the
average number of mites per leaflet on successive sample days by the sample interval (days)
and adding the number of mite days accumulated throughout the growing season.
To estimate crop yield, breaker stage to red-ripe fruit were harvested weekly from the
middle six plants of each plot. All fruit were graded and weighed. Fruit with insect damage
(excluding gold fleck), physiological disorders, or disease were counted and weighed and
placed into the cull category. All other fruit were considered marketable.
Marketable fruit were placed into two categories: fruit that had no gold fleck (clean
fruit) and fruit that had gold fleck. Fruit from each of these categories were separately size
graded and weighed. Sizes included jumbo (> 9.2 cm diameter), extra large (7.6 - 9.2 cm),
large (5.7 - 7.6 cm), and unders (< 5.7 cm). Gold fleck affected fruit were given a rating of
1 - 4 based on the percentage area affected; 1 = > 0 - 5%, 2 = 5 - 25%, 3 = 25 - 50%, and
4 = > 50% of the surface area affected. Using a rating of 0 for fruit not affected by gold fleck
an average gold fleck rating was calculated for each threshold level.
In 2007 and 2008 the early planting was harvested 8 times and the late planting was
harvested six times. In 2009 the early planting was harvested six times and the late planting
was harvested three times.
29
An economic analysis was conducted by subtracting total production costs from gross
receipts to calculate net profits generated from each treatment. Costs were based on budget
enterprises for staked tomatoes in western North Carolina (NCSU 2002) and updated with
values from a commercial grower. Fixed costs were applied to all treatments and included
factors such as stakes, plastic, pesticides (excluding acaricides), irrigation, labor and
machinery, and averaged $17,812.57 per ha. Variable costs were calculated separately for
each treatment and included grading, boxes, brokerages fees, and acaricide costs. Tomato
prices were obtained from the terminal shipping point in Columbia, SC for the days that the
tomatoes were harvested. Prices for jumbo, extra-large, and large grades were averaged to
obtain a seasonal fixed price for each size grade from which gross profits were calculated.
The fixed and variable costs were subtracted from gross profits to calculate net profits
generated from each treatment.
Yield data, mean fruit weights, numbers of fruit, and net profits were analyzed as a
factorial design using replicate as a random variable in the Mixed procedure (SAS Institute
2006). Marketable yields, including and excluding gold fleck, were compared by treatment
within year, planting date, and threshold level using a t-test.
Results
In both the early and late plantings T. urticae populations started out low, and it took
several weeks to increase (Fig. 1). Year, planting date, and mite threshold level were all
significant factors affecting total and marketable yield, including and excluding gold fleck
(Table 1). There was also a significant year x plant date interaction when gold-fleck fruit
30
were removed from the marketable category. Early planted tomatoes had higher total (t =
16.62, P < 0.0001) and marketable yields (t = 12.38, P < 0.0001) with gold fleck not removed
and (t = 7.75, P < 0.0001) for gold fleck removed compared to late planted tomatoes.
Year, planting date, and mite threshold level, as well as the year x planting date
interaction, were significant factors affecting profits regardless of whether gold fleck was
considered marketable or non-marketable (Table 2). Profits from early planted tomatoes
were greater than late plantings for both marketable fruit that included gold fleck (t = 12.9, P
< 0.0001) and when gold fleck was removed (t = 7.29, P < 0.0001).
Finally, year, planting date, mite threshold level, and the year x planting date
interaction were all significant factors affecting mean fruit weight and number of fruit (Table
3). Early planted tomatoes had significantly larger fruit (t = 10.27, P < 0.0001) and number
of fruit (t = 21.40, P < 0.0001) compared to the late planting.
Early Planting. Total yields varied considerably among years, ranging from an
average of 88.3 tonnes/ha in 2009 to 107.5 tonnes/ha in 2007. Total yields were significantly
greater in 2007 versus 2009, (t = 2.56, P = 0.018), but 2008 total yields (99.3 tonnes/ha) did
not differ from either 2007 or 2009. The intensity of mite populations also varied among
years, with values in the non-treated controls ranging from 1881 mite days in 2009 to 3054
mite days in 2007 (Table 4). As expected, cumulative mite days were lower in lower
threshold treatments which received more frequent acaricide applications. Despite the
frequent acaricide applications in the 0 threshold treatment (11 applications in 2007 and 8 in
2008 and 2009), it was not possible to totally exclude mites from these treatments.
In 2007 when yields were highest there was a significant reduction in total yield that
31
occurred in the 50 mites per leaflet threshold (1668 CMD) and the non-treated control (3054
CMD) compared to the lowest threshold treatment. In 2008, the highest yields were
observed in thresholds ranging from 1 to 17 mites per leaflet (CMD ranged from about 110 to
680 in these treatments), while the 0 threshold treatment did not differ significantly from the
control. There were no significant total yield differences in 2009 when yields were
considerably lower than in previous years. There was no consistent trend observed in fruit
size, but the control produced the fewest total number of fruits in all years, with the higher
yielding treatments generally having more fruit.
In 2008 the proportion of fruit affected by gold fleck were lowest in the 0 mite
thresholds (4.9%), and increased as threshold level increased with the highest proportion of
gold fleck occurring in the non-treated control (90.8%) (Table 5). The average gold fleck
rating followed the same trend with a rating of 0.09 in the 0 mite threshold, and 2.72 in the
non-treated control. The proportion of fruit affected by gold fleck and the average gold fleck
rating was more variable in 2007 and 2009, but in both cases the greatest proportion of fruit
affected and the highest gold fleck rating occurred in the non-treated controls.
When gold-fleck affected fruit were considered marketable, overall marketable yields
averaged 63.5% (± 1.3) of total yield. Marketable yields varied in a similar manner to total
yield, with the highest levels of marketable yield occurring in those treatments with the
highest total yield. In 2007 the only treatment that differed from the control was the 0
threshold treatment, and in 2008 the 1, 8, and 17 mite per leaflet threshold all had
significantly higher yields than the control, and there were no differences among threshold
levels in 2009. Despite the differences in marketable yields, there was no significant
32
difference in profits in 2007 (Fig. 2). In 2008 significantly higher profits were observed in
both the 1 and 8 mites per leaf threshold level treatments had compared to the non-treated
control (Fig. 3). There were no significant differences in profits in 2009 (Fig. 4).
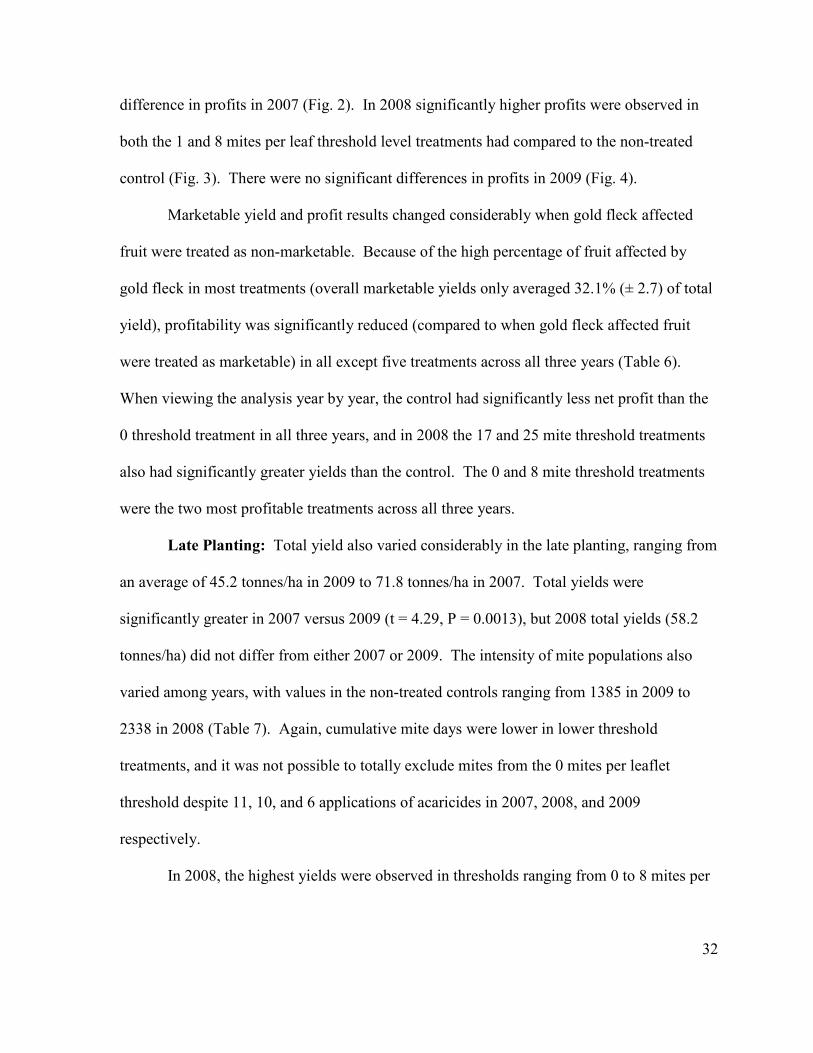
Marketable yield and profit results changed considerably when gold fleck affected
fruit were treated as non-marketable. Because of the high percentage of fruit affected by
gold fleck in most treatments (overall marketable yields only averaged 32.1% (± 2.7) of total
yield), profitability was significantly reduced (compared to when gold fleck affected fruit
were treated as marketable) in all except five treatments across all three years (Table 6).
When viewing the analysis year by year, the control had significantly less net profit than the
0 threshold treatment in all three years, and in 2008 the 17 and 25 mite threshold treatments
also had significantly greater yields than the control. The 0 and 8 mite threshold treatments
were the two most profitable treatments across all three years.
Late Planting: Total yield also varied considerably in the late planting, ranging from
an average of 45.2 tonnes/ha in 2009 to 71.8 tonnes/ha in 2007. Total yields were
significantly greater in 2007 versus 2009 (t = 4.29, P = 0.0013), but 2008 total yields (58.2
tonnes/ha) did not differ from either 2007 or 2009. The intensity of mite populations also
varied among years, with values in the non-treated controls ranging from 1385 in 2009 to
2338 in 2008 (Table 7). Again, cumulative mite days were lower in lower threshold
treatments, and it was not possible to totally exclude mites from the 0 mites per leaflet
threshold despite 11, 10, and 6 applications of acaricides in 2007, 2008, and 2009
respectively.
In 2008, the highest yields were observed in thresholds ranging from 0 to 8 mites per
33
leaflet (CMD ranged from about 61 to 412 in these treatments), which were significantly
greater than the yields in the 50 mites per leaflet threshold and the non-treated control. There
were no significant total yield differences in 2007 or 2009. There was no consistent trend
observed in fruit size or fruit numbers in the late planting.
In 2008 the proportion of fruit affected by gold fleck were lowest in the 0 mite
thresholds (0.7%), and increased as threshold level increased with the highest proportion of
gold fleck occurring in the non-treated control (98.8%) (Table 8). The average gold fleck
rating followed the same trend with a rating of 0.01 in the 0 mite threshold, and 2.93 in the
non-treated control. The same trend was observed in 2009. The proportion of fruit affected
by gold fleck and the average gold fleck rating was more variable in 2007, but the greatest
proportion of fruit affected and the highest gold fleck rating occurred in the non-treated
control.
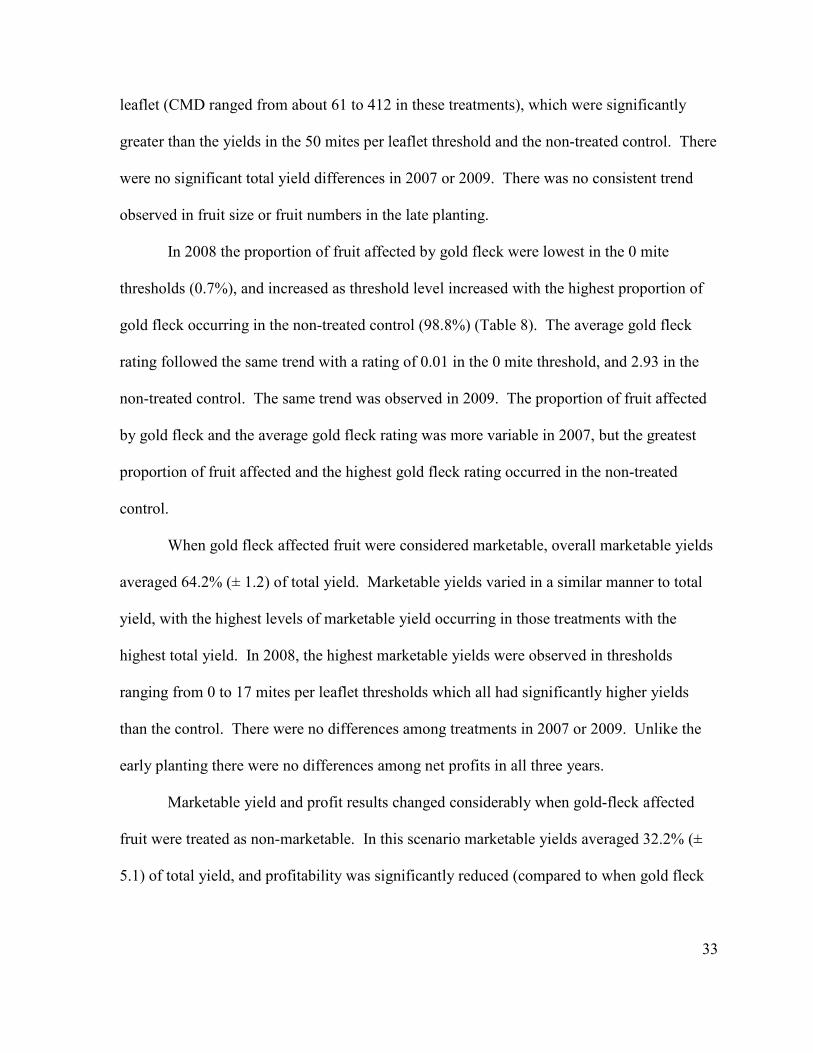
When gold fleck affected fruit were considered marketable, overall marketable yields
averaged 64.2% (± 1.2) of total yield. Marketable yields varied in a similar manner to total
yield, with the highest levels of marketable yield occurring in those treatments with the
highest total yield. In 2008, the highest marketable yields were observed in thresholds
ranging from 0 to 17 mites per leaflet thresholds which all had significantly higher yields
than the control. There were no differences among treatments in 2007 or 2009. Unlike the
early planting there were no differences among net profits in all three years.
Marketable yield and profit results changed considerably when gold-fleck affected
fruit were treated as non-marketable. In this scenario marketable yields averaged 32.2% (±
5.1) of total yield, and profitability was significantly reduced (compared to when gold fleck
34
affected fruit were treated as marketable) in all treatments except the 0, 1, 8 mites per leaflet
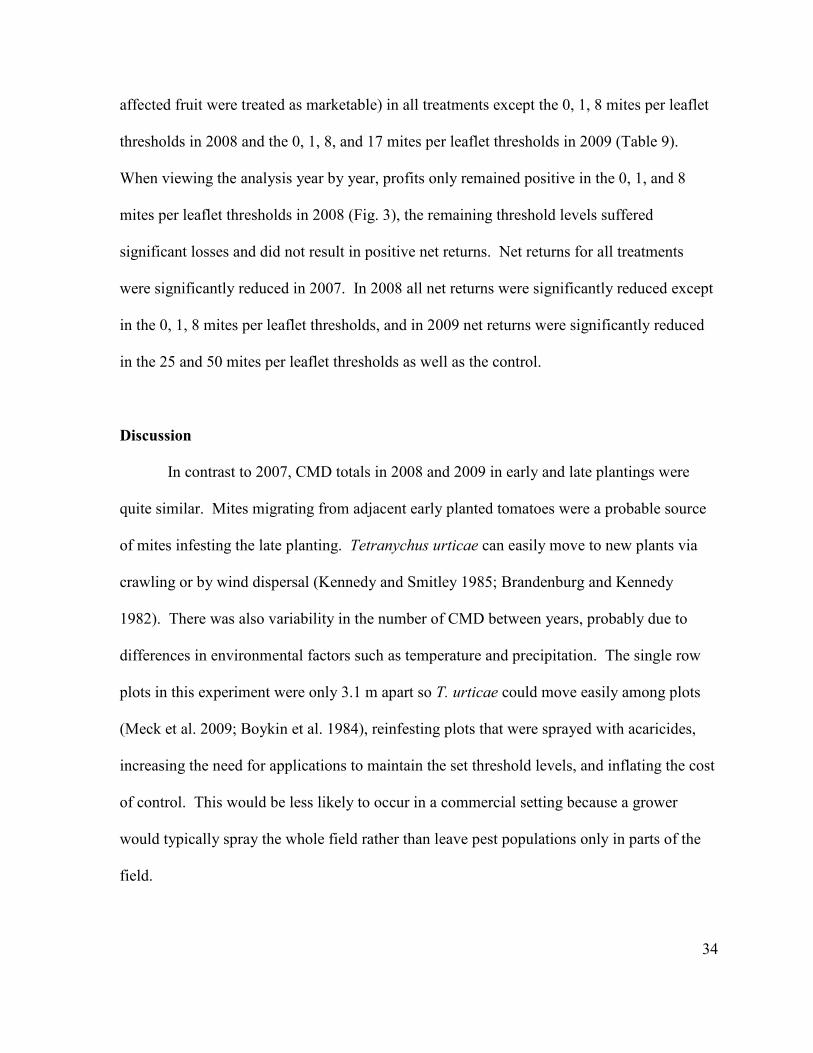
thresholds in 2008 and the 0, 1, 8, and 17 mites per leaflet thresholds in 2009 (Table 9).
When viewing the analysis year by year, profits only remained positive in the 0, 1, and 8
mites per leaflet thresholds in 2008 (Fig. 3), the remaining threshold levels suffered
significant losses and did not result in positive net returns. Net returns for all treatments
were significantly reduced in 2007. In 2008 all net returns were significantly reduced except
in the 0, 1, 8 mites per leaflet thresholds, and in 2009 net returns were significantly reduced
in the 25 and 50 mites per leaflet thresholds as well as the control.
Discussion
In contrast to 2007, CMD totals in 2008 and 2009 in early and late plantings were
quite similar. Mites migrating from adjacent early planted tomatoes were a probable source
of mites infesting the late planting. Tetranychus urticae can easily move to new plants via
crawling or by wind dispersal (Kennedy and Smitley 1985; Brandenburg and Kennedy
1982). There was also variability in the number of CMD between years, probably due to
differences in environmental factors such as temperature and precipitation. The single row
plots in this experiment were only 3.1 m apart so T. urticae could move easily among plots
(Meck et al. 2009; Boykin et al. 1984), reinfesting plots that were sprayed with acaricides,
increasing the need for applications to maintain the set threshold levels, and inflating the cost
of control. This would be less likely to occur in a commercial setting because a grower
would typically spray the whole field rather than leave pest populations only in parts of the
field.
35
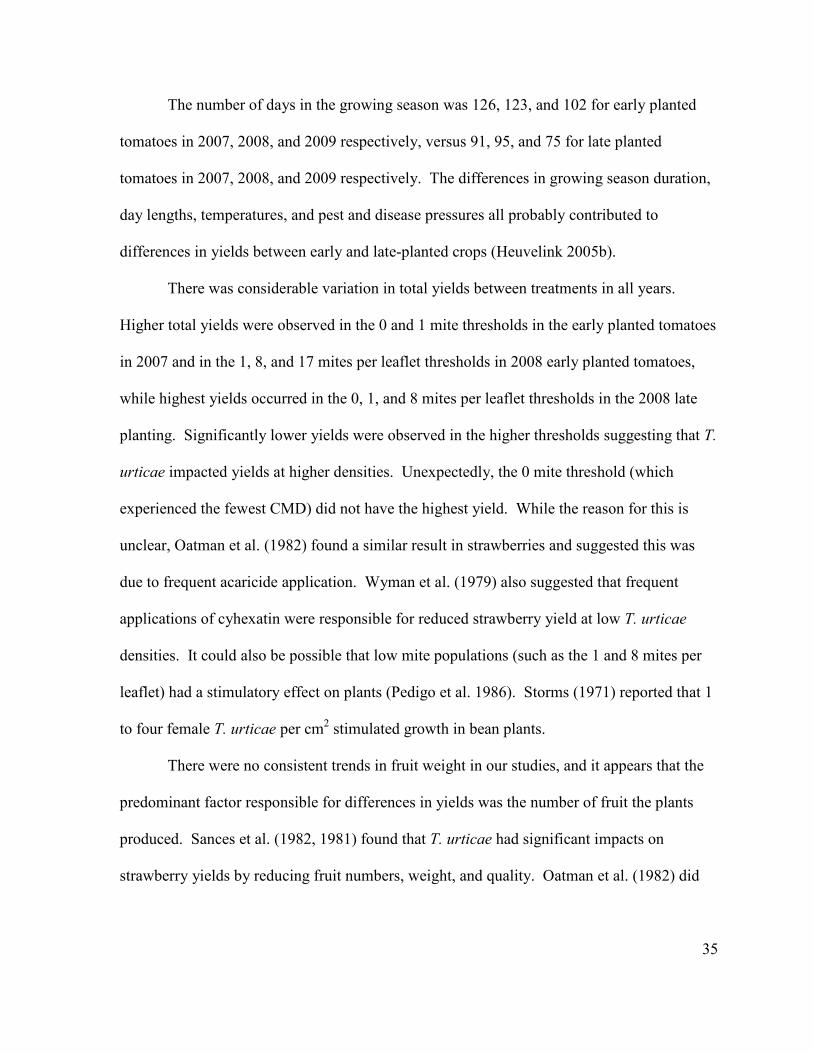
The number of days in the growing season was 126, 123, and 102 for early planted
tomatoes in 2007, 2008, and 2009 respectively, versus 91, 95, and 75 for late planted
tomatoes in 2007, 2008, and 2009 respectively. The differences in growing season duration,
day lengths, temperatures, and pest and disease pressures all probably contributed to
differences in yields between early and late-planted crops (Heuvelink 2005b).
There was considerable variation in total yields between treatments in all years.
Higher total yields were observed in the 0 and 1 mite thresholds in the early planted tomatoes
in 2007 and in the 1, 8, and 17 mites per leaflet thresholds in 2008 early planted tomatoes,
while highest yields occurred in the 0, 1, and 8 mites per leaflet thresholds in the 2008 late
planting. Significantly lower yields were observed in the higher thresholds suggesting that T.
urticae impacted yields at higher densities. Unexpectedly, the 0 mite threshold (which
experienced the fewest CMD) did not have the highest yield. While the reason for this is
unclear, Oatman et al. (1982) found a similar result in strawberries and suggested this was
due to frequent acaricide application. Wyman et al. (1979) also suggested that frequent
applications of cyhexatin were responsible for reduced strawberry yield at low T. urticae
densities. It could also be possible that low mite populations (such as the 1 and 8 mites per
leaflet) had a stimulatory effect on plants (Pedigo et al. 1986). Storms (1971) reported that 1
to four female T. urticae per cm2 stimulated growth in bean plants.
There were no consistent trends in fruit weight in our studies, and it appears that the
predominant factor responsible for differences in yields was the number of fruit the plants
produced. Sances et al. (1982, 1981) found that T. urticae had significant impacts on
strawberry yields by reducing fruit numbers, weight, and quality. Oatman et al. (1982) did
36
not observe any yield differences in strawberries that were treated for T. urticae, however
there was a difference between all treatments and the non-treated control plot. There were no
treatment differences in 2009 yields, and this was probably due to the poor quality tomato
crop associated with excessive rainfall and high disease pressure; 65.3 cm of rain from May
through September compared to 34.1 cm and 30.6 cm in 2007 and 2008 respectively (State
Climate Office of NC 2010). Poor host plant quality and high moisture levels can effect the
development, reproduction, and longevity of spider mites (Crooker 1985; Van der Geest
1985; Nickel 1960; Boudreaux 1958), which may have limited the impact of spider mites on
tomatoes in 2009.
Gold fleck was an important and consistent factor that affected fruit throughout the
study. Marketable yields were reduced, on average, by approximately 50% in early and 52%
in late planted tomatoes when gold fleck affected fruit were removed from the marketable
category. The incidence and intensity of gold fleck was affected by the density of mites on
tomatoes and both incidence and intensity of gold fleck increased as the threshold level
increased. In 2007 all marketable yields were significantly reduced when gold fleck affected
fruit were removed showing that gold fleck does indeed impact marketable yields, however
in 2008 the 0 and 1 mite per leaflet thresholds in the early planting and 0, 1, and 8 mites per
leaflet thresholds in the late planting had few fruit affected by gold fleck so no reduction in
marketable yield was observed in either planting. This suggests that when T. urticae along
with other gold fleck causing arthropods is properly managed there should not be a reduction
in marketable yield due to gold fleck. The same trend was observed in the late planting of
2009. The incidence of gold fleck on fruit in 2008 was unique relative to 2007 and 2009 in
37
that this was the only year in which there were relatively low levels of gold fleck on low-
threshold treatment fruit. For instance, the incidence of gold fleck fruit in the 0 mites per
leaflet threshold treatments of the early and late plantings in 2008 were only 5.9 and 0.7%,
respectively, while in 2007 > 50% of fruit in the 0 mites per leaflet threshold treatment were
affected by gold fleck. The relatively high incidence of gold fleck in low threshold
treatments in certain years suggests that other factors may also have caused gold fleck.
Gold fleck is the result of arthropods feeding directly on the tomato fruit, specifically
western flower thrips has been shown to cause gold fleck on tomato (Ghidiu et al. 2006) as
well as twospotted spider mite (Chapter 1). Western flower thrips pressure was high in 2007
(J.F.W, unpublished data), and were managed only after higher numbers were detected. This
reactive approach may not have been sufficient to prevent thrips from feeding on tomato fruit
and causing gold fleck in all treatments. In 2008 a more preventative approach to thrips
management was undertaken by applying insecticides effective against thrips on a weekly
basis, thereby preventing thrips induced gold fleck. Also, some replicates may have
exceeded the predetermined mite threshold levels while others may have been well under the
threshold level affecting the amount of gold fleck present in all threshold levels. Depending
on the market in which the fruit are intended to be sold, gold fleck may not be an issue. Fruit
intended for the conventional fresh market must be blemish free, whereas farmer’s markets,
roadside stands, and some canning markets may allow for sale of gold fleck affected fruit,
although the price of the fruit may also vary considerably in these different markets.
The maximum price received on any of the harvest dates was $1.40/kg and the lowest
was $0.50/kg, however, we chose to use a fixed price for tomatoes in each of three size

38
classes for each year independently. In the early planting greater yields resulted in higher
profits only in 2008, suggesting that differences in tomato sizes (diameter) and fruit prices
may make up for lower yields in terms of profit. When gold fleck affected fruit were
removed from the early planting there was a profit trend similar to that of the yield trend,
where lower thresholds were more profitable than higher thresholds, suggesting in this
scenario that profitability is based on yield. In the 2007 early planted tomatoes in the 25
mites per leaflet threshold and the control resulted in negative returns, and in the 2008 early
planted tomatoes in the 50 mites per leaflet threshold and the control resulted in negative
returns indicating economic losses. In 2009 the results were variable for the same reasons
discussed previously. There were no differences in profits in the late planted tomatoes when
gold fleck affected fruit were removed, except in 2008 where lower thresholds had greater
profits than higher thresholds. It was in this yield scenario that only the yields in the 0, 1,
and 8 mites per leaflet thresholds resulted in a profit, while all other treatments in all other
years showed negative returns. This suggests that when T. urticae is properly managed along
with other gold fleck causing arthropods, economic losses may be avoided, however growing
tomatoes in the presence of high populations of T. urticae may result in economic losses due
to low tomato prices and lower yield potential in late planted crops.
Tomato prices fluctuate throughout a season, depending on market demands, and can
affect economic injury levels (EIL’s) and thresholds (ET’s), because crop value is a comp1nt
of the EIL expression (Pedigo et al. 1986). The tolerance for T. urticae in tomatoes is
generally low and the EIL appeared to be about 8 mites per leaflet. However, due to the high
reproductive rate of T. urticae, an economic threshold of ~1 or 2 mites/leaflet may be
39
required to prevent loss. The findings presented here show that T. urticae can cause yield
and profit reductions from feeding on the plant, but gold fleck appears to be the most serious
and consistent consequence of T. urticae feeding on tomatoes. A more precise method of
measuring yield response and developing EIL’s and ET’s along with a sampling plan will be
key comp1nts in managing T. urticae in fresh market tomato systems.
References
Boudreaux, H.B. 1958. The effect of relative humidity on egg-laying, hatching, and survival in various spider mites. J. Insect Physiol. 2: 65-72. Boykin, L.S., W.V. Campbell, and L.A. �elson. 1984. Effect of barren soil borders and weed border treatments on movement of twospotted spider mite into peanut fields. Peanut Sci. 11: 52-55. Brandenburg, R.L. and G.G. Kennedy. 1982. Intercrop relationships and spider mite dispersal in a corn/peanut agroecosystem. Ent. exp. appl. 32: 269-276. Campbell R. J., Mobley K. �., Marini R. P. 1990. Growing conditions influence mite damage on apple and peach leaves. HortScience. 25: 445–448. Crooker, A. 1985. Embryonic and Juvenile Development, pp. 149-163, in W. Helle and M.W. Sabelis (eds). Spider Mites, Their Biology, Natural Enemies and Control. Elsevier, Amsterdam, Vol 1A. Csizinszky, A.A., D.J. Schuster, J.B. J1s, and J.C. van Lenteren. 2005. Crop Protection. pp.199-235, in E. Heuvelink (ed). Tomatoes. CABI Publishing, Cambridge.
DeAngelis, J.D., K.C. Larson, R.E. Berry, G.W. Krantz. 1982. Effects of spider mite injury on transpiration and leaf water status in peppermint. Environ. Entomol. 11: 975-978.
Ghidiu, G.M., E.M. Hitchner, and J.E. Funderburk. 2006. Goldfleck damage to tomato fruit caused by feeding of Frankliniella occidentalis (Thysanoptera: Thripidae). Florida Entomol. 89: 279-281
Heuvelink, E. 2005a. Developmental Processes. pp. 53-83, in E. Heuvelink (ed). Tomatoes. CABI Publishing, Cambridge.
40
Heuvelink, E. (ed). 2005b. Tomatoes. CABI Publishing, Cambridge. 339 pp.
Heuvelink, E. and M. Dorais. 2005. Crop Growth and Yield. pp.85-144, in E. Heuvelink (ed). Tomatoes. CABI Publishing, Cambridge.
Ivors, K. 2010. Commercial Production of Staked Tomatoes in the Southeast. NC Coop. Ext. Serv. Publ. AG-405. Kennedy, G.G. and D.R. Smitley. 1985. Dispersal, pp. 233-242, in W. Helle and M.W. Sabelis (eds). Spider Mites, Their Biology, Natural Enemies and Control. Elsevier, Amsterdam, Vol 1A. Meck, E.D., J.F. Walgenbach, and G.G. Kennedy. 2009. Effect of vegetation management on autumn dispersal of Tetranychus urticae (Acari: Tetranychidae) from tomato. J. Appl. Entomol. 133: 742-748. �CSU. 2002. North Carolina crop budgets. URL www.ag-econ.ncsu.edu/AgBudgets/vegetable.htm. �ickel, J.L. 1960. Temperature and humidity relationships of Tetranychus desertorum Banks with special reference to distribution. Hilgardia. 30: 41-100. Oatman, E.R., F.V. Sances, L.F. LaPré, �.C. Toscano, and V. Voth. 1982. Effects of different infestation levels of the twospotted spider mite on strawberry yield in winter plantings in southern California. J. Econ. Entomol. 75: 94-96. Park, Y-L and J-H Lee. 2002. Leaf cell and tissue damage of cucumber caused by twospotted spider mite (Acari: Tetranychidae). J. Econ. Entomol. 95: 952-957. Pedigo, L.P., S.H. Hutchins, and L.G. Higley. 1986. Economic injury levels in theory and practice. Ann. Rev. Entomol. 31: 341-368. Saltveit, M.E. 2005. Fruit Ripening and Fruit Quality. pp.145-170, in E. Heuvelink (ed). Tomatoes. CABI Publishing, Cambridge.
Sances, F.V., �.C. Toscano, E.R. Oatman, L.F. LaPré, M.W. Johnson, and V. Voth.
1982. Reductions in plant processes by Tetranychus urticae (Acari: Tetranychidae) feeding in strawberry. Environ. Entomol. 11: 733-737. Sances, F.V., J.A. Wyman, I.P. Ting, R.A. Van-Steenwyk, E.R. Oatman. 1981. Spider mite interactions with photosynthesis transpiration and productivity of strawberry. Environ. Entomol. 10: 442-448.

41
Sances, F.V., J.A. Wyman, J.P.T. Ting. 1979. Morphological responses of strawberry leaves to infestations of the two-spotted spider mite. J. Econ. Entomol. 72: 710-713. SAS Institute. 2006. SAS 9.1 for Windows. SAS Institute, Cary, NC.
State Climate Office of �C. 2010. NC cronos database: Mtn Horticultural Crops Res Stn, NC (FLET). URL http://www.nc-climate.ncsu.edu/cronos/?station=FLET Storms, J.J.H., 1971. Some physiological effects of spider mite infestations on bean plants. Neth. J. Plant Pathol. 77: 154-167. Tomczyk, A and D. Kropczyńska. 1985. Effects on the host plant. pp. 312-330, in W. Helle and M.W. Sabelis (eds). Spider Mites, Their Biology, Natural Enemies and Control. Elsevier, Amsterdam, Vol 1A. Van der Geest, L.P.S., 1985. Aspects of physiology. pp. 171-184, in W. Helle and M.W. Sabelis (eds). Spider Mites, Their Biology, Natural Enemies and Control. Elsevier, Amsterdam, Vol 1A. Wyman, J.A., E.R. Oatman, and V. Voth. 1979. Effects of varying twospotted spider mite infestation levels on strawberry yield. J. Econ. Entomol. 72: 747-753.

42
Table 1. ANOVA results for tomato yields in response to different densities of T. urticae across three years.
Yield Factor F d.f. P-value
Total Yield (all fruit) year 6.88 2 0.0123
mite density (year) 2.98 16 0.0006
plant date 279.19 1 <0.0001
year x plant date 0.73 2 0.4838
mite density x plantdate (year) 0.68 16 0.8093
Marketable Yield (clean + GFa fruit) year 5.74 2 0.0203
mite density (year) 2.49 16 0.0036
plant date 153.74 1 <0.0001
year x plant date 1.78 2 0.1752
mite density x plantdate (year) 0.55 16 0.9092
Marketable Yield (clean fruit only) year 4.85 2 0.0305
mite density (year) 13.59 16 <0.0001
plant date 55.58 1 <0.0001
year x plant date 5.5 2 0.0056
mite density x plantdate (year) 1.05 16 0.4141 a
Gold fleck

43
Table 2. ANOVA results for profits in response to different denstities of T. urticae across three years.
Yield Factor F d.f. P-value
Marketable Yield (clean + GFa fruit) year 8.16 2 0.0086
mite density (year) 2.00 16 0.0197
plant date 168.73 1 <0.0001
year x plant date 8.89 2 0.0003
mite density x plantdate (year) 0.51 16 0.9351
Marketable Yield (clean fruit only) year 8.41 2 0.0076
mite density (year) 12.09 16 <0.0001
plant date 53.77 1 <0.0001
year x plant date 10.44 2 <0.0001
mite density x plantdate (year) 1.52 16 0.1079 a
Gold fleck

44
Table 3. ANOVA results for total yield (all fruit), mean fruit weights, and fruit numbers in response to different denstities of T. urticae across three years.
Category Factor F d.f. P-value
Fruit Weight year 7.39 2 0.0124
mite density (year) 1.57 16 0.0915
plant date 96.77 1 <0.0001
year x plant date 182.39 2 <0.0001
mite density x plantdate (year) 1.37 16 0.1738
Fruit Numbers year 19.71 2 0.0004
mite density (year) 3.42 16 <0.0001
plant date 457.78 1 <0.0001
year x plant date 8.40 2 0.0004
mite density x plantdate (year) 1.25 16 0.2455

45
Table 4. Average (± SEM) total yield, mean fruit weight, and mean numbers of fruit for seven different T. urticae density levels in early planted tomatoes across three years.
Year
Mite Threshold Level
(per leaflet) CMD
(per leaflet) No.
Appls. Total Yield (tonnes/ha) a Fruit Weight (g) a Number of Fruit a
2007 0 177.1 ± 63.2 11 125.6 ± 0.1 a 250.4 ± 16.5 a 207.0 ± 12.3 a
1 297.5 ± 93.2 9 120.9 ± 0.1 ab 256.2 ± 10.7 a 199.8 ± 3.9 a
25 1145.1 ± 252.1 3 106.0 ± 0.3 abc 246.3 ± 15.0 a 174.8 ± 13.8 b
50 1667.7 ± 224.2 1 98.7 ± 0.3 bc 261.7 ± 5.8 a 153.3 ± 9.0 b
Control 3053.7 ± 84.0 0 86.5 ± 0.1 c 262.0 ± 14.3 a 138.0 ± 6.1 c
2008 0 66.7 ± 19.1 8 98.2 ± 0.1 abc 265.5 ± 12.5 ab 131.8 ± 20.8 ab
1 110.9 ± 27.6 7 108.3 ± 0.1 a 267.4 ± 8.2 ab 151.0 ± 10.2 a
8 662.8 ± 57.0 4 120.4 ± 0.1 a 282.3 ± 6.1 a 146.3 ± 9.6 a
17 680.8 ± 206.1 2 105.1 ± 0.2 ab 272.4 ± 10.0 a 149.8 ± 4.8 a
25 685.4 ± 204.8 2 94.6 ± 0.3 bc 262.5 ± 11.9 ab 134.5 ± 9.7 ab
50 1195.6 ± 86.7 1 93.5 ± 0.1 bc 269.0 ± 3.7 ab 141.5 ± 15.9 ab
Control 2108.2 ± 206.4 0 75.2 ± 0.2 c 245.5 ± 10.7 b 120.5 ± 17.4 b
2009 0 85.9 ± 19.1 8 86.1 ± 0.1 a 304.6 ± 16.5 a 118.3 ± 9.3 ab
1 153.6 ± 42.4 8 94.6 ± 0.1 a 277.9 ± 12.8 ab 142.5 ± 13.9 a
8 446.8 ± 71.1 4 91.3 ± 0.1 a 299.6 ± 11.1 a 127.5 ± 3.0 ab
17 663.6 ± 30.1 3 82.3 ± 0.1 a 249.3 ± 17.9 b 140.3 ± 16.0 a
25 787.7 ± 162.4 2 88.2 ± 0.2 a 286.9 ± 14.9 a 127.7 ± 5.9 ab
50 1103.6 ± 89.5 1 88.1 ± 0.1 a 293.7 ± 7.8 a 125.5 ± 4.8 ab
Control 1881.4 ± 183.3 0 87.6 ± 0.2 a 295.1 ± 19.0 a 114.3 ± 7.0 b a means followed by the same letter are not significantly different at P<0.05, T-test.
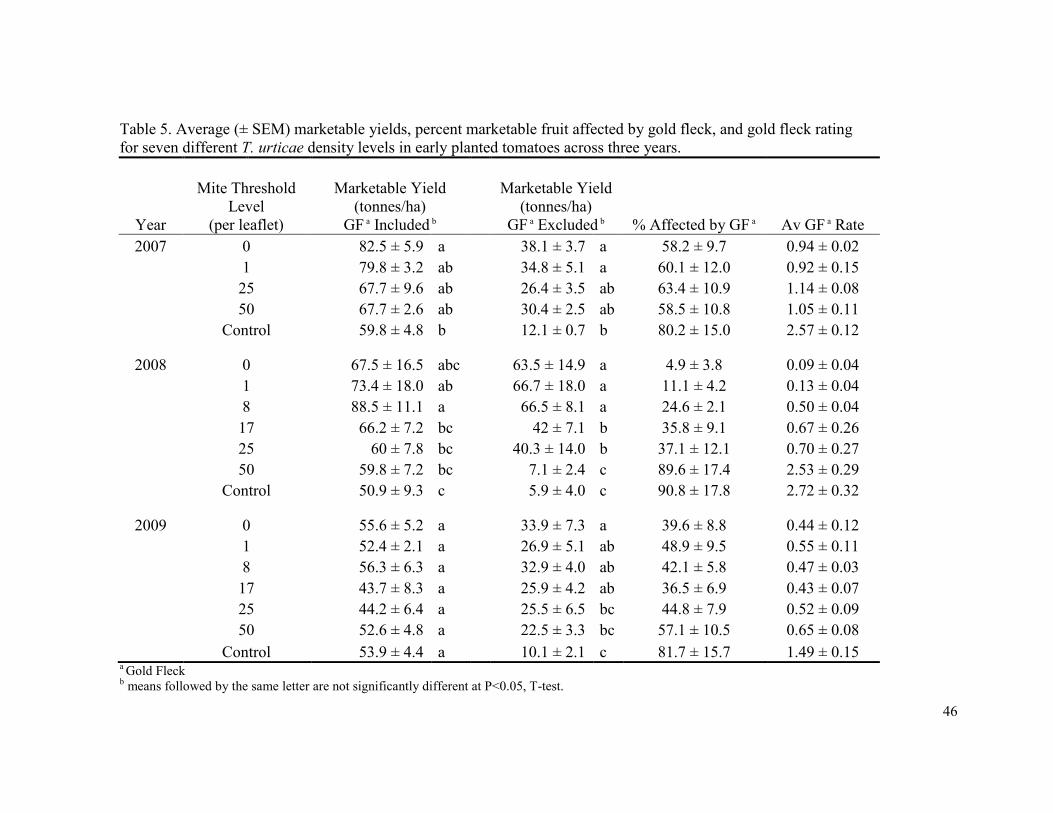
46
Table 5. Average (± SEM) marketable yields, percent marketable fruit affected by gold fleck, and gold fleck rating for seven different T. urticae density levels in early planted tomatoes across three years.
Marketable Yield (tonnes/ha)
GF a Included b
Marketable Yield (tonnes/ha)
GF a Excluded b % Affected by GF a
Year
Mite Threshold Level
(per leaflet) Av GF a Rate
2007 0 82.5 ± 5.9 a 38.1 ± 3.7 a 58.2 ± 9.7 0.94 ± 0.02
1 79.8 ± 3.2 ab 34.8 ± 5.1 a 60.1 ± 12.0 0.92 ± 0.15
25 67.7 ± 9.6 ab 26.4 ± 3.5 ab 63.4 ± 10.9 1.14 ± 0.08
50 67.7 ± 2.6 ab 30.4 ± 2.5 ab 58.5 ± 10.8 1.05 ± 0.11
Control 59.8 ± 4.8 b 12.1 ± 0.7 b 80.2 ± 15.0 2.57 ± 0.12
2008 0 67.5 ± 16.5 abc 63.5 ± 14.9 a 4.9 ± 3.8 0.09 ± 0.04
1 73.4 ± 18.0 ab 66.7 ± 18.0 a 11.1 ± 4.2 0.13 ± 0.04
8 88.5 ± 11.1 a 66.5 ± 8.1 a 24.6 ± 2.1 0.50 ± 0.04
17 66.2 ± 7.2 bc 42 ± 7.1 b 35.8 ± 9.1 0.67 ± 0.26
25 60 ± 7.8 bc 40.3 ± 14.0 b 37.1 ± 12.1 0.70 ± 0.27
50 59.8 ± 7.2 bc 7.1 ± 2.4 c 89.6 ± 17.4 2.53 ± 0.29
Control 50.9 ± 9.3 c 5.9 ± 4.0 c 90.8 ± 17.8 2.72 ± 0.32
2009 0 55.6 ± 5.2 a 33.9 ± 7.3 a 39.6 ± 8.8 0.44 ± 0.12
1 52.4 ± 2.1 a 26.9 ± 5.1 ab 48.9 ± 9.5 0.55 ± 0.11
8 56.3 ± 6.3 a 32.9 ± 4.0 ab 42.1 ± 5.8 0.47 ± 0.03
17 43.7 ± 8.3 a 25.9 ± 4.2 ab 36.5 ± 6.9 0.43 ± 0.07
25 44.2 ± 6.4 a 25.5 ± 6.5 bc 44.8 ± 7.9 0.52 ± 0.09
50 52.6 ± 4.8 a 22.5 ± 3.3 bc 57.1 ± 10.5 0.65 ± 0.08
Control 53.9 ± 4.4 a 10.1 ± 2.1 c 81.7 ± 15.7 1.49 ± 0.15 a Gold Fleck b means followed by the same letter are not significantly different at P<0.05, T-test.
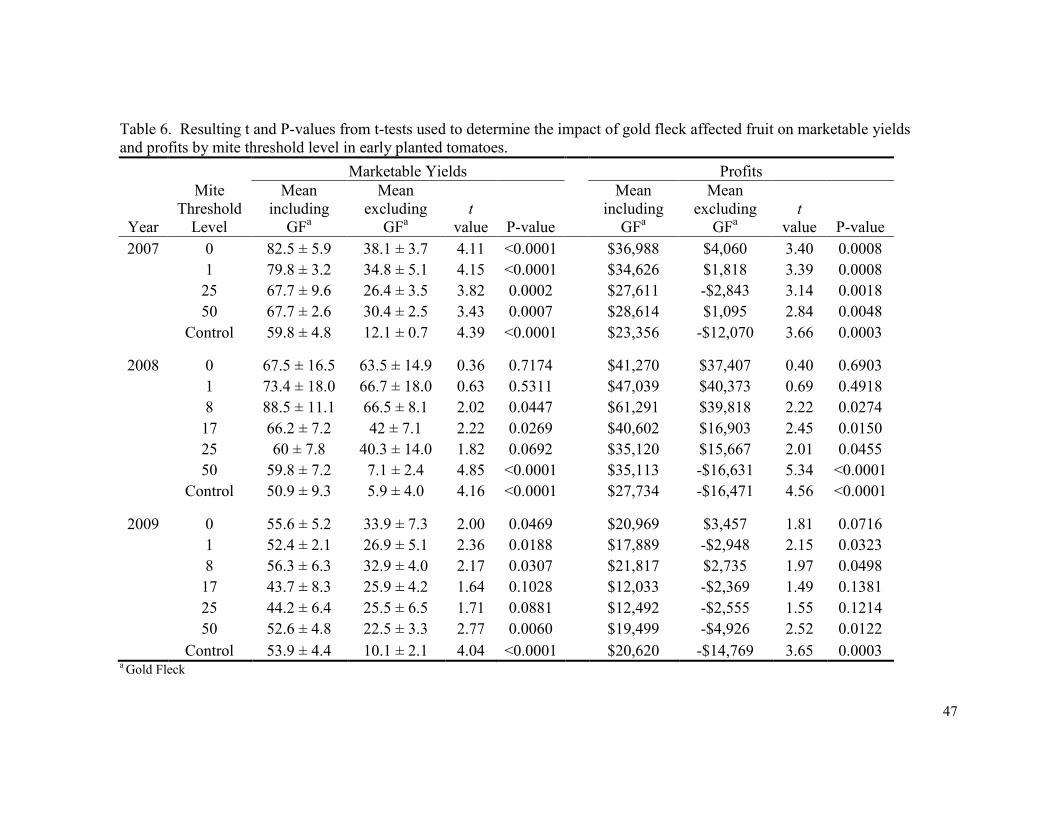
47
Table 6. Resulting t and P-values from t-tests used to determine the impact of gold fleck affected fruit on marketable yields and profits by mite threshold level in early planted tomatoes.
Marketable Yields Profits
Year
Mite Threshold
Level
Mean including
GFa
Mean excluding
GFa t
value P-value
Mean including
GFa
Mean excluding
GFa t
value P-value
2007 0 82.5 ± 5.9 38.1 ± 3.7 4.11 <0.0001 $36,988 $4,060 3.40 0.0008
1 79.8 ± 3.2 34.8 ± 5.1 4.15 <0.0001 $34,626 $1,818 3.39 0.0008
25 67.7 ± 9.6 26.4 ± 3.5 3.82 0.0002 $27,611 -$2,843 3.14 0.0018
50 67.7 ± 2.6 30.4 ± 2.5 3.43 0.0007 $28,614 $1,095 2.84 0.0048
Control 59.8 ± 4.8 12.1 ± 0.7 4.39 <0.0001 $23,356 -$12,070 3.66 0.0003
2008 0 67.5 ± 16.5 63.5 ± 14.9 0.36 0.7174 $41,270 $37,407 0.40 0.6903
1 73.4 ± 18.0 66.7 ± 18.0 0.63 0.5311 $47,039 $40,373 0.69 0.4918
8 88.5 ± 11.1 66.5 ± 8.1 2.02 0.0447 $61,291 $39,818 2.22 0.0274
17 66.2 ± 7.2 42 ± 7.1 2.22 0.0269 $40,602 $16,903 2.45 0.0150
25 60 ± 7.8 40.3 ± 14.0 1.82 0.0692 $35,120 $15,667 2.01 0.0455
50 59.8 ± 7.2 7.1 ± 2.4 4.85 <0.0001 $35,113 -$16,631 5.34 <0.0001
Control 50.9 ± 9.3 5.9 ± 4.0 4.16 <0.0001 $27,734 -$16,471 4.56 <0.0001
2009 0 55.6 ± 5.2 33.9 ± 7.3 2.00 0.0469 $20,969 $3,457 1.81 0.0716
1 52.4 ± 2.1 26.9 ± 5.1 2.36 0.0188 $17,889 -$2,948 2.15 0.0323
8 56.3 ± 6.3 32.9 ± 4.0 2.17 0.0307 $21,817 $2,735 1.97 0.0498
17 43.7 ± 8.3 25.9 ± 4.2 1.64 0.1028 $12,033 -$2,369 1.49 0.1381
25 44.2 ± 6.4 25.5 ± 6.5 1.71 0.0881 $12,492 -$2,555 1.55 0.1214
50 52.6 ± 4.8 22.5 ± 3.3 2.77 0.0060 $19,499 -$4,926 2.52 0.0122
Control 53.9 ± 4.4 10.1 ± 2.1 4.04 <0.0001 $20,620 -$14,769 3.65 0.0003 a Gold Fleck

48
Table 7. Average (± SEM) total yield, mean fruit weight, and mean numbers of fruit for seven different T. urticae density levels in late planted tomatoes across three years.
Year
Mite Threshold Level
(per leaflet) CMD
(per leaflet) No.
Appls. Total Yield (tonnes/ha) a Fruit Weight (g) a Number of Fruit a
2007 0 127.8 ± 78.0 11 73.5 ± 0.1 a 302.5 ± 23.4 a 101.8 ± 5.6 a
1 165.4 ± 51.7 8 78.2 ± 0.1 a 308.9 ± 21.5 a 105.8 ± 8.3 a
25 576.7 ± 68.8 1 66.7 ± 0.1 a 317.7 ± 15.0 a 86.0 ± 7.8 a
50 706.4 ± 88.2 1 76.3 ± 0.1 a 320.6 ± 81.6 a 75.8 ± 25.3 a
Control 1438.6 ± 98.2 0 64.5 ± 0.1 a 311.4± 10.7 a 85.0 ± 4.8 a
2008 0 61.1 ± 10.3 10 64.6 ± 0.1 a 262.1 ± 6.6 a 89.5 ± 9.0 ab
1 119.0 ± 36.0 9 66.0 ± 0.1 a 251.4 ± 18.3 ab 99.0 ± 8.7 a
8 411.6 ± 89.1 2 65.0 ± 0.1 a 258.1 ± 5.0 ab 90.3 ± 10.6 ab
17 775.1 ± 126.9 2 67.1 ± 0.2 ab 257.4 ± 12.7 ab 103.5 ± 5.8 a
25 1009.5 ± 157.8 2 52.9 ± 0.3 ab 238.2 ± 7.0 ab 90.0 ± 12.6 ab
50 1412.5 ± 133.3 1 50 ± 0.1 ab 233.1 ± 14.3 b 89.8 ± 5.6 ab
Control 2337.7 ± 276.0 0 41.9 ± 0.2 b 238.1 ± 10.7 ab 72.5 ± 7.9 b
2009 0 72.1 ± 22.9 6 50.9 ± 0.1 a 291.7 ± 11.1 a 73.0 ± 2.7 a
1 182.9 ± 44.3 7 47.3 ± 0.1 a 290.2 ± 15.1 ab 68.3 ± 6.6 a
8 405.6 ± 78.0 2 46.3 ± 0.1 a 286.1 ± 8.7 ab 67.8 ± 4.5 a
17 642.2 ± 144.5 3 45.0 ± 0.1 a 286.2 ± 6.9 ab 65.8 ± 2.1 a
25 804.7 ± 70.6 1 45.3 ± 0.2 a 266.0 ± 4.9 ab 71.3 ± 6.8 a
50 1010.0 ± 83.2 0 43.0 ± 0.1 a 257.8 ± 9.0 b 69.8 ± 4.6 a
Control 1384.7 ± 76.4 0 38.4 ± 0.3 a 259.2 ± 7.9 b 62.0 ± 4.1 a a means followed by the same letter are not significantly different at P<0.05, T-test.
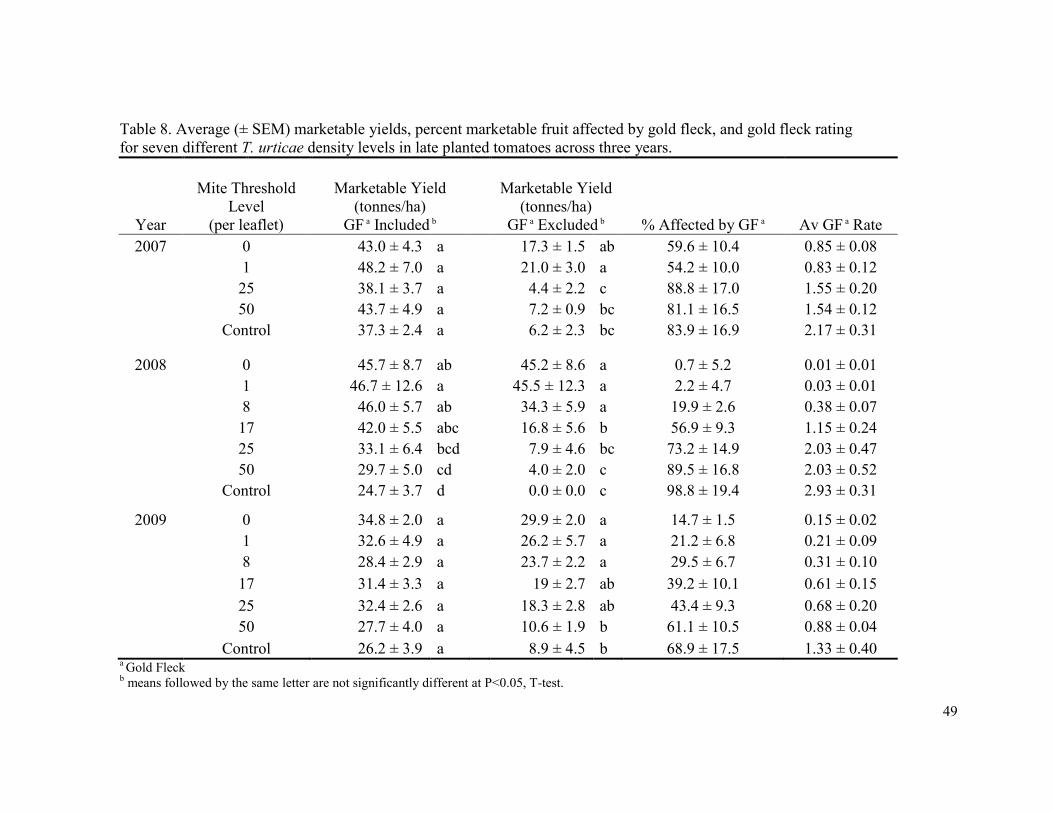
49
Table 8. Average (± SEM) marketable yields, percent marketable fruit affected by gold fleck, and gold fleck rating for seven different T. urticae density levels in late planted tomatoes across three years.
Marketable Yield (tonnes/ha)
GF a Included b
Marketable Yield (tonnes/ha)
GF a Excluded b % Affected by GF a
Year
Mite Threshold Level
(per leaflet) Av GF a Rate
2007 0 43.0 ± 4.3 a 17.3 ± 1.5 ab 59.6 ± 10.4 0.85 ± 0.08
1 48.2 ± 7.0 a 21.0 ± 3.0 a 54.2 ± 10.0 0.83 ± 0.12
25 38.1 ± 3.7 a 4.4 ± 2.2 c 88.8 ± 17.0 1.55 ± 0.20
50 43.7 ± 4.9 a 7.2 ± 0.9 bc 81.1 ± 16.5 1.54 ± 0.12
Control 37.3 ± 2.4 a 6.2 ± 2.3 bc 83.9 ± 16.9 2.17 ± 0.31
2008 0 45.7 ± 8.7 ab 45.2 ± 8.6 a 0.7 ± 5.2 0.01 ± 0.01
1 46.7 ± 12.6 a 45.5 ± 12.3 a 2.2 ± 4.7 0.03 ± 0.01
8 46.0 ± 5.7 ab 34.3 ± 5.9 a 19.9 ± 2.6 0.38 ± 0.07
17 42.0 ± 5.5 abc 16.8 ± 5.6 b 56.9 ± 9.3 1.15 ± 0.24
25 33.1 ± 6.4 bcd 7.9 ± 4.6 bc 73.2 ± 14.9 2.03 ± 0.47
50 29.7 ± 5.0 cd 4.0 ± 2.0 c 89.5 ± 16.8 2.03 ± 0.52
Control 24.7 ± 3.7 d 0.0 ± 0.0 c 98.8 ± 19.4 2.93 ± 0.31
2009 0 34.8 ± 2.0 a 29.9 ± 2.0 a 14.7 ± 1.5 0.15 ± 0.02
1 32.6 ± 4.9 a 26.2 ± 5.7 a 21.2 ± 6.8 0.21 ± 0.09
8 28.4 ± 2.9 a 23.7 ± 2.2 a 29.5 ± 6.7 0.31 ± 0.10
17 31.4 ± 3.3 a 19 ± 2.7 ab 39.2 ± 10.1 0.61 ± 0.15
25 32.4 ± 2.6 a 18.3 ± 2.8 ab 43.4 ± 9.3 0.68 ± 0.20
50 27.7 ± 4.0 a 10.6 ± 1.9 b 61.1 ± 10.5 0.88 ± 0.04
Control 26.2 ± 3.9 a 8.9 ± 4.5 b 68.9 ± 17.5 1.33 ± 0.40 a Gold Fleck b means followed by the same letter are not significantly different at P<0.05, T-test.

50
Table 9. Resulting t and P-values from t-tests used to determine the impact of gold fleck affected fruit on marketable yields and profits by mite threshold level in late planted tomatoes
Marketable Yields Profits
Year
Mite Threshold Level
Mean including
GFa
Mean excluding
GFa t
value P-value
Mean including
GFa
Mean excluding
GFa t
value P-value
2007 0 43.0 ± 4.3 17.3 ± 1.5 3.93 <0.0001 $11,651 -$8,445 4.16 <0.0001
1 48.2 ± 7.0 21.0 ± 3.0 4.14 <0.0001 $15,791 -$5,252 4.36 <0.0001
25 38.1 ± 3.7 4.4 ± 2.2 5.12 <0.0001 $9,538 -$16,856 5.47 <0.0001
50 43.7 ± 4.9 7.2 ± 0.9 4.83 <0.0001 $13,130 -$15,326 5.10 <0.0001
Control 37.3 ± 2.4 6.2 ± 2.3 4.71 <0.0001 $8,745 -$15,139 4.95 <0.0001
2008 0 45.7 ± 8.7 45.2 ± 8.6 0.06 0.9506 $12,217 $11,894 0.07 0.9467
1 46.7 ± 12.6 45.5 ± 12.3 0.18 0.8558 $12,967 $12,023 0.20 0.8451
8 46.0 ± 5.7 34.3 ± 5.9 1.75 0.0815 $13,871 $4,961 1.85 0.0661
17 42.0 ± 5.5 16.8 ± 5.6 3.81 0.0002 $10,430 -$9,281 4.08 <0.0001
25 33.1 ± 6.4 7.9 ± 4.6 3.87 0.0001 $4,344 -$15,576 4.13 <0.0001
50 29.7 ± 5.0 4.0 ± 2.0 3.92 0.0001 $2,105 -$18,137 4.19 <0.0001
Control 24.7 ± 3.7 0.0 ± 0.0 3.75 0.0002 -$1,134 -$20,504 4.01 <0.0001
2009 0 34.8 ± 2.0 29.9 ± 2.0 0.76 0.4500 $1,086 -$328 0.72 0.4698
1 32.6 ± 4.9 26.2 ± 5.7 0.98 0.3260 $512 -$1,327 0.94 0.3476
8 28.4 ± 2.9 23.7 ± 2.2 0.70 0.4828 -$519 -$1,836 0.67 0.5009
17 31.4 ± 3.3 19 ± 2.7 1.91 0.0572 $384 -$3,193 1.83 0.0682
25 32.4 ± 2.6 18.3 ± 2.8 2.17 0.0312 $747 -$3,249 2.05 0.0418
50 27.7 ± 4.0 10.6 ± 1.9 2.59 0.0101 -$514 -$5,312 2.46 0.0147
Control 26.2 ± 3.9 8.9 ± 4.5 2.64 0.0088 -$833 -$5,722 2.50 0.0129 a Gold Fleck
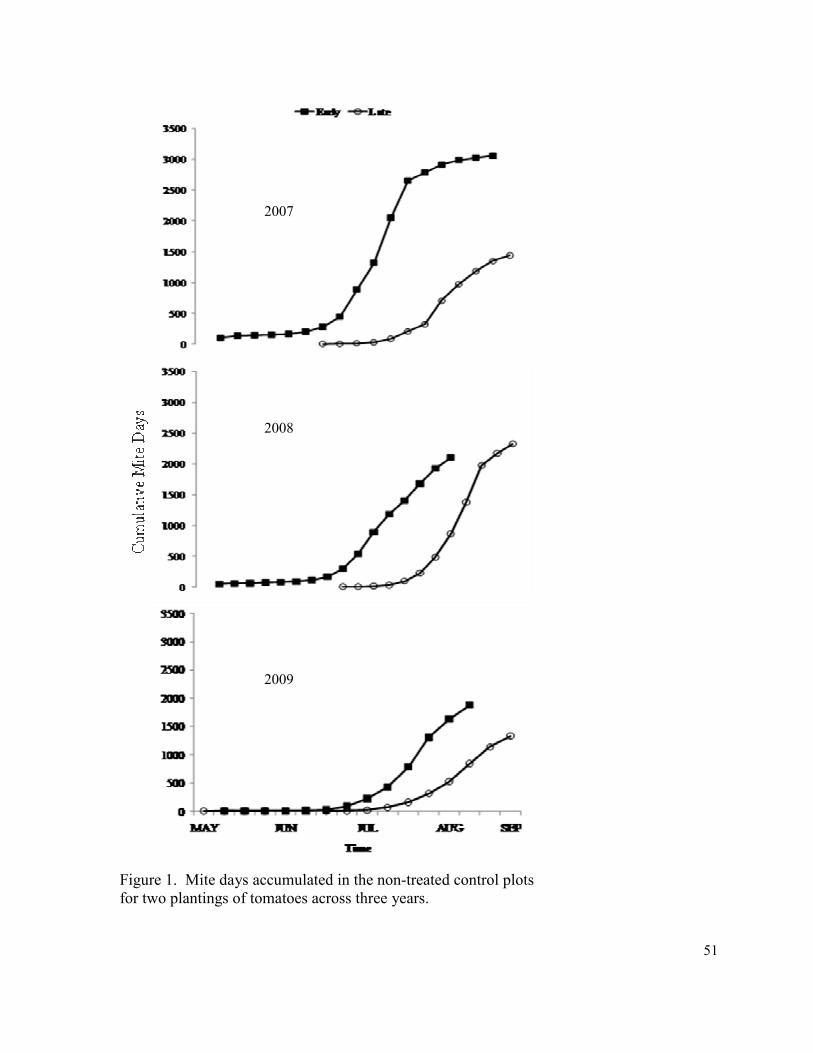
51
Figure 1. Mite days accumulated in the non-treated control plots
for two plantings of tomatoes across three years.
2007
2008
2009
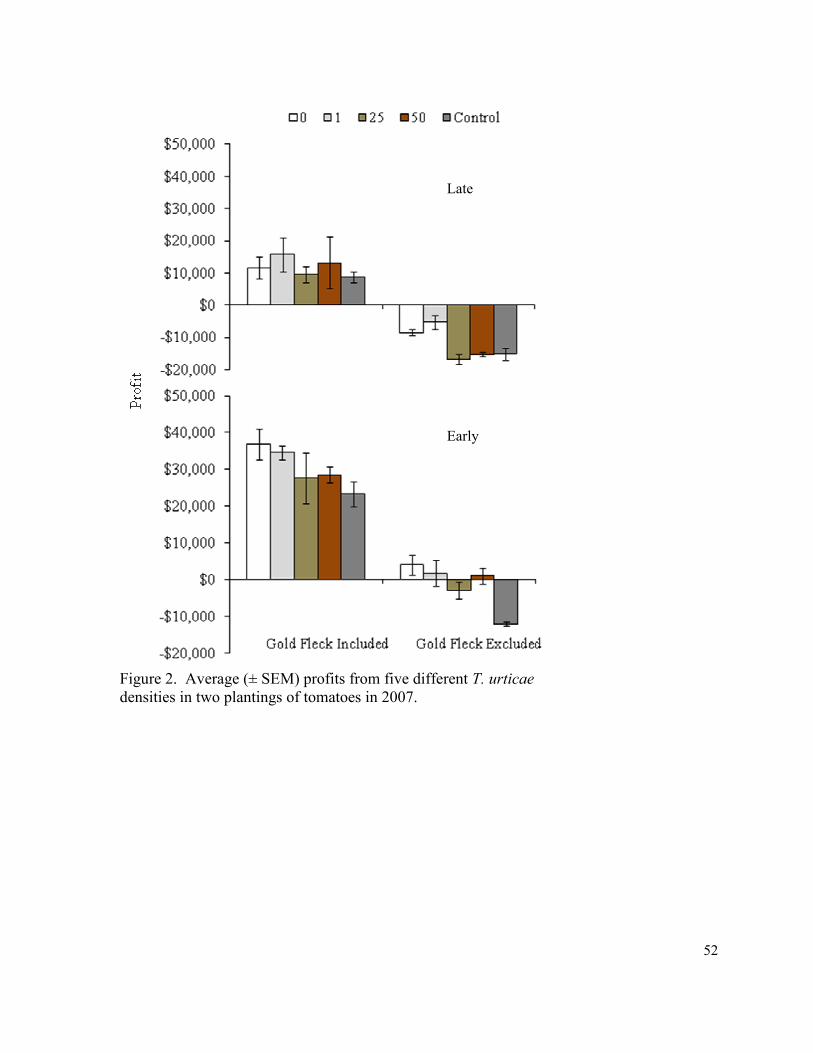
52
Figure 2. Average (± SEM) profits from five different T. urticae
densities in two plantings of tomatoes in 2007.
Early
Late
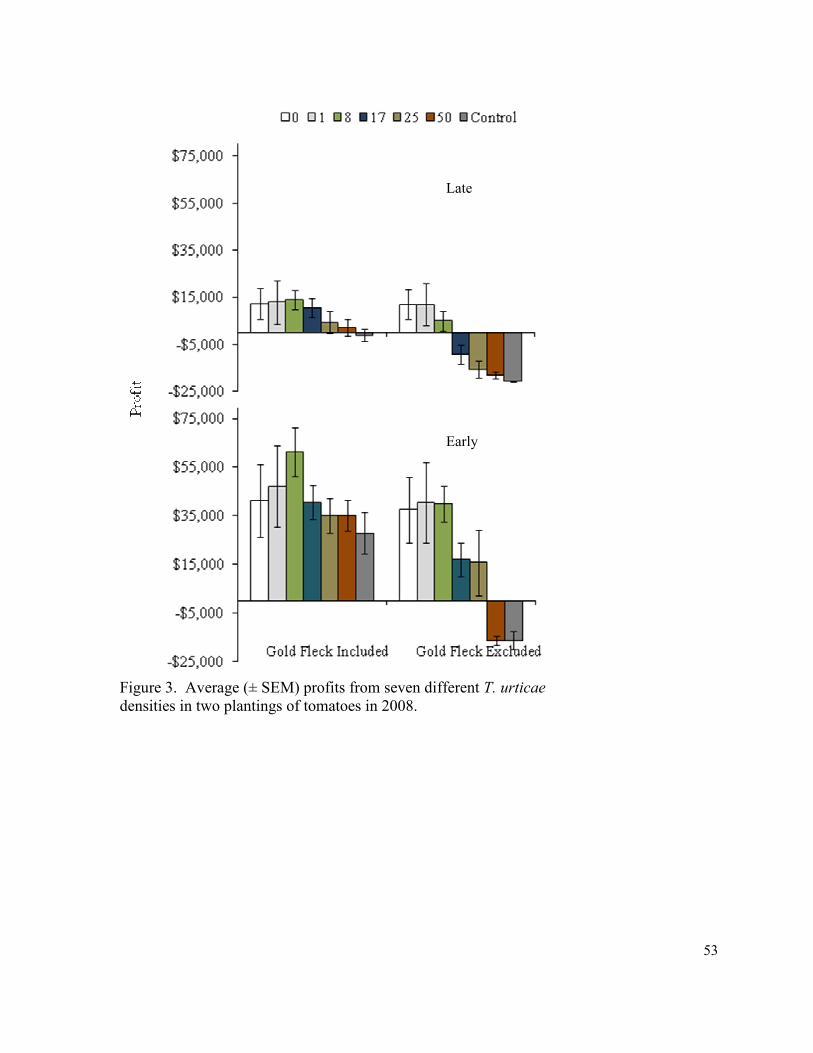
53
Figure 3. Average (± SEM) profits from seven different T. urticae
densities in two plantings of tomatoes in 2008.
Early
Late
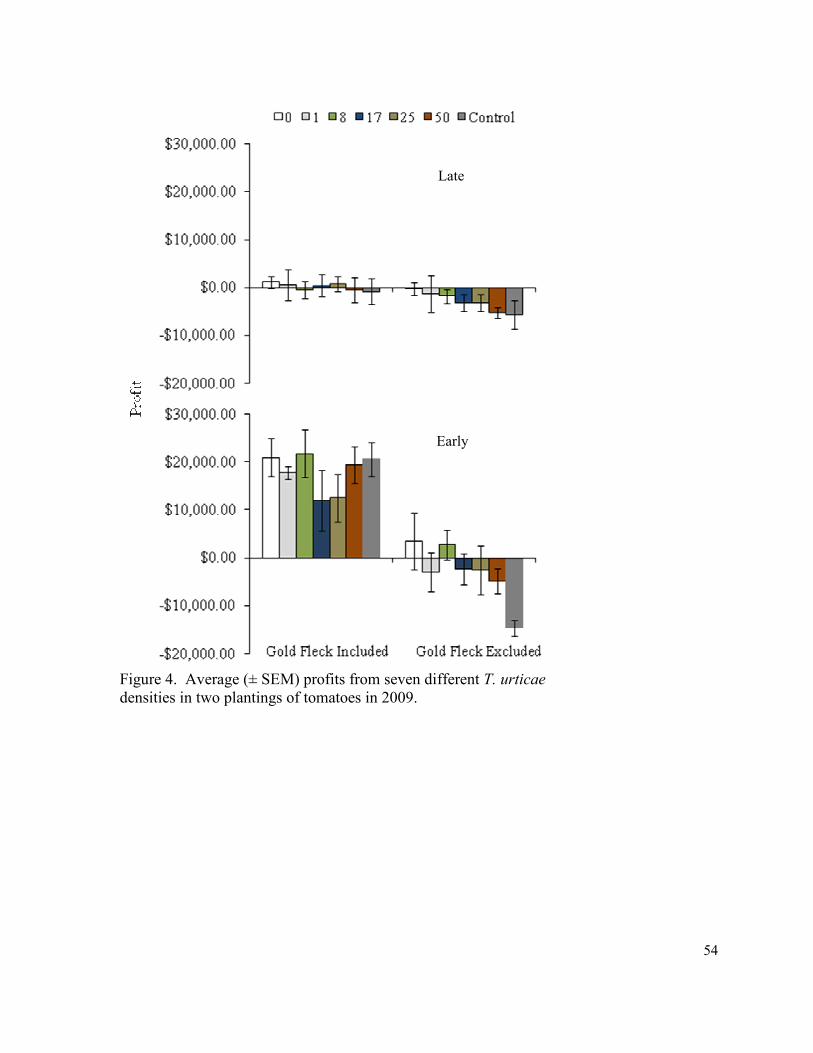
54
Figure 4. Average (± SEM) profits from seven different T. urticae
densities in two plantings of tomatoes in 2009.
Early
Late
55
Chapter 3: Economic thresholds and sampling plans for twospotted spider
mite, Tetranychus urticae (Acari: Tetranychidae), in �orth Carolina staked
tomatoes
Introduction
Systematic sampling plans, economic injury levels (EIL’s), and economic thresholds
(ET’s) are key principles to integrated pest management (IPM) programs (Pedigo 1996,
Binns and Nyrop 1992; Pedigo et al. 1986). These tools allow the pest management
practitioner to estimate with known levels of precision the potential of a pest population to
cause economic damage to a crop, and hence the economic value of controlling the pest.
While the idea that not all insect pest populations cause economic damage was first proposed
by Pierce (1934), it was Stern et al. (1959) who first described an integrated pest control
approach that revolved around the use of economic thresholds, methods to rapidly sample
populations, and the use of selective chemicals to preserve natural enemy populations.
Stern et al. (1959) defined EIL as “the lowest population density that will cause
economic damage” and the ET as “the density at which control measures should be initiated
to prevent an increasing pest population from reaching the economic injury level.” Early
attempts to quantify EIL’s are presented in Stone and Pedigo (1972) and Norton (1976).
Pedigo et al. (1986) later drew from Norton’s definition and proposed the widely accepted
EIL expression EIL= C / V x I x D x K. They also defined the ET as “the injury equivalency
of a pest population corresponding to the latest possible date for which a given control tactic
could be implemented to prevent increasing injury from causing economic damage.”

56
The development of sampling plans to estimate, in a systematic manner, the density
of pest populations is critical to effectively using ET’s. The accuracy of a sampling plan in
estimating a pest population is related to the spatial distribution pattern of a pest population
and number of samples taken. While too few samples will reduce the reliability of an
estimate, too many samples will increase time and cost to unrealistic numbers (Cullen et al.
2000; Hammond 1996; Dent 1991), so practical sampling plans are a compromise between
reliability and cost.
The twospotted spider mite, Tetranychus urticae Koch, is a serious pest of staked
tomatoes in central and western North Carolina (Meck et al. 2009). Chemical control is the
primary tool used to manage mite populations, but no sampling plans, EIL’s, or ET’s have
been established for T. urticae on fresh market tomatoes. The objectives of this study were
to establish economic injury and threshold levels for T. urticae in fresh market staked
tomatoes, and to develop a sampling plan to estimate T. urticae population density on this
crop.
Materials and Methods
Establishment of EILs and ETs: Data from studies on tomato yield response to
different T. urticae densities (Chapter 2) were used to estimate EIL’s and ET’s. Yield data
were analyzed as a factorial design using the Mixed procedure (SAS Institute 2006). Due to
the fact that each plot was exposed to different T. urticae densities, the model was modified
by using cumulative mite days (CMD) for each plot as a covariate and changing year and
year x CMD to random effects to determine total yield responses of tomatoes to T. urticae.

57
Economic injury levels were calculated using a modification of the expression presented in
Pedigo et al. (1986)
EIL= C / V x I x D x K where EIL = the density or intensity of the insect population, C = cost of management, V=
market value of the crop, I = injury units per insect per production unit, D = damage per unit
injury, and K = proportionate reduction in the insect population.
Pedigo (1996) stated that with some insects, particularly piercing-sucking insects the
separation of I and D presents a problem. The I variable for plants would represent the
photosynthate removed per insect and the D variable would represent yield loss per unit of
photosynthate removed. Because these are difficult to measure, a coefficient b representing
loss per insect is substituted. The b coefficient was obtained from the expression
Y = a + bx
where Y = yield/area, a is a constant (y-intercept), b = yield loss/insect, and x = number of
insects/area. The resulting expression is therefore
EIL = C / V x b x K The b coefficient was obtained from the Mixed model described above, as yield response
(kg/ha) to a change in CMD.
A series of EILs were calculated for three acaricides commonly used for control of
T. urticae in North Carolina; bifenazate (Acramite 50WS, Chemtura, Middlebury, CT)
applied at 0.59 kg[a.i.]/ha ($123.35/kg), abamectin (Agri-Mek 0.15EC, Syngenta,
Greensboro, NC) at 0.022 kg[a.i.]/ha ($109.70/L), and spiromesifen (Oberon 2SC, Bayer,
Research Triangle Park, NC) at 0.15 kg[a.i.]/ha ($111.82/L). Prices of $0.55/kg, $0.77/kg,
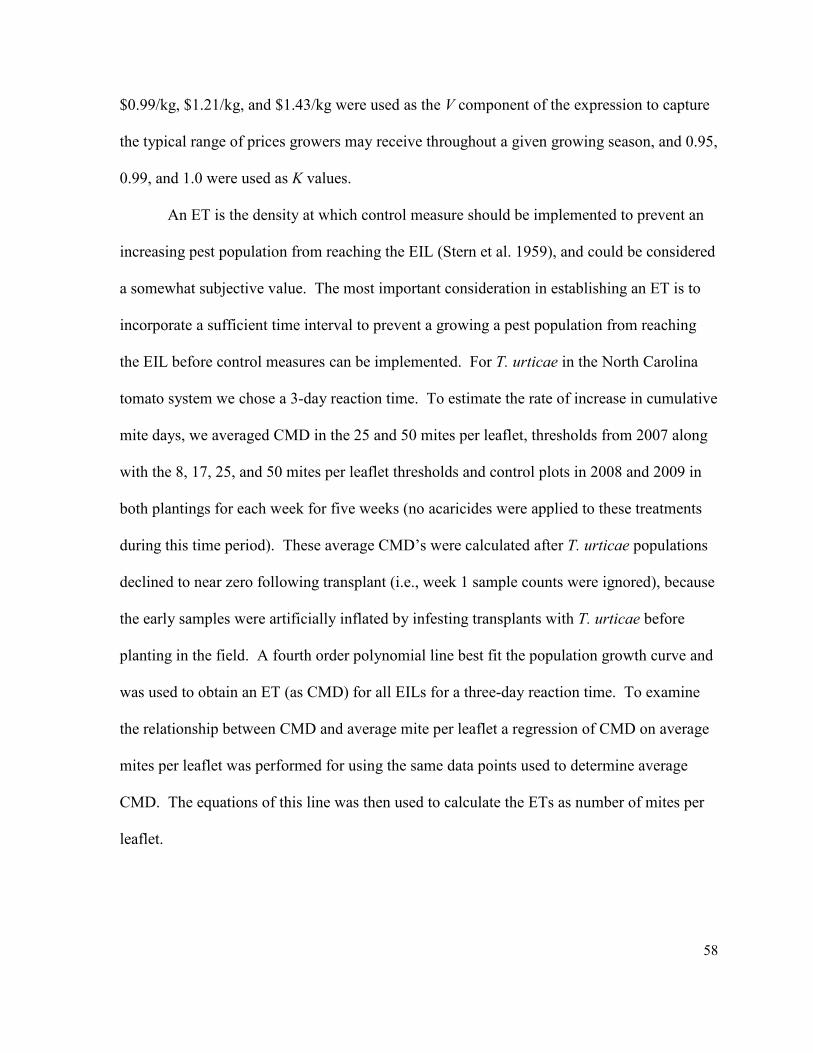
58
$0.99/kg, $1.21/kg, and $1.43/kg were used as the V component of the expression to capture
the typical range of prices growers may receive throughout a given growing season, and 0.95,
0.99, and 1.0 were used as K values.
An ET is the density at which control measure should be implemented to prevent an
increasing pest population from reaching the EIL (Stern et al. 1959), and could be considered
a somewhat subjective value. The most important consideration in establishing an ET is to
incorporate a sufficient time interval to prevent a growing a pest population from reaching
the EIL before control measures can be implemented. For T. urticae in the North Carolina
tomato system we chose a 3-day reaction time. To estimate the rate of increase in cumulative
mite days, we averaged CMD in the 25 and 50 mites per leaflet, thresholds from 2007 along
with the 8, 17, 25, and 50 mites per leaflet thresholds and control plots in 2008 and 2009 in
both plantings for each week for five weeks (no acaricides were applied to these treatments
during this time period). These average CMD’s were calculated after T. urticae populations
declined to near zero following transplant (i.e., week 1 sample counts were ignored), because
the early samples were artificially inflated by infesting transplants with T. urticae before
planting in the field. A fourth order polynomial line best fit the population growth curve and
was used to obtain an ET (as CMD) for all EILs for a three-day reaction time. To examine
the relationship between CMD and average mite per leaflet a regression of CMD on average
mites per leaflet was performed for using the same data points used to determine average
CMD. The equations of this line was then used to calculate the ETs as number of mites per
leaflet.
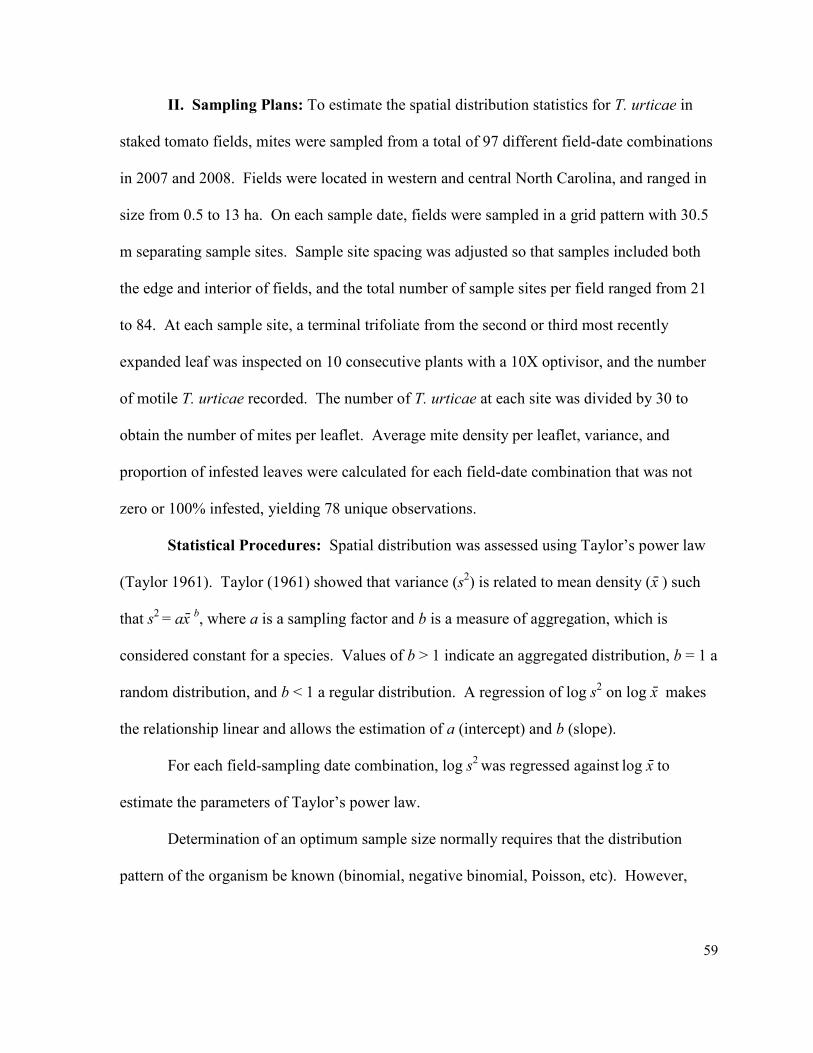
59
II. Sampling Plans: To estimate the spatial distribution statistics for T. urticae in
staked tomato fields, mites were sampled from a total of 97 different field-date combinations
in 2007 and 2008. Fields were located in western and central North Carolina, and ranged in
size from 0.5 to 13 ha. On each sample date, fields were sampled in a grid pattern with 30.5
m separating sample sites. Sample site spacing was adjusted so that samples included both
the edge and interior of fields, and the total number of sample sites per field ranged from 21
to 84. At each sample site, a terminal trifoliate from the second or third most recently
expanded leaf was inspected on 10 consecutive plants with a 10X optivisor, and the number
of motile T. urticae recorded. The number of T. urticae at each site was divided by 30 to
obtain the number of mites per leaflet. Average mite density per leaflet, variance, and
proportion of infested leaves were calculated for each field-date combination that was not
zero or 100% infested, yielding 78 unique observations.
Statistical Procedures: Spatial distribution was assessed using Taylor’s power law
(Taylor 1961). Taylor (1961) showed that variance (s2) is related to mean density (x̄ ) such
that s2 = ax̄ b, where a is a sampling factor and b is a measure of aggregation, which is
considered constant for a species. Values of b > 1 indicate an aggregated distribution, b = 1 a
random distribution, and b < 1 a regular distribution. A regression of log s2 on log x̄ makes
the relationship linear and allows the estimation of a (intercept) and b (slope).
For each field-sampling date combination, log s2 was regressed against log x̄ to
estimate the parameters of Taylor’s power law.
Determination of an optimum sample size normally requires that the distribution
pattern of the organism be known (binomial, negative binomial, Poisson, etc). However,
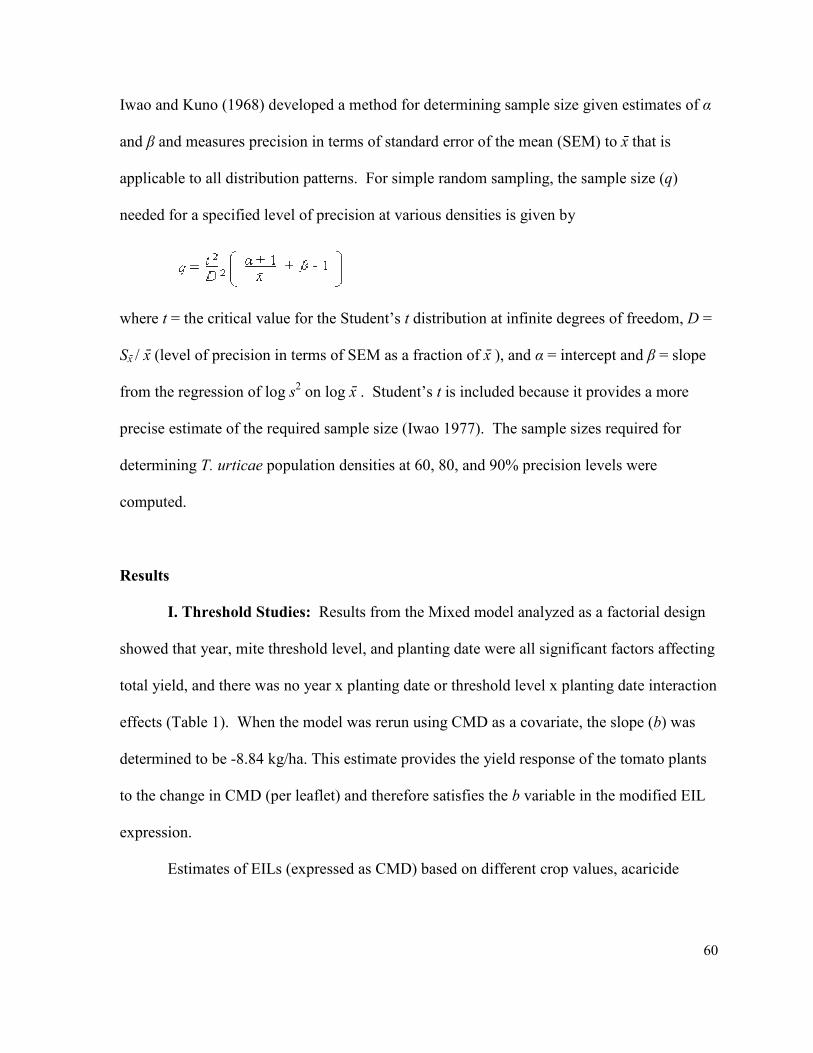
60
Iwao and Kuno (1968) developed a method for determining sample size given estimates of α
and β and measures precision in terms of standard error of the mean (SEM) to x̄ that is
applicable to all distribution patterns. For simple random sampling, the sample size (q)
needed for a specified level of precision at various densities is given by
where t = the critical value for the Student’s t distribution at infinite degrees of freedom, D =
Sx̄ / x̄ (level of precision in terms of SEM as a fraction of x̄ ), and α = intercept and β = slope
from the regression of log s2 on log x̄ . Student’s t is included because it provides a more
precise estimate of the required sample size (Iwao 1977). The sample sizes required for
determining T. urticae population densities at 60, 80, and 90% precision levels were
computed.
Results
I. Threshold Studies: Results from the Mixed model analyzed as a factorial design
showed that year, mite threshold level, and planting date were all significant factors affecting
total yield, and there was no year x planting date or threshold level x planting date interaction
effects (Table 1). When the model was rerun using CMD as a covariate, the slope (b) was
determined to be -8.84 kg/ha. This estimate provides the yield response of the tomato plants
to the change in CMD (per leaflet) and therefore satisfies the b variable in the modified EIL
expression.
Estimates of EILs (expressed as CMD) based on different crop values, acaricide
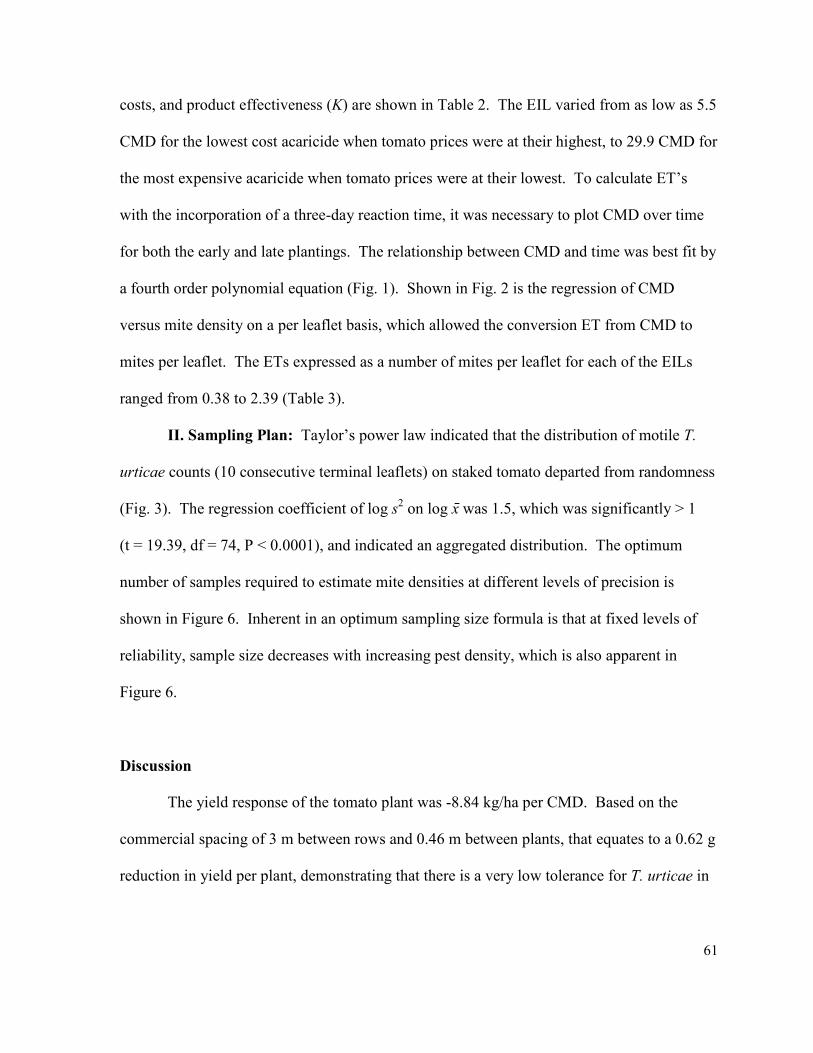
61
costs, and product effectiveness (K) are shown in Table 2. The EIL varied from as low as 5.5
CMD for the lowest cost acaricide when tomato prices were at their highest, to 29.9 CMD for
the most expensive acaricide when tomato prices were at their lowest. To calculate ET’s
with the incorporation of a three-day reaction time, it was necessary to plot CMD over time
for both the early and late plantings. The relationship between CMD and time was best fit by
a fourth order polynomial equation (Fig. 1). Shown in Fig. 2 is the regression of CMD
versus mite density on a per leaflet basis, which allowed the conversion ET from CMD to
mites per leaflet. The ETs expressed as a number of mites per leaflet for each of the EILs
ranged from 0.38 to 2.39 (Table 3).
II. Sampling Plan: Taylor’s power law indicated that the distribution of motile T.
urticae counts (10 consecutive terminal leaflets) on staked tomato departed from randomness
(Fig. 3). The regression coefficient of log s2 on log x̄ was 1.5, which was significantly > 1
(t = 19.39, df = 74, P < 0.0001), and indicated an aggregated distribution. The optimum
number of samples required to estimate mite densities at different levels of precision is
shown in Figure 6. Inherent in an optimum sampling size formula is that at fixed levels of
reliability, sample size decreases with increasing pest density, which is also apparent in
Figure 6.
Discussion
The yield response of the tomato plant was -8.84 kg/ha per CMD. Based on the
commercial spacing of 3 m between rows and 0.46 m between plants, that equates to a 0.62 g
reduction in yield per plant, demonstrating that there is a very low tolerance for T. urticae in
62
these tomato systems. This finding was validated through the computation of EIL’s which
ranged from 5.5 to 29.9 CMD or 0.55 to 3.85 mites per leaflet depending on the values of
variables in the EIL expression. In contrast to these findings, Oatman et al. (1982) showed
that winter-planted strawberries could withstand T. urticae levels of 90-100 mites per leaflet
without significant yield losses but suggested treatment at 20-25 mites per leaflet. Wyman et
al. (1979) suggested T. urticae should be treated at 50 mites per leaflet to prevent yield losses
in summer-planted strawberries.
The EIL’s presented in table 2 are based on the yield response in terms of CMD on
which the model is based. This presents a problem in that once a mite day is accumulated on
a plant or in a set of plants it remains for the course of the season. Therefore the ET’s
presented in table 3 would be more valid if T. urticae populations could be completely
eliminated, and mites would not reinfest the field for the remainder of the growing season.
Based on the biology of T. urticae and observance of populations in the field, this would be a
nearly impossible task. Adult females can disperse by crawling and on wind currents
(Kennedy and Smitley 1985) so they may readily disperse from adjacent fields or field edges
into the field (Boykin et al. 1984; Margolies and Kennedy 1985). Acaricides target different
life stages of T. urticae, but no one chemical provides control of both motile forms and eggs,
and the effectiveness of these chemicals depends on complete coverage of the plant as well
as other factors. Acaricides have restrictions on the number of applications or amount of
product applied per season as well as pre-harvest intervals that may limit their usage.
Poston et al. (1983) state that “the pest density measured at a point in time relates
most directly to the increment of damage inflicted at that time. At a later time, the pest
63
population and, consequently, the corresponding damage increment will be different.” Our
study focused on the establishment of T. urticae populations relatively early in the growing
season, which remained until the termination of the crop. The yield response and
corresponding EIL’s and ET’s will most likely be different if the plants are infested at
different times throughout the growing season. Additional studies are needed to explore the
relationship(s) between yield and infestation time and severity as well as the effect of
different tomato varieties.
The other terms of the EIL expression are relatively easy to compute. However, crop
values (V) can only be estimated due to the need for acaricide use prior to fruit being sold.
Product effectiveness (K) is expected to be 95-99% but depends on the observance of all
label instructions as well as environmental conditions.
In this study, we chose to evaluate the yield response of tomato to T. urticae in terms
of total yield. This technique did not adjust yields for marketability based on gold fleck
affected fruit. Gold fleck due to Frankliniella occidentalis and T. urticae does not appear to
be distinguishable to the naked eye, and there are other factors that may affect the
marketability of tomato fruit including insect damage, physiological disorders, and disease.
These factors may have caused reductions in marketable yields that were not related to T.
urticae densities. However, low ET’s (0.38 to 2.4 mites per leaflet) should minimize gold
fleck damage due to T. urticae feeding (Chapter 1).
The distribution of T. urticae in tomato fields was found to be aggregated. This
finding is consitant with the biology of the pest. T. urticae distributions are also aggregated
in other agronomic systems (Opit et al. 2003; Hepworth and MacFarlane 1992; Jones 1990;
64
Raworth 1986; Margolies et al. 1984). At an average density of 0.5 mites/leaflet in the field,
and assuming a trained individual could count the number of T. urticae on 10 consecutive
terminal leaflets (one sample site) in three minutes, it would take on average 18.3, 11.2, and
4.9 hours per field for 90, 80, and 60% precision levels respectively. This time commitment
is not economically feasible and precision levels under 60% are not acceptable for decision
making purposes.
Cullen et al. 2000 tried to quantify tradeoffs between sampling time and precision
level for evaluating stink bug densities in processing tomatoes. According to their survey of
pest control advisors, most scouts were willing to spend 15-30 minutes per field, but still
wanted to achieve an 85% precision level. They showed that in order to achieve 85%
precision at a field scout would need to spend at least 60 minutes per field with a wider
confidence interval.
Dent (1991) suggested that aggregated pest populations are better sampled using a
stratified random sampling program where the field is divided in sections based on previous
knowledge of pest distribution, and stated that stratified random sampling can only be
properly implemented when proportions of the pest population in different field sections are
known.
Sampling can sometimes be made easier and less time-consuming by evaluating the
presence or absence of the pest rather than counting every individual (Binns and Nyrop 1992;
Wilson et al. 1981). Presence-absence or binomial sampling is based on the relationship
between the density of the pest organism and the proportion of sample units that are infested
described by Gerrard and Chiang (1970) as λ = -ln(1 – p̂) where λ = the mean density of
65
individuals and p̂ = observed proportion of samples containing one or more individuals. This
type of presence-absence sampling plan needs to be evaluated, and should it allow for
reliable estimates of T. urticae populations in a less time-consuming manner it may be a
reasonable alternative to counting individuals on random samples.
Economic injury levels and thresholds are very complex and dynamic in nature due to
the fact that they are driven by complex biological processes (Poston et al. 1983). The ET’s
for T. urticae in tomato systems are very low, suggesting that control tactics need to be
implemented at the first signs of infestation, however, the amount of time needed to
accurately assess T. urticae populations make it impractical to accurately estimate population
size based on scouting. In order to develop an effective IPM program for T. urticae in
tomatoes, alternative, reliable sampling plans need to be developed that are more cost-
effective. In the mean time commercial growers need to spend as much time in the field
sampling as feasible, and only then make a decision as to whether or not control measures
should be taken. Knowing field histories will be an important component to successful
management of T. urticae in tomatoes as mites have been observed in the same location in
successive years. The low tolerance of the tomato plant to T. urticae and the low tolerance of
gold fleck in the fresh market, it is better to control T. urticae early and often rather than risk
the population exceeding the economic injury levels.
66
References
Binns, M.R. and J.P. �yrop 1992. Sampling insect populations for the purpose of IPM decision making. Annu. Rev. Entomol. 37: 427-453
Boykin, L.S., W.V. Campbell, and L.A. �elson. 1984. Effect of barren soil borders and weed border treatments on movement of twospotted spider mite into peanut fields. Peanut Sci. 11: 52-55. Cullen, E.M., F.G. Zalom, M.L. Flint, and E.E. Zilbert. 2000. Quantifying trade-offs between pest sampling time and precision in commercial IPM sampling programs. Agric. Systems. 66: 99-113. Dent, D. 1991. Insect Pest Management. CAB International. Oxon, UK. Gerrard, D.J. and H.C. Chiang. 1970. Density estimation of corn rootworm egg populations based on frequency of occurrence. Ecology. 51: 237-245. Hammond, R.B. 1996. Limitations to EIL’s and Thresholds. pp. 58-73. in Higley, L.G. and L.P. Pedigo (eds). Economic Thresholds for Integrated Pest Management. University of Nebraska Press, Lincoln.
Hepworth, G. and J.R. MacFarlane. 1992. Systematic presence-absence sampling method applied to twospotted spider mite (Acari: Tetranychidae) on strawberries in Victoria, Australia. J. Econ. Entomol. 85: 2234-2239.
Iwao, S. 1977. The m*-m statistics as a comprehensive method for analyzing spatial patterns of biological populations and its application to sampling problems, pp. 21-46. in M. Morisita (ed), Studies on methods of estimating population density, biomass and productivity in terrestrial animals. University of Tokyo Press, Japan. Iwao, S. and E. Kuno. 1968. Use of the regression of mean crowding on mean density for estimating sample size and the transformation of data for the analysis of variance. Res. Popul. Ecol. 10: 210-214. Jones, V.P. 1990. Developing sampling plans for spider mites (Acari: Tetranychidae): those who don’t remember the past may have to repeat it. J. Econ. Entomol. 83: 1656-1664. Kennedy, G.G. and D.R. Smitley. 1985. Dispersal. pp. 233-242, in W. Helle and M.W. Sabelis (eds). Spider Mites, Their Biology, Natural Enemies and Control. Elsevier, Amsterdam, Vol 1A.
67
Margolies D.C. and G.G. Kennedy. 1985. Movement of the twospotted spider mite, Tetranychus urticae, among hosts in a corn-peanut agroecosystem. Entomol. Exp. Appl. 37: 55-61. Margolies, D.C., E.P. Lampert, and G.G. Kennedy. 1984. Sampling program for the twospotted spider mite (Acari: Tetranychidae) in peanut. J. Econ Entomol. 77: 1024-1028. Meck, E.D., J.F. Walgenbach, and G.G. Kennedy. 2009. Effect of vegetation management on autumn dispersal of Tetranychus urticae (Acari: Tetranychidae) from tomato. J. Appl. Entomol. 133: 742-748.
�orton, G.A. 1976. Analysis of decision making in crop protection. Agro-Ecosystems. 3: 27-44. Oatman, E.R., F.V. Sances, L.F. LaPré, �.C. Toscano, and V. Voth. 1982. Effects of different infestation levels of the twospotted spider mite on strawberry yield in winter plantings in southern California. J. Econ. Entomol. 75: 94-96. Opit, G.P., D.C. Margolies, and J.R. �echols. 2003. Within-plant distribution of twospotted spider mite, Tetranychus urticae Koch (Acari: Tetranychidae), on ivy geranium: development of a presence-absence sampling plan. J. Econ. Entomol. 96: 482-488. Pedigo, L.P. 1996. Entomology and Pest Management, 2nd ed. Prentice-Hall Inc., Upper Saddle River, 679 pp. Pedigo, L.P., S.H. Hutchins, and L.G. Higley. 1986. Economic injury levels in theory and practice. Ann. Rev. Entomol. 31: 341-368. Pierce, W.D. 1934. At what point does insect attack become damage? Entomological News. 45: 1-4. Poston, F.L., L.P. Pedigo, and S.M. Welch. 1983. Economic injury levels: reality and practicality. Bull. Entomol. Soc. Am. 29:49-53. Raworth, D.A. 1986. Sampling statistics and a sampling scheme for the twospotted spider mite, Tetranychus urticae (Acari: Tetranychidae) on strawberries. Can. Entomol. 118: 807-814. SAS Institute. 2006. SAS 9.1 for Windows. SAS Institute, Cary, NC. Stern, V.M., R.F. Smith, R. van den Bosch, and K.S. Hagen. 1959. The integration of chemical and biological control of the spotted alfalfa aphid. Hilgardia. 29: 81-101.
68
Stone, J.D. and L.P. Pedigo. 1972. Development and economic-injury level of the green cloverworm on soybean in Iowa. J. Econ. Entomol. 65: 197-201 Taylor, L.R. 1961. Aggregation, variance and the mean. Nature (London) 189: 732-735. Wilson, L.T., T.F. Leigh, and V. Maggi. 1981. Presence-absence sampling of spider mite densities on cotton. Calif. Agric. 35: 10 Wyman, J.A., E.R. Oatman, and V. Voth. 1979. Effects of varying twospotted spider mite infestation levels on strawberry yield. J. Econ. Entomol. 72: 747-753.

69
Table 1. ANOVA results for tomato yields in response to different densities of T. urticae across three years.
Yield Factor F d.f. P-value
Total Yield (all fruit) year 6.88 2 0.0123
threshold level (year) 2.98 16 0.0006
plant date 279.19 1 <0.0001
year x plant date 0.73 2 0.4838
threshold level x plantdate (year) 0.68 16 0.8093
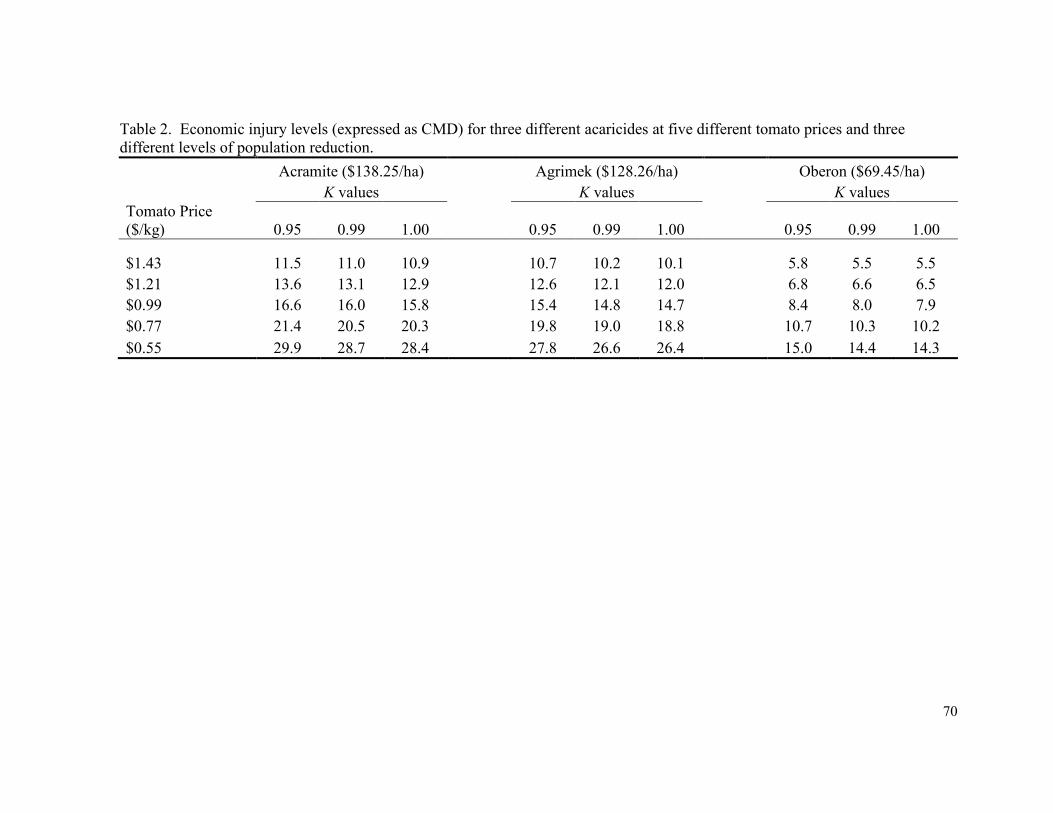
70
Table 2. Economic injury levels (expressed as CMD) for three different acaricides at five different tomato prices and three different levels of population reduction.
Acramite ($138.25/ha) Agrimek ($128.26/ha) Oberon ($69.45/ha)
K values K values K values
Tomato Price ($/kg) 0.95 0.99 1.00 0.95 0.99 1.00 0.95 0.99 1.00
$1.43 11.5 11.0 10.9 10.7 10.2 10.1 5.8 5.5 5.5
$1.21 13.6 13.1 12.9 12.6 12.1 12.0 6.8 6.6 6.5
$0.99 16.6 16.0 15.8 15.4 14.8 14.7 8.4 8.0 7.9
$0.77 21.4 20.5 20.3 19.8 19.0 18.8 10.7 10.3 10.2
$0.55 29.9 28.7 28.4 27.8 26.6 26.4 15.0 14.4 14.3
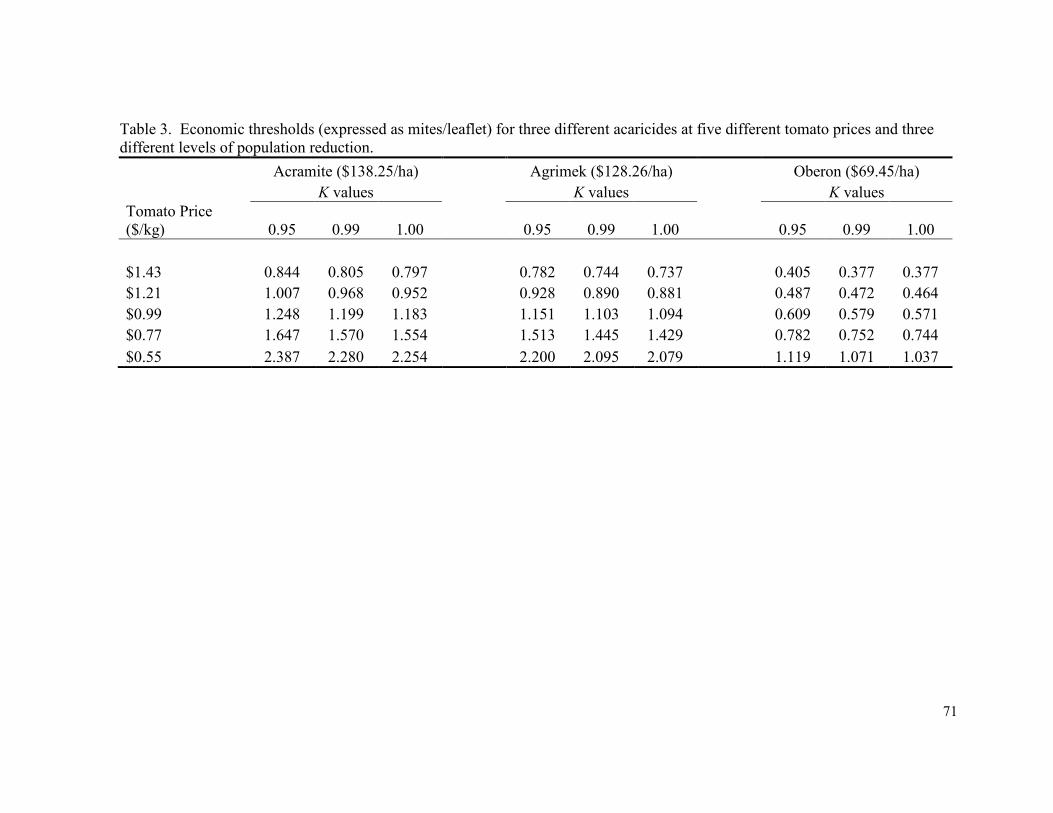
71
Table 3. Economic thresholds (expressed as mites/leaflet) for three different acaricides at five different tomato prices and three different levels of population reduction.
Acramite ($138.25/ha) Agrimek ($128.26/ha) Oberon ($69.45/ha)
K values K values K values
Tomato Price ($/kg) 0.95 0.99 1.00 0.95 0.99 1.00 0.95 0.99 1.00
$1.43 0.844 0.805 0.797 0.782 0.744 0.737 0.405 0.377 0.377
$1.21 1.007 0.968 0.952 0.928 0.890 0.881 0.487 0.472 0.464
$0.99 1.248 1.199 1.183 1.151 1.103 1.094 0.609 0.579 0.571
$0.77 1.647 1.570 1.554 1.513 1.445 1.429 0.782 0.752 0.744
$0.55 2.387 2.280 2.254 2.200 2.095 2.079 1.119 1.071 1.037
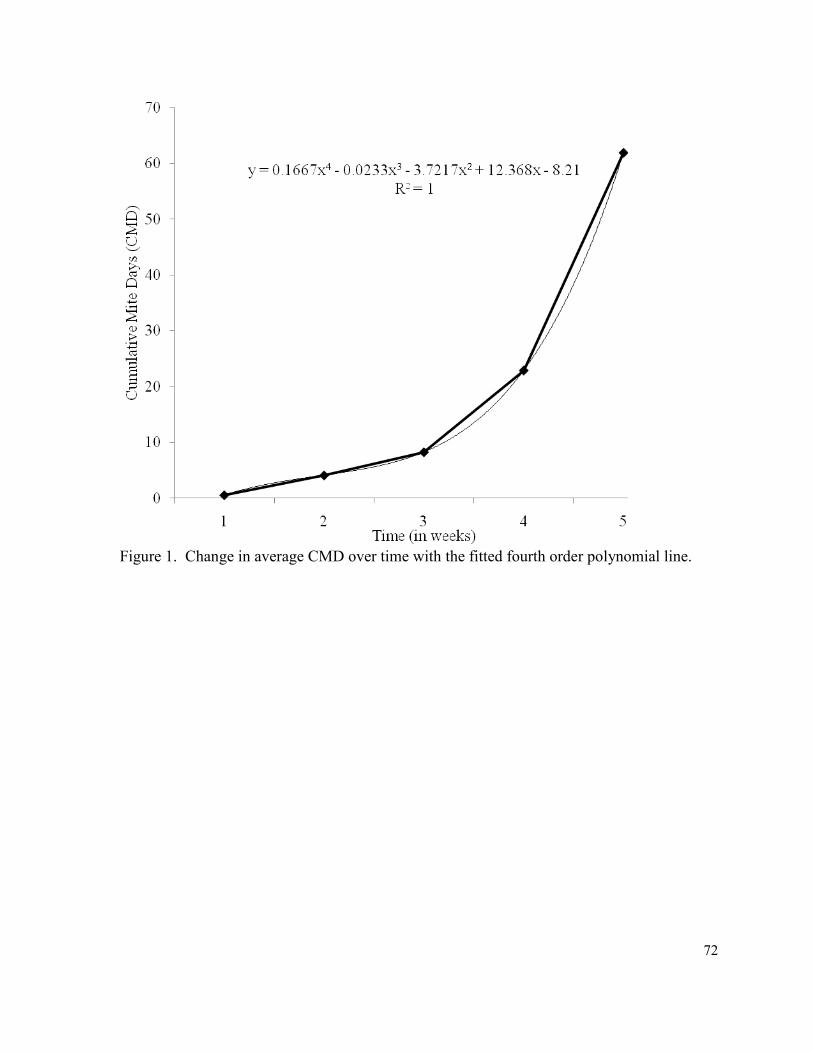
72
Figure 1. Change in average CMD over time with the fitted fourth order polynomial line.

73
Figure 2. Regression of CMD on average number of mites per leaflet
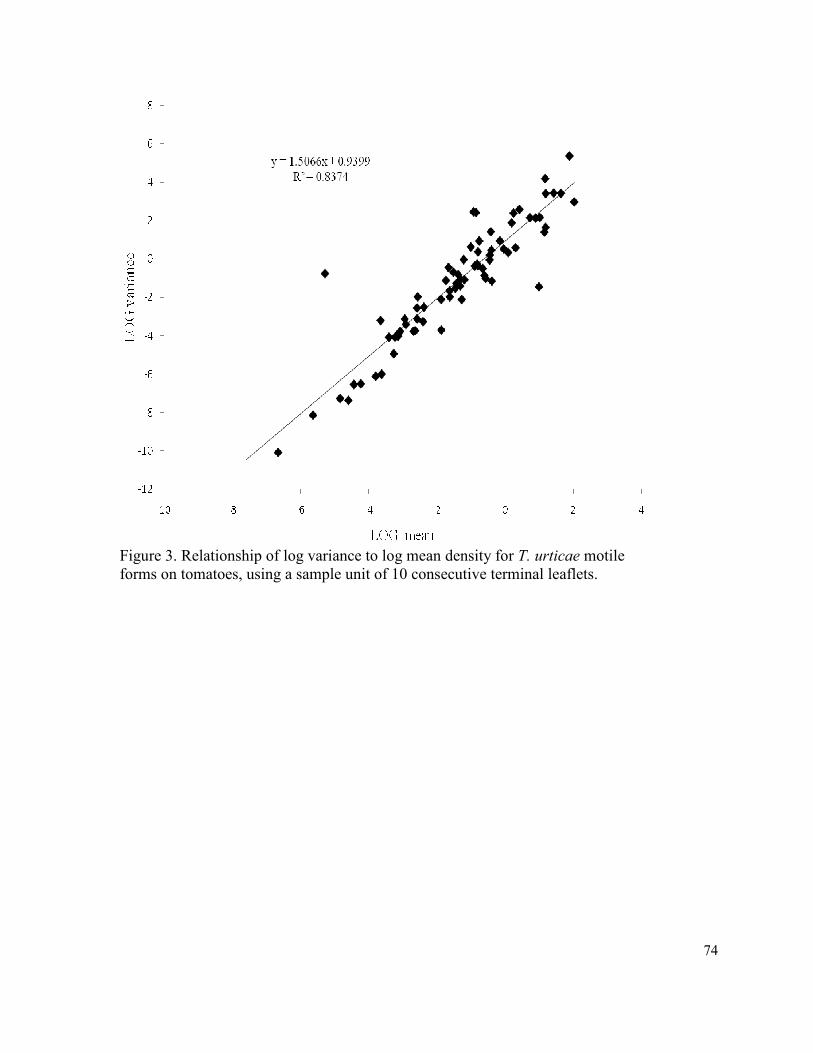
74
Figure 3. Relationship of log variance to log mean density for T. urticae motile
forms on tomatoes, using a sample unit of 10 consecutive terminal leaflets.
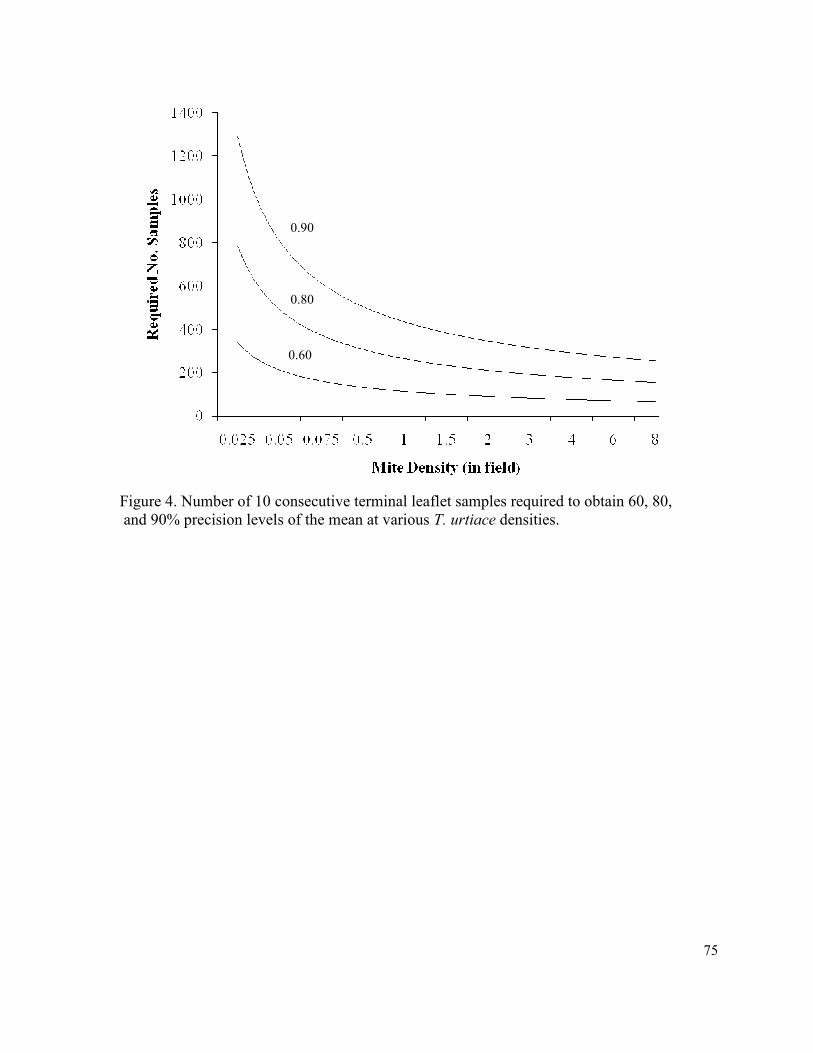
75
Figure 4. Number of 10 consecutive terminal leaflet samples required to obtain 60, 80,
and 90% precision levels of the mean at various T. urtiace densities.
0.80
0.90
0.60