Embed Size (px)
Citation preview
Do care plans and annual reviews of physical health influence
unplanned hospital utilisation for people with serious mental illness?
Analysis of linked longitudinal primary and secondary healthcare
records in England.
Authors:
Jemimah Ride (corresponding author): Centre for Health Economics, Alcuin ‘A’ Block, University of York, Heslington, YO10 5DD, United Kingdom. [email protected] (+44) 01904 321 459
Panagiotis Kasteridisa ([email protected]); Nils Gutacker a
([email protected]); Christoph Kronenberg b ([email protected]); Tim Doranc ([email protected]); Anne Mason a ([email protected]); Nigel Rice a ([email protected]); Hugh Gravelle a ([email protected]); Maria Goddard a ([email protected]); Tony Kendrick d ([email protected]); Najma Siddiqi c ([email protected]); Simon Gilbody c ([email protected]); Ceri R Daree ([email protected]); Lauren Aylotte ([email protected]); Rachael Williamsf ([email protected]); Rowena Jacobsa ([email protected])
a: Centre for Health Economics, University of York
b: CINCH, University Duisburg-Essen, Essen, Germany; Leibniz Science Campus Ruhr, Essen, Germany; RWI – Leibniz-Institute for Economic Research, Essen, Germany
c: Department of Health Sciences, University of York
d: Primary Care and Population Sciences, University of Southampton
e: Service user
f: Clinical Practice Research Datalink
Word count: 3,922
1
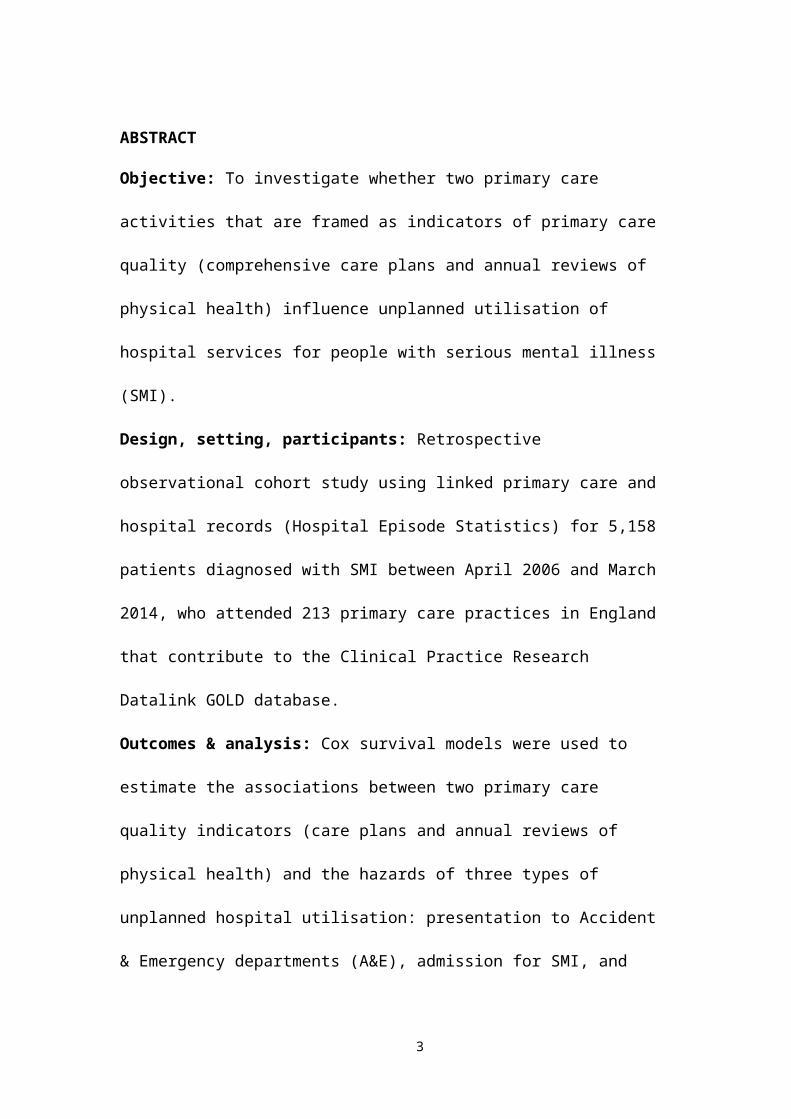
ABSTRACT
Objective: To investigate whether two primary care activities that are framed as
indicators of primary care quality (comprehensive care plans and annual reviews of
physical health) influence unplanned utilisation of hospital services for people with
serious mental illness (SMI).
Design, setting, participants: Retrospective observational cohort study using linked
primary care and hospital records (Hospital Episode Statistics) for 5,158 patients
diagnosed with SMI between April 2006 and March 2014, who attended 213 primary
care practices in England that contribute to the Clinical Practice Research Datalink
GOLD database.
Outcomes & analysis: Cox survival models were used to estimate the associations
between two primary care quality indicators (care plans and annual reviews of
physical health) and the hazards of three types of unplanned hospital utilisation:
presentation to Accident & Emergency departments (A&E), admission for SMI, and
admission for ambulatory care sensitive conditions (ACSC).
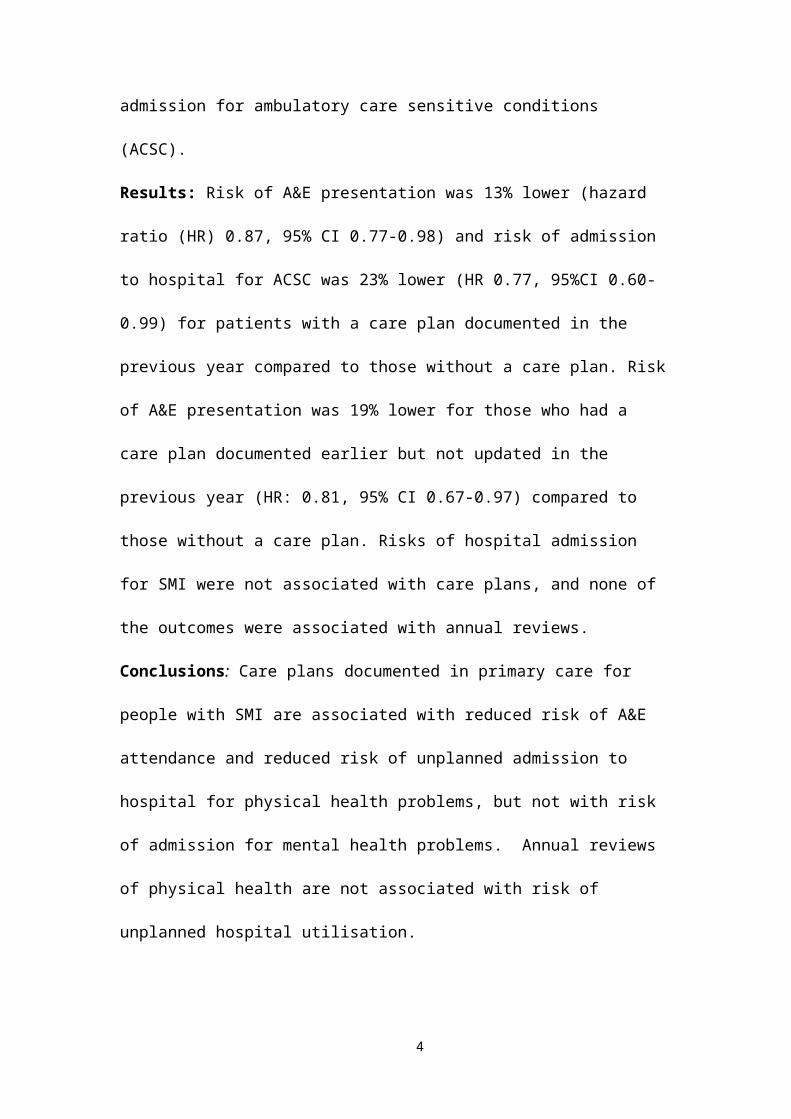
Results: Risk of A&E presentation was 13% lower (hazard ratio (HR) 0.87, 95% CI
0.77-0.98) and risk of admission to hospital for ACSC was 23% lower (HR 0.77,
95%CI 0.60-0.99) for patients with a care plan documented in the previous year
compared to those without a care plan. Risk of A&E presentation was 19% lower for
those who had a care plan documented earlier but not updated in the previous year
(HR: 0.81, 95% CI 0.67-0.97) compared to those without a care plan. Risks of
hospital admission for SMI were not associated with care plans, and none of the
outcomes were associated with annual reviews.
2
Conclusions: Care plans documented in primary care for people with SMI are
associated with reduced risk of A&E attendance and reduced risk of unplanned
admission to hospital for physical health problems, but not with risk of admission for
mental health problems. Annual reviews of physical health are not associated with
risk of unplanned hospital utilisation.
3
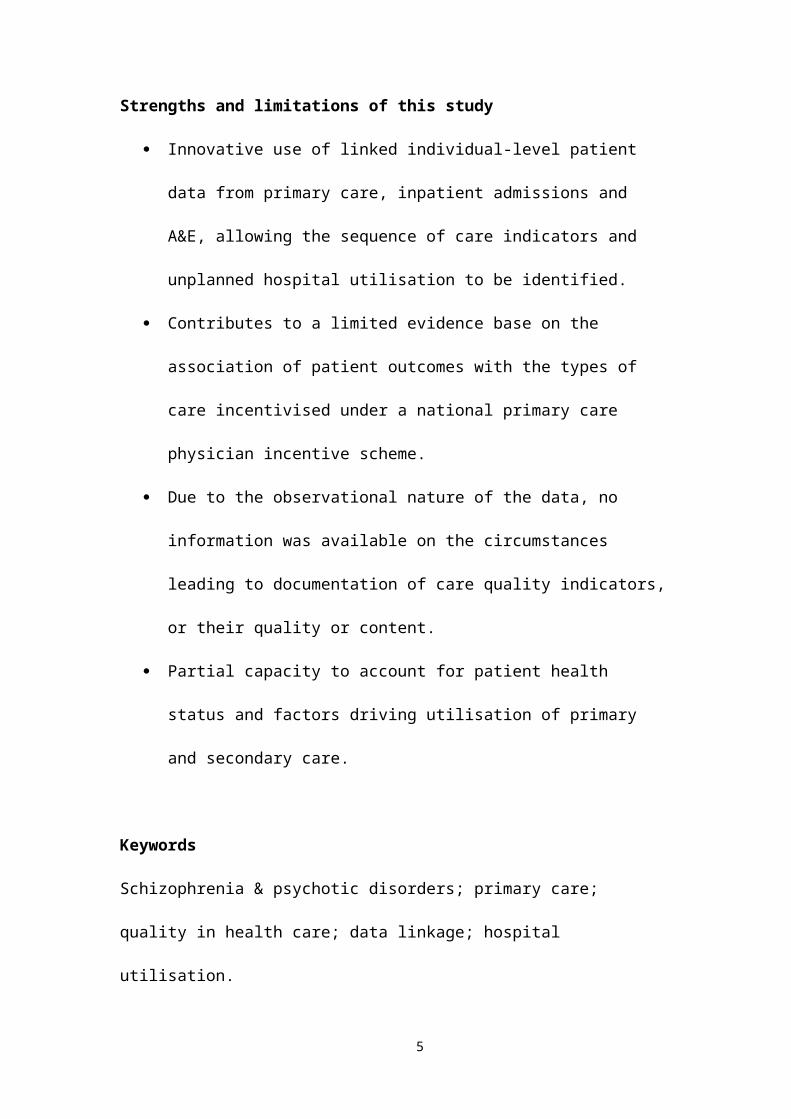
Strengths and limitations of this study
Innovative use of linked individual-level patient data from primary care,
inpatient admissions and A&E, allowing the sequence of care indicators and
unplanned hospital utilisation to be identified.
Contributes to a limited evidence base on the association of patient outcomes
with the types of care incentivised under a national primary care physician
incentive scheme.
Due to the observational nature of the data, no information was available on
the circumstances leading to documentation of care quality indicators, or their
quality or content.
Partial capacity to account for patient health status and factors driving
utilisation of primary and secondary care.
Keywords
Schizophrenia & psychotic disorders; primary care; quality in health care; data
linkage; hospital utilisation.
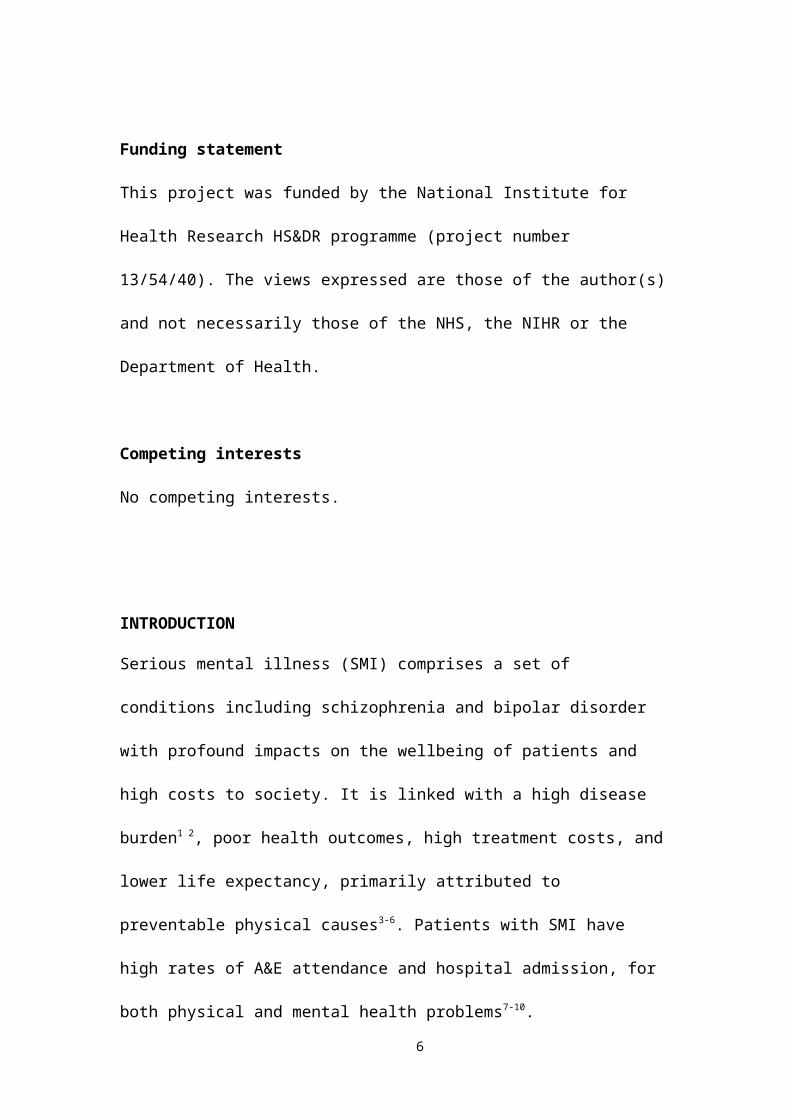
Funding statement
This project was funded by the National Institute for Health Research HS&DR
programme (project number 13/54/40). The views expressed are those of the author(s)
and not necessarily those of the NHS, the NIHR or the Department of Health.
Competing interests
No competing interests.
4
INTRODUCTION
Serious mental illness (SMI) comprises a set of conditions including schizophrenia
and bipolar disorder with profound impacts on the wellbeing of patients and high
costs to society. It is linked with a high disease burden1 2, poor health outcomes, high
treatment costs, and lower life expectancy, primarily attributed to preventable
physical causes3-6. Patients with SMI have high rates of A&E attendance and hospital
admission, for both physical and mental health problems7-10.
In the UK, while specialist mental health services are important to many patients’
care, general practice provides the majority of care for patients with SMI11. High
quality primary care therefore has the potential to improve the management, health
and wellbeing of patients with SMI, and can help meet the aims of policymakers
seeking to improve population wellbeing and contain costs12 13.
Several countries have adopted incentive programs to improve the quality and value
of healthcare14, despite mixed evidence of their effectiveness15-17. England introduced
a voluntary scheme for primary care in 2004, the Quality and Outcomes Framework
(QOF), offering GPs incentives to meet quality targets for patients with several
chronic conditions, including SMI18. Two key SMI indicators in the QOF, which
apply to all registered patients with SMI, promote proactive management of physical
and mental health: the proportion of patients on the practice SMI register who had an
in-date comprehensive care plan, and the proportion who had an annual physical
health review.
5
There is little evidence on whether these incentivised activities improve patients’
mental or physical health, modify patterns of healthcare utilisation, or reduce costs.
They derive from NICE guideline recommendations for primary care management of
SMI, which are based on consensus in the absence of robust evidence19 20.
A previous study using data aggregated to practice level found that higher rates of
SMI admission were associated with higher achievement on the annual physical
review indicator, but not the care plan indicator21. However, that study could not
ascertain which individuals within a practice received care or whether the care
preceded or followed admissions.
As the QOF indicators are regularly reviewed and revised, new evidence on their
potential impacts is useful for decision-makers. Our study contributes such evidence,
examining whether care plans and annual reviews are associated with utilisation of
unplanned secondary care for patients with SMI, by analysing linked primary care and
hospital records. We hypothesise that care plans and annual reviews may modify risk
of unplanned hospital utilisation, which is potentially preventable by high-quality
primary care22. Patients with SMI are less likely to report health problems than their
peers due to self-neglect, impaired motivation, and social withdrawal23 24. Proactive
care by GPs may help to identify and manage physical and mental health problems
without the need for hospital care.
6
METHODS
Study design
In this retrospective observational cohort study using linked primary care and hospital
data, we investigate the relationship between having a care plan and/or an annual
physical health review, and time from diagnosis of SMI to unplanned hospital
utilisation.
Data sources and linkage
The main data source is the Clinical Practice Research Datalink (CPRD) GOLD,
which holds linked individual-level anonymized primary care records from
participating general practices in the UK. These data are representative of the English
population with respect to age and gender, but not region. For example, the north-east
of England is under-sampled relative to areas in the west and south25. The CPRD data
service provided information on all patients eligible for linkage and registered with a
participating practice in England, and with a diagnosis of SMI documented on or
before 31 March 2014 recorded in clinical notes or referral records, using the event
date entered by the GP. The sample was limited to patients whose records met an
acceptable standard based on recording of registration, clinical events, and
demographic details, at practices deemed up to standard according to a CPRD
algorithm25. Most of the primary care information is recorded using a hierarchical
coding system known as ‘Read codes’26, which we use to identify records of SMI
diagnosis, care quality indicators, and morbidity profiles. CPRD records were linked
to Hospital Episode Statistics (HES), which comprise detailed records for all NHS
patients admitted to hospital and presentations to A&E in England. CPRD provided
deterministically linked admission and A&E data for all patients included in the
7
study. To preserve anonymity, all linkages were carried out under the CPRD routine
linkage scheme.
Inclusion and exclusion criteria
Our sample covers eight financial years, from 1 April 2006 to 31 March 2014. The
care plan indicator was introduced in 2006/07 and the last year of HES data available
to us at the start of the study was 2013/14. The sample comprises patients aged 18
years and over, whose earliest recorded diagnosis of SMI in primary care was after 31
March 2006, and who were registered with the same practice for at least 365 days
before that diagnosis. A&E data are only available from 2007/08, so the analysis of
A&E presentations is limited to patients with a first diagnosis after 31 March 2007.
The restriction to newly diagnosed patients excludes those whose unobserved past
care or events could influence their subsequent care.
Outcomes
We analyse three outcomes taken from HES data: time to i) presentations to Accident
and Emergency departments (A&E), ii) unplanned hospital admission for SMI, and
iii) unplanned admissions for ambulatory care sensitive conditions (ACSCs).
Unplanned admissions, based on the HES admission method codes for emergency
admissions, were classified by International Classification of Diseases (ICD-10)
codes. For SMI admissions this included admissions with primary diagnosis field
code categories F20-F3127. For ACSC, the codes were those defined by Bardsley, et
al.28 (see Supplementary Table 1 for the list of conditions included). A&E
presentations of any cause (mental or physical health) were included.
8
Care quality indicators
Primary care quality indicators were taken from CPRD data, and capture care plans
and annual reviews of physical health based on Read codes specified under the QOF
to identify those two indicators. A good quality care plan documents the patient’s
current health and social care needs, and how these will be addressed, in agreement
with patients and caregivers. It should specify arrangements with secondary care
services (where applicable), and recommendations in case of relapse, including the
patient’s care preferences and goals19 20. The QOF incentivises GPs to document care
plans annually, so we analyse ‘current’ care plans, those recorded in the last twelve
months. However, we hypothesise that an older care plan may still influence patients’
health service utilisation, and therefore also analyse ‘expired’ care plans, those
recorded more than a year ago. Conversely, only ‘current’ annual reviews (recorded
within the last twelve months) are included in the analysis, since expired monitoring
of physical health is unlikely to have ongoing benefits. The choice of the twelve-
month window to determine expiration status is based on the QOF guidance that a
care plan or annual review should be reviewed annually3.
From 2006/7 to 2010/11 the QOF annual review indicator entailed the patient being
given appropriate health promotion and prevention advice. In 2011/12, this broad
indicator was split into more specific indicators: a record of alcohol consumption,
checks of blood pressure, body mass index (BMI), blood glucose or glycated
haemoglobin, and ratio of total to high-density lipoprotein cholesterol, and, where
appropriate, cervical screening. In order to explore annual reviews for the full period
of our analysis, we formulate an aggregate indicator. This signifies that the patient
had at least three of four ‘health risk’ checks (blood pressure, BMI, cholesterol, and
9
glucose) documented within a three month period29. The date of the aggregate
indicator is the date of the final check. In our analysis, patients are considered to have
a ‘current’ annual review for twelve months after either an annual review (using the
original Read coding), or from the date of this aggregate indicator.
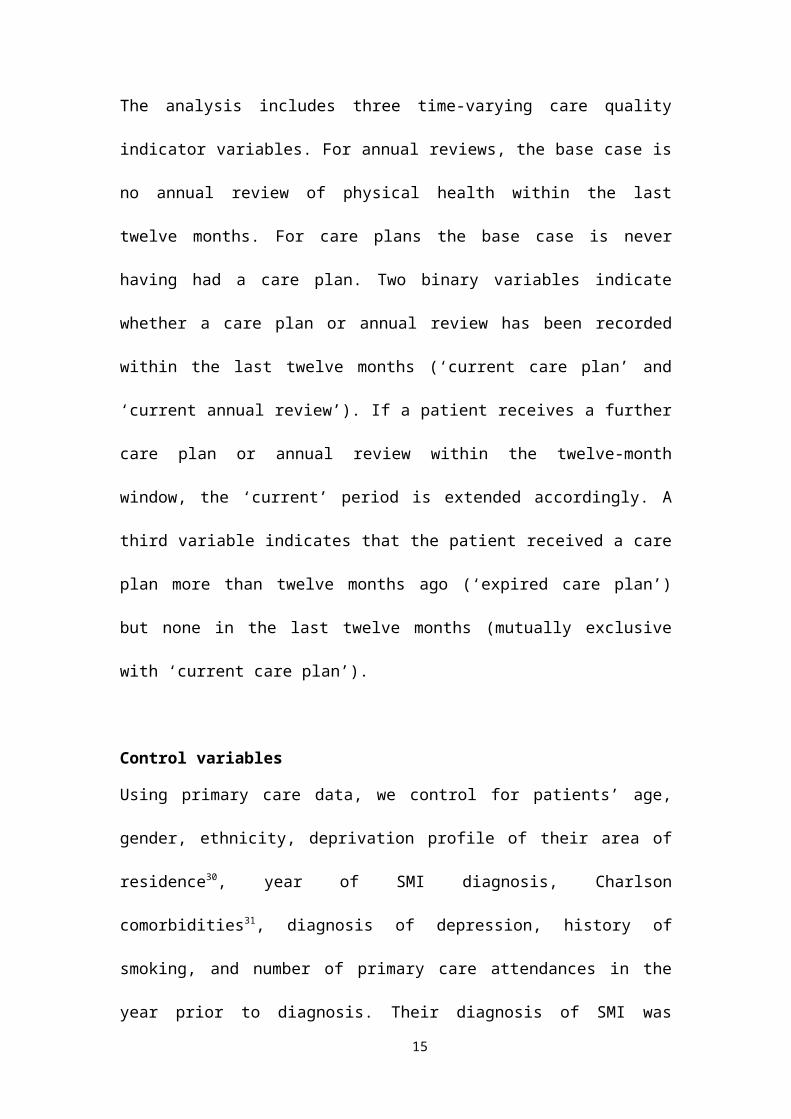
The analysis includes three time-varying care quality indicator variables. For annual
reviews, the base case is no annual review of physical health within the last twelve
months. For care plans the base case is never having had a care plan. Two binary
variables indicate whether a care plan or annual review has been recorded within the
last twelve months (‘current care plan’ and ‘current annual review’). If a patient
receives a further care plan or annual review within the twelve-month window, the
‘current’ period is extended accordingly. A third variable indicates that the patient
received a care plan more than twelve months ago (‘expired care plan’) but none in
the last twelve months (mutually exclusive with ‘current care plan’).
Control variables
Using primary care data, we control for patients’ age, gender, ethnicity, deprivation
profile of their area of residence30, year of SMI diagnosis, Charlson comorbidities31,
diagnosis of depression, history of smoking, and number of primary care attendances
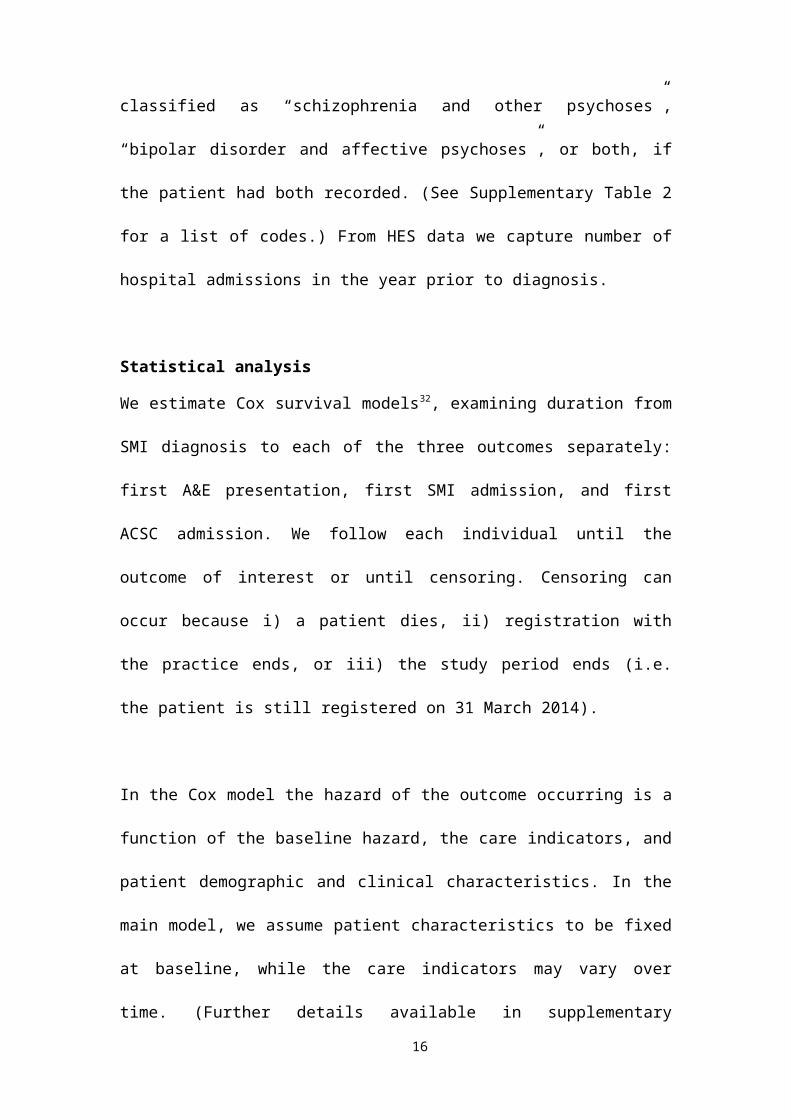
in the year prior to diagnosis. Their diagnosis of SMI was classified as “schizophrenia
and other psychoses”, “bipolar disorder and affective psychoses”, or both, if the
patient had both recorded. (See Supplementary Table 2 for a list of codes.) From HES
data we capture number of hospital admissions in the year prior to diagnosis.
10
Statistical analysis
We estimate Cox survival models32, examining duration from SMI diagnosis to each
of the three outcomes separately: first A&E presentation, first SMI admission, and
first ACSC admission. We follow each individual until the outcome of interest or until
censoring. Censoring can occur because i) a patient dies, ii) registration with the
practice ends, or iii) the study period ends (i.e. the patient is still registered on 31
March 2014).
In the Cox model the hazard of the outcome occurring is a function of the baseline
hazard, the care indicators, and patient demographic and clinical characteristics. In the
main model, we assume patient characteristics to be fixed at baseline, while the care
indicators may vary over time. (Further details available in supplementary material.)
We stratify on practice, so that the baseline hazard varies across practices, to allow for
unobserved differences in patient populations and practice characteristics, and
standard errors are adjusted for clustering at practice level to account for within-
practice correlation. Coefficient estimates are presented as hazard ratios (HRs) with
associated 95% confidence intervals (CIs), where values greater than 1 indicate an
increase in the hazard of the outcome associated with a unit change in the explanatory
variable, and vice versa for a HR below 1. All analyses were performed in Stata 14
(StataCorp LP, College Station, TX, US).
Sensitivity analyses
We undertake five tests of the sensitivity of our findings to alternate specifications of
the model. First, we test the robustness of the annual review variable, which in our
main analysis is the composite indicator constructed from both the QOF-specified
11
Read codes and the specific health checks that contribute to such reviews. We explore
the impact of restricting this to the QOF-specified Read codes, which necessitates
limiting the observation period to 2006/07 to 2010/11 (or 2007/08 to 2010/11 for the
A&E outcome). Second, we assume the indicators expire after 15 months instead of
12 months. Third, instead of fixing the number of Charlson comorbidities at baseline,
we allow this to increase over the period of observation if patients are diagnosed with
new comorbidities. We lastly apply two alternate specifications of practice-level
characteristics, instead of stratifying on practice. The first assumes no practice-level
differences in baseline hazard, but includes practice characteristics (rurality and
distance from closest acute hospital and inpatient psychiatric unit) as covariates. The
second includes practice fixed effects as explanatory variables. Both models adjust the
standard errors for clustering at the practice level as before.
Patient involvement
Two co-authors on the multidisciplinary team responsible for this study have lived
experience of SMI. They contributed to the design of the research questions and
methodological approach, interpretation of the findings, and writing the paper.
RESULTS
Study population
The full sample consists of 5,158 newly diagnosed patients with SMI from 213
practices in England with a total of 14,376 person-years observed before censoring
(for A&E analysis 4,446 patients and a total of 10,952 person-years). On average
patients were observed for 2.79 years. Most (67%) were still observed at the end of
the study period, 23% exited because their registration with the practice ended during
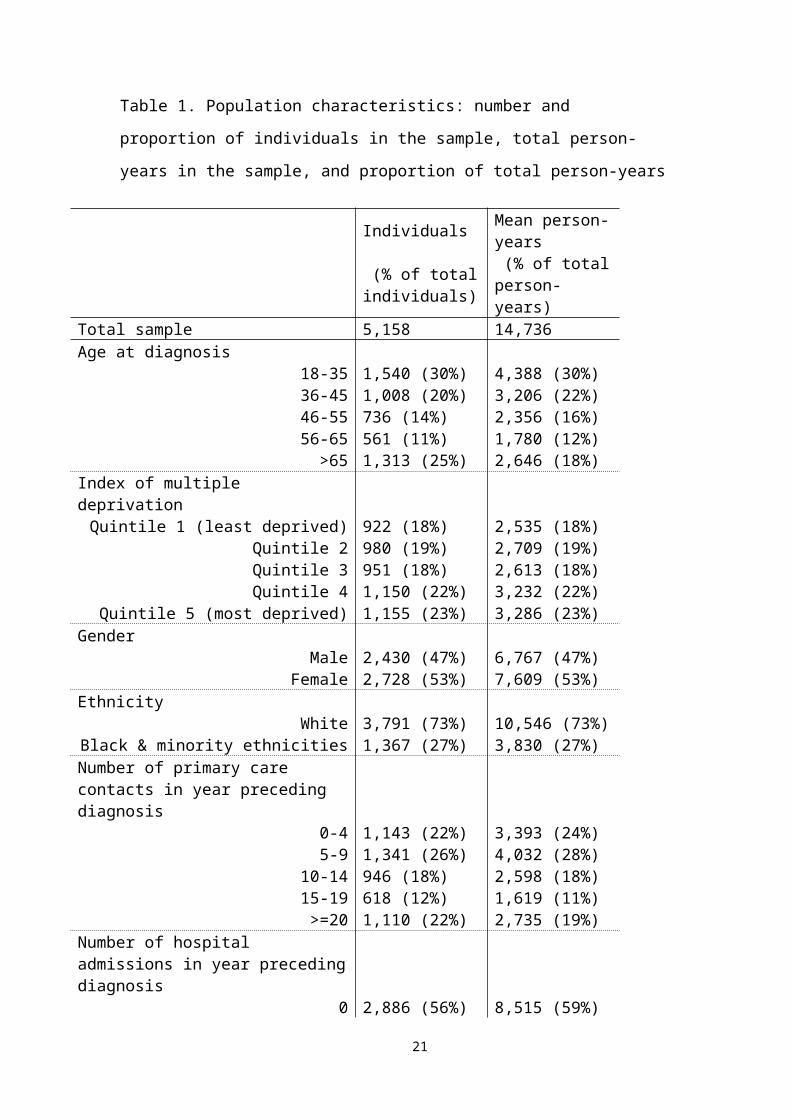
the study period, and 10% died. Table 1 presents the number of individuals with each
12
characteristic, and the contribution of those with each characteristic to the total time
observed. (Equivalent tables are presented for each analysis sample in Supplementary
Tables 3-5). There were more people per year diagnosed in later years of the study
period, but each was observed for a shorter period, and therefore had a shorter
window of opportunity to experience both the care quality indicators and the
outcomes. Similarly, those aged over 65 made up 25% of the sample but only
contributed 18% of the total time observed because they had a shorter than average
period of observation (2.01 years). The median age at diagnosis in the sample was 46,
and the most common physical comorbidities were respiratory disease, renal disease,
cancer, and diabetes (further details available in Supplementary Table 6).
13
Table 1. Population characteristics: number and proportion of individuals in the
sample, total person-years in the sample, and proportion of total person-years
Individuals Mean person-years
(% of total individuals)
(% of total person-years)
Total sample 5,158 14,736 Age at diagnosis
18-35 1,540 (30%) 4,388 (30%)36-45 1,008 (20%) 3,206 (22%)46-55 736 (14%) 2,356 (16%)56-65 561 (11%) 1,780 (12%)
>65 1,313 (25%) 2,646 (18%)Index of multiple deprivation
Quintile 1 (least deprived) 922 (18%) 2,535 (18%)Quintile 2 980 (19%) 2,709 (19%)Quintile 3 951 (18%) 2,613 (18%)Quintile 4 1,150 (22%) 3,232 (22%)
Quintile 5 (most deprived) 1,155 (23%) 3,286 (23%)Gender
MaleFemale
2,430 (47%)2,728 (53%)
6,767 (47%)7,609 (53%)
EthnicityWhite
Black & minority ethnicities3,791 (73%)1,367 (27%)
10,546 (73%)3,830 (27%)
Number of primary care contacts in year preceding diagnosis
0-4 1,143 (22%) 3,393 (24%)5-9 1,341 (26%) 4,032 (28%)
10-14 946 (18%) 2,598 (18%)15-19 618 (12%) 1,619 (11%)>=20 1,110 (22%) 2,735 (19%)
Number of hospital admissions in year preceding diagnosis
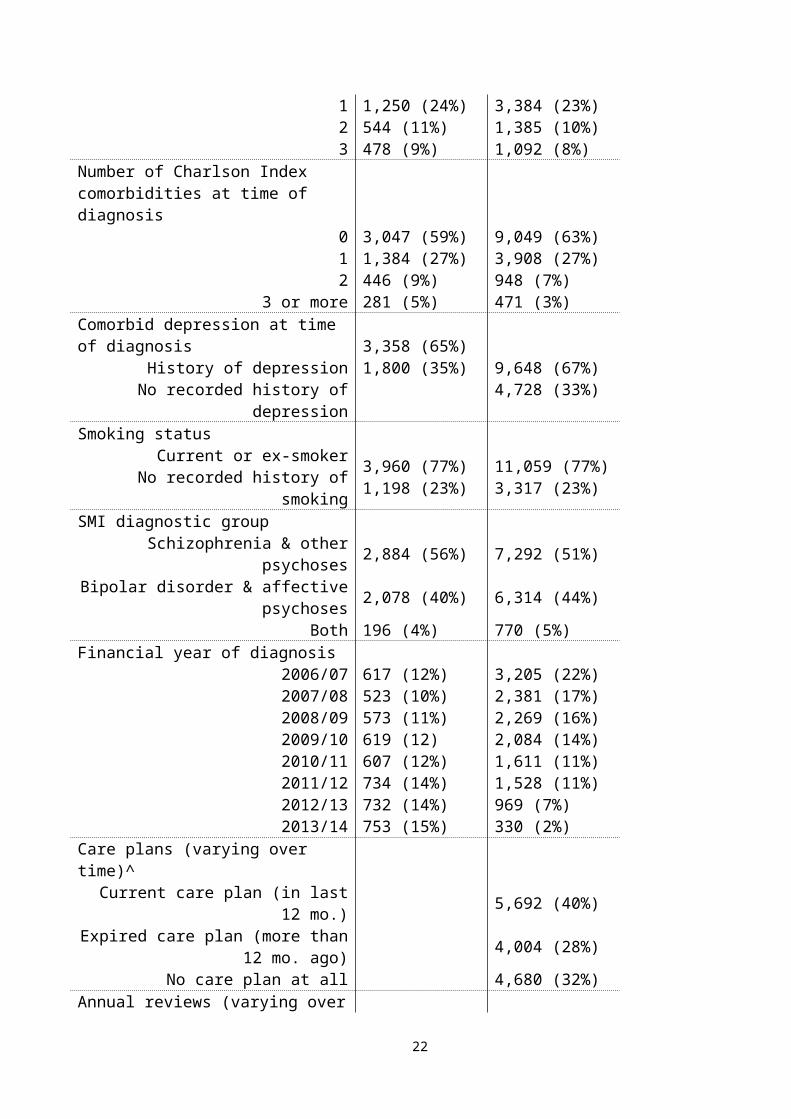
0 2,886 (56%) 8,515 (59%)1 1,250 (24%) 3,384 (23%)2 544 (11%) 1,385 (10%)3 478 (9%) 1,092 (8%)
Number of Charlson Index comorbidities at time of diagnosis
0 3,047 (59%) 9,049 (63%)1 1,384 (27%) 3,908 (27%)2 446 (9%) 948 (7%)
3 or more 281 (5%) 471 (3%)Comorbid depression at time of diagnosis
History of depression 3,358 (65%) 9,648 (67%)
14
No recorded history of depression 1,800 (35%) 4,728 (33%)Smoking status
Current or ex-smokerNo recorded history of smoking
3,960 (77%)1,198 (23%)
11,059 (77%)3,317 (23%)
SMI diagnostic groupSchizophrenia & other psychoses 2,884 (56%) 7,292 (51%)
Bipolar disorder & affective psychoses 2,078 (40%) 6,314 (44%)Both 196 (4%) 770 (5%)
Financial year of diagnosis 2006/07 617 (12%) 3,205 (22%)2007/08 523 (10%) 2,381 (17%)2008/09 573 (11%) 2,269 (16%)2009/10 619 (12) 2,084 (14%)2010/11 607 (12%) 1,611 (11%)2011/12 734 (14%) 1,528 (11%)2012/13 732 (14%) 969 (7%)2013/14 753 (15%) 330 (2%)
Care plans (varying over time)^Current care plan (in last 12 mo.) 5,692 (40%)
Expired care plan (more than 12 mo. ago) 4,004 (28%)No care plan at all 4,680 (32%)
Annual reviews (varying over time)^Current annual review (in last 12 mo.) 8,579 (60%)
No annual review in last 12mo 5,797 (40%)Patient characteristics are fixed at baseline (date of diagnosis) except for care quality indicators, which vary over the study period. ^The three care plans categories are mutually exclusive (as are the two annual review categories) so each person’s total time observed is the sum of these categories
15
Overall, 69% of the sample had a current care plan at least once, contributing 40% of
the total time observed, while 72% of the sample had a current annual review at least
once, contributing 60% of the total time observed, and 42% of the sample had an
expired care plan at least once, contributing 28% of the total time observed. More
detail on the annual rates of care plan and annual review indicators is available in
supplementary material (Supplementary Figure 1).
Outcomes
Summary statistics for each of the three outcome variables are presented in Table 2.
During the period of observation, 50% had an A&E presentation, 11% had an SMI
admission, and 10% had an ACSC admission.
16
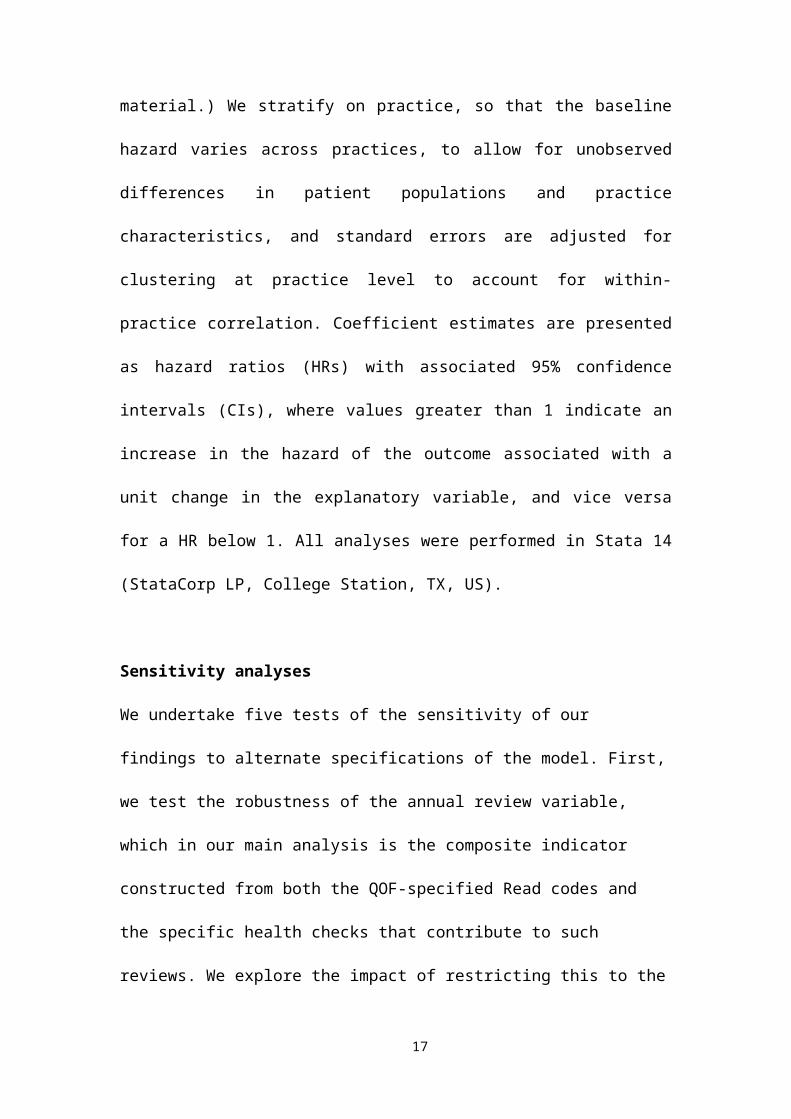
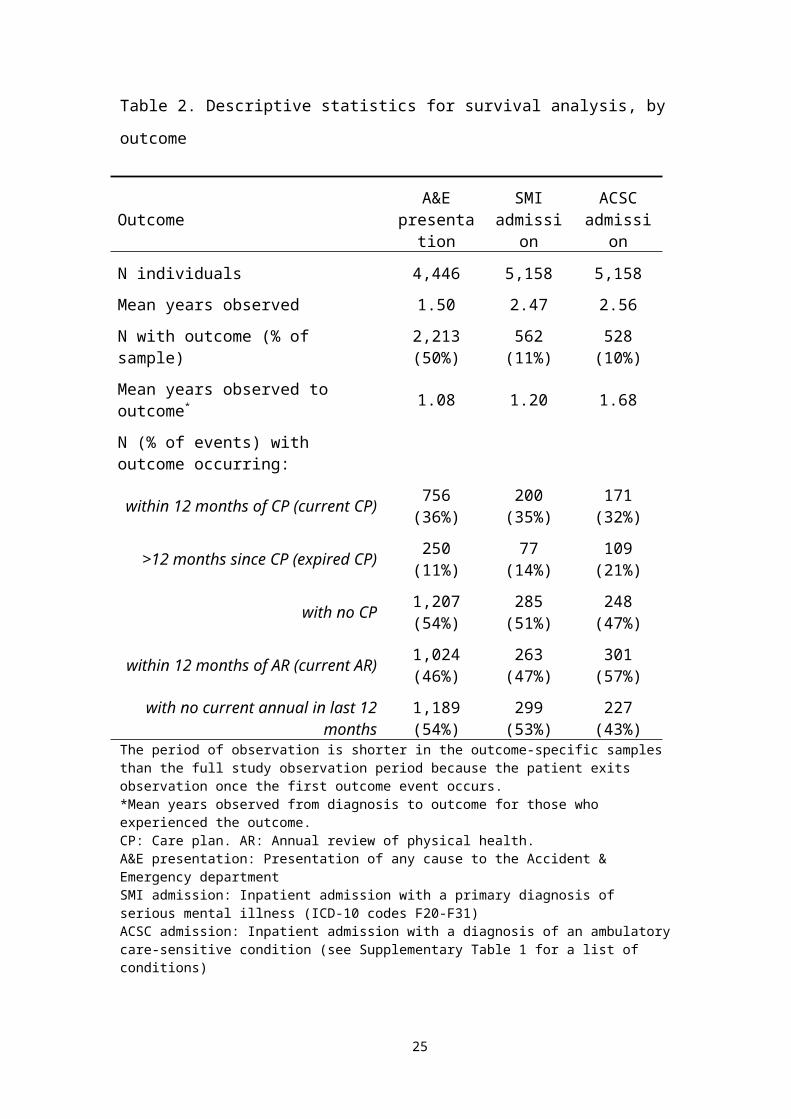
Table 2. Descriptive statistics for survival analysis, by outcome
Outcome A&E presentation
SMI admission
ACSC admission
N individuals 4,446 5,158 5,158
Mean years observed 1.50 2.47 2.56
N with outcome (% of sample) 2,213 (50%) 562 (11%) 528 (10%)
Mean years observed to outcome* 1.08 1.20 1.68
N (% of events) with outcome occurring:
within 12 months of CP (current CP) 756 (36%) 200 (35%) 171 (32%)
>12 months since CP (expired CP) 250 (11%) 77 (14%) 109 (21%)
with no CP 1,207 (54%) 285 (51%) 248 (47%)
within 12 months of AR (current AR) 1,024 (46%) 263 (47%) 301 (57%)
with no current annual in last 12 months 1,189 (54%) 299 (53%) 227 (43%)
The period of observation is shorter in the outcome-specific samples than the full study observation period because the patient exits observation once the first outcome event occurs.*Mean years observed from diagnosis to outcome for those who experienced the outcome. CP: Care plan. AR: Annual review of physical health. A&E presentation: Presentation of any cause to the Accident & Emergency departmentSMI admission: Inpatient admission with a primary diagnosis of serious mental illness (ICD-10 codes F20-F31)ACSC admission: Inpatient admission with a diagnosis of an ambulatory care-sensitive condition (see Supplementary Table 1 for a list of conditions)
17
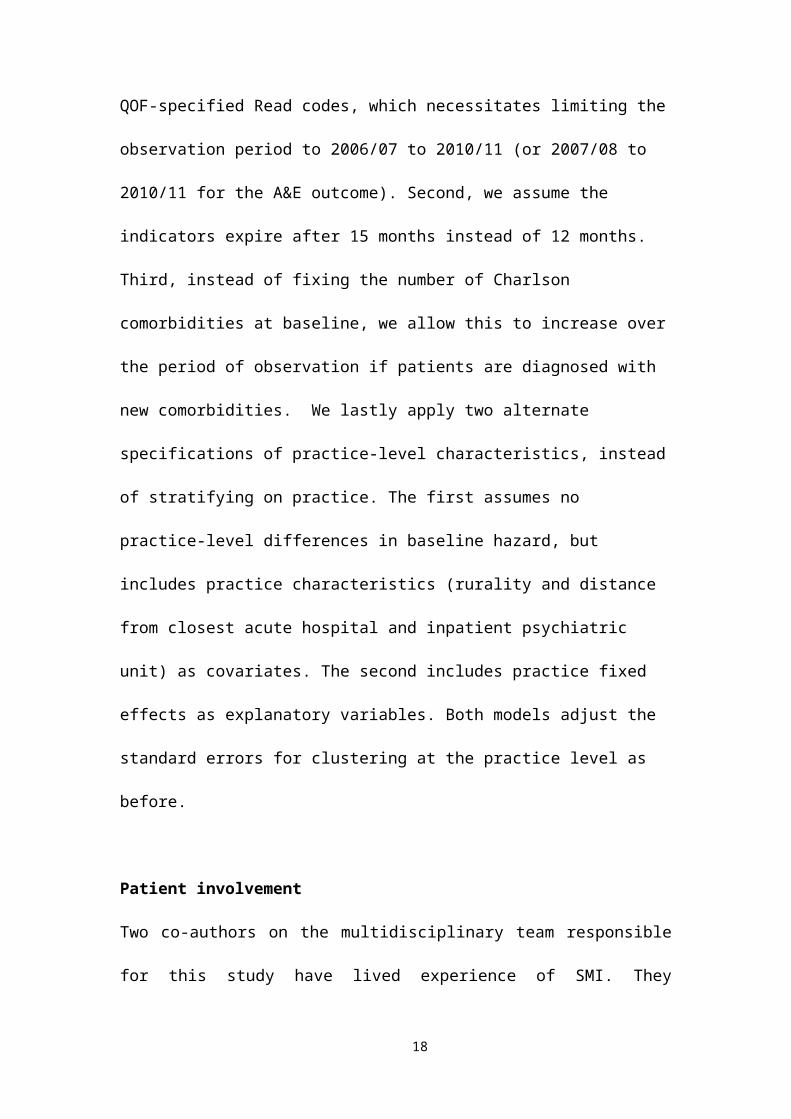
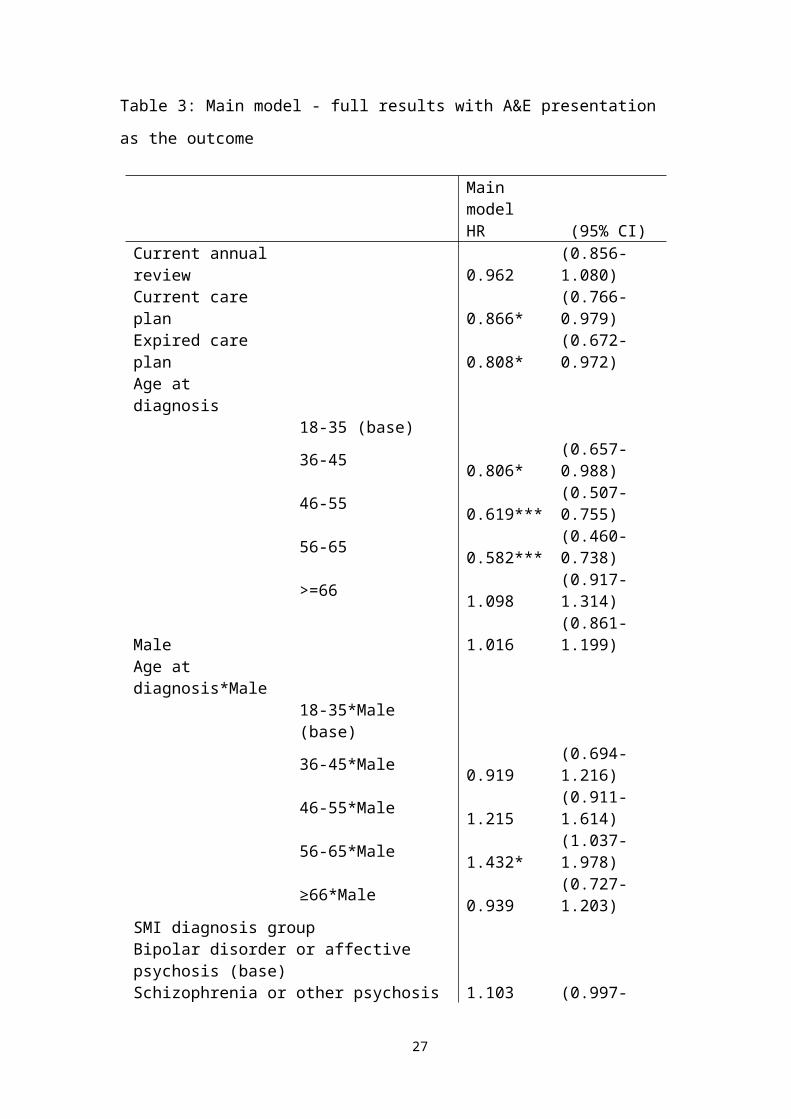
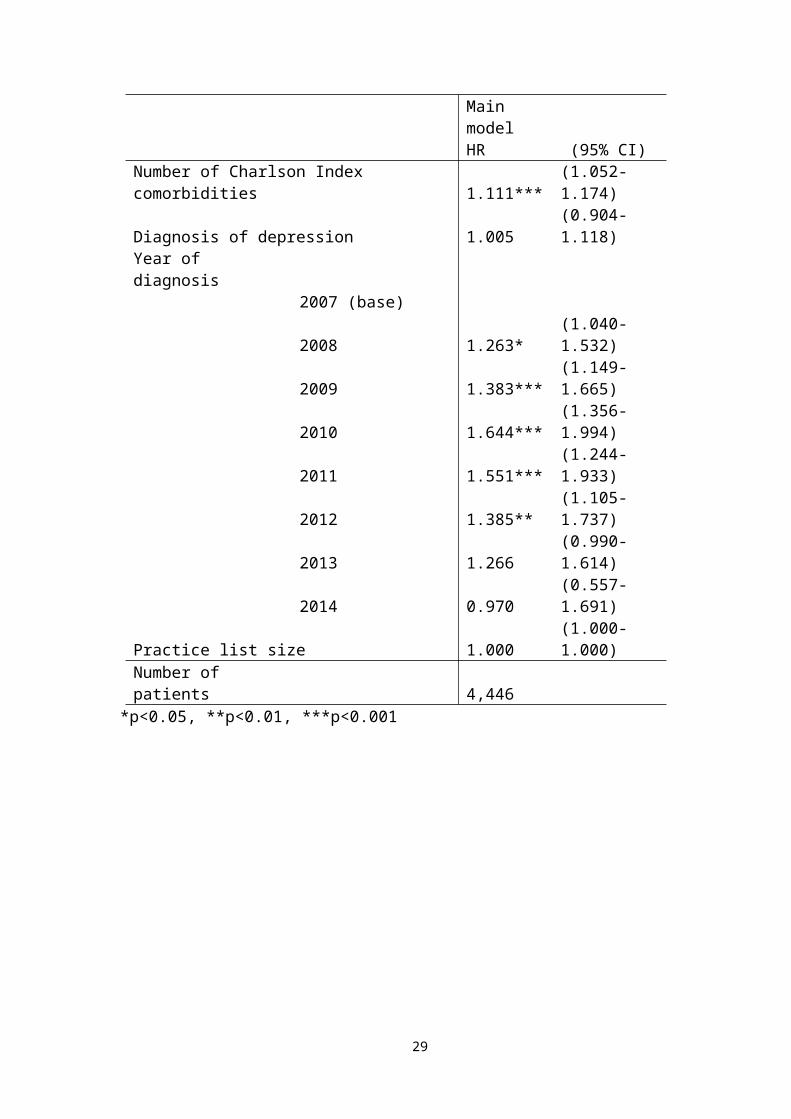
Table 3: Main model - full results with A&E presentation as the outcome
Main modelHR (95% CI)
Current annual review 0.962 (0.856-1.080)Current care plan 0.866* (0.766-0.979)Expired care plan 0.808* (0.672-0.972)Age at diagnosis
18-35 (base) 36-45 0.806* (0.657-0.988)46-55 0.619*** (0.507-0.755)56-65 0.582*** (0.460-0.738)>=66 1.098 (0.917-1.314)
Male 1.016 (0.861-1.199)Age at diagnosis*Male
18-35*Male (base) 36-45*Male 0.919 (0.694-1.216)46-55*Male 1.215 (0.911-1.614)56-65*Male 1.432* (1.037-1.978)≥66*Male 0.939 (0.727-1.203)
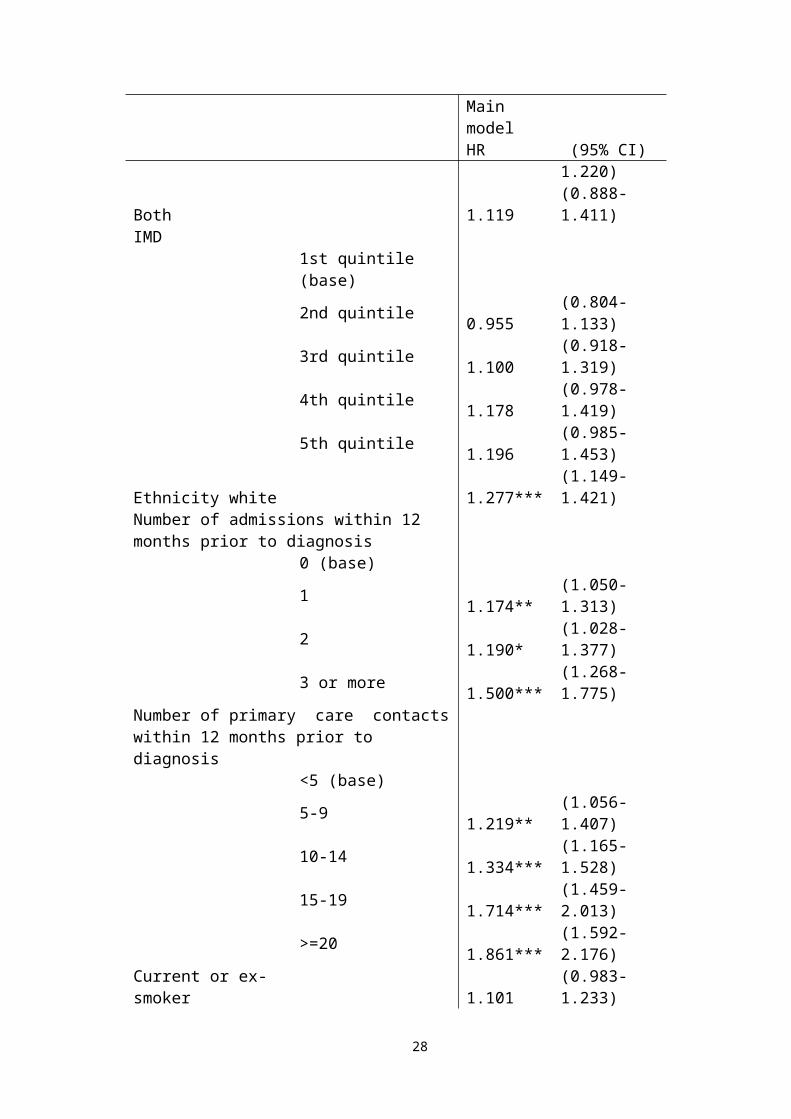
SMI diagnosis groupBipolar disorder or affective psychosis (base)Schizophrenia or other psychosis 1.103 (0.997-1.220)Both 1.119 (0.888-1.411)IMD
1st quintile (base) 2nd quintile 0.955 (0.804-1.133)3rd quintile 1.100 (0.918-1.319)4th quintile 1.178 (0.978-1.419)5th quintile 1.196 (0.985-1.453)
Ethnicity white 1.277*** (1.149-1.421)Number of admissions within 12 months prior to diagnosis
0 (base) 1 1.174** (1.050-1.313)2 1.190* (1.028-1.377)3 or more 1.500*** (1.268-1.775)
Number of primary care contacts within 12 months prior to diagnosis
<5 (base) 5-9 1.219** (1.056-1.407)10-14 1.334*** (1.165-1.528)15-19 1.714*** (1.459-2.013)>=20 1.861*** (1.592-2.176)
Current or ex-smoker 1.101 (0.983-1.233)Number of Charlson Index comorbidities 1.111*** (1.052-1.174)
18
Main modelHR (95% CI)
Diagnosis of depression 1.005 (0.904-1.118)Year of diagnosis
2007 (base) 2008 1.263* (1.040-1.532)2009 1.383*** (1.149-1.665)2010 1.644*** (1.356-1.994)2011 1.551*** (1.244-1.933)2012 1.385** (1.105-1.737)2013 1.266 (0.990-1.614)2014 0.970 (0.557-1.691)
Practice list size 1.000 (1.000-1.000)Number of patients 4,446
*p<0.05, **p<0.01, ***p<0.001
19
Results of survival analysis
Results showing the association of the three key explanatory variables with hazard
(HR) of each of the outcomes are presented in Figure 1. HRs for control variables are
presented in Table 3 with A&E as the outcome.
[Figure 1 about here]
The hazard of A&E presentation is 13% lower for patients who have a current care
plan (HR 0.87, 95% CI 0.77-0.98) and 19% lower for those with an expired care plan
(HR 0.81, 95% CI 0.67-0.97), both compared with those who have had no care plan at
all. There is no statistically significant association with annual reviews of physical
health (HR 0.96, 95% CI 0.86-1.08). The hazard of first ACSC admission after SMI
diagnosis is 23% lower for those with a current care plan (HR 0.77, 95% CI 0.60-
0.99), but there is no statistically significant association with expired care plans or
annual reviews. Neither indicator shows a statistically significant association with the
hazard of SMI admission.
Results of sensitivity testing (detailed in Supplementary Tables 7-9) show no
statistically significant association between annual reviews of physical health and any
of the outcomes under all assumptions tested. The association between care plans and
A&E presentations remained essentially unchanged, except that the association with
current care plans became non-significant (as confidence intervals widened) when the
analysis was limited to 2007/08 – 2010/11, and similarly with expired care plans
when the indicators were assumed to be effective (current) for 15 months instead of
12. There remained no statistically significant association between the indicators and
20
SMI admissions under the varying assumptions. The association between ACSC
admission and current care plans was less robust to changing assumptions, losing
statistical significance under most alternate specifications and changing signs when
the period of analysis was limited to 2007/08 – 2010/11.
DISCUSSION
Principal findings
We find that, among patients with SMI, those with a care plan documented in primary
care in the last 12 months have a 13% lower hazard of A&E presentation than those
without a care plan, and a 23% lower hazard of admission to hospital for ACSC (the
types of condition thought to be amenable to primary care). Those with a care plan
documented more than 12 months ago also had a lower hazard of A&E presentation
(19% lower than those with no care plan). We find no such association between
annual reviews of physical health and the hazard of any of the outcomes, nor between
care plans and admissions for SMI.
Strengths and weaknesses
Our study makes a number of important contributions to the evidence base, being (to
our knowledge) the first to use linked patient-level data to investigate the relationship
between incentivized primary care quality and hospital care for people with SMI in
the English NHS. By linking datasets, we track individual patients across primary care
and hospital settings over a number of years, and determine whether the primary care
indicator precedes the hospital utilisation. Our survival analysis exploits this,
providing more robust estimates of the association than would be possible with
aggregate data.
21
There are a number of limitations to our study. The measures of health status and
healthcare utilisation prior to diagnosis of SMI may not fully depict the complexities
of health status, including severity of SMI, and this may confound the results.
However, our findings were robust to whether the number of comorbidities was fixed
at baseline or allowed to vary over the period of observation. The outcomes we
analyse are measures of hospital utilisation, which are imperfect proxies for health
outcomes. Our finding of a negative association between care plans and A&E
presentations or ACSC admissions may reflect the presence of unobserved factors that
could contribute to the observed association without implying causality. We lack
information on the clinical circumstances leading to a care plan or annual review
being recorded, and on its content, quality and appropriateness. In the period
preceding hospital attendance, it is possible that care planning could be superseded by
acute management of physical or mental health conditions. Patients who have less
insight or lower levels of self-care may be less likely to seek regular primary care, and
therefore less likely to have care plans documented, but may also be more likely to
seek A&E care33 34. Conversely, our findings could underestimate any real effect of
care plans on A&E presentations if other unobserved factors contribute to a (non-
causal) positive association, such as care plans being triggered by patients attending
their GP for problems that will eventually need hospital care.
We restricted the sample to patients registered with the same practice for the year
preceding diagnosis in order to analyse a group of patients at a similar clinical stage,
and allow us to include measures of historical utilization and medical history.
However, the restriction may have excluded individuals with more severe SMI if this
22

led them to move practice. In addition, the sample may include some patients who
were not newly diagnosed, if their diagnostic information had not been transferred to
a new practice, or to a new electronic recording system.
The collection of HES A&E commenced on an experimental basis in April 2007, and
captured 62% of national A&E attendances in the first financial year. The
experimental label was lifted by April 2013 after capture had increased to over 80%.
However, there is no reason to consider that the capture of attendances is related to
whether a patient had a care plan or physical review, meaning our comparative
analysis should not be adversely impacted.
Comparison with other studies
There is limited, mixed evidence about the relationship between objective measures of
primary care quality and A&E attendance. Baker, et al.35 found that higher
performance on the QOF overall was not a predictor of area-level A&E attendances,
while subjective assessment of higher primary care quality has been found to be
associated with lower utilisation of A&E36 37. Using practice-level data, Gutacker, et
al.21 found that higher achievement on the annual review indicator was associated with
a higher rate of SMI admissions. One possible explanation was that patients had QOF
indicators documented after a hospital admission. Our analysis, which captures the
sequence of events and finds no association between annual reviews and hazard of
SMI admission, supports that explanation. Harrison, et al.38 found, using aggregate
data, that the introduction of the QOF was associated with a decrease in unplanned
admissions for incentivised ACSCs, consistent with our finding that care plans were
associated with a reduced risk of ACSC admissions. Wilson, et al.39 found, using
23
individual-level data, that while introduction of QOF incentives increased detection of
cardiovascular risk factors in patients with SMI, there was not necessarily any change
in management. This is consistent with our finding no evidence of improved health
outcomes (or their proxies, unplanned hospital utilisation) associated with annual
reviews of physical health.
Interpretation of results and implications for clinicians and policymakers
The association of care plans with reduced hazard of A&E presentations and ACSC
admissions might suggest that care plans help patients avoid hospital for conditions
that do not require hospital care. The documentation of patients’ current health status,
early warning signs, triggers, social support needs, co-ordination arrangements with
secondary care, and preferred course of action in the event of a clinical relapse could
improve the management of the patient’s health overall and prevent deterioration,
reducing the need for urgent care represented by ACSC admissions and A&E
presentations. It may also direct patients into appropriate services during periods of
deterioration, and thereby avert hospital use.
Increasing demand for A&E care, especially for problems that could be managed
elsewhere, is a policy focus in the UK NHS and in other health care systems40.
Patients with SMI, in particular, can require high resource input when attending
A&E41 42. The potential for care planning by GPs to reduce A&E attendances in this
patient population could therefore be an important finding for policymakers,
suggesting that continued incentivisation of this activity in primary care may help
reduce demand on secondary care services.
24
The associations of both ‘current’ and ‘expired’ care plans with lower hazard of A&E
attendance suggest that an older care plan can still be beneficial. However, the finding
that when care plans are considered effective for 15 months rather than 12 months,
only ‘current’ care plans are associated with reduced A&E attendance suggests that
there are limits to the duration of impact. The lack of association between annual
reviews of physical health and unplanned hospital care may suggest that effectiveness
of a GP in managing a patient’s health, and preventing the need for A&E or hospital
care, may be unaffected by whether or not annual reviews or health checks are
recorded.
Unanswered questions and future research
This study did not account for care provided by patients’ key workers or a crisis
resolution and home treatment team, which may provide an alternative to both
hospital admission and primary care. The modelling approach does adjust for
differences across practices, which may help control for some of these local effects.
To address this more adequately, the Mental Health Services Dataset, which can now
be linked to CPRD primary care data, could be used to cover mental health care
delivered in the community.
Conclusion
Provider incentive schemes are increasingly popular levers for improving value and
quality in healthcare worldwide, but evidence is needed on the effectiveness of
incentivised activities. Despite the vulnerability of people with SMI to poor health
outcomes, relatively few studies have examined the impact of care quality indicators
in this population. This study addresses that evidence gap, and advances our
25

understanding of how primary care can influence utilisation of hospital care in this
patient population. We find that care plans are associated with reduced risk of A&E
presentation and hospital admissions for conditions amenable to primary care,
supporting the hypothesis that this type of care incentivized under the QOF is
achieving at least some of its policy objectives and is worth maintaining.
26
Author contributions
JR, PK, NG, CK, TD, AM, NR, HG, MG, TK, NS, SG, CD, LA, RW and RJ
contributed to the design of the research questions, analytical approach, and
interpretation of the findings. JR produced a first draft of the paper and contributed to
and PK, NG, CK, TD, AM, NR, HG, MG, TK, NS, SG, CD, LA, RW and RJ
approved the final manuscript.
Data sharing
Due to the sensitive and confidential nature of the data used for this analysis, and the
permissions required to access it, the dataset is not publicly available.
Ethical approval
The study protocol was approved by the Independent Scientific Advisory Committee
of the Clinical Practice Research Datalink (protocol number 15_213R2A2).
Acknowledgements
This research is funded by the National Institute for Health Services & Delivery
Research program (project number 135440). The views and opinions expressed are
those of the authors and do not necessarily reflect those of the HS&DR program,
NIHR, NHS or the Department of Health. We are grateful to the researchers who
extracted and provided the CPRD data. We would like to thank all members of our
Scientific Steering Committee (SSC) for their invaluable support and feedback on this
study. We are grateful to discussants and participants at the following conferences and
seminars for their valuable feedback: Thirteenth Workshop on Costs and Assessment
in Psychiatry: Mental health policy and economics, Venice, Italy; International Health
27
Policy Conference, LSE, London; Supportive care, Early Diagnosis and Advanced
disease (SEDA) Research Group, Hull York Medical School (HYMS), Hull;
University of Toronto, Centre for Addiction and Mental Health (CAMH) and the
Canadian Centre for Health Economics (CCHE), Toronto, Canada.
Endnotes
1. We use a twelve-month window rather than the calendar or financial year.
2. We consider any patients with unrelated hospitalisation (e.g. a planned
admission for surgery) as having zero hazard of A&E presentation and SMI or
ACSC admission during the time they are hospitalised.
Figure 1 legend
Figure 1. Association of care quality indicators with each outcome.
CP: Care plan
AR: Annual review of physical health
28
REFERENCES
1. Murray CJ, Richards MA, Newton JN, et al. UK health performance: findings of the Global Burden of Disease Study 2010. The Lancet 2013;381(9871):997-1020.
2. Vigo D, Thornicroft G, Atun R. Estimating the true global burden of mental illness. The Lancet Psychiatry 2016;3(2):171-78.
3. Osborn DP, Levy G, Nazareth I, et al. Relative risk of cardiovascular and cancer mortality in people with severe mental illness from the United Kingdom's General Practice Research Database. Archives of General Psychiatry 2007;64(2):242-49.
4. Miller B, Paschall C, Svendsen D. Mortality and medical comorbidity among patients with SMI. Psychiatric Services 2006;57(10):1482-87.
5. Wahlbeck K, Westman J, Nordentoft M, et al. Outcomes of Nordic mental health systems: life expectancy of patients with mental disorders. The British Journal of Psychiatry 2011;199(6):453-58.
6. Mental Health Statistics team HaSCIC. HES-MHMDS Data Linkage Report, Additional analysis - 2011-12, England (Experimental statistics. Leeds: Health and Social Care Information Centre, 2013.
7. Hackman AL, Goldberg RW, Brown CH, et al. Use of emergency department services for somatic reasons by people with serious mental illness. Psychiatric services 2006;57(4):563-66.
8. Merrick EL, Perloff J, Tompkins CP. Emergency department utilization patterns for Medicare beneficiaries with serious mental disorders. Psychiatric services 2010;61(6):628-31.
9. Schoenbaum M, Sutherland JM, Chappel A, et al. Twelve-Month Health Care Use and Mortality in Commercially Insured Young People With Incident Psychosis in the United States. Schizophrenia Bulletin 2017;43(6):1262-72.
10. Lally J, Wong YL, Shetty H, et al. Acute hospital service utilization by inpatients in psychiatric hospitals. Gen Hosp Psychiat 2015;37(6):577-80.
11. Reilly S, Planner C, Hann M, et al. The role of primary care in service provision for people with severe mental illness in the United Kingdom. Plos One 2012;7(5):e36468.
12. World Health Organization. Quality improvement for mental health: mental health policy and service guidance package. Geneva: WHO, 2003.
13. World Health Organization. QualityRights tool kit to assess and improve quality and human rights in mental health and social care facilities. Geneva: WHO, 2012.
14. World Health Organisation. Paying for performance in health care: Implications for health system performance and accountability. In: Cashin C, Chi Y-L, Smith P, et al., eds. European Observatory on Health Systems and Policies. Maidenhead, UK: Open University Press, 2014.
15. Eijkenaar F, Emmert M, Scheppach M, et al. Effects of pay for performance in health care: a systematic review of systematic reviews. Health Policy 2013;110(2):115-30.
16. Flodgren G, Eccles MP, Shepperd S, et al. An overview of reviews evaluating the effectiveness of financial incentives in changing healthcare professional behaviours and patient outcomes. The Cochrane Library 2011.
17. Doran T, Maurer KA, Ryan AM. Impact of Provider Incentives on Quality and Value of Health Care. Annual Review of Public Health 2017;38:449-65.
18. Roland M. Linking physicians’ pay to the quality of care—a major experiment in the United Kingdom. New England Journal of Medicine 2004;351:1448-54.
19. National collaborating Centre for Mental Health. Psychosis and Schizophrenia in Adults: Treatment and Management. NICE Clinical Guideline 178, 2014.
29
20. National Collaborating Centre for Mental Health. Bipolar disorder: The assessment and management of bipolar disorder in adults, children and young people in primary and secondary care. Leicester UK: The British Psychological Society 2014.
21. Gutacker N, Mason AR, Kendrick T, et al. Does the quality and outcomes framework reduce psychiatric admissions in people with serious mental illness? A regression analysis. Bmj Open 2015;5(4):e007342.
22. Purdy S, Griffin T, Salisbury C, et al. Ambulatory care sensitive conditions: terminology and disease coding need to be more specific to aid policy makers and clinicians. Public Health 2009;123(2):169-73.
23. Wykes TL, Lee AA, McKibbin CL, et al. Self-Efficacy and Hemoglobin A1C Among Adults With Serious Mental Illness and Type 2 Diabetes: The Roles of Cognitive Functioning and Psychiatric Symptom Severity. Psychosomatic Medicine 2016;78(3):263-70.
24. Chen SR, Chien YP, Kang CM, et al. Comparing self‐efficacy and self‐care behaviours between outpatients with comorbid schizophrenia and type 2 diabetes and outpatients with only type 2 diabetes. Journal of Psychiatric and Mental Health Nursing 2014;21(5):414-22.
25. Herrett E, Gallagher AM, Bhaskaran K, et al. Data resource profile: clinical practice research datalink (CPRD). Int J Epidemiol 2015;44(3):827-36.
26. Booth N. What are the Read codes? Health Libraries Review 1994;11(3):177-82.27. World Health Organization, editor. The Tenth Revision of the International Classification
of Diseases and Related Health Problems (ICD-10). Geneva: World Health Organisation, 1992.
28. Bardsley M, Blunt I, Davies S, et al. Is secondary preventive care improving? Observational study of 10-year trends in emergency admissions for conditions amenable to ambulatory care. BMJ Open 2013;3(1):e002007.
29. Chang KC-M, Soljak M, Lee JT, et al. Coverage of a national cardiovascular risk assessment and management programme (NHS Health Check): Retrospective database study. Preventive Medicine 2015;78:1-8.
30. McLennan D, Barnes H, Noble M, et al. The English indices of deprivation 2010. London: Department for Communities and Local Government 2011.
31. Khan NF, Perera R, Harper S, et al. Adaptation and validation of the Charlson Index for Read/OXMIS coded databases. Bmc Fam Pract 2010;11(1):1.
32. Cox DR. Regression Models and Life-Tables. Journal of the Royal Statistical Society Series B (Methodological) 1972;34(2):187-220.
33. Yen C-F, Yeh M-L, Chen C-S, et al. Predictive value of insight for suicide, violence, hospitalization, and social adjustment for outpatients with schizophrenia: a prospective study. Comprehensive psychiatry 2002;43(6):443-47.
34. Yen C-F, Chen C-S, Yen J-Y, et al. The predictive effect of insight on adverse clinical outcomes in bipolar I disorder: A two-year prospective study. Journal of Affective Disorders 2008;108(1):121-27.
35. Baker R, Bankart MJ, Rashid A, et al. Characteristics of general practices associated with emergency-department attendance rates: a cross-sectional study. BMJ Quality & Safety 2011;20(11):953-58.
36. Wong CY, Hall J. Does patients’ experience of general practice affect the use of emergency departments? Evidence from Australia. Health Policy 2018;122(2):126-33.
37. Xin H, Kilgore ML, Sen B, et al. Can Nonurgent Emergency Department Care Costs be Reduced? Empirical Evidence from a U.S. Nationally Representative Sample. The Journal of Emergency Medicine 2015;49(3):347-54.
30
38. Harrison MJ, Dusheiko M, Sutton M, et al. Effect of a national primary care pay for performance scheme on emergency hospital admissions for ambulatory care sensitive conditions: controlled longitudinal study. Bmj 2014;349:g6423.
39. Wilson CL, Rhodes KM, Payne RA. Financial incentives improve recognition but not treatment of cardiovascular risk factors in severe mental illness. PLOS ONE 2017;12(6):e0179392.
40. Berchet C. Emergency Care Services. 2015.41. Broadbent M, Jarman H, Berk M. Emergency department mental health triage scales
improve outcomes. Journal of Evaluation in Clinical Practice 2004;10(1):57-62.42. Eric P. Slade PD, Lisa B. Dixon MD, M.P.H. ,, Sarah Semmel BA. Trends in the Duration of
Emergency Department Visits, 2001–2006. Psychiatric Services 2010;61(9):878-84.
31