Embed Size (px)
Citation preview
Abstract We investigate the effect of union membership on job satisfaction. Whilst it is common to study the effects of union status on satisfaction treating individual membership as given, in this paper, we account for the endogenous selection induced by the sorting of workers into unionised jobs. Using linked employer-employee data from the 1998 British Workplace Employee Relations Survey, we address the question of how the membership decision is related to overall job satisfaction and to satisfaction with pay. Once the endogeneity of membership is accounted for, the marked difference in job satisfaction between unionised and non-unionised workers characterising raw data disappears, indicating that a selection effect, rather than a causal effect, explains the relationship. JEL classification: J28, J51 Keywords: Job satisfaction, Trade unions, Linked employer-employee data This paper is produced under the ‘Future of Trade Unions in Modern Britain’ Programme supported by the Leverhulme Trust. The Centre for Economic Performance acknowledges with thanks, the generosity of the Trust. For more information concerning this Programme please e-mail [email protected] Acknowledgements We are grateful to Alison Booth, Mark Bryan, Francis Green, Hans Heijke, Mark Stewart and seminar participants at the EALE conference 2002, the Università Cattolica, Università del Piemonte Orientale, London School of Economics and the Policy Studies Institute for useful comments. Alex Bryson would like to thank the Leverhulme Foundation (‘The Future of Trade Unions in Modern Britain’) and the Regent Street Polytechnic Trust for funding his contribution to this paper. Lorenzo Cappellari and Claudio Lucifora gratefully acknowledge financial support from MIUR (grant no. 2001135444). Claudio Lucifora has benefitted by support within the PiEP-Project financed by the EU under the V Framework Project. Correspondence A. Bryson: Policy Studies Institute, 100 Park Village East, London NW1 3SR, United Kingdom. Email: [email protected] L. Cappellari: Dipartimento di Scienze Economiche e Metodi Quantitativi, Università del Piemonte Orientale, Via Perrone 18, 28100 Novara, Italy. Email: [email protected] C. Lucifora: Università Cattolica, Largo Gemelli 1, 20123, Milano, Italy. Email: [email protected] Published by Centre for Economic Performance London School of Economics and Political Science Houghton Street London WC2A 2AE A. Bryson, L. Cappellari and C. Lucifora, submitted March 2003 ISBN 0 7530 1628 1 Individual copy price: £5
Does Union Membership Really
Reduce Job Satisfaction?
Alex Bryson, Lorenzo Cappellari and Claudio Lucifora
May 2003
1. Introduction 1
2. The Economics of Job Satisfaction and Union Membership 2
3. Patterns of Unionisation and Job Satisfaction 5
3.1 The data 5
3.2 Union membership and job satisfaction: a descriptive analysis 6
4. The Effect of Membership on Satisfaction 9
5. Conclusions 12
Tables 14
Appendix 17
References 27
The Centre for Economic Performance is financed by the Economic and Social Research Council
1
1. Introduction
Job satisfaction and satisfaction with pay are often used by economists to explain a number of
labour market stylised facts such as job shopping, job tenure and quit behaviour, as well as
unionisation and strike activity. Satisfaction, as an economic variable, plays a central role in
labour market theories and in our ability to explain workers’ behaviour. Job matching and
search theories, focussing on ‘entry/exit’ behaviour and successful employer-employee
match, suggest that mobility decisions depend on the comparison of the net benefits with the
current employer vis-à-vis alternative opportunities. As such dissatisfaction with the current
job may imply a move to a new job (Jovanovic, 1979; Burdett and Mortensen, 1998).
Dissatisfaction with the job, conditional on the wage, may also determine non co-operative
behaviour, shirking and more generally lower levels of effort (Akerlof and Yellen, 1986;
Weiss, 1980; Khaneman et al., 1986). Alternatively, dissatisfied workers, by internalising
the individual cost of separations, may decide to form or join a union, using collective ‘voice’
to convey grievances to the employer in order to improve upon job and pay conditions. In
this case, dissatisfaction favours unionisation and collective action (Freeman, 1978; Freeman
and Medoff, 1984).
The empirical literature concerning the determinants and the economic effects of
satisfaction on labour market outcomes is expanding, but the lack of appropriate statistical
information and some scepticism among economists as to the use of satisfaction data still
limit empirical knowledge on satisfaction. In this paper, we use detailed information on
individual self-reported satisfaction, job attributes and establishment characteristics to
investigate the relationship between job satisfaction and union membership.
Whilst it is common to study the effects of union status on satisfaction treating
individual membership as given, we account for the endogenous selection induced by the
sorting of workers into unionised jobs. In particular we address the question of how the
membership decision is related to overall job satisfaction and to satisfaction with pay. We
use linked employer-employee data from the 1998 Workplace Employee Relations Survey
(WERS). We argue that most previous studies on this topic, due to either data deficiencies or
estimation problems, suffer from severe limitations that are dealt with in the present paper.
The contribution of this paper to the literature is twofold. First, the rich data combines
employer and employee characteristics, providing the ideal set of information (and
instruments) to investigate the effects of union membership on job satisfaction. Second, the

2
endogeneity of unionisation decisions is explicitly modelled and jointly estimated with
overall job satisfaction and satisfaction with pay. This reveals the bias arising in assuming
membership to be given. This allows us to shed light on a puzzling finding often reported in
the literature, namely that unionised workers are less satisfied than non-unionised ones. Our
findings indicate that once the endogeneity of membership is accounted for dissatisfaction
disappears. Furthermore, analyses of pay satisfaction suggest unions are successful in
providing a wage differentials forto their members.
The paper is organised in the following way. Section Two reviews the relevant
literature. Section Three describes the data and presents some stylised facts. In Section Four
we discuss the main features of the empirical methods used. Section Five discusses the
results and concludes.
2. The Economics of Job Satisfaction and Union Membership
The analysis of reported subjective satisfaction has been the object of a long standing debate
among economists. Besides the standard caveat of cross-individual comparability, inference
is further complicated by the fact that researchers generally do not know the set of
information and the characteristics (both personal and of the work environment) that are
taken into account when reporting the level of satisfaction (Clark and Oswald, 1996 and
1998). We acknowledge the existence of some of these caveats, still we believe that useful
information can be retrieved and a better understanding of the behaviour of agents can be
gained by analysing individual subjective satisfaction.
Union objectives may be broadly characterised as an attempt to improve workers’
welfare and satisfaction through improvements in the working environment and wages. Yet
a number of papers have come to the puzzling conclusion that union members are generally
less satisfied as compared to non-unionised workers (Hammermesh, 1977; Kochan and
Helfman, 1981). One line of argument has emphasised the role of individuals’ unobserved
heterogeneity by suggesting that those who experience lower satisfaction are more likely to
join the union and be involved in union activities. In other words, being a union member per
se (once self-sorting of workers has been considered) should bear no relation to job
satisfaction. A similar view considers workplace heterogeneity and argues that union
workers are generally more dissatisfied, since where discontent is high unions are more likely
3
to set up a formal organisation – i.e. net benefits of unionisation are higher. In both cases, a
non-random allocation of workers across union and non-union jobs may give rise to reverse
causation problems and the need to control for observed and unobserved differences across
individuals, jobs and workplaces. Although the above arguments are not new in the
literature, most previous studies suffer from data limitations (restricted controls, and
unrepresentative or small samples) or an inappropriate methodology – which means they
have not succeeded in dealing adequately with the issues. Bender and Sloane (1998) is a first
attempt to deal with the selectivity issue by correcting the satisfaction equations for
unobserved heterogeneity. They also stress a point, originally made by Gordon and Denisi
(1995), that confusion can arise if one does not distinguish between job satisfaction and
satisfaction with the union and management. However, by forcing membership status to be
equivalent to coverage status – i.e. dropping uncovered members and covered non-members –
they are unable to distinguish union membership effects from workplace unionisation and
other workplace characteristics affecting satisfaction. Miller (1990), in a study which is
closest in spirit to our research, reports that after instrumenting for union status in the
satisfaction equation, the negative dissatisfaction effect disappears suggesting a selection
process working through a higher union presence into workplaces with poor working
conditions (and low satisfaction levels).
It is clear, then, that the relative dissatisfaction of union members may originate in the
poor working conditions or poor management that are conducive to unionisation. Isolating
any causal impact of membership on job satisfaction therefore involves controlling for
workplace characteristics and satisfaction with management. But it is important not to lose
sight of the fact that union membership may indeed have a causal impact on job
dissatisfaction. This effect can occur when unions provide workers with the opportunity to
express their discontent and grievances to the management through collective ‘voice’, thus
increasing (reported) dissatisfaction (Freeman and Medoff, 1984). Although often
overlooked in the literature, the ‘voice’ mechanism attributes to union membership a causal
effect in reporting dissatisfaction. Leigh (1986) analyses job satisfaction and the desire for
unionisation. Consistent with the union voice hypothesis, he finds dissatisfied and
moderately satisfied union members have approximately the same probability of desiring
union representation as do very satisfied union workers; conversely among non-union
members, worker desire for unionisation rises with job dissatisfaction, suggesting
4
dissatisfaction may result in membership.1 Leigh also finds desire for unionisation rises with
higher pay among members, but falls with higher pay among non-members, suggesting
dissatisfaction with pay may be particularly important in encouraging non-members to join a
union. Other studies indicate that union- inspired egalitarian policies designed to reduce wage
dispersion may create discontent (Borjas, 1979; Hersch and Stone, 1990). In this context,
given the importance of union bargaining over wage levels and workplace pay policies, any
analysis of job satisfaction should focus particular attention on satisfaction with wages.2
Studies assessing the causal effect of union membership on job satisfaction have been
criticised for failing to control for important differences between the work environments of
union members and non-members. This led to studies based on samples of members and
non-members drawn from the same working environment (e.g. Gordon and Denisi, 1995). It
is arguable that the presence of a union recognised for bargaining purposes may influence
employees’ job satisfaction through the union’s ability to enhance employees’ terms and
conditions. The strength of the union may also be pertinent: as Borjas (1979: 24) suggests,
only the strongest unions will be able to resist employer efforts to compensate for a union
wage premium with a corresponding decrease in non-pecuniary job rewards. If this is so, one
might expect job satisfaction to be highest where union strength maintains what Borjas
(1979: 22-25) refers to as the ‘full wage’, comprising both the money wage rate and non-
pecuniary job components. Since the presence and strength of a recognised union is also
likely to influence employees’ decisions to join a union – for instrumentalist or ‘bandwagon’
reasons (Bryson and Gomez, 2002) – we include union recognition and union density in our
estimation.
This brief review indicates that we should model union membership and satisfaction as
a joint process using information on personal, job and workplace characteristics. If joining
the union is what prompts workers to express discontent through collective ‘voice’,
unionisation and workers’ (dis)satisfaction will not be independent. We view the reported
satisfaction of individual i as ),|*( iiii MXSES = , where Si* is the latent degree of
satisfaction for individual i, iX is a vector of observable attributes that can be both person or
workplace-specific, and Mi is an indicator of membership status. Conditionally on iX , union
membership has an independent effect which needs to be adequately modelled. In contrast to
1 On the desire of union representation see also: Farber, 2001; Bryson and Gomez, 2002; Bryson, 2003. 2 Another reason to analyse satisfaction with pay separately from overall satisfaction is that it might be easier to report satisfaction with respect to pecuniary aspects of the job rather than with non-pecuniary aspects.

5
much of the previous literature, union membership is not just considered as a job attribute but
as a specific choice of the individual which can give rise to strategic behaviour.
3. Patterns of Unionisation and Job Satisfaction
3.1 The data
In this section we provide a detailed description of the information used in the empirical
analysis. The data set is the linked employer-employee British Workplace Employee
Relations Survey 1998 (WERS). With appropriate weighting, it is nationally representative
of British employees working in workplaces with 10 or more employees covering all sectors
of the economy except agriculture (Airey et al, 1999). The survey covers a wide range of
issues, allowing for the inclusion of a large set of individual- level and workplace-level
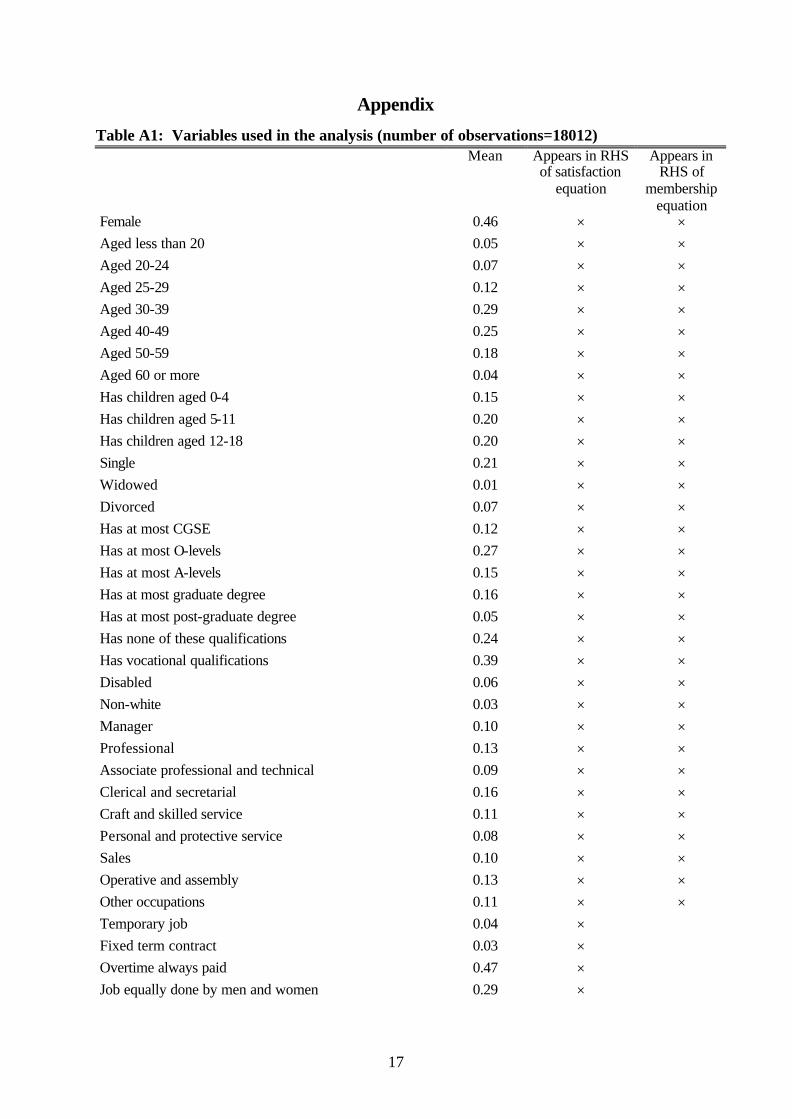
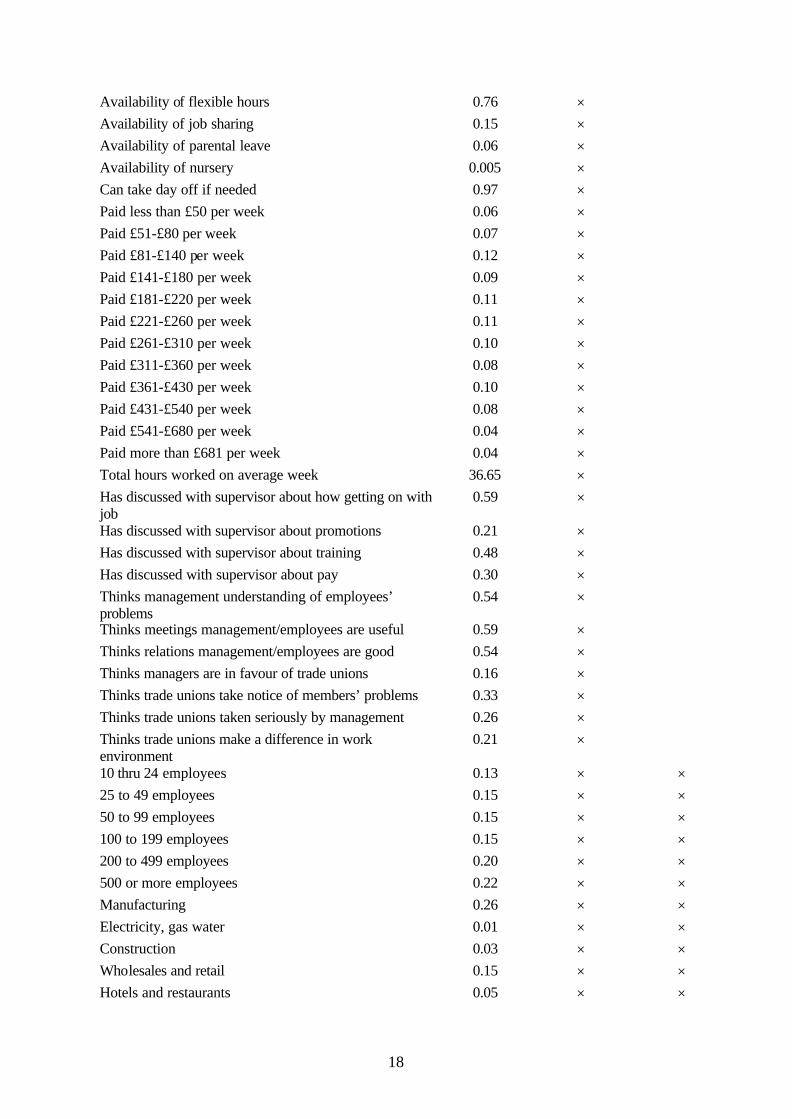
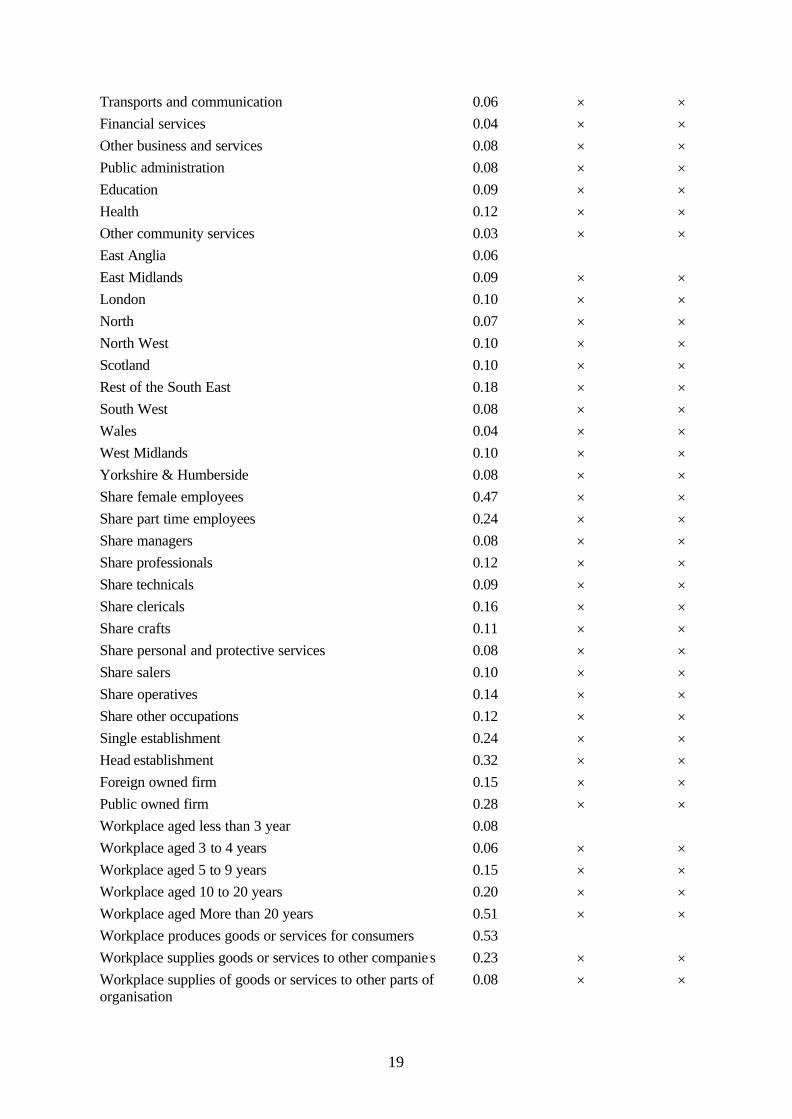
controls as well as detailed information on workers’ job satisfaction. A complete list of the
variables used in the analysis and their means is contained in Appendix Table A1.
We use two elements of the survey. The first is the management interview, conducted
face-to-face with the most senior workplace manager responsible for employee relations.
Interviews were conducted in 2,191 workplaces between October 1997 and June 1999, with a
response rate of 80%. The second element is the survey of employees where a management
interview was obtained. Self-completion questionnaires were distributed to a simple random
sample of 25 employees (or all employees in workplaces with 10-24 employees) in the 1,880
cases where management permitted it. Of the 44,283 questionnaires distributed, 28,237
(64%) usable ones were returned.
The sample of workplaces is a stratified random sample with over-representation of
larger workplaces and some industries (Airey et al., 1999). Employees’ probability of
selection for the survey is a product of the probability of their workplace being selected and
the probability of the employee’s own selection. To extrapolate from our analyses to the
population from which the employees were drawn (namely employees in Britain in
workplaces with 10 or more employees) we weight the analysis using the employee weights.3
Our estimating sub-sample is all employees with complete information on the variables used
in the analysis, namely 18,012.
6
The survey asked each employee to provide a rating, on a five-point scale from ‘very
satisfied’ to ‘very dissatisfied’, concerning how satisfied they were on four aspects of their
job: (i) the amount of influence they had over their job; (ii) the pay they received; (iii) the
sense of achievement they got from their work; and (iv) the respect they got from supervisors
and line managers. Since no overall satisfaction indicator of the types usually analysed in the
literature is available in the data, we derived a variable summarising individual perceptions
about the four job facets in the following way. For each of the four facets we built a dummy
variable equal to 1 if the individual was either ‘very satisfied’ or ‘satisfied’ and 0 otherwise.
Our overall satisfaction indicator is the sum of the four dummies thus obtained and represents
the number of times an individual rated herself as being either ‘very satisfied’ or ‘satisfied’.
Similarly to each of the specific indicators it can assume values on a 5 point scale, from 0 to
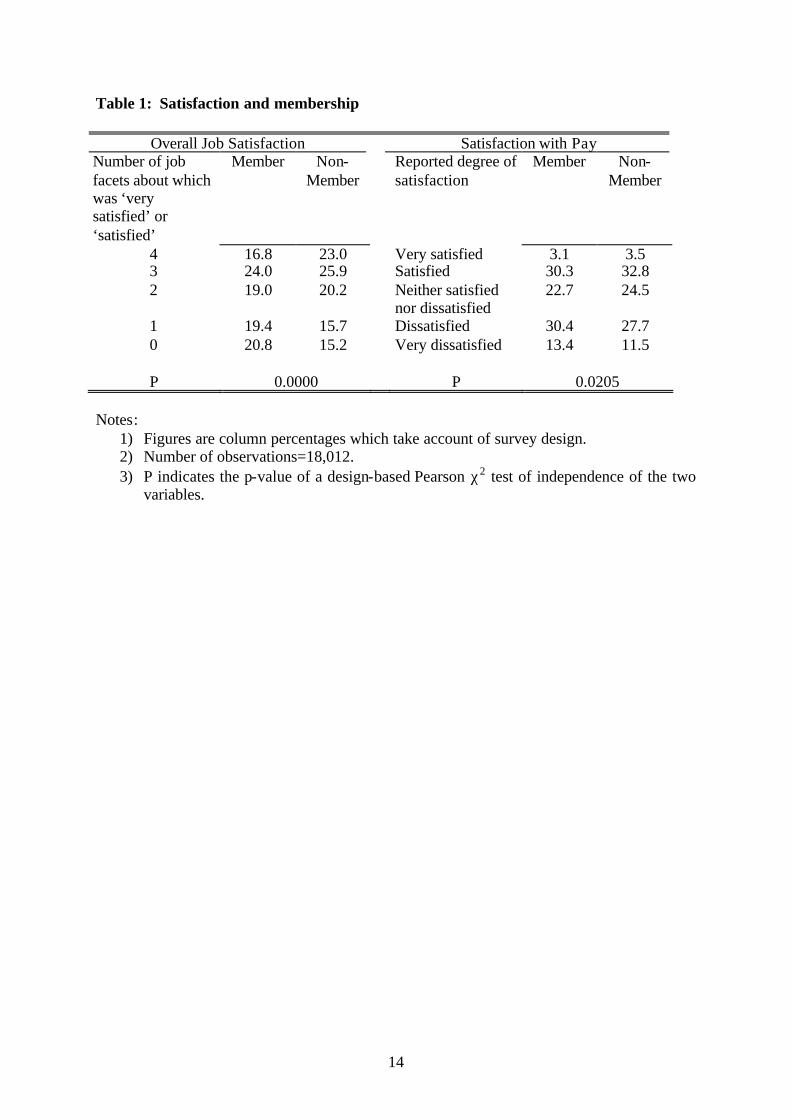
4. Table 1 cross-tabulates overall- job-satisfaction (OJS henceforth) and satisfaction-with-pay
(SWP henceforth) against individual membership status and shows that members tend to
report lower satisfaction levels relative to non-members on both indicators. The null
hypothesis of independence of the two variables is overwhelmingly rejected in the case of
OJS. For SWP, the hypothesis can be rejected at the 5% level, indicating that the differential
dissatisfaction of members is less evident when pay, rather than other job facets, is analysed.
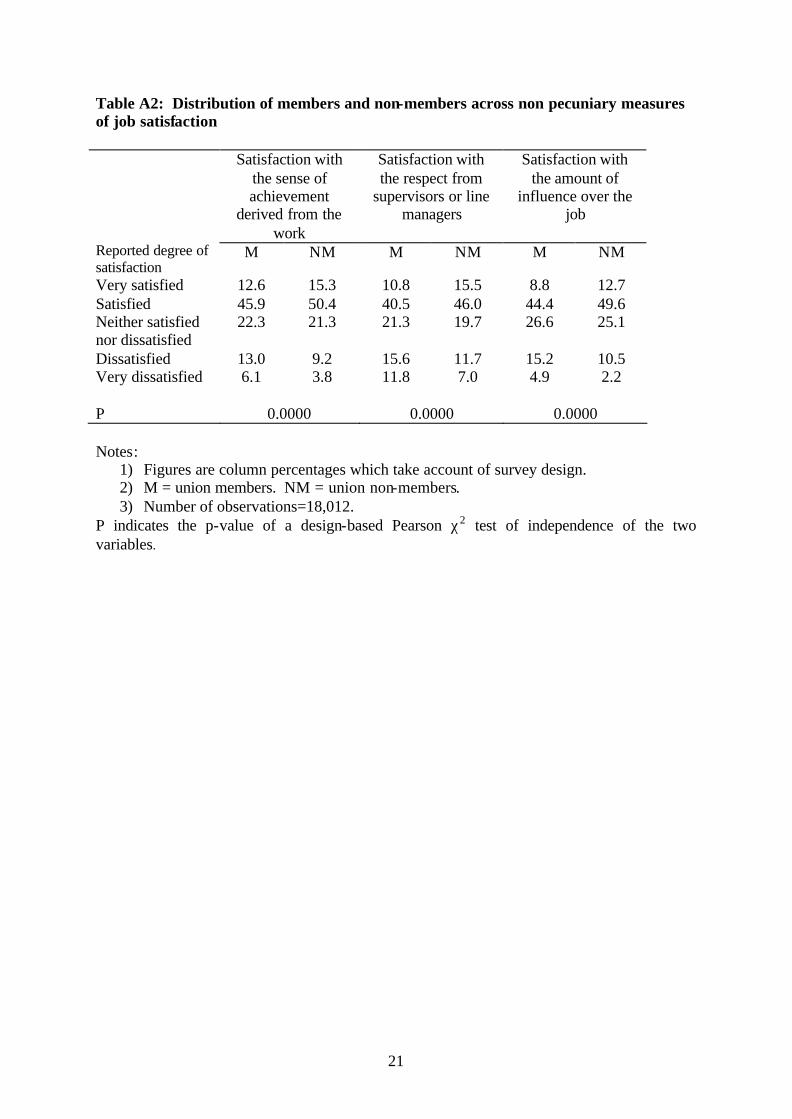
The distributions of satisfaction with non-pecuniary job aspects by membership status are
given in Appendix Table A2. The table shows that, as for OJS, the independence hypothesis
is strongly rejected by the data. Since the similarities between OJS and the non-pecuniary
indicators of job satisfaction in their relationship with membership status are confirmed by
some preliminary regression analyses, to save space we focus on OJS and SWP in the rest of
the paper.4
3.2. Union membership and job satisfaction: a descriptive analysis
To explore the relationship between membership and satisfaction in WERS, we estimate a set
of job satisfaction regressions that include a union member dummy on the right hand side.
Due to the endogeneity issues that potentially plague this type of exercise, it is important at
this stage not to infer any causal interpretation from the estimated coefficients.
3 The weighting scheme used in this paper compensates for sample non-response bias which was detected in the employee survey (Airey et al., 1999: pp. 91-92). 4 Given that the distribution of workers across satisfaction levels is not symmetric, we also experimented with an alternative measure of overall job dissatisfaction where the indicator is computed by summing the
7
We assume that the satisfaction propensity of individual i (i=1,…,N) is summarised by
a continuous latent variable Si* which is a linear function of personal, job and workplace
attributes represented by the column vector Xi, a dummy variable Mi taking value 1 if the
individual is a union member and 0 otherwise and an error term ε i distributed as standard
normal:
Si*=Xi’β+δMi+ε i (1)
where β is a vector of coefficients associated with personal attributes and δ is the scalar
coefficient associated with membership. The set of controls included in Xi refers to personal
background, occupational and job characteristics, personal opinions on the climate of
industrial relations and the trade union, gross weekly earnings, average weekly hours worked
and workplace controls. S*i is not observed; rather, in the WERS questionnaire we observe
Si, its discrete realisation which can assume a set of ordered values depending on S*i crossing
the latent cut-off points τ1..τ4. Coefficients in (1) can be estimated using an ordered probit
model. 5
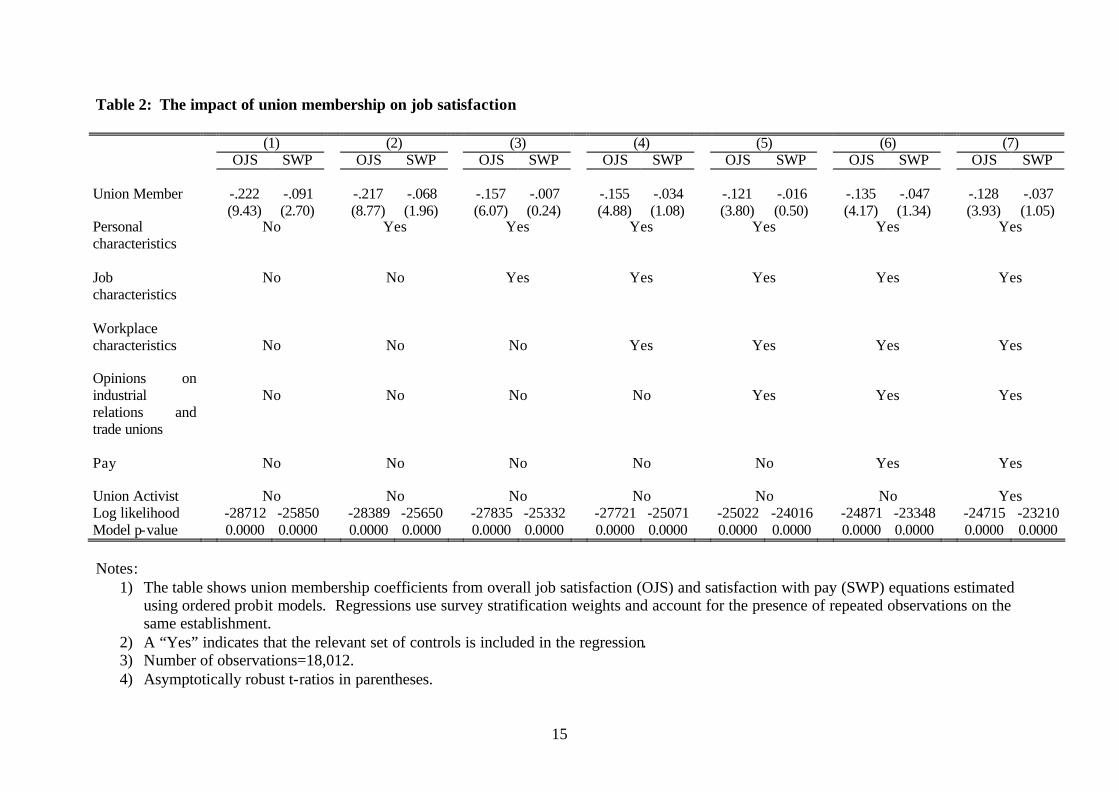
Results are reported in Table 2. We first include only Mi among regressors and then
progressively add personal, job and workplace characteristics. By doing so, we can control
how the estimated membership coefficient varies as the set of controls widens : changes in
the membership coefficient would signal that membership is correlated with the observable
attributes suggesting that membership is not random and might also be correlated with
personal attributes not observed in the data, causing endogeneity.
As can be seen from the first column, union members report satisfaction levels that are
significantly lower than non-members. The gap is wider for OJS than it is for SWP,
indicating that members see themselves better off when it comes to pay compared to the
overall aspects of their job. In column (2) we include a set of controls for personal
characteristics, namely gender, age, education, marital status, parental status, health status
and ethnicity. Although these controls have a significant impact on job and pay satisfaction,
their introduction does not affect the estimated membership coefficient in the OJS equation,
indicating that the negative estimate in column (1) is not the result of differences in observed
‘dissatisfied’ and ‘very dissatisfied’ categories on each of the four job aspects. Since the results mirror closely those obtained with the satisfaction indicator, we only report empirical evidence on satisfaction.
8
personal characteristics between members and non- members.6 The gap on pay satisfaction,
however, does narrow quite markedly, though it remains statistically significant. Estimates in
column (3) also control for occupational and job characteristics. The membership coefficient
in the OJS equation drops, indicating that members tend to be concentrated in occupations
and jobs where satisfaction is lower. As suggested by the literature reviewed in Section 2,
lower job satisfaction among union members relative to non-members may also reflect
unobserved heterogeneity at the firm or workplace level if unionisation is more likely to
occur in places where working conditions are poor. Column (4) exploits the employer
dimension of WERS and adds a set of controls for workplace characteristics, establishment
characteristics (such as age, activity undertaken, ownership), gender and occupational
composition of the workforce, union coverage and density as well as industry, size, region
and local labour market conditions. Controlling for these factors does not seem to alter the
conclusions reached so far, indicating that workplace heterogeneity – once conditioning on
personal and occupational characteristics - does not affect substantially union members’
satisfaction. Column (5) includes additional controls for individual perceptions of industrial
relations climate and opinions on the trade union and management, which might help in
separating job satisfaction from satisfaction towards unions and management (see Bender and
Sloane, 1998). These variables further reduce the size of the membership coefficient in the
OJS equation, nevertheless the reduction is small and the member-non-member satisfaction
differential still remains significant. As far as pay satisfaction is concerned the membership
coefficient is small and statistically non-significant. Column (6) adds pay and hours worked
to the controls.7 Their effect is to increase the dissatisfaction of members with both the
aspects cons idered; in particular, the coefficient related to pay satisfaction is now weakly
statistically significant (at the 20% level). This evidence suggests that higher wages of
members partly compensate for their working conditions and lower dissatisfaction, so that
once the effect of pay on satisfaction has been controlled for the estimated membership
coefficients gains size and significance.8
5 We account for differential sampling probability across establishment using sampling weights, whereas we control for the presence of multiple observations within the same establishment using robust variance estimator. Overall, our estimators are Pseudo Weighted Maximum Likelihood. 6 Tables with coefficients estimated on all the controls used are not reported here, for lack of space, but can be obtained upon request from the authors. 7 ‘Wages’ are the 12 banded categories for gross weekly pay. ‘Hours’ is a continuous variable recording total weekly hours worked. 8 There is evidence from other WERS analyses that membership confers a wage premium (Bryson, 2002).
9
Besides providing estimates of the association between membership and satisfaction,
evidence in Table 2 shows that the estimated membership coefficient varies considerably
with the set of observable characteristics included in the analysis, indicating that membership
might not be randomly distributed across the features defined by the available controls.
Before moving onto a direct test of the hypothesis of membership exogeneity in the next
section, we conclude this section by exploring the possibility that the negative membership
coefficient reflects some ‘voice’ effect, in which case it could be interpreted – at least in part
– as a causal effect of membership. In particular we focus on a variable which should capture
a ‘louder’ use of voice by members when answering job satisfaction questions, namely an
activist member dummy, which takes the value one if the member takes active part in trade
union activity (defined here as either being a union representative or having frequent contact
with a worker representative) and zero otherwise. If members voice out their discontent, then
we might expect active members to do it louder, since they are more directly involved in
union activities than ordinary members.9 Thus, if the coefficient on the membership dummy
reflects a ‘voice’ effect, we should expect it to lose size and significance once the activist
dummy has been added to the regression. Table 2, column (7), shows that the inclusion of
the activist variable in the regression hardly affects the size and significance of the
membership coefficients obtained otherwise, suggesting that the negative association between
membership and satisfaction does not stem from ‘voice effects’.
4. The Effect of Membership on Satisfaction
The analysis carried out so far in this paper suggests that the negative association between job
satisfaction and membership might be induced by unobserved factors which co-determine the
decision to join the union and the reported satisfaction. In this section we provide a direct
test of the membership exogeneity hypothesis.
To do this, we estimate the effect of union membership on job satisfaction while
simultaneously modelling union membership status using instrumental variables. In this way
we are able to control for the presence of unobserved correlation between union membership
and job satisfaction, thus eliminating the bias induced by unobserved heterogeneity and
9 Cappellari et al (2002) find for Italy that union activists report lower satisfaction with organisational changes relative to ordinary members, and that such differences can be attributed to a ‘voice effect’.
10
delivering the causal impact of union membership on job satisfaction. We augment equation
(1) with a probit equation for the probability of being a union member:
M*i=Zi’γ+Wi’θ+ui (2)
where M*i is a continuous latent propensity underlying the dummy Mi, Zi is a vector of
observables, Wi is a vector of variables that have no effect on satisfaction after union
membership has been controlled for, γ and θ are vectors of coefficients associated with
personal attributes and ui is an error term distributed as standard normal. We model the link
between ui and ε i by allowing them to be distributed as bivariate normal with unrestricted
correlation ρ≡corr(ε i ui). By simultaneously estimating equations (1) and (2) we are able to
separately identify the correlation between unobservables – the coefficient ρ – and thus to
remove the bias induced by unobserved heterogeneity from the coefficient δ in (1).
The set of attributes in Zi is a subset of those in Xi. In particular, some job attributes
have been excluded since they might form the bargaining object and be distributed across
workers according to their membership status.10 Our choice of variables is informed by
previous empirical work on satisfaction, discussed earlier, and the theory and empirical
evidence on the worker choice and queuing models of selection into union membership
(Farber, 2001; Bryson and Gomez, 2002). Variables entering the model are demographics
(age, gender, marital status, health, qualifications), job-related (occupation, gender
segregation), workplace (size, industry, the activity conducted at the workplace –
administrative, head office, producer or distributor of goods or services - ownership,
location) and local labour market conditions. In the light of the literature on union
membership wage differentials, hourly gross earnings do not enter Zi. Individual opinions on
the climate of industrial relations and the trade union do not appear in Zi, as they might be
determined by membership status.
The ‘instruments’ in Wi are given by a set of indicators of managerial opinions on the
climate of industrial relations; see the four last rows of Appendix Table A1 for their
description. The identifying assumption is that after the employee’s membership status and
opinions on industrial relations climate have been controlled for in the satisfaction equation,
managerial opinions have no additional effect on individual satisfaction. On the other hand,
10 Variables such as ethnicity, nature of contract, age of establishment, foreign ownership were excluded from the model because they were not statistically significant in membership and/or satisfaction equations.
11
they are the sole exogenous indicator of industrial relations climate in the membership
equation, since individual opinions are likely to be shifted by the membership status. Our
identifying strategy takes advantage of the availability of linked employer-employee data:
we observe the climate of industrial relations from two different perspective – the worker’s
and the manager’s ones – and we claim that the latter has no effect on individual satisfaction
after the former (together with membership) has been controlled for. Since our model is not
over- identified, we test the validity of our claims using functional form as an identifying
restriction.
Although our linked employer-employee data provide much of the requisite
information, it is arguable that we are missing some data. For example, we have no data on
motivation, which may be positively correlated with membership and satisfaction, potentially
biasing the membership coefficient upwards.
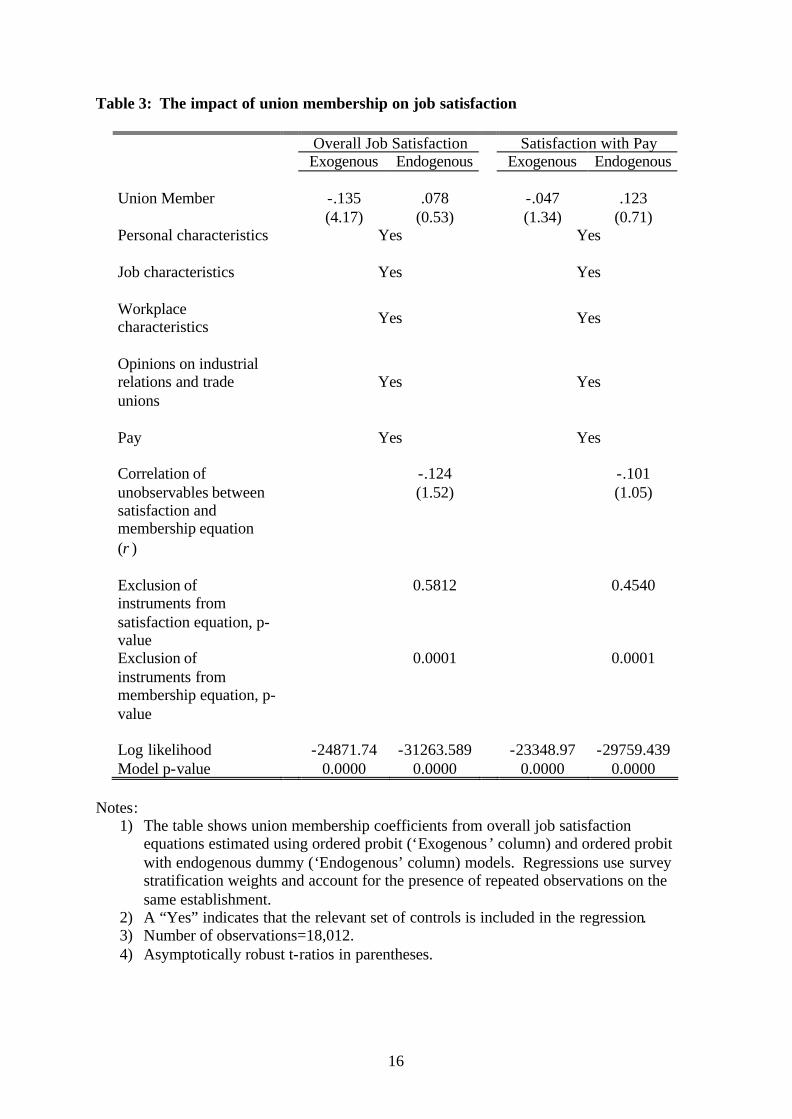
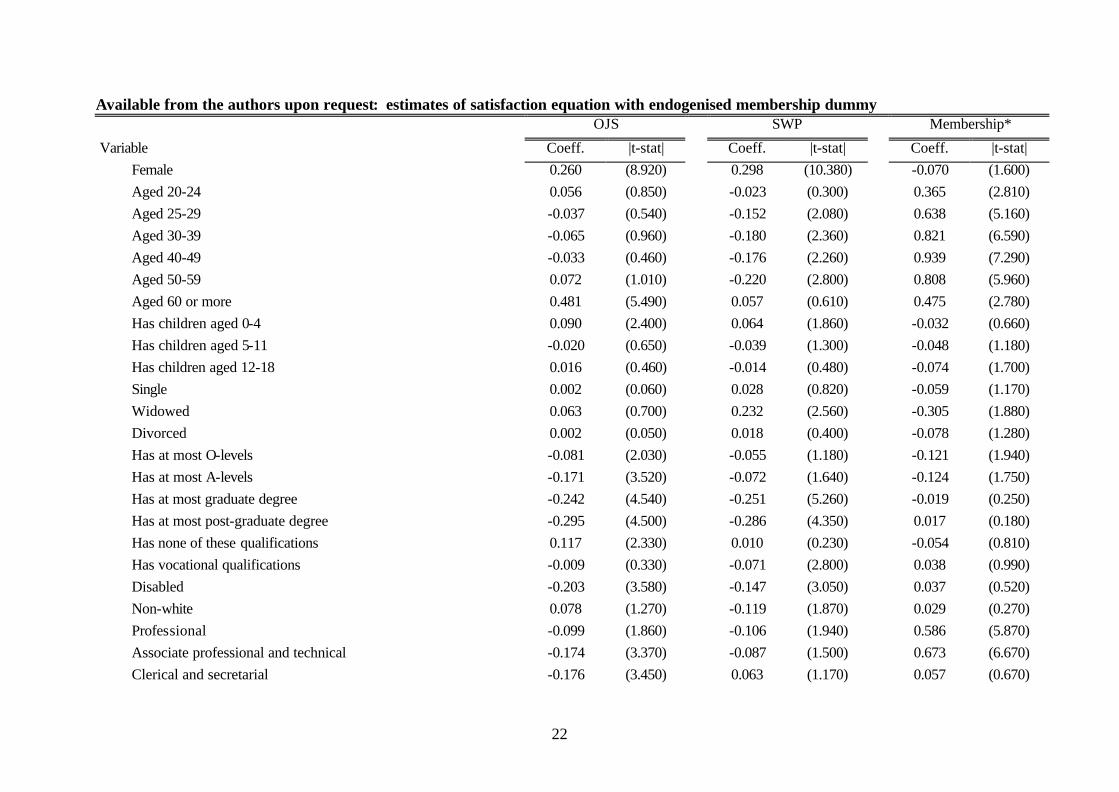
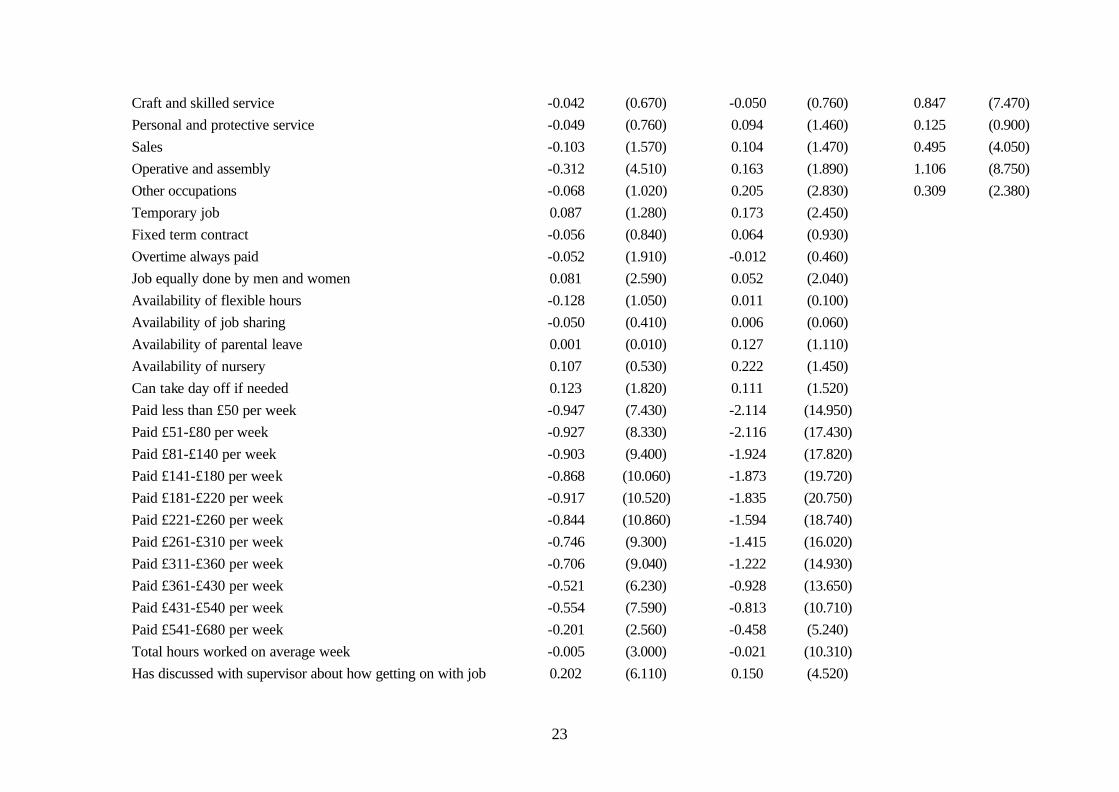
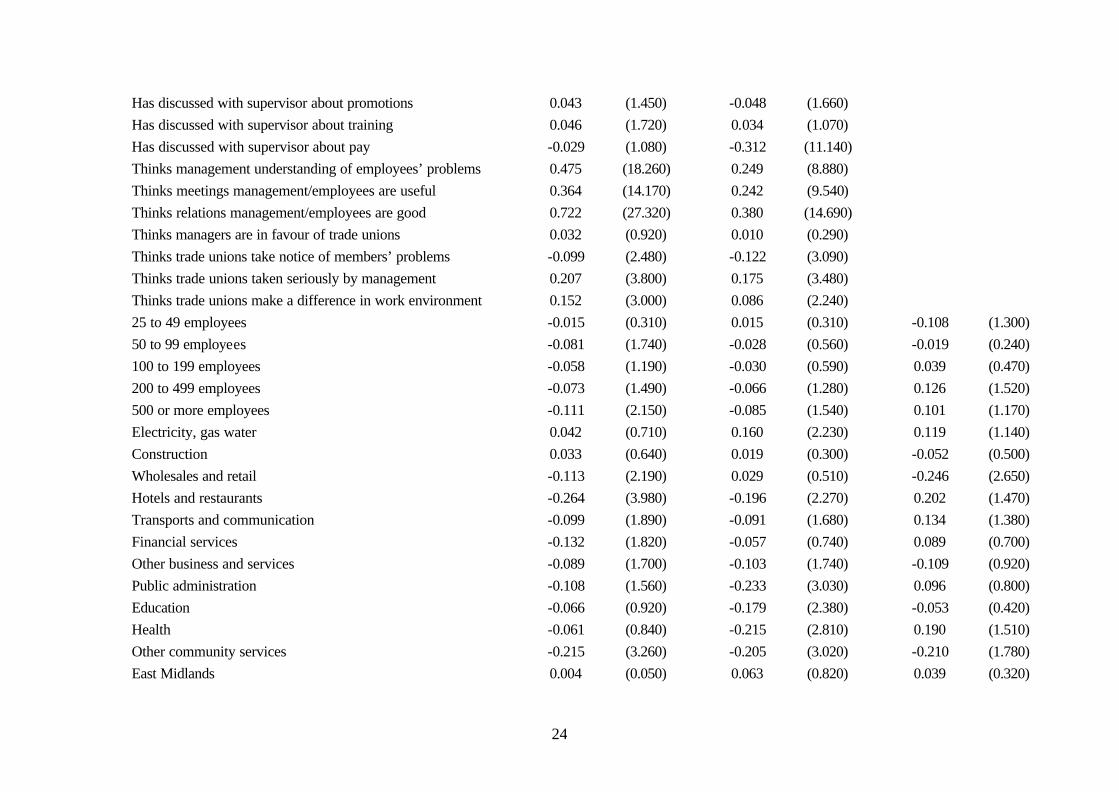
We report estimates of the endogenised membership coefficients in Table 3 and, to
facilitate comparisons, we also report coefficients from analogous models in which the union
dummy is treated as exogenous – i.e. the coefficients from column (6) in Table 2. Before
considering the main results, note that the tests for instrument validity reported at the bottom
of the table are in favour of the use of managerial opinions on industrial relations climate as
instruments for union status in satisfaction equations. In fact, these variables are not
significant in the job satisfaction equations, whereas they significantly affect membership
probabilities. Thence, the data support our proposed instruments.
The estimated coefficient on union membership from the OJS column reveals that, after
endogenisation of the membership status, union membership has no residual effect on
satisfaction, as is signalled by a t-ratio of 0.53. On the other hand, the negative relationship
between membership and job satisfaction is now absorbed by the correlation coefficient ρ
which is negative and similar in size to the estimated coefficient on the union dummy in the
exogenous model, while it is statistically significant at the 15% level. These results reveal
quite clearly that the negative estimate obtained from models treating membership as
exogenous is purely the effect of unobserved heterogeneity. The pool of union members is
composed of individuals who have a satisfaction propensity lower than that in the population
– as indicated by the negative ρ – and once this compositional effect has been taken into
account no causal effect of membership on satisfaction can be found in the data. From an
economic perspective, our results suggest that the same factors that lead individuals to
unionise make them feel unsatisfied with their job, as could be the case if individuals with
12
higher expectations and aspirations from their working life are more likely to both unionise
and see their aspirations frustrated once in the job.
Evidence about SWP tells a story which is pretty similar to the one that emerges from
the overall satisfaction indicator. The coefficient on the union dummy loses significance
after endogenisation, while its negative sign is absorbed by the correlation coefficient. The
statistical significance of the correla tion coefficient is lower compared to the right column of
the table, suggesting that endogeneity is less relevant in this case. This fact is in line with the
estimate from the model with exogenous unionism, where the estimated membership
coefficient from the SWP equation was smaller in size and significance compared to the one
from the OJS equation. This finding confirms the importance of treating overall satisfaction
and satisfaction with pay separately, since the higher wages granted by the union to the ir
members seems to offset their larger intrinsic dissatisfaction generated by higher
expectations.
5. Conclusions
Our results are consistent with previous studies in showing union members to be less satisfied
with their jobs and pay than non-members. The association between union membership and
overall job satisfaction remained statistically significant controlling for a range of personal,
job, workplace and attitudinal variables. However, members’ dissatisfaction with pay is not
significant once personal and job characteristics are accounted for, suggesting that members
are less dissatisfied with pay than with non-pecuniary aspects of their jobs. Members’
relative dissatisfaction with pay strengthens once we condition on their pay indicating that
unions achieve a wage premium for their members which partly offsets their greater
propensity to be dissatisfied with their jobs.
The satisfaction differential between members and non-members can be interpreted in
one of two ways. Either it is the result of union membership, or else it is driven by
unobserved differences between members and non-members that are associated with
satisfaction and membership status . In our exploratory descriptive regression analysis, where
membership is treated as exogenous, there were two indications that the effects might be
attributable to selection into union membership. The first was the fact that the size of the
union membership coefficient altered substantially with the introduction of additional
13
variables, indicating that membership is not randomly assigned across employees. This raises
the prospect that there may be unobservable differences across members and non-members
that affect their job satisfaction. Second, we were able to reject the proposition that
members’ lower satisfaction was the result of ‘voice’ effects arising from the politicising
influence of membership. Exploiting the linked employer-employee data available in WERS,
we therefore explored the possibility that membership is endogenous with respect to
satisfaction. Our analyses indicate that this is indeed the case and that, once account is taken
of endogenous selection into membership, union membership is no longer associated with
lower job satisfaction. It seems that some individuals have unobservable attributes – perhaps
higher aspirations from their working life - that lead them to unionise and also make them
feel unsatisfied with their job. By affecting membership probabilities, our instruments
remove the bias induced by endogenous selection from the estimated membership coefficient
in the job satisfaction equation. We conclude that unions are innocent of any charge that they
may incite job dissatisfaction in the bargaining process and that, further, unions continue to
deliver for their members by delivering a union wage premium.
14
Table 1: Satisfaction and membership
Overall Job Satisfaction Satisfaction with Pay Number of job facets about which was ‘very satisfied’ or ‘satisfied’
Member Non-Member
Reported degree of satisfaction
Member Non-Member
4 16.8 23.0 Very satisfied 3.1 3.5 3 24.0 25.9 Satisfied 30.3 32.8 2 19.0 20.2 Neither satisfied
nor dissatisfied 22.7 24.5
1 19.4 15.7 Dissatisfied 30.4 27.7 0 20.8 15.2 Very dissatisfied 13.4 11.5 P 0.0000 P 0.0205
Notes:
1) Figures are column percentages which take account of survey design. 2) Number of observations=18,012. 3) P indicates the p-value of a design-based Pearson χ2 test of independence of the two
variables.
15
Table 2: The impact of union membership on job satisfaction (1) (2) (3) (4) (5) (6) (7) OJS SWP OJS SWP OJS SWP OJS SWP OJS SWP OJS SWP OJS SWP Union Member -.222 -.091 -.217 -.068 -.157 -.007 -.155 -.034 -.121 -.016 -.135 -.047 -.128 -.037 (9.43) (2.70) (8.77) (1.96) (6.07) (0.24) (4.88) (1.08) (3.80) (0.50) (4.17) (1.34) (3.93) (1.05) Personal characteristics
Job characteristics
Workplace characteristics
Opinions on industrial relations and trade unions
Pay Union Activist
No
No
No
No
No
No
Yes
No
No
No
No
No
Yes
Yes
No
No
No
No
Yes
Yes
Yes
No
No
No
Yes
Yes
Yes
Yes
No
No
Yes
Yes
Yes
Yes
Yes
No
Yes
Yes
Yes
Yes
Yes
Yes Log likelihood -28712 -25850 -28389 -25650 -27835 -25332 -27721 -25071 -25022 -24016 -24871 -23348 -24715 -23210 Model p-value 0.0000 0.0000 0.0000 0.0000 0.0000 0.0000 0.0000 0.0000 0.0000 0.0000 0.0000 0.0000 0.0000 0.0000 Notes:
1) The table shows union membership coefficients from overall job satisfaction (OJS) and satisfaction with pay (SWP) equations estimated using ordered probit models. Regressions use survey stratification weights and account for the presence of repeated observations on the same establishment.
2) A “Yes” indicates that the relevant set of controls is included in the regression. 3) Number of observations=18,012. 4) Asymptotically robust t-ratios in parentheses.
16
Table 3: The impact of union membership on job satisfaction
Overall Job Satisfaction Satisfaction with Pay Exogenous Endogenous Exogenous Endogenous Union Member -.135 .078 -.047 .123 (4.17) (0.53) (1.34) (0.71) Personal characteristics Yes Yes Job characteristics Yes Yes Workplace characteristics
Yes Yes
Opinions on industrial relations and trade unions
Yes Yes
Pay Yes Yes Correlation of unobservables between satisfaction and membership equation (ρ)
-.124 (1.52)
-.101 (1.05)
Exclusion of instruments from satisfaction equation, p-value
0.5812 0.4540
Exclusion of instruments from membership equation, p-value
0.0001 0.0001
Log likelihood -24871.74 -31263.589 -23348.97 -29759.439 Model p-value 0.0000 0.0000 0.0000 0.0000
Notes:
1) The table shows union membership coefficients from overall job satisfaction equations estimated using ordered probit (‘Exogenous’ column) and ordered probit with endogenous dummy (‘Endogenous’ column) models. Regressions use survey stratification weights and account for the presence of repeated observations on the same establishment.
2) A “Yes” indicates that the relevant set of controls is included in the regression. 3) Number of observations=18,012. 4) Asymptotically robust t-ratios in parentheses.
17
Appendix
Table A1: Variables used in the analysis (number of observations=18012) Mean Appears in RHS
of satisfaction equation
Appears in RHS of
membership equation
Female 0.46 × × Aged less than 20 0.05 × × Aged 20-24 0.07 × × Aged 25-29 0.12 × × Aged 30-39 0.29 × × Aged 40-49 0.25 × × Aged 50-59 0.18 × × Aged 60 or more 0.04 × × Has children aged 0-4 0.15 × × Has children aged 5-11 0.20 × × Has children aged 12-18 0.20 × × Single 0.21 × × Widowed 0.01 × × Divorced 0.07 × × Has at most CGSE 0.12 × × Has at most O-levels 0.27 × × Has at most A-levels 0.15 × × Has at most graduate degree 0.16 × × Has at most post-graduate degree 0.05 × × Has none of these qualifications 0.24 × × Has vocational qualifications 0.39 × × Disabled 0.06 × × Non-white 0.03 × × Manager 0.10 × × Professional 0.13 × × Associate professional and technical 0.09 × × Clerical and secretarial 0.16 × × Craft and skilled service 0.11 × × Personal and protective service 0.08 × × Sales 0.10 × × Operative and assembly 0.13 × × Other occupations 0.11 × × Temporary job 0.04 × Fixed term contract 0.03 × Overtime always paid 0.47 × Job equally done by men and women 0.29 ×
18
Availability of flexible hours 0.76 × Availability of job sharing 0.15 × Availability of parental leave 0.06 × Availability of nursery 0.005 × Can take day off if needed 0.97 × Paid less than £50 per week 0.06 × Paid £51-£80 per week 0.07 × Paid £81-£140 per week 0.12 × Paid £141-£180 per week 0.09 × Paid £181-£220 per week 0.11 × Paid £221-£260 per week 0.11 × Paid £261-£310 per week 0.10 × Paid £311-£360 per week 0.08 × Paid £361-£430 per week 0.10 × Paid £431-£540 per week 0.08 × Paid £541-£680 per week 0.04 × Paid more than £681 per week 0.04 × Total hours worked on average week 36.65 × Has discussed with supervisor about how getting on with job
0.59 ×
Has discussed with supervisor about promotions 0.21 × Has discussed with supervisor about training 0.48 × Has discussed with supervisor about pay 0.30 × Thinks management understanding of employees’ problems
0.54 ×
Thinks meetings management/employees are useful 0.59 × Thinks relations management/employees are good 0.54 × Thinks managers are in favour of trade unions 0.16 × Thinks trade unions take notice of members’ problems 0.33 × Thinks trade unions taken seriously by management 0.26 × Thinks trade unions make a difference in work environment
0.21 ×
10 thru 24 employees 0.13 × × 25 to 49 employees 0.15 × × 50 to 99 employees 0.15 × × 100 to 199 employees 0.15 × × 200 to 499 employees 0.20 × × 500 or more employees 0.22 × × Manufacturing 0.26 × × Electricity, gas water 0.01 × × Construction 0.03 × × Wholesales and retail 0.15 × × Hotels and restaurants 0.05 × ×
19
Transports and communication 0.06 × × Financial services 0.04 × × Other business and services 0.08 × × Public administration 0.08 × × Education 0.09 × × Health 0.12 × × Other community services 0.03 × × East Anglia 0.06 East Midlands 0.09 × × London 0.10 × × North 0.07 × × North West 0.10 × × Scotland 0.10 × × Rest of the South East 0.18 × × South West 0.08 × × Wales 0.04 × × West Midlands 0.10 × × Yorkshire & Humberside 0.08 × × Share female employees 0.47 × × Share part time employees 0.24 × × Share managers 0.08 × × Share professionals 0.12 × × Share technicals 0.09 × × Share clericals 0.16 × × Share crafts 0.11 × × Share personal and protective services 0.08 × × Share salers 0.10 × × Share operatives 0.14 × × Share other occupations 0.12 × × Single establishment 0.24 × × Head establishment 0.32 × × Foreign owned firm 0.15 × × Public owned firm 0.28 × × Workplace aged less than 3 year 0.08 Workplace aged 3 to 4 years 0.06 × × Workplace aged 5 to 9 years 0.15 × × Workplace aged 10 to 20 years 0.20 × × Workplace aged More than 20 years 0.51 × × Workplace produces goods or services for consumers 0.53 Workplace supplies goods or services to other companies 0.23 × × Workplace supplies of goods or services to other parts of organisation
0.08 × ×

20
Workplace does not produce goods or services for sale in the open market
0.13 × ×
Workplace is an administrative office only 0.03 × × TTWA unemployment rate between 5 and 7 percent 0.33 × × TTWA unemployment rate between 7 and 7.5 percent 0.12 × × TTWA unemployment rate above 7.5 percent 0.06 × × Workplace union density 34.68 × × Trade union recognised 0.56 × × Manager thinks trade unions improve performance 0.36 × Manager thinks employees fully committed 0.67 × Manager thinks IR climate is good 0.86 × Manager thinks management against trade unions 0.12 ×
21
Table A2: Distribution of members and non-members across non pecuniary measures of job satisfaction
Satisfaction with the sense of achievement
derived from the work
Satisfaction with the respect from
supervisors or line managers
Satisfaction with the amount of
influence over the job
Reported degree of satisfaction
M NM M NM M NM
Very satisfied 12.6 15.3 10.8 15.5 8.8 12.7 Satisfied 45.9 50.4 40.5 46.0 44.4 49.6 Neither satisfied nor dissatisfied
22.3 21.3 21.3 19.7 26.6 25.1
Dissatisfied 13.0 9.2 15.6 11.7 15.2 10.5 Very dissatisfied 6.1 3.8 11.8 7.0 4.9 2.2 P 0.0000 0.0000 0.0000 Notes:
1) Figures are column percentages which take account of survey design. 2) M = union members. NM = union non-members. 3) Number of observations=18,012.
P indicates the p-value of a design-based Pearson χ2 test of independence of the two variables.
22
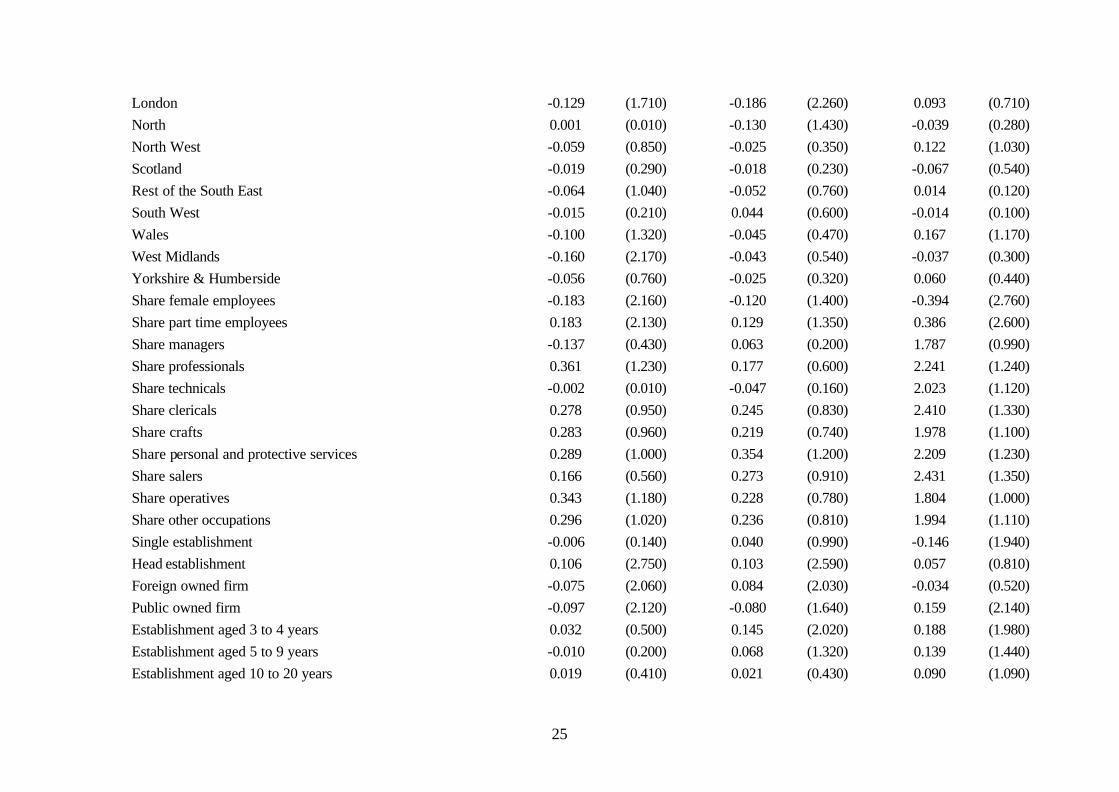
Available from the authors upon request: estimates of satisfaction equation with endogenised membership dummy OJS SWP Membership*
Variable Coeff. |t-stat| Coeff. |t-stat| Coeff. |t-stat| Female 0.260 (8.920) 0.298 (10.380) -0.070 (1.600) Aged 20-24 0.056 (0.850) -0.023 (0.300) 0.365 (2.810) Aged 25-29 -0.037 (0.540) -0.152 (2.080) 0.638 (5.160) Aged 30-39 -0.065 (0.960) -0.180 (2.360) 0.821 (6.590) Aged 40-49 -0.033 (0.460) -0.176 (2.260) 0.939 (7.290) Aged 50-59 0.072 (1.010) -0.220 (2.800) 0.808 (5.960) Aged 60 or more 0.481 (5.490) 0.057 (0.610) 0.475 (2.780) Has children aged 0-4 0.090 (2.400) 0.064 (1.860) -0.032 (0.660) Has children aged 5-11 -0.020 (0.650) -0.039 (1.300) -0.048 (1.180) Has children aged 12-18 0.016 (0.460) -0.014 (0.480) -0.074 (1.700) Single 0.002 (0.060) 0.028 (0.820) -0.059 (1.170) Widowed 0.063 (0.700) 0.232 (2.560) -0.305 (1.880) Divorced 0.002 (0.050) 0.018 (0.400) -0.078 (1.280) Has at most O-levels -0.081 (2.030) -0.055 (1.180) -0.121 (1.940) Has at most A-levels -0.171 (3.520) -0.072 (1.640) -0.124 (1.750) Has at most graduate degree -0.242 (4.540) -0.251 (5.260) -0.019 (0.250) Has at most post-graduate degree -0.295 (4.500) -0.286 (4.350) 0.017 (0.180) Has none of these qualifications 0.117 (2.330) 0.010 (0.230) -0.054 (0.810) Has vocational qualifications -0.009 (0.330) -0.071 (2.800) 0.038 (0.990) Disabled -0.203 (3.580) -0.147 (3.050) 0.037 (0.520) Non-white 0.078 (1.270) -0.119 (1.870) 0.029 (0.270) Professional -0.099 (1.860) -0.106 (1.940) 0.586 (5.870) Associate professional and technical -0.174 (3.370) -0.087 (1.500) 0.673 (6.670) Clerical and secretarial -0.176 (3.450) 0.063 (1.170) 0.057 (0.670)
23
Craft and skilled service -0.042 (0.670) -0.050 (0.760) 0.847 (7.470) Personal and protective service -0.049 (0.760) 0.094 (1.460) 0.125 (0.900) Sales -0.103 (1.570) 0.104 (1.470) 0.495 (4.050) Operative and assembly -0.312 (4.510) 0.163 (1.890) 1.106 (8.750) Other occupations -0.068 (1.020) 0.205 (2.830) 0.309 (2.380) Temporary job 0.087 (1.280) 0.173 (2.450) Fixed term contract -0.056 (0.840) 0.064 (0.930) Overtime always paid -0.052 (1.910) -0.012 (0.460) Job equally done by men and women 0.081 (2.590) 0.052 (2.040) Availability of flexible hours -0.128 (1.050) 0.011 (0.100) Availability of job sharing -0.050 (0.410) 0.006 (0.060) Availability of parental leave 0.001 (0.010) 0.127 (1.110) Availability of nursery 0.107 (0.530) 0.222 (1.450) Can take day off if needed 0.123 (1.820) 0.111 (1.520) Paid less than £50 per week -0.947 (7.430) -2.114 (14.950) Paid £51-£80 per week -0.927 (8.330) -2.116 (17.430) Paid £81-£140 per week -0.903 (9.400) -1.924 (17.820) Paid £141-£180 per week -0.868 (10.060) -1.873 (19.720) Paid £181-£220 per week -0.917 (10.520) -1.835 (20.750) Paid £221-£260 per week -0.844 (10.860) -1.594 (18.740) Paid £261-£310 per week -0.746 (9.300) -1.415 (16.020) Paid £311-£360 per week -0.706 (9.040) -1.222 (14.930) Paid £361-£430 per week -0.521 (6.230) -0.928 (13.650) Paid £431-£540 per week -0.554 (7.590) -0.813 (10.710) Paid £541-£680 per week -0.201 (2.560) -0.458 (5.240) Total hours worked on average week -0.005 (3.000) -0.021 (10.310) Has discussed with supervisor about how getting on with job 0.202 (6.110) 0.150 (4.520)
24
Has discussed with supervisor about promotions 0.043 (1.450) -0.048 (1.660) Has discussed with supervisor about training 0.046 (1.720) 0.034 (1.070) Has discussed with supervisor about pay -0.029 (1.080) -0.312 (11.140) Thinks management understanding of employees’ problems 0.475 (18.260) 0.249 (8.880) Thinks meetings management/employees are useful 0.364 (14.170) 0.242 (9.540) Thinks relations management/employees are good 0.722 (27.320) 0.380 (14.690) Thinks managers are in favour of trade unions 0.032 (0.920) 0.010 (0.290) Thinks trade unions take notice of members’ problems -0.099 (2.480) -0.122 (3.090) Thinks trade unions taken seriously by management 0.207 (3.800) 0.175 (3.480) Thinks trade unions make a difference in work environment 0.152 (3.000) 0.086 (2.240) 25 to 49 employees -0.015 (0.310) 0.015 (0.310) -0.108 (1.300) 50 to 99 employees -0.081 (1.740) -0.028 (0.560) -0.019 (0.240) 100 to 199 employees -0.058 (1.190) -0.030 (0.590) 0.039 (0.470) 200 to 499 employees -0.073 (1.490) -0.066 (1.280) 0.126 (1.520) 500 or more employees -0.111 (2.150) -0.085 (1.540) 0.101 (1.170) Electricity, gas water 0.042 (0.710) 0.160 (2.230) 0.119 (1.140) Construction 0.033 (0.640) 0.019 (0.300) -0.052 (0.500) Wholesales and retail -0.113 (2.190) 0.029 (0.510) -0.246 (2.650) Hotels and restaurants -0.264 (3.980) -0.196 (2.270) 0.202 (1.470) Transports and communication -0.099 (1.890) -0.091 (1.680) 0.134 (1.380) Financial services -0.132 (1.820) -0.057 (0.740) 0.089 (0.700) Other business and services -0.089 (1.700) -0.103 (1.740) -0.109 (0.920) Public administration -0.108 (1.560) -0.233 (3.030) 0.096 (0.800) Education -0.066 (0.920) -0.179 (2.380) -0.053 (0.420) Health -0.061 (0.840) -0.215 (2.810) 0.190 (1.510) Other community services -0.215 (3.260) -0.205 (3.020) -0.210 (1.780) East Midlands 0.004 (0.050) 0.063 (0.820) 0.039 (0.320)
25
London -0.129 (1.710) -0.186 (2.260) 0.093 (0.710) North 0.001 (0.010) -0.130 (1.430) -0.039 (0.280) North West -0.059 (0.850) -0.025 (0.350) 0.122 (1.030) Scotland -0.019 (0.290) -0.018 (0.230) -0.067 (0.540) Rest of the South East -0.064 (1.040) -0.052 (0.760) 0.014 (0.120) South West -0.015 (0.210) 0.044 (0.600) -0.014 (0.100) Wales -0.100 (1.320) -0.045 (0.470) 0.167 (1.170) West Midlands -0.160 (2.170) -0.043 (0.540) -0.037 (0.300) Yorkshire & Humberside -0.056 (0.760) -0.025 (0.320) 0.060 (0.440) Share female employees -0.183 (2.160) -0.120 (1.400) -0.394 (2.760) Share part time employees 0.183 (2.130) 0.129 (1.350) 0.386 (2.600) Share managers -0.137 (0.430) 0.063 (0.200) 1.787 (0.990) Share professionals 0.361 (1.230) 0.177 (0.600) 2.241 (1.240) Share technicals -0.002 (0.010) -0.047 (0.160) 2.023 (1.120) Share clericals 0.278 (0.950) 0.245 (0.830) 2.410 (1.330) Share crafts 0.283 (0.960) 0.219 (0.740) 1.978 (1.100) Share personal and protective services 0.289 (1.000) 0.354 (1.200) 2.209 (1.230) Share salers 0.166 (0.560) 0.273 (0.910) 2.431 (1.350) Share operatives 0.343 (1.180) 0.228 (0.780) 1.804 (1.000) Share other occupations 0.296 (1.020) 0.236 (0.810) 1.994 (1.110) Single establishment -0.006 (0.140) 0.040 (0.990) -0.146 (1.940) Head establishment 0.106 (2.750) 0.103 (2.590) 0.057 (0.810) Foreign owned firm -0.075 (2.060) 0.084 (2.030) -0.034 (0.520) Public owned firm -0.097 (2.120) -0.080 (1.640) 0.159 (2.140) Establishment aged 3 to 4 years 0.032 (0.500) 0.145 (2.020) 0.188 (1.980) Establishment aged 5 to 9 years -0.010 (0.200) 0.068 (1.320) 0.139 (1.440) Establishment aged 10 to 20 years 0.019 (0.410) 0.021 (0.430) 0.090 (1.090)

26
Establishment aged More than 20 years 0.036 (0.830) 0.054 (1.160) 0.148 (1.880) Workplace supplies goods or services to other companies 0.020 (0.600) -0.053 (1.410) -0.180 (3.040) Workplace supplies of goods or services to other parts of organisation
0.077 (1.560) 0.129 (2.440) -0.045 (0.560)
Workplace does not produce goods or services for sale in the open market
-0.037 (0.890) -0.075 (1.850) -0.045 (0.740)
Workplace is an administrative office only -0.015 (0.270) -0.032 (0.510) -0.009 (0.090) TTWA unemployment rate between 5 and 7 percent 0.029 (0.830) -0.040 (1.170) 0.034 (0.600) TTWA unemployment rate between 7 and 7.5 percent -0.057 (1.190) -0.094 (1.780) 0.269 (3.600) TTWA unemployment rate above 7.5 percent 0.000 (0.000) -0.058 (0.930) 0.094 (1.100) Workplace union density -0.002 (1.760) -0.002 (1.280) 0.020 (19.420) Trade union recognised -0.017 (0.400) 0.040 (0.860) 0.612 (9.060) Manager thinks trade unions improve performance 0.069 (1.590) Manager thinks employees fully committed -0.153 (3.370) Manager thinks IR climate is good -0.091 (1.390) Manager thinks management against trade unions -0.124 (1.480) Member of trade union 0.078 (0.530) 0.124 (0.710) Constant -4.655 (2.550)
τ1 -1.165 (3.330) -2.955 (8.580)
τ2 -0.464 (1.320) -1.858 (5.380)
τ3 0.198 (0.560) -1.146 (3.320)
τ4 1.108 (3.130) 0.539 (1.560) rho -0.125 (1.520) -0.100 (1.050)
Notes: N=18,012. Ordered Probit with Endogenous Dummy Weighted Pseudo Maximum Likelihood estimates use survey stratification weights and account for the presence of repeated observations on the same establishment. Asymptotically robust t-ratios in parentheses. *The membership equation is the one estimated in the OJS model; the one from the SWP –which is pretty similar—is not reported.

27
References Airey, C., Hales, J., Hamilton, R., Korovessis, C., McKernan, A. and Perdon, S. (1999), The
Workplace Employee Relations Survey (WERS) 1997-8: Technical Report. Akerlof, G. and Yellen, J. (1986), Efficiency Wage Models of the Labor Market, Cambridge
University Press: Cambridge. Bender, K. and Sloane, P. J. (1998), ‘Job Satisfaction, Trade Unions, and Exit-Voice
Revisited’, Industrial and Labor Relations Review, 51, pp. 222-240. Borjas, G. J. (1979), ‘Job Satisfaction, Wages and Unions ’, The Journal of Human Resources,
XIV, pp. 21-40. Bryson, A. (2002), ‘The Union Wage Premium: An Analysis Using Propensity Score
Matching’, Centre for Economic Performance Discussion Paper No. 530, London School of Economics.
Bryson, A (2003), ‘Employee Desire for Unionisation in Britain and Its Implications for
Union Organising’, Policy Studies Institute Discussion Paper, forthcoming. Bryson, A and Gomez R. (2002), ‘You Can’t Always Get What You Want: Frustrated
Demand for Unionisation in Britain’, Working Paper No. 1182, Centre for Economic Performance, London School of Economics.
Burdett, K. and Mortensen, D. T. (1998), ‘Wage Differentials, Employer Size, and
Unemployment’, International Economic Review, 39, pp. 257-273. Cappellari, L., Lucifora, C. and Piccirilli, G. (2002), ‘Union Activism, Workers’ Satisfaction
and Organisational Change’, Università Cattolica di Milano, unpublished paper. Clark, A. and Oswald, A. (1996), ‘Satisfaction and Comparison Income’, Journal of Public
Economics, 61, pp. 65-71. Clark, A. and Oswald, A. (1998), ‘Comparison-Concave Utility and Following Behaviour in
Social and Economic Settings’, Journal of Public Economics, 70, pp. 133-155. Farber, H. (2001), ‘Notes on the Economics of Labor Unions’, Industrial Relations Section
Working Paper 452, Princeton University. Freeman, R. B. (1978), ‘Job Satisfaction as an Economic Variable’, American Economic
Review, 68, pp. 135-141. Freeman, R. B. and Medoff, J. L. (1984), What Do Unions Do? Basic Books: New York. Gordon, M. E. and Denisi, A. S. (1995), ‘A Re-examination of the Relationship Between
Union Membership and Job Satisfaction’, Industrial and Labor Relations Review, 48, pp. 222-236.

28
Hamermesh, D. (1977), ‘Economic Considerations in Job Satisfaction Trends’, Industrial Relations, 15, pp. 111-114.
Hersch, J. and Stone, J. A. (1990), ‘Is Union Job Satisfaction Real?’, Journal of Human
Resources, XXV, pp. 736-751. Jovanovic, B. (1979), ‘Job Matching and the Theory of Turnover’, Journal of Political
Economy, 87, pp. 972-990. Khaneman, D., Knetsch, J. and Thaler, R. (1986), ‘Fairness As a Constraint on Profit
Seeking’, American Economic Review, 76, pp. 728-741. Kochan, T. A. and Helfman, D. E. (1981), ‘The Effects of Collective Bargaining on
Economic and Behavioural Job Outcomes’, in R. Ehrenberg (ed.), Research in Labour Economics, Vol. 4, JAI Press.
Leigh, D. (1986), ‘Union Preferences, Job Satisfaction, and the Union-Voice Hypothesis’,
Industrial Relations, 25, pp. 65-71. Miller, P. W. (1990), ‘Trade Unions and Job Satisfaction’, Australian Economic Papers, 29,
pp. 226-248. Weiss, A. (1980), ‘Job Queues and Layoffs in Labor Markets with Flexible Wages’, Journal
of Political Economy, 88, pp. 526-538.
CENTRE FOR ECONOMIC PERFORMANCE Recent Discussion Papers
568 A. Bryson R. Gomez
Segmentation, Switching Costs and the Demand for Unionization in Britain
567 M. Gutiérrez-Domènech Employment After Motherhood: A European Comparison
566 T. Kirchmaier The Performance Effects of European Demergers
565 P. Lopez-Garcia Labour Market Performance and Start-Up Costs: OECD Evidence
564 A. Manning The Real Thin Theory: Monopsony in Modern Labour Markets
563 D. Quah Digital Goods and the New Economy
562 H. Gospel P. Willman
High Performance Workplaces: the Role of Employee Involvement in a Modern Economy. Evidence on the EU Directive Establishing a General Framework for Informing and Consulting Employees
561 L. R. Ngai Barriers and the Transition to Modern Growth
560 M. J. Conyon R. B. Freeman
Shared Modes of Compensation and Firm Performance: UK Evidence
559 R. B. Freeman R. Schettkat
Marketization of Production and the US-Europe Employment Gap
558 R. B. Freeman The Labour Market in the New Information Economy
557 R. B. Freeman Institutional Differences and Economic Performance Among OECD Countries
556 M. GuttiJrrez-DomPnech The Impact of the Labour Market on the Timing of Marriage and Births in Spain
555 H. Gospel J. Foreman
The Provision of Training in Britain: Case Studies of Inter-Firm Coordination
554 S. Machin Factors of Convergence and Divergence in Union Membership
553 J. Blanden S. Machin
Cross-Generation Correlations of Union Status for Young People in Britain
552 D. Devroye R. B. Freeman
Does Inequality in Skills Explain Inequality of Earnings Across Advanced Countries?
551 M. Guadalupe The Hidden Costs of Fixed Term Contracts: the Impact on Work Accidents
550 G. Duranton City Size Distribution as a Consequence of the Growth Process
549 S. Redding A. J. Venables
Explaining Cross-Country Export Performance: International Linkages and Internal Geography
548 T. Bayoumi M. Haacker
It’s Not What You Make, It’s How You Use IT: Measuring the Welfare Benefits of the IT Revolution Across Countries
547 A. B. Bernard S. Redding P. K. Schott H. Simpson
Factor Price Equalization in the UK?
546 M. GutiPrrez-DomJnech
Employment Penalty After Motherhood in Spain
545 S. Nickell S. Redding J. Swaffield
Educational Attainment, Labour Market Institutions and the Structure of Production
544 S. Machin A. Manning J. Swaffield
Where the Minimum Wage Bites Hard: the Introduction of the UK National Minimum Wage to a Low Wage Sector
543 R. Belfield D. Marsden
Matchmaking: the Influence of Monitoring Environments on the Effectiveness of Performance Pay Systems
To order a discussion paper, please contact the Publications Unit Tel 020 7955 7673 Fax 020 7955 7595 Email [email protected]
Web site http://cep.lse.ac.uk