Embed Size (px)
Citation preview
1
DO WOMEN ASK?
Benjamin Artz, Amanda H. Goodall, and Andrew J. Oswald‡
29 December 2016
Abstract
Females earn less than males. The reasons are not understood. This paper explores the theory that
women ‘don’t ask’ and that they fail to ask out of concern for their personal relationships at work.
Such an account is hard to test with standard labor-economics data sets. The paper therefore uses
matched employer-employee data in which workers are directly questioned about their asking
behaviour. It is unable to reject the hypotheses that males and females ask equally often for
promotions and raises, and that men and women are equally concerned about relationships.
Instead, the analysis documents evidence that women ‘don’t get’.
Keywords: matched employer-employee data; female discrimination; wages; gender.
JEL codes: J31, J71
Acknowledgements: For many helpful suggestions, we thank Linda Babcock, Paul Bain, Pat
McGovern, and Paul Oyer.
‡ The authors’ affiliations are, respectively, University of Wisconsin at Oshkosh; Cass Business School, City,
University of London, and IZA Bonn; University of Warwick, CAGE Research Centre, and IZA Bonn.
2
Do Women Ask?
1. Introduction
This paper explores one of the famous puzzles of the modern workplace. Across the
industrialized world, female workers typically earn less than their male counterparts. It is still not
completely understood why this pattern -- one consistent with the existence of gender
discrimination -- persists.1 This study exploits a new, and admittedly particularly simple, form of
survey evidence. It is an attempt to test two oft-heard claims, namely, that:
(i) Idea 1: Women intrinsically do not ask for pay raises;
(ii) Idea 2: The reason that women do not ask is because they are more concerned than
men about the quality of their relationships in the workplace.
One reason why it seems important to check this theoretical account is that the theory assigns part
of the responsibility for gender differentials on to females and their own actions.
The paper estimates econometric ‘asking’ equations. Although the above conceptual
account has attracted some prominence (for example, the heavily cited books by Babcock &
Laschever 2003 and Sandberg 20132, although the further book by Babcock and Laschever 2009
notes, on page 14, that some years later the don’t-ask finding was weaker), the current study is not
able to find a great deal of support for (i) and (ii). Instead, to anticipate the paper’s later findings,
the evidence apparently is consistent -- especially once we control for variables unavailable to
prior researchers -- with the view that women do ask but do not get. 3,4 The data used in this study
1 For statements of the latest evidence, see Azmat and Petrongolo (2014) and Blau and Kahn (2016). 2 Journal articles include Bowles et al. (2007). 3 In particular, the important studies described in Babcock and Laschever (2003) could not control for the number of
hours worked, and our later results suggest that it is largely this, rather than gender itself, that is associated with ‘not
asking’ for raises. 4 However, there is one important and potentially related conclusion in the literature. Leibbrandt and List (2015) find
in a field experiment that when workers are assigned to a job where the possibility of negotiation is mentioned there
is no statistically significant difference between the negotiation approach of the males and females in their sample.
3
are for the year 2013/14. One possibility is that negotiating behavior in the modern era has begun
to change. 5
Why are there pay gaps between males and females? As Blau and Kahn (2016) carefully
word it, a distinctive hypothesis is that:
“Women’s lower propensity to negotiate over salaries, raises, or promotions, could
reduce their pay relative to men’s. The observed gender difference could reflect social factors,
including women being socialized to feel that they are being pushy or overbearing…”
In most of the survey data sets used by labor economists, it is intrinsically hard to assess
Idea 1 and Idea 2. The reason is that the information gathered in conventional surveys is on
people’s actual earnings (rather than on whether workers are ‘asking’) and on other objective
aspects of workplaces (rather than on underlying psychological reasons and attitudes). This may
be why relatively little formal testing of these ideas has been done on real-world field data, even
though there is evidence, largely from the laboratory, to suggest that women may shy away from
competition (Niederle & Vesterlund 2007, 2010, 2011; Gneezy et al. 2003, 2009; Booth and Nolen
2012; Shurchkov 2012; Garrat et al. 2013; Flory et al. 2015). Exley et al. (2016) make the
interesting discovery that women and men negotiate similarly when obliged to negotiate in the
first place. Bongiorno et al. (2014) demonstrate, in an experiment on Australian data, that women
are not penalized for being assertive.
The current study potentially has advantages denied to most, and perhaps all, previous
researchers on the topic of gender differentials. First, the sampled individuals here are questioned
in detail about their motives, behavior, and histories. Unlike in standard data sets, therefore, it is
in principle possible -- admittedly in an imperfect way -- to inquire into ‘why’ women and men
5 Consistent with this, although not conclusive, because we cannot separate cohort and age effects, is that young
women and young men in our data set appear to act in similar ways (see Appendix A).
4
choose to act in the ways observed6. Second, our data are from matched worker-employer surveys
in which random samples of male and female employees can be studied. This is a valuable feature
for the present inquiry. It makes it possible to control for a large number of background factors
about workplaces that are not observable to the econometrician and would be impossible to allow
for properly in many of the conventional data sets. The paper’s econometric estimates are thus
‘within-employer’.
2. Background
This study follows in the intellectual footsteps of previous researchers such as Arrow
(1973), Becker (1957), Aigner and Cain (1977), Frank (1978), Barron et al. (1993), Blau and Beller
(1988), Lazear and Rosen (1990), Albrecht et al. (2003), and Blackaby et al. (2005). It links to a
growing modern literature on why females have less success in the labor market. Recent research
continues to find evidence of apparent discrimination against women at junior and senior levels
(for example, in the board room, Gregory-Smith et al. 2014). Various explanations have been
proposed (here we follow sources such as Goodall and Osterloh 2016). One is that women may
consciously choose a less ambitious career path than men -- with concomitantly lower salaries7
(Eagly, 1987; Eagly and Karau, 2002). Another hypothesis is that it may be risky for females to
be ambitious. Some research suggests that if women deviate from a perceived female stereotype,
this can produce “identity costs” for the individuals, and if women behave “out of role” (Heilman,
2001; Heilman & Okimoto, 2007; Inzlicht 2011) they may be less popular in professional life. In
one laboratory experiment, for instance, it was shown that males dislike females who negotiate
(Bowles, Babcock & Lai, 2007). Moreover, women who display anti-stereotypical behaviour are
6 We would accept, if necessary, the more exact wording “into why women and men say they choose to act...” 7 It has been argued that more than 50 percent of male candidates negotiate their salary after the first job offer following
graduation, but only ten percent of females -- see Babcock et al. 2006 (and Babcock & Laschever, 2003).
5
sometimes accused of exhibiting poor social skills (Phelan, Moss-Racusin & Rudman, 2008).
Lastly, all such beliefs can become “self-fulfilling-prophecies” (Merton, 1948: 195). The
performance of individuals who belong to negatively stereotyped groups is lower (Schmader &
Johns, 2003). Girls’ mathematics scores decrease when their gender is made salient (Spencer et
al., 1999). The same happens for performance in competitions (Guenther et al., 2010), and in risk-
aversion (Booth & Nolen, 2012). Recent work by Card et al. (2016) finds that women receive
only 90% of the firm-specific pay that is earned by men.
Similar ideas have been suggested in modern work by Mazei et al. (2015), Leibbrandt and
List (2015), and Croson and Gneezy (2009). This emerging literature has documented various
kinds of differences, under controlled laboratory conditions, between the actions of males and
females.
Finally, special mention should be made of a study in Great Britain. After the working-
paper version of our study was released, we were made aware of the approach taken in Chapter 4
of the book McGovern et al. (2007), which is an analysis of the Working in Britain survey, and
does not find evidence in favour of the women-don’t-ask theory. The WiB survey asks workers
whether since joining the employer they have ever subsequently asked for a pay rise. In a logistic
regression the coefficient on female is negative, and fairly large, but the authors report that it is
not statistically significantly different from zero. The authors control for union membership, social
class, education, and a small number of other covariates. They are not able to control for employer
fixed-effects, but can allow for a variable for establishment size.
3. Data
The data source used in the analysis is a representative sample of Australian employees
and workplaces. The recently available Australian Workplace Relations Survey (AWRS) covers
6
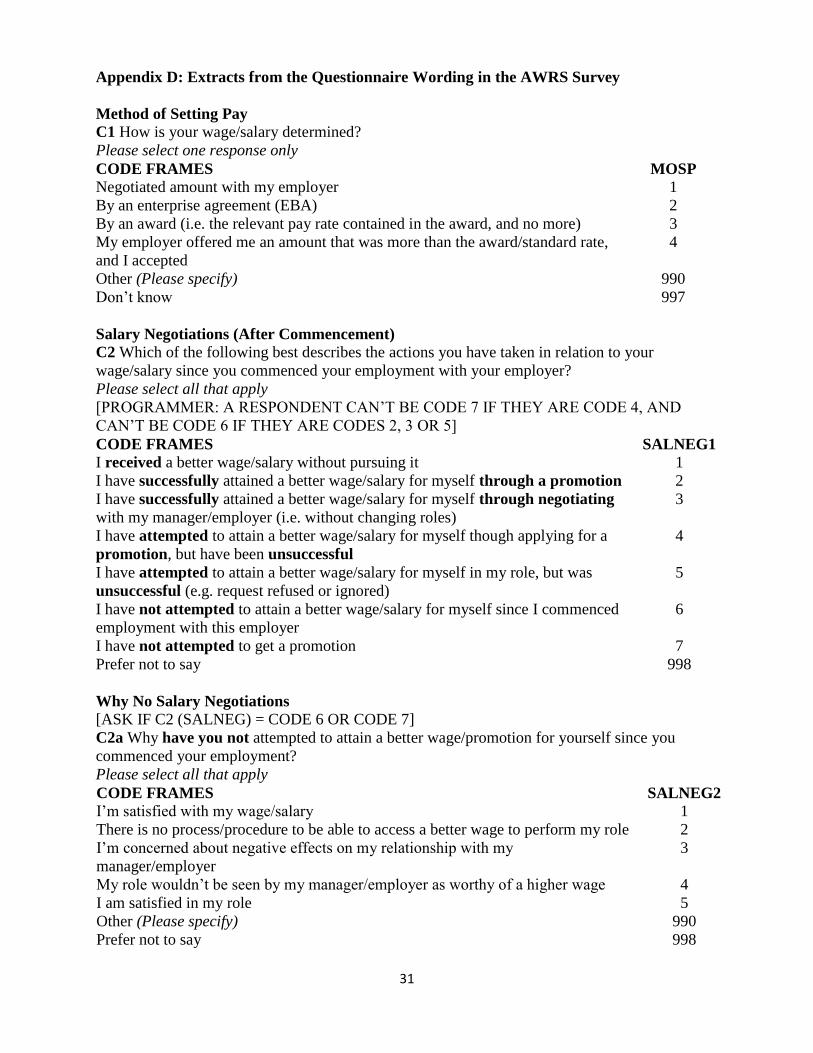
2013-2014. It has the distinctive feature that it asks individuals a set of questions about whether
their pay is set by negotiation with the company, whether they have successfully obtained a wage
raise or promotion since joining the employer, whether they preferred not to attempt to negotiate
a pay raise because they were concerned about their relationships, why they decided that, and about
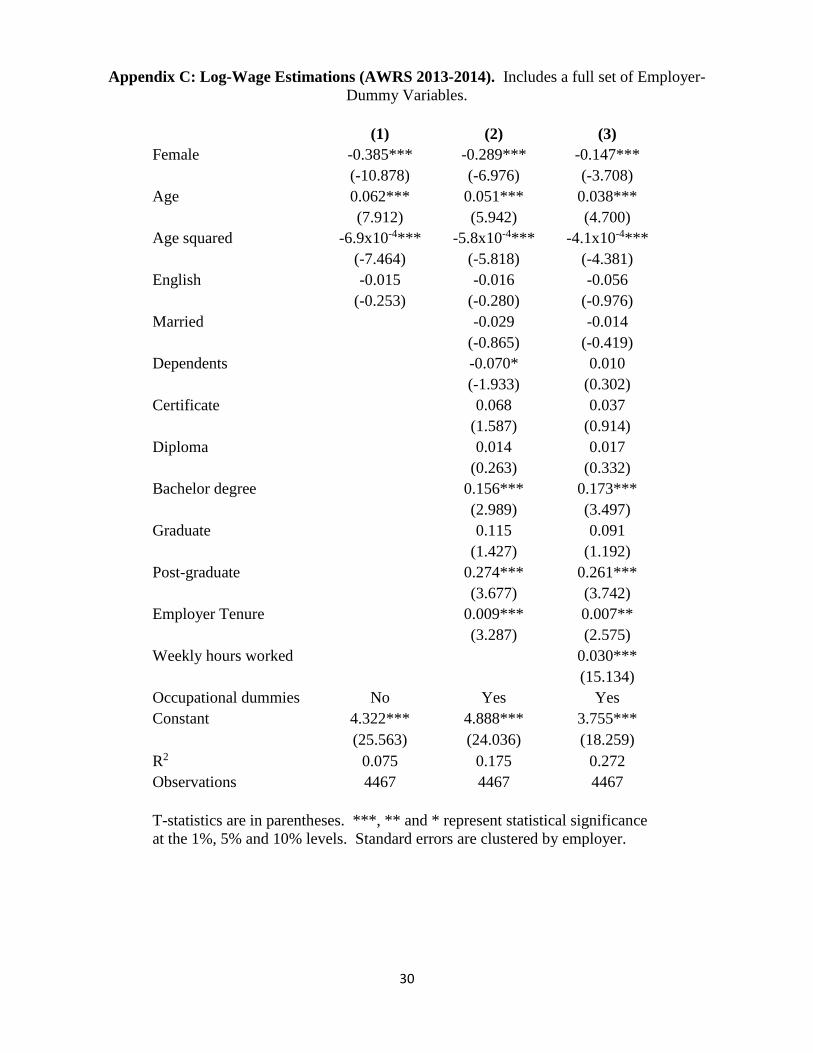
their levels of satisfaction. Like other nations, Australia also has a gender pay gap (see Appendix
C in this paper, for example).
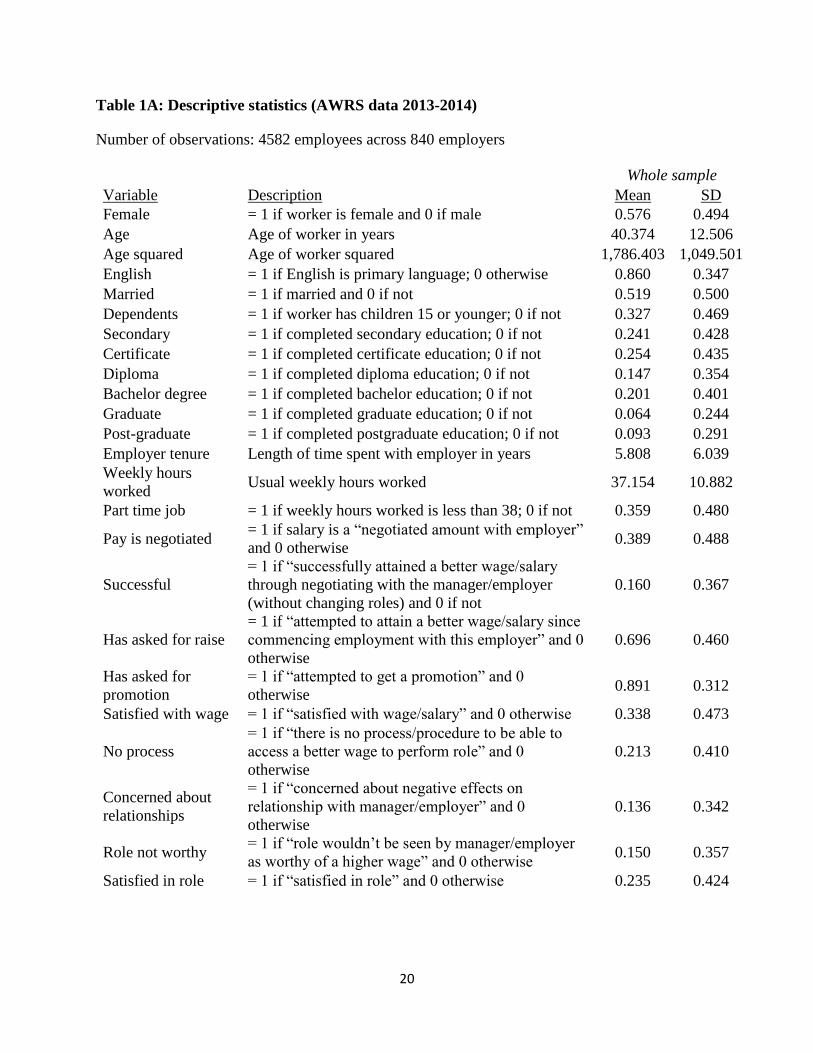
Using these new AWRS data, Tables 1a and 1b give descriptive information about the
sample. The data set offers information on approximately 4600 randomly sampled workers across
840 workplaces. For the later analysis, we will be especially interested in answers to questions
asking for information such as whether:
“I have not attempted to attain a better wage/salary for myself since I commenced
employment with this employer”
“Why have you not attempted to attain a better wage/promotion for yourself since you
commenced your employment? … I’m concerned about negative effects on my relationship with
my manager/employer”
“I have successfully attained a better wage/salary for myself through negotiating with my
manager/employer (i.e. without changing roles)”
We will, for example, set a dummy to equal zero if respondents agreed with "I have not
attempted to attain a better wage/salary for myself since I commenced employment with this
employer", and equal to one if they did not agree with the statement. This can then be treated as a
dependent variable in a regression equation, and standard demographic and workplace variables
then included as independent variables.
In the data set, a little over half of workers are female, and the mean age of the sample is
slightly under 41 years old. For 20% of the workforce, the highest educational qualification is a
bachelor’s degree. A further 16% of workers have further degrees. These proportions on
7
educational attainment do not vary greatly across males and females. Just over half the sample are
married, and for 86% of employees their language used at home is English. Fulltime workers
make up 64% of the sample. At the mean, the number of hours worked is 37 per week.
The paper’s focus is upon what happens during pay-setting. Approximately 39% of
employees say, as shown in Table 1a, that they are in a job where they negotiate their salary with
the company. This proportion is broadly comparable to the U.S. figure of 33% reported in Hall
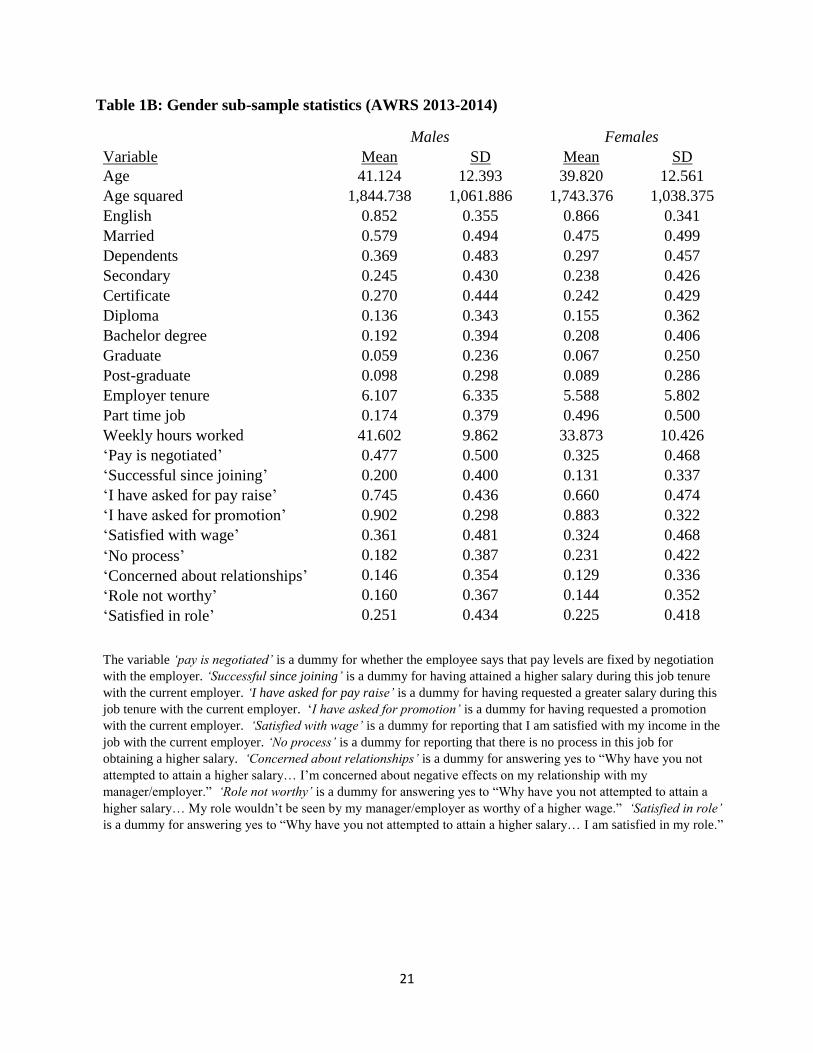
and Krueger (2012) 8. In the raw data of Table 1b, women are noticeably less likely than men to
say they are in a job where they negotiate wages. The figure for males is approximately 48%; the
figure for females is approximately 33%. Although the authors do not focus upon the issue of
gender, Hall and Krueger report a figure of 25% for U.S. females.
In AWRS, information is also available on whether employees say they have attempted to
attain a better salary since they commenced employment with the organization. Here, in Table 1b,
it can be seen that 75% of males say they have asked for a raise in pay, while 66% of women have
asked. Hence, in terms of Idea 1 above, it is true as a descriptive statement that women ask less
(both when joining and when already employed by the employer). Later tables explore whether
that remains true when other characteristics are held constant. Table 1b also reveals that 14.6% of
males say they have not attempted to obtain a raise because of concern for their relationships in
the workplace. A smaller number, 12.9%, of females say this. Hence, in the raw data, there is no
support for Idea 2, above, that women are disproportionately wary of requesting a raise in salary.
4. Regression Results
There are at least two ways to ‘ask’ in a workplace. One method is to seek to be promoted
at work. The other is to seek greater pay in the existing job.
8 As in Table 3 of Hall and Krueger (2012).
8
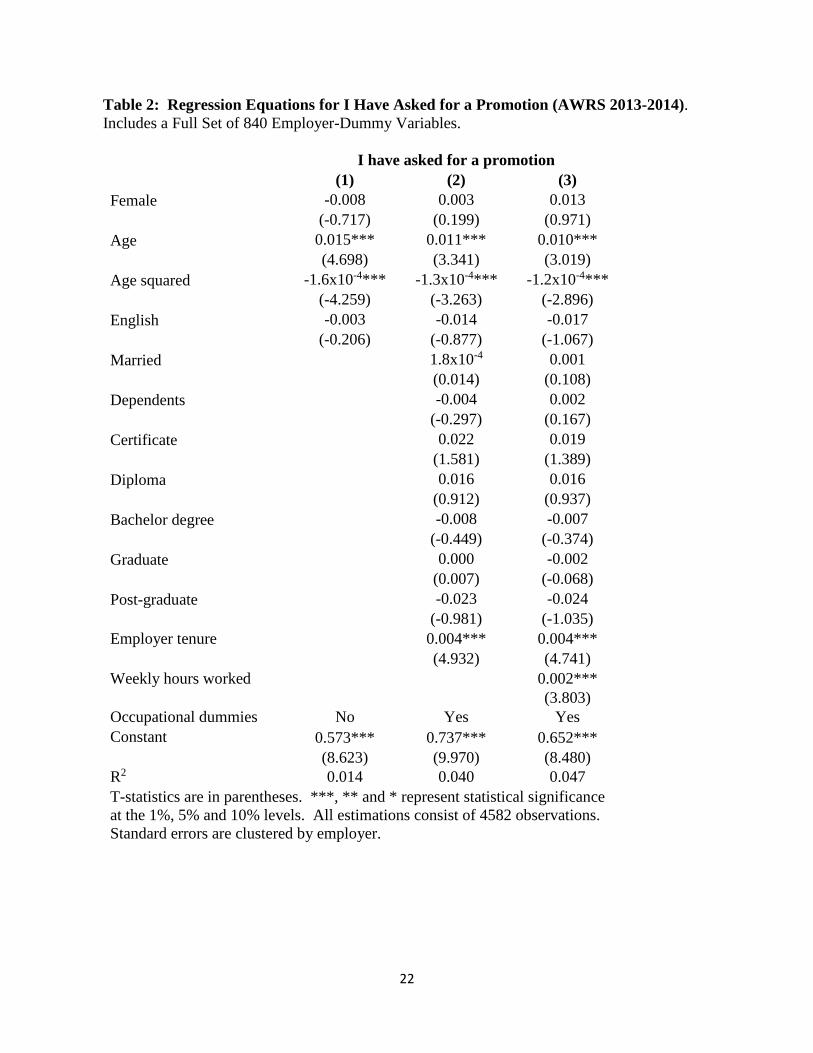
Table 2 begins with the issue of whether, after adjusting for other factors, there is evidence
in this data set that females request promotion either more or less often than do males. The null
hypothesis is taken to be that the two genders behave similarly. Table 2 thus estimates a regression
equation in which there are 4582 observations on individuals who work across 840 different
employers. 9 The dependent variable in the regression equations of Table 2 is a one or zero when
respondents in the survey answer that, with this employer, ‘I have asked for promotion’. In each
of the three columns of Table 2, the coefficient on a female dummy variable is close to zero (and
in two of the three columns has the wrong sign for a women-don’t-ask view). In the fullest
specification, the coefficient is 0.013 with a t-statistic of 0.971. Hence it is not possible to reject
the null hypothesis that women and men ask equally often for promotion. This conclusion holds
in each of the three columns, where the first column includes as covariates only gender, age and
age squared, whether English is the language spoken in the person’s home, and a set of employer
fixed-effect dummies, and the third column includes a larger set of covariates that include the
number of working hours and occupational and educational dummies. These estimates are
effectively within-employer.
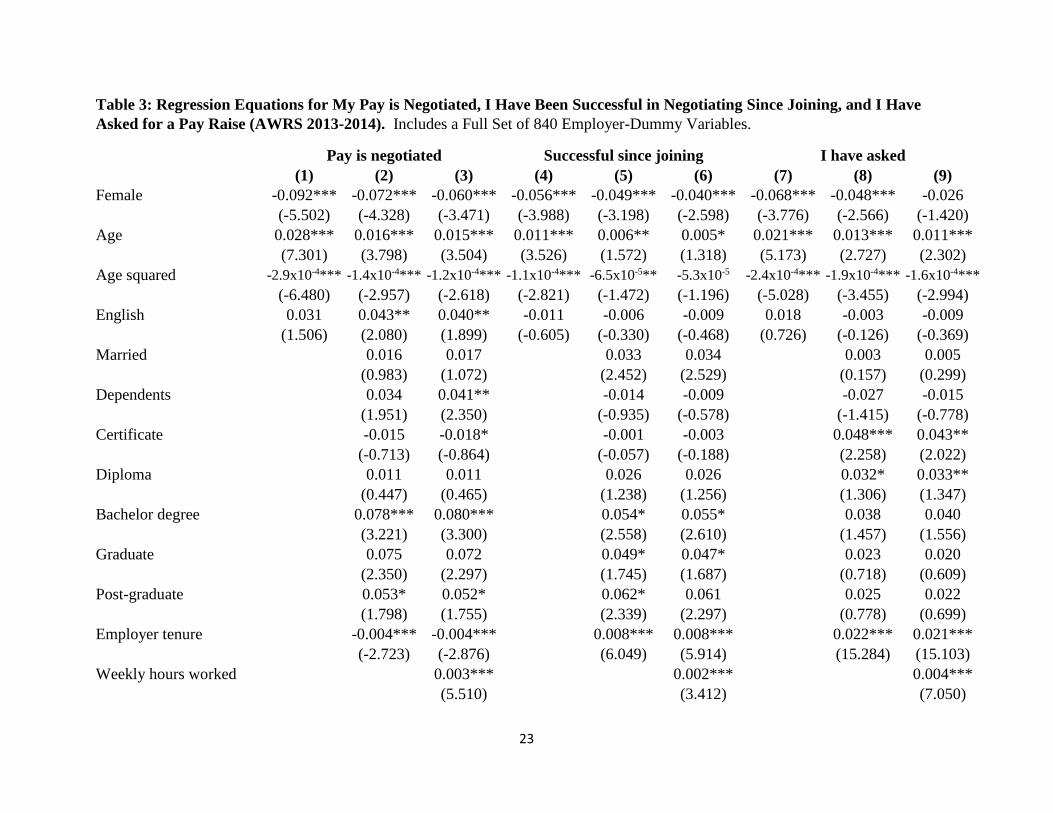
A second way to obtain greater pay is to get a raise in the current job. Table 3 therefore
turns to the question of whether, while in their existing role, women and men say they behave
differently in their asking behavior. In this table, three dependent variables are used. These are
dichotomous answers to questions on ‘My pay is negotiated’, ‘I have successfully obtained a pay
raise while with the employer’, and ‘I have attempted to obtain a pay raise’. In each of these, there
are three columns in the tables, and the regression equations build up to longer specifications in
9 Here, and in later tables, linear probability models are used (probit-equation versions give the same results and are
available from the authors upon request).
9
right-hand columns as more variables are added. The survey does not provide information on how
many times people have asked; hence we treat the data as 0-1.
In each equation of Table 3, a set of employer dummies has been included. This again has
the statistical advantage that a variety of background influences -- that are specific to each
company but not observable to the statistical investigator -- are held constant.
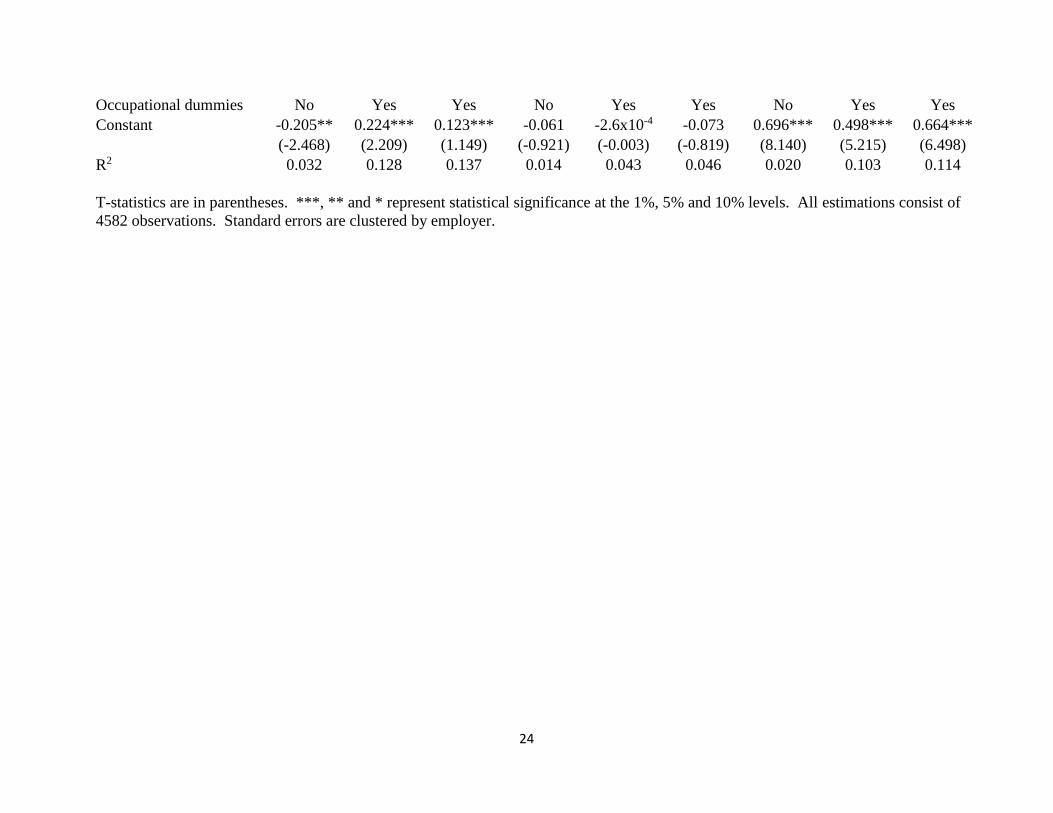
Columns 3 and 6 of Table 3 show some differences between men and women. With a large
number of other covariates included, females are less likely to say that pay is negotiated (with a
coefficient of -0.060 in column 3) in the workplace, and less likely to say they have been successful
in obtaining a salary raise while working for the current employer (with a coefficient of -0.04 in
column 6). Given the mean success rate of 0.16 in the data, this implies that women are one quarter
less likely to obtain a raise. A number of the other independent variables enter significantly in
columns 3 and 6. Age, for example, follows a concave shape. There is evidence that individuals
with higher levels of education are both more likely to be in a job with negotiation and to have
been successful in negotiating a pay raise after they joined the employer. Job tenure enters,
respectively, negatively in the Negotiated column and positively in the Successful column. Those
employees with longer hours of work are more likely to say their pay is set by negotiation, and
also more likely to say they have been successful in obtaining a salary increase.
5. Not Asking or Not Getting?
Is it true that women fail to ask for pay raises? Column 9 of Table 3 sheds some doubt on
that. It demonstrates that the null hypothesis of zero, on the Female dummy variable, cannot be
rejected. The analysis uncovers no statistically significant difference between men and women in
the probability of having asked. Nevertheless, unlike the earlier result on the equal rate of asking
for promotion, this inference rests, importantly, upon the statistical investigator having information
10
about the number of hours worked by each employee. Once the equation includes a variable for
the number of hours worked, then the column 8 coefficient in Table 3 of -0.048 on Female, with a
t-statistic of 2.566, becomes in column 9 a coefficient of -0.026, with a t-statistic of 1.420.
There is an important potential concern here with Type II errors. Nevertheless, -0.026 is a
small coefficient, and not merely a large one for which the null of zero cannot be rejected, so the
dominant effect, in the last three columns of Table 3, is apparently coming not from being a woman
per se. Instead, on closer scrutiny, the appearance of a lack of ‘asking’ is being driven statistically
by working a shorter number of hours. Males who work shorter hours also ‘do not ask’.
To check more fully on whether the insignificance of gender for ‘asking’ is being caused
erroneously, Table 4 explores a further permutation. Here the sample is divided into Part-timers
and Full-timers, where the cut-off is defined as fewer than 38 hours10.
However, Table 3’s substantive conclusions continue to hold. Once again, it is not possible
to reject the null hypothesis of no difference, in the ‘I Have Asked’ columns, between male workers
and female workers. Column 6 of Table 4 seems of interest, because this provides a test for full-
time males compared to full-time females. In column 6 of Table 4, the coefficient on the female
dummy is -0.015, with a small t-statistic of 0.619. Thus again there seems no compelling evidence
here that males and females behave differently. It is impossible, we stress, to be sure that Type II
errors have been avoided. However, even were the point estimate to be taken at face value, the
difference in the asking rate between men and women would be just one and a half percentage
points. We return to this general issue at the end of the paper.
10
The AWRS survey itself defines the cutoff between part-time and full-time work in Australia to be 38 hours per
week. This leads to the potentially anomalous feature that workers doing, say, 36 hours or 37 hours are counted as
part-timers. As a robustness check, however, we tried alternate cutoffs of 35 hours and 40 hours, and found no
qualitative differences in the results. These estimations are available from the authors upon request.
11
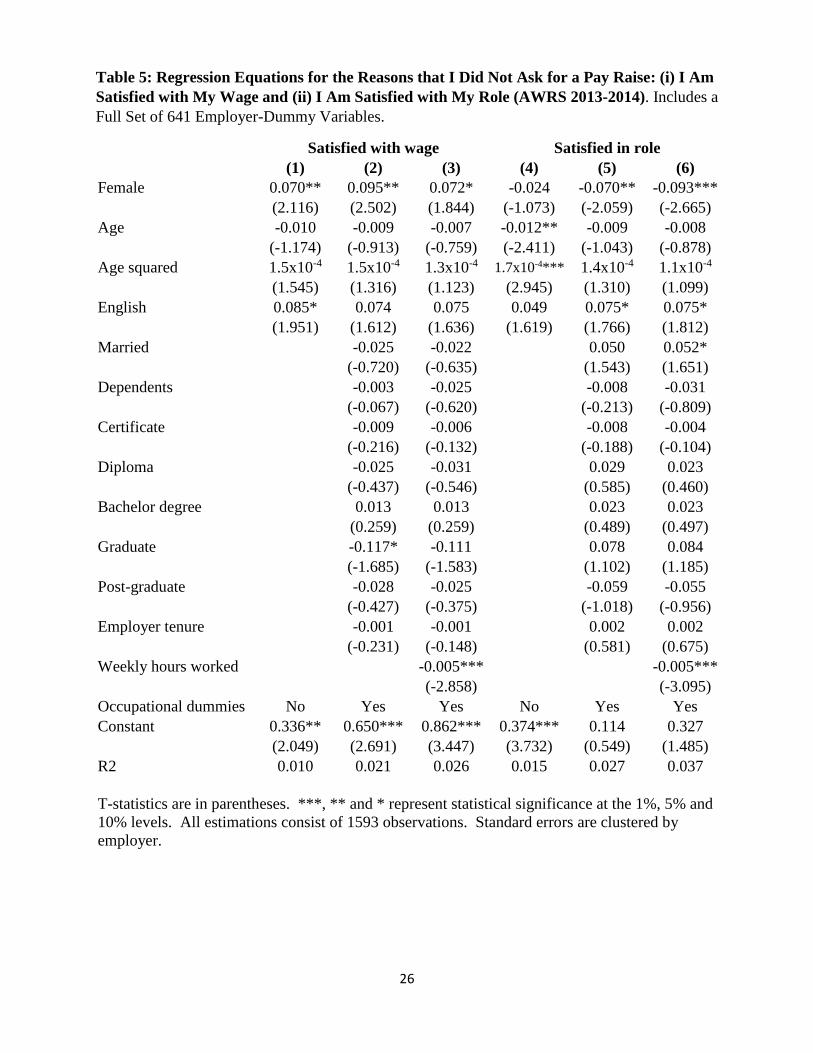
In Table 1a, nearly one third of workers said they had not attempted to get a higher wage.
Among workers who never requested a pay raise, what do they give as reasons for their lack of
asking? Tables 5 and 6 provide regression-equation evidence. These tables test among a variety
of verbatim potential explanations that were offered to the interviewees as part of the AWRS
survey. Column 3 of Table 5 documents weak evidence11 for the fact that women may be being
influenced by the fact they are more satisfied -- than equivalently qualified men -- with their wage
(consistent with results in Clark and Oswald, 1996). However, column 6 of Table 5 implies that
it is not because women are relatively satisfied -- in comparison with the males answering the same
question -- with their actual role in the organization.
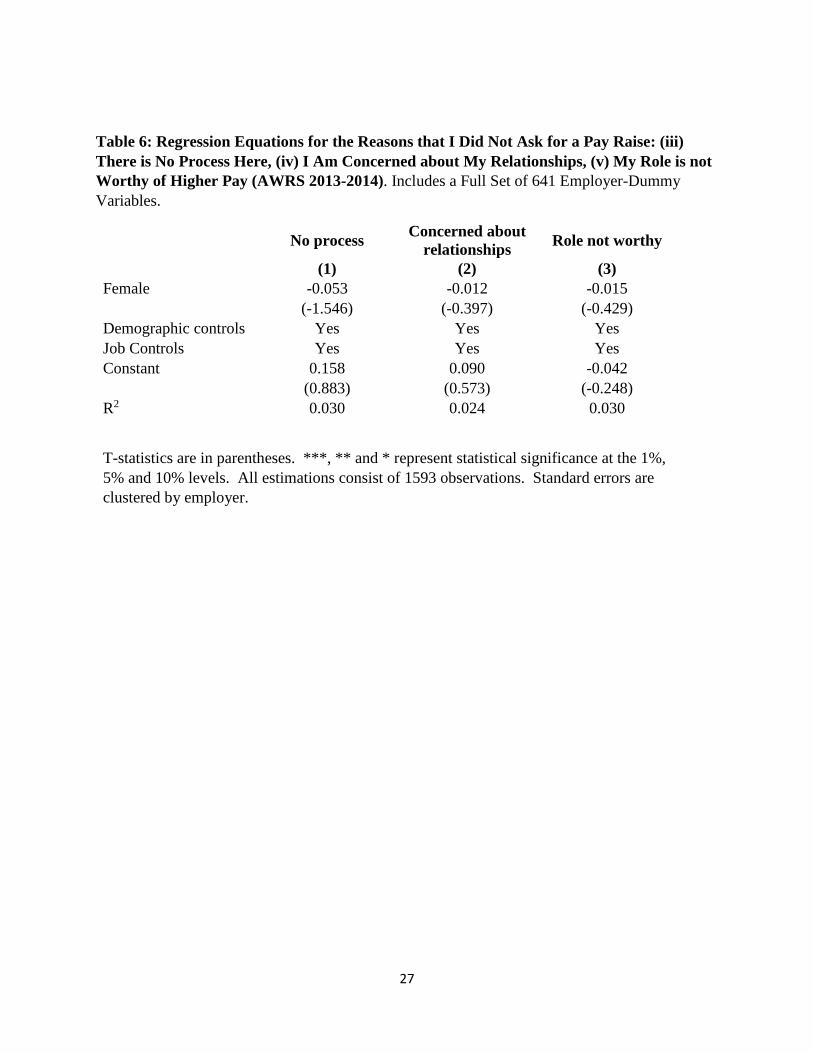
Table 6 explores additional possibilities. It gives regression equations where, in the three
columns, the dependent variables are respectively dichotomous variables for ‘I have not asked for
a salary raise because there is no process here for doing so’; ‘I have not asked for a salary raise
because I am concerned about negative effects on my relationship with my manager/employer’; ‘I
have not asked for a salary raise because my role would not be seen as worthy of a higher wage’.
The female dummy is insignificantly different from zero in each of the columns of Table 6.
Moreover, as before, the key coefficient here (of -0.012) is small, and not merely insignificantly
different from zero. Women are apparently not being influenced by a disproportionate concern
for their relationships.
6. Checks
A large variety of checks were done.
First, although the inclusion of a full set of employer dummies has a number of advantages,
it might be thought that too much statistical power is thereby lost (because some workplaces have
11 We describe this as ‘weak’ because in column 3 of Table 5 the t-statistic on 0.072 is 1.844.
12
only one or two sampled employees). However, we checked that the omission of the 840 dummies
does not alter the paper’s substantive results. As would be expected, it does increase some of the
other variables’ coefficient sizes (these specifications, without the set of employer dummies, are
available from the authors upon request).
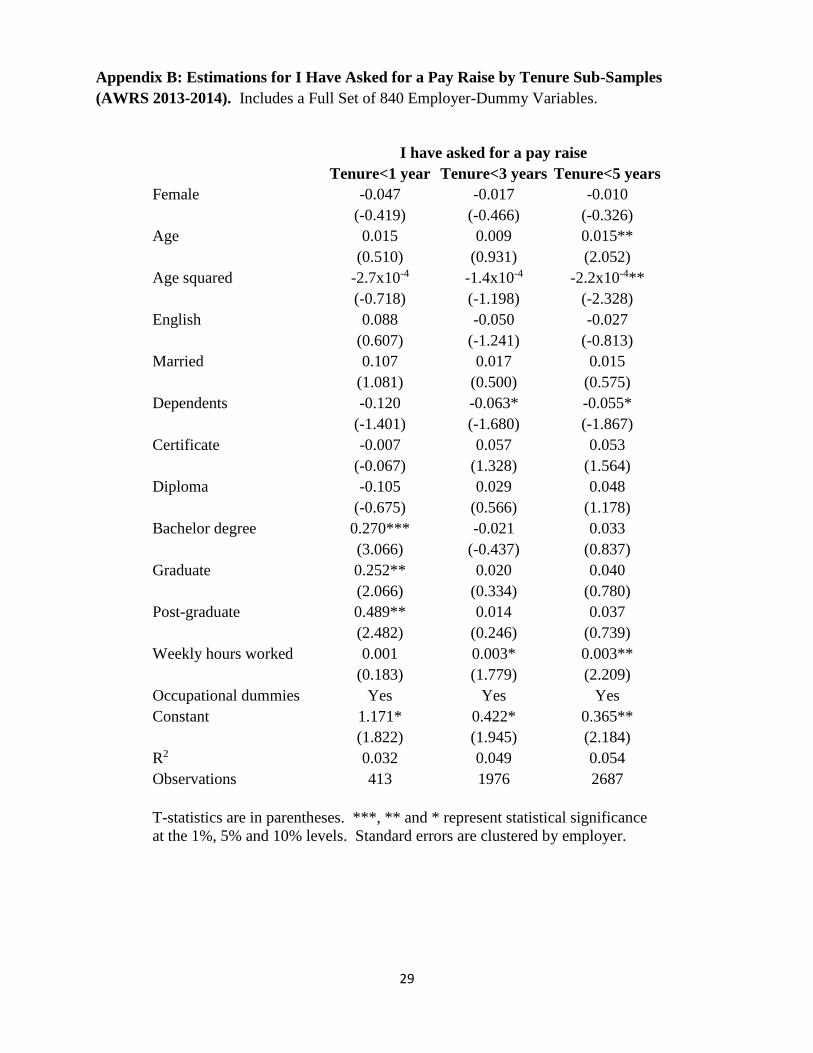
Second, a possible cause for concern is the lack of a measure of frequency-of-times that
workers have asked for a raise at their employer, or a variable for when workers began asking for
raises. It might be that men ask for raises earlier and more frequently than women and that this is
why men are more successful than women at eventually securing a raise. While the AWRS data
do not provide full information on this issue, a suitable variable may lie in workers’ tenure. If men
request raises earlier and more often than women, we should find a statistically significant
difference between newer (lower tenure) male and female employees in their requests for raises.
A check for this was done. Appendix B presents results among workers with less than 1 year, 3
years, and 5 years of tenure – and finds no significant differences between men and women.
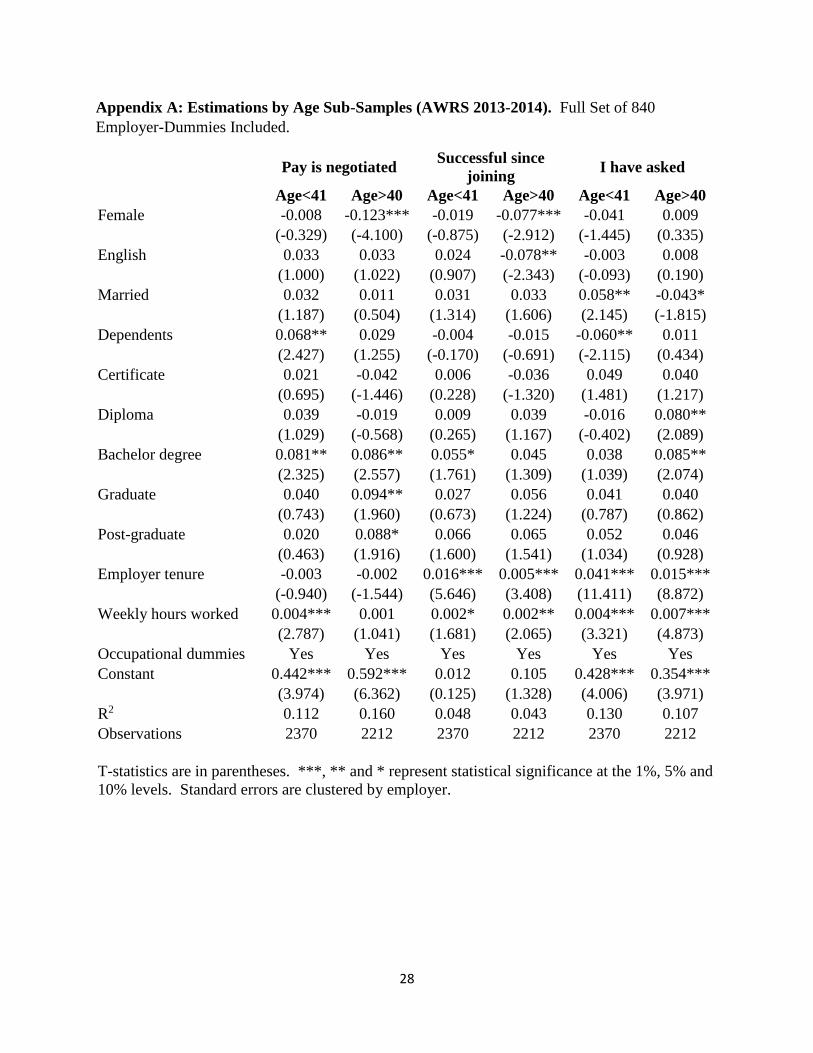
Third, it is relevant to inquire into potential differences across age categories. One
possibility is that there might be some form of cohort effect. It could be that younger generations
of employees have different attitudes to the topic of gender than did their parents. In our data set,
it is not possible to distinguish a true cohort-effect from a true age-effect. However, as in Appendix
A, it is feasible to split the sample into age sub-categories. Interestingly, for workers under the
age of 41, in the table of Appendix A, there appears to be no difference, in a regression-adjusted
sense, between males and females in: whether they are in a job where pay is negotiated; whether
they have been successful in obtaining a raise in pay if they asked for one; whether they did request
such a raise. Overall, in this sample there are differences across age-groups. The younger women
in the labor market appear statistically indistinguishable from the younger men. Hence it could be
13
that negotiating behavior through the years has begun to change. Future research may be able to
decide whether true cohort-effects can be detected.
Fourth, it might be thought that the women-don’t-ask argument could apply to some groups
rather than others. Perhaps elite men (like those in MBA classes of the sort examined in the
seminal work by Babcock and Laschever) ask more than elite women, for example. Hence we
checked Table 3 kinds of specifications for sub-samples. When we split the sample by education
at the median, we found no difference in the female coefficient by education of the worker.
Fifth, a further potential concern is the possible role of trade unions (as union members
may feel that the union negotiates for them rather than they negotiate personally). However,
because we control for employer fixed-effects, it might be hoped that that would adjust for much
of that possible influence. We also adjust for ‘awards’, which in Australia are legal documents
that outline the minimum pay and conditions of employment; there are 122 industry or occupation
awards in Australia.
Sixth, it would be interesting to check the paper’s findings for workers at large numbers of
different points in employers’ hierarchies. Here we have only limited information. However,
when we divided the sample into workers who can be classified as managers (there are 819) or not
managers (there are 3763), in a Has Asked for a Pay Raise equation, the coefficients on the female
dummy were small at, respectively, 0.005 and -0.026, with large standard errors in both cases.
7. Conclusion
This study has been unable to find evidence for the women-don't-ask account of gender
pay differences. The paper has the unusual feature that it is able to exploit information of a kind
not usually recorded in nationally representative data sets. The new survey material makes it
possible to create within-employer estimates to test the hypotheses that, first, women are reluctant
14
to ask for higher pay (Idea 1 in the Introduction) and, second, this occurs because they fear for the
quality of their workplace relationships (Idea 2 in the Introduction). One important reason to do
such a test is that the theory places part of the responsibility for the existence of gender differentials
upon female workers themselves.
The analysis estimates two kinds of ‘asking’ equations: asking for promotion and asking
for pay raises while in the current job. We find that it is not possible to reject the null hypothesis
that males and females behave identically. The paper is able to control for hours of work --
something that was not possible for previous researchers -- so that the comparison being made is
between full-time males and full-time females, and between part-time males and part-time females.
Once that is done, regression equations for the likelihood of ‘asking’ do not show a statistically
significant difference between men and women. In terms of ‘getting’, by contrast, column 6 of
Table 3 reveals that females are less successful. 12
This study cautiously also tries to probe human motives. It estimates equations to test
whether, in considering to ask or not, females are more concerned than males about possible
deleterious effects on their relationships. No evidence is found for that, either, in these data.
Certain caveats should be remembered. First, in this study we have had to rely on what
people tell us in surveys. If, say, men have a disproportionately greater propensity to conceal the
truth, then our results might, in principle, be biased in some way. It is possible that, perhaps as
part of a desire to appear assertive, male workers are more likely than females to claim to have
asked when they have not 13 done so; it is also possible, as has been suggested to us by some
12 In the case of probability of promotion success, however, we found no statistically significant difference. Results
available on request. 13 The authors of the paper would like to record that they are not persuaded about this; it is listed here only as a
conceptual possibility. Moreover, this kind of bias would lead to an under-estimate, not over-estimate, of women’s
rate of asking.
15
readers, that females behave in a subconsciously more emollient way. Second, this data set is for
modern Australia. If that country is unusual, the findings from our study might not apply
elsewhere. Appendix C, however, checks that Australia has the typical kind of gender pay gap of
approximately 15%. Third, our results have concentrated on the case where hours of work are
held constant. This is arguably natural, because we wish here to do a ceteris paribus comparison
between males and females, but we have not attempted to explain the observed difference in the
mean number of working hours between men and women. 14 Fourth, the analysis has not
uncovered exactly why women are paid less than men.
Finally, we would caution the reader on one issue. We are particularly cognizant of the
possibility that this study’s results might be subject to Type II errors. As is often the case in
statistical science, it is hard decisively to rule that out. Nevertheless, such a possibility should
perhaps be seen in perspective. In the case of Table 3, the key estimated Female coefficient (of -
0.026) is small and not merely insignificantly different from zero. In column 6 of Table 4, in fact,
it is just -0.015. Moreover, for tables such as Table 2 and Table 6, the Female coefficients (of
0.013 and -0.012, respectively) have the wrong sign to be consistent with Idea 1 or Idea 2.
14 These differences in working hours presumably stem in part from historical and sociological differences in the
gender roles. See also the ideas in Gregory and Connolly (2008).
16
References
Aigner, D. J. & Cain, G.C. 1977. Statistical theories of discrimination in labor markets. Industrial
& Labor Relations Review 30 (2): 175–87.
Albrecht, J., Bjorklund, A., & Vroman, S. 2003. Is there a glass ceiling in Sweden? Journal of
Labor Economics 21 (1): 145-77.
Arrow, K. 1973. The theory of discrimination. In O. Ashenfelter & A. Rees (Eds.), Discrimination
in Labor Markets, 3-33: Princeton, NJ: Princeton University Press.
Azmat, G. & Petrongolo, B. 2014. Gender and the labour market: What have we learned from field
and lab experiments? Labour Economics 30: 32–40.
Babcock, L., Gelfand, M., Small, D. & Stayn, H. 2006. Gender differences in the propensity to
initiate negotiations. In D. De Cremer, M. Zeelenberg, & J. K. Murnighan, Mahway (Eds.),
Social psychology and economics: 239-62. New Jersey: Lawrence Erlbaum Associates,
Erlbaum, Mahwah, NJ.
Babcock, L. & Laschever, S. 2003. Women don’t ask: Negotiation and the gender divide.
Princeton, NJ & Oxford, UK: Princeton University Press.
Babcock, L. & Laschever, S. 2009. Ask for it: How women can use the power of negotiation to get
what they really want. New York: Bantam Dell, Random House.
Barron, J., Black D. A., & Loewenstein, M.A. 1993. Gender differences in training, capital and
wages. Journal of Human Resources 28 (2): 342–64.
Becker, G. S. 1957. The economics of discrimination. Chicago, IL: University of Chicago Press.
Blackaby, D., Booth, A. L., & Frank, J. 2005. Outside offers and the gender pay gap: Empirical
evidence from the UK academic labour market. Economic Journal 115: F81–F107.
Blau, F. D. and Beller, A.H. 1988. Trends in earnings differentials by gender, 1971-1981.”
Industrial & Labor Relations Review 41 (4): 513-529.
Blau, F. D. & Kahn, L.M. 2016. The gender wage gap: Extent, trends, and explanations. Journal
of Economic Literature, forthcoming.
Bongiorno, R., Bain, P. G., & David, B. (2014). If you're going to be a leader, at least act like it!
Prejudice toward women who are tentative in leader roles. British Journal of Social
Psychology, 53, 217-234.
17
Booth, A. L. & Nolen, P. 2012. Gender differences in competition: the role of single-sex education.
Journal of Economic Behavior and Education, 81: 542-555.
Bowles, H. R., Babcock, L. & Lai, L. 2007. Social incentives for sex differences in the propensity
to initiate negotiation: sometimes it does hurt to ask. Organizational Behavior and Human
Decision Processes, 103: 84–103.
Card, D., Rute Cardoso, A., & Kline, P. (2016). Bargaining, Sorting, and the Gender Wage Gap:
Quantifying the Impact of Firms on the Relative Pay of Women. Quarterly Journal of
Economics, 131: 633-686.
Clark, A.E. & Oswald, A.J. 1996. Satisfaction and comparison income. Journal of Public
Economics 61: 359-381.
Croson, R. & Gneezy, U. 2009. Gender differences in preferences. Journal of Economic
Literature, 47:448–74.
Eagly, A. H. 1987. Sex differences in social behavior: A social-role interpretation. Hillsdale, NJ:
Erlbaum.
Eagly, A. H. & Karau, S. J. 2002. Role congruity theory of prejudice toward female leaders.
Psychological Review, 109(3): 573- 598.
Exley, C. L., Niederle, M., & Vesterlund, L. (2016). Knowing when to ask: The cost of leaning in.
Working paper. Stanford University.
Flory, J., Leibbrandt, A. & List, J. A. 2015. Do competitive workplaces deter female workers? A
large-scale natural field experiment on job entry decisions. Review of Economic Studies,
82(1): 122-155.
Frank, R., H. 1978. Why women earn less: The theory and estimation of differential over-
qualification. American Economic Review 68 (3): 360-73.
Garrat, R. J., Weinberger, C. & Johnson N. 2013. The state street mil: Age and gender differences
in competition-aversion in the field. Economic Inquiry, 51(1): 806–815.
Gneezy, U., Leonard, K. L. & List, J. A. 2009. Gender differences in competition: Evidence from
a matrilineal and a patriarchal society. Econometrica, 77: 1637-1664.
Gneezy, U., Niederle, M. & Rustichini, A. 2003. Performance in competitive environments:
Gender differences. Quarterly Journal of Economics, 118(3): 1049-1074.
Goodall, A.H. & Osterloh, M. 2016. Random selection of female leaders. Working paper, Cass
Business School and University of Zurich.
18
Gregory, M. & Connolly, S. 2008. Feature: The price of reconciliation: Part-time work, families
and women’s satisfaction. Economic Journal, 118(526): F1-F7.
Gregory-Smith, I., Main B.G.M. & O’Reilly, C.A. 2014. Appointments, pay, and performance in
UK boardrooms by gender. Economic Journal, 124(574): F109-F128.
Guenther, C., Ekinci, N. A., Schwieren, C. & Strobel, M. 2010. Women can’t jump? – An
experiment on competitive attitudes and stereotype threat. Journal of Economic Behavior
& Organization, 75(3): 395-401.
Hall, R.E. & Krueger, A.B. 2012. Evidence on the incidence of wage posting, wage bargaining,
and on-the-job search. American Economic Journal: Macroeconomics 4: 56-67.
Heilman, M. E. 2001. Description and prescription: How gender stereotypes prevent women’s
ascent up the organizational ladder. Journal of Social Issues, 57: 657-674.
Heilman, M. E. & Okimoto, T. G. 2007. Why are women penalized for success at male tasks? The
implied communality deficit. Journal of Applied Psychology, 92: 81-92.
Inzlicht, M. 2011. Stereotype threat: Theory, process, and application. Oxford: Oxford University
Press.
Lazear, E. P. & Rosen, S. 1990. Male-female wage differentials in job ladders. Journal of Labor
Economics, 8(1): 106-123.
Leibbrandt, A. & List, J.A. 2015. Do women avoid salary negotiations? Evidence from a large-
scale natural field experiment. Management Science, 61(9): 2016-2024.
Mazei, J., Hueffmeier, J., Freund, P.A., et al. 2015. A meta-analysis on gender differences in
negotiation outcomes and their moderators. Psychological Bulleting, 141(1): 85-104.
McGovern, P., Hill, S., Mills, C., &White, M. 2007. Market, Class, and Employment, Oxford:
Oxford University Press. Chapter 4.
Merton, R. K. 1948. The self-fulfilling prophecy. Antioch Review, 8: 193–210.
Niederle, M. & Vesterlund, L. 2007. Do women shy away from competition? Do men compete
too much? Quarterly Journal of Economics, 122(3): 1067-1101.
Niederle, M. & Vesterlund, L. 2010. Explaining the gender gap in math test scores: The role of
competition. Journal of Economic Perspectives, 24(2): 129–144.
Niederle, M. & Vesterlund, L. 2011. Gender and competition. Annual Review of Economics, 3:
601-630.
19
Phelan, J., Moss-Racusin, C. & Rudman, L. 2008. Competent yet out in the Cold: Shifting criteria
for hiring reflect backlash toward agentic women. Psychology of Women Quarterly, 32(4):
406-413.
Sandberg, S. 2013. Lean In: Women, Work, and the Will to Lead, Random House: New York.
Schmader, T. & Johns, M. 2003. Converging evidence that stereotype threat reduces working
memory capacity. Journal of Personality and Social Psychology, 85: 440–452.
Shurchkov, O. 2012. Under pressure: Gender differences in output quality and quantity under
competition and time constraints. Journal of the European Economic Association, 10(5):
1189-1213.
Spencer, S. J., Steele, C. M. & Quinn, D. M. 1999. Stereotype threat and women’s math
performance. Journal of Experimental Social Psychology, 35(1): 4–28.
20
Table 1A: Descriptive statistics (AWRS data 2013-2014)
Number of observations: 4582 employees across 840 employers
Whole sample
Variable Description Mean SD
Female = 1 if worker is female and 0 if male 0.576 0.494
Age Age of worker in years 40.374 12.506
Age squared Age of worker squared 1,786.403 1,049.501
English = 1 if English is primary language; 0 otherwise 0.860 0.347
Married = 1 if married and 0 if not 0.519 0.500
Dependents = 1 if worker has children 15 or younger; 0 if not 0.327 0.469
Secondary = 1 if completed secondary education; 0 if not 0.241 0.428
Certificate = 1 if completed certificate education; 0 if not 0.254 0.435
Diploma = 1 if completed diploma education; 0 if not 0.147 0.354
Bachelor degree = 1 if completed bachelor education; 0 if not 0.201 0.401
Graduate = 1 if completed graduate education; 0 if not 0.064 0.244
Post-graduate = 1 if completed postgraduate education; 0 if not 0.093 0.291
Employer tenure Length of time spent with employer in years 5.808 6.039
Weekly hours
worked Usual weekly hours worked 37.154 10.882
Part time job = 1 if weekly hours worked is less than 38; 0 if not 0.359 0.480
Pay is negotiated = 1 if salary is a “negotiated amount with employer”
and 0 otherwise 0.389 0.488
Successful
= 1 if “successfully attained a better wage/salary
through negotiating with the manager/employer
(without changing roles) and 0 if not
0.160 0.367
Has asked for raise
= 1 if “attempted to attain a better wage/salary since
commencing employment with this employer” and 0
otherwise
0.696 0.460
Has asked for
promotion
= 1 if “attempted to get a promotion” and 0
otherwise 0.891 0.312
Satisfied with wage = 1 if “satisfied with wage/salary” and 0 otherwise 0.338 0.473
No process
= 1 if “there is no process/procedure to be able to
access a better wage to perform role” and 0
otherwise
0.213 0.410
Concerned about
relationships
= 1 if “concerned about negative effects on
relationship with manager/employer” and 0
otherwise
0.136 0.342
Role not worthy = 1 if “role wouldn’t be seen by manager/employer
as worthy of a higher wage” and 0 otherwise 0.150 0.357
Satisfied in role = 1 if “satisfied in role” and 0 otherwise 0.235 0.424
21
Table 1B: Gender sub-sample statistics (AWRS 2013-2014)
Males Females
Variable Mean SD Mean SD
Age 41.124 12.393 39.820 12.561
Age squared 1,844.738 1,061.886 1,743.376 1,038.375
English 0.852 0.355 0.866 0.341
Married 0.579 0.494 0.475 0.499
Dependents 0.369 0.483 0.297 0.457
Secondary 0.245 0.430 0.238 0.426
Certificate 0.270 0.444 0.242 0.429
Diploma 0.136 0.343 0.155 0.362
Bachelor degree 0.192 0.394 0.208 0.406
Graduate 0.059 0.236 0.067 0.250
Post-graduate 0.098 0.298 0.089 0.286
Employer tenure 6.107 6.335 5.588 5.802
Part time job 0.174 0.379 0.496 0.500
Weekly hours worked 41.602 9.862 33.873 10.426
‘Pay is negotiated’ 0.477 0.500 0.325 0.468
‘Successful since joining’ 0.200 0.400 0.131 0.337
‘I have asked for pay raise’ 0.745 0.436 0.660 0.474
‘I have asked for promotion’ 0.902 0.298 0.883 0.322
‘Satisfied with wage’ 0.361 0.481 0.324 0.468
‘No process’ 0.182 0.387 0.231 0.422
‘Concerned about relationships’ 0.146 0.354 0.129 0.336
‘Role not worthy’ 0.160 0.367 0.144 0.352
‘Satisfied in role’ 0.251 0.434 0.225 0.418
The variable ‘pay is negotiated’ is a dummy for whether the employee says that pay levels are fixed by negotiation
with the employer. ‘Successful since joining’ is a dummy for having attained a higher salary during this job tenure
with the current employer. ‘I have asked for pay raise’ is a dummy for having requested a greater salary during this
job tenure with the current employer. ‘I have asked for promotion’ is a dummy for having requested a promotion
with the current employer. ‘Satisfied with wage’ is a dummy for reporting that I am satisfied with my income in the
job with the current employer. ‘No process’ is a dummy for reporting that there is no process in this job for
obtaining a higher salary. ‘Concerned about relationships’ is a dummy for answering yes to “Why have you not
attempted to attain a higher salary… I’m concerned about negative effects on my relationship with my
manager/employer.” ‘Role not worthy’ is a dummy for answering yes to “Why have you not attempted to attain a
higher salary… My role wouldn’t be seen by my manager/employer as worthy of a higher wage.” ‘Satisfied in role’
is a dummy for answering yes to “Why have you not attempted to attain a higher salary… I am satisfied in my role.”
22
Table 2: Regression Equations for I Have Asked for a Promotion (AWRS 2013-2014).
Includes a Full Set of 840 Employer-Dummy Variables.
I have asked for a promotion
(1) (2) (3)
Female -0.008 0.003 0.013 (-0.717) (0.199) (0.971)
Age 0.015*** 0.011*** 0.010*** (4.698) (3.341) (3.019)
Age squared -1.6x10⁻⁴*** -1.3x10⁻⁴*** -1.2x10⁻⁴*** (-4.259) (-3.263) (-2.896)
English -0.003 -0.014 -0.017 (-0.206) (-0.877) (-1.067)
Married
1.8x10⁻⁴ 0.001
(0.014) (0.108)
Dependents
-0.004 0.002
(-0.297) (0.167)
Certificate
0.022 0.019
(1.581) (1.389)
Diploma
0.016 0.016
(0.912) (0.937)
Bachelor degree
-0.008 -0.007
(-0.449) (-0.374)
Graduate
0.000 -0.002
(0.007) (-0.068)
Post-graduate
-0.023 -0.024
(-0.981) (-1.035)
Employer tenure
0.004*** 0.004*** (4.932) (4.741)
Weekly hours worked
0.002*** (3.803)
Occupational dummies No Yes Yes
Constant 0.573*** 0.737*** 0.652*** (8.623) (9.970) (8.480)
R2 0.014 0.040 0.047
T-statistics are in parentheses. ***, ** and * represent statistical significance
at the 1%, 5% and 10% levels. All estimations consist of 4582 observations.
Standard errors are clustered by employer.
23
Table 3: Regression Equations for My Pay is Negotiated, I Have Been Successful in Negotiating Since Joining, and I Have
Asked for a Pay Raise (AWRS 2013-2014). Includes a Full Set of 840 Employer-Dummy Variables.
Pay is negotiated Successful since joining I have asked (1) (2) (3) (4) (5) (6) (7) (8) (9)
Female -0.092*** -0.072*** -0.060*** -0.056*** -0.049*** -0.040*** -0.068*** -0.048*** -0.026 (-5.502) (-4.328) (-3.471) (-3.988) (-3.198) (-2.598) (-3.776) (-2.566) (-1.420)
Age 0.028*** 0.016*** 0.015*** 0.011*** 0.006** 0.005* 0.021*** 0.013*** 0.011*** (7.301) (3.798) (3.504) (3.526) (1.572) (1.318) (5.173) (2.727) (2.302)
Age squared -2.9x10⁻⁴*** -1.4x10⁻⁴*** -1.2x10⁻⁴*** -1.1x10⁻⁴*** -6.5x10⁻⁵** -5.3x10⁻⁵ -2.4x10⁻⁴*** -1.9x10⁻⁴*** -1.6x10⁻⁴*** (-6.480) (-2.957) (-2.618) (-2.821) (-1.472) (-1.196) (-5.028) (-3.455) (-2.994)
English 0.031 0.043** 0.040** -0.011 -0.006 -0.009 0.018 -0.003 -0.009 (1.506) (2.080) (1.899) (-0.605) (-0.330) (-0.468) (0.726) (-0.126) (-0.369)
Married 0.016 0.017 0.033 0.034 0.003 0.005 (0.983) (1.072) (2.452) (2.529) (0.157) (0.299)
Dependents 0.034 0.041** -0.014 -0.009 -0.027 -0.015 (1.951) (2.350) (-0.935) (-0.578) (-1.415) (-0.778)
Certificate -0.015 -0.018* -0.001 -0.003 0.048*** 0.043** (-0.713) (-0.864) (-0.057) (-0.188) (2.258) (2.022)
Diploma 0.011 0.011 0.026 0.026 0.032* 0.033** (0.447) (0.465) (1.238) (1.256) (1.306) (1.347)
Bachelor degree 0.078*** 0.080*** 0.054* 0.055* 0.038 0.040 (3.221) (3.300) (2.558) (2.610) (1.457) (1.556)
Graduate 0.075 0.072 0.049* 0.047* 0.023 0.020 (2.350) (2.297) (1.745) (1.687) (0.718) (0.609)
Post-graduate 0.053* 0.052* 0.062* 0.061 0.025 0.022 (1.798) (1.755) (2.339) (2.297) (0.778) (0.699)
Employer tenure -0.004*** -0.004*** 0.008*** 0.008*** 0.022*** 0.021*** (-2.723) (-2.876) (6.049) (5.914) (15.284) (15.103)
Weekly hours worked 0.003*** 0.002*** 0.004*** (5.510) (3.412) (7.050)
24
Occupational dummies No Yes Yes No Yes Yes No Yes Yes
Constant -0.205** 0.224*** 0.123*** -0.061 -2.6x10⁻⁴ -0.073 0.696*** 0.498*** 0.664*** (-2.468) (2.209) (1.149) (-0.921) (-0.003) (-0.819) (8.140) (5.215) (6.498)
R2 0.032 0.128 0.137 0.014 0.043 0.046 0.020 0.103 0.114
T-statistics are in parentheses. ***, ** and * represent statistical significance at the 1%, 5% and 10% levels. All estimations consist of
4582 observations. Standard errors are clustered by employer.
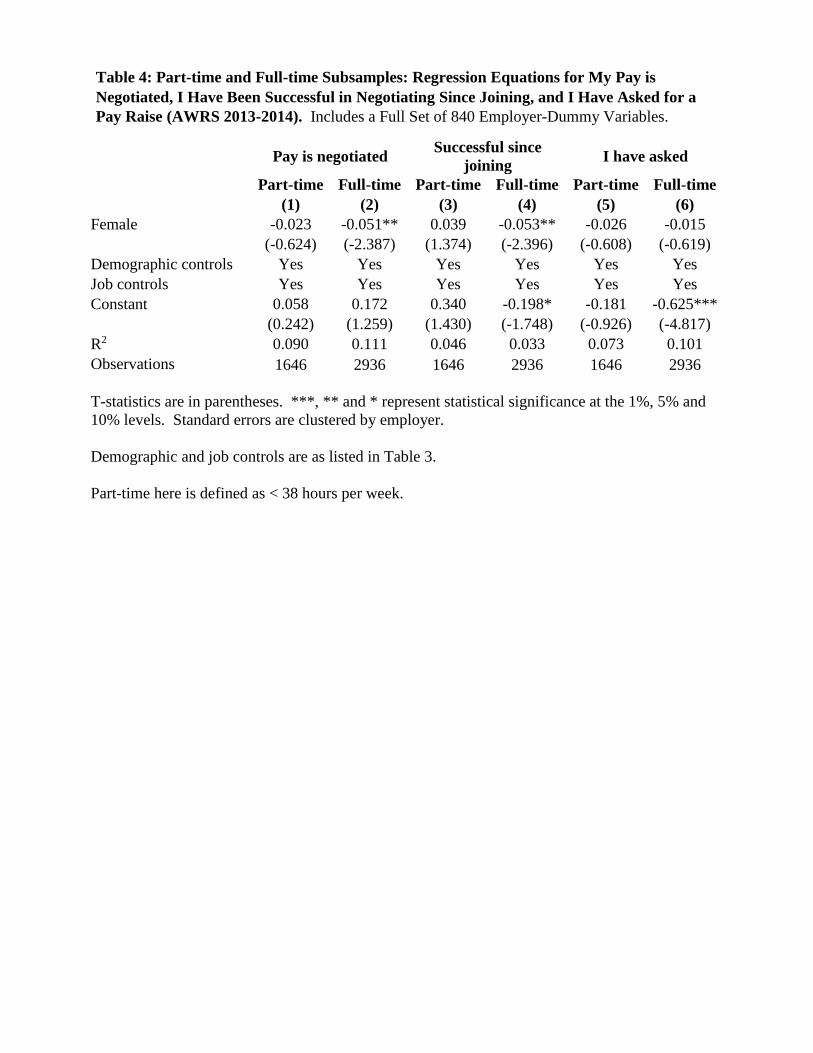
Table 4: Part-time and Full-time Subsamples: Regression Equations for My Pay is
Negotiated, I Have Been Successful in Negotiating Since Joining, and I Have Asked for a
Pay Raise (AWRS 2013-2014). Includes a Full Set of 840 Employer-Dummy Variables.
Pay is negotiated
Successful since
joining I have asked
Part-time Full-time Part-time Full-time Part-time Full-time (1) (2) (3) (4) (5) (6)
Female -0.023 -0.051** 0.039 -0.053** -0.026 -0.015 (-0.624) (-2.387) (1.374) (-2.396) (-0.608) (-0.619)
Demographic controls Yes Yes Yes Yes Yes Yes
Job controls Yes Yes Yes Yes Yes Yes
Constant 0.058 0.172 0.340 -0.198* -0.181 -0.625*** (0.242) (1.259) (1.430) (-1.748) (-0.926) (-4.817)
R2 0.090 0.111 0.046 0.033 0.073 0.101
Observations 1646 2936 1646 2936 1646 2936
T-statistics are in parentheses. ***, ** and * represent statistical significance at the 1%, 5% and
10% levels. Standard errors are clustered by employer.
Demographic and job controls are as listed in Table 3.
Part-time here is defined as < 38 hours per week.
26
Table 5: Regression Equations for the Reasons that I Did Not Ask for a Pay Raise: (i) I Am
Satisfied with My Wage and (ii) I Am Satisfied with My Role (AWRS 2013-2014). Includes a
Full Set of 641 Employer-Dummy Variables.
Satisfied with wage Satisfied in role (1) (2) (3) (4) (5) (6)
Female 0.070** 0.095** 0.072* -0.024 -0.070** -0.093*** (2.116) (2.502) (1.844) (-1.073) (-2.059) (-2.665)
Age -0.010 -0.009 -0.007 -0.012** -0.009 -0.008 (-1.174) (-0.913) (-0.759) (-2.411) (-1.043) (-0.878)
Age squared 1.5x10⁻⁴ 1.5x10⁻⁴ 1.3x10⁻⁴ 1.7x10⁻⁴*** 1.4x10⁻⁴ 1.1x10⁻⁴ (1.545) (1.316) (1.123) (2.945) (1.310) (1.099)
English 0.085* 0.074 0.075 0.049 0.075* 0.075* (1.951) (1.612) (1.636) (1.619) (1.766) (1.812)
Married -0.025 -0.022 0.050 0.052* (-0.720) (-0.635) (1.543) (1.651)
Dependents -0.003 -0.025 -0.008 -0.031 (-0.067) (-0.620) (-0.213) (-0.809)
Certificate -0.009 -0.006 -0.008 -0.004 (-0.216) (-0.132) (-0.188) (-0.104)
Diploma -0.025 -0.031 0.029 0.023 (-0.437) (-0.546) (0.585) (0.460)
Bachelor degree 0.013 0.013 0.023 0.023 (0.259) (0.259) (0.489) (0.497)
Graduate -0.117* -0.111 0.078 0.084 (-1.685) (-1.583) (1.102) (1.185)
Post-graduate -0.028 -0.025 -0.059 -0.055 (-0.427) (-0.375) (-1.018) (-0.956)
Employer tenure -0.001 -0.001 0.002 0.002 (-0.231) (-0.148) (0.581) (0.675)
Weekly hours worked -0.005*** -0.005*** (-2.858) (-3.095)
Occupational dummies No Yes Yes No Yes Yes
Constant 0.336** 0.650*** 0.862*** 0.374*** 0.114 0.327 (2.049) (2.691) (3.447) (3.732) (0.549) (1.485)
R2 0.010 0.021 0.026 0.015 0.027 0.037
T-statistics are in parentheses. ***, ** and * represent statistical significance at the 1%, 5% and
10% levels. All estimations consist of 1593 observations. Standard errors are clustered by
employer.
27
Table 6: Regression Equations for the Reasons that I Did Not Ask for a Pay Raise: (iii)
There is No Process Here, (iv) I Am Concerned about My Relationships, (v) My Role is not
Worthy of Higher Pay (AWRS 2013-2014). Includes a Full Set of 641 Employer-Dummy
Variables.
No process Concerned about
relationships Role not worthy
(1) (2) (3)
Female -0.053 -0.012 -0.015 (-1.546) (-0.397) (-0.429)
Demographic controls Yes Yes Yes
Job Controls Yes Yes Yes
Constant 0.158 0.090 -0.042 (0.883) (0.573) (-0.248)
R2 0.030 0.024 0.030
T-statistics are in parentheses. ***, ** and * represent statistical significance at the 1%,
5% and 10% levels. All estimations consist of 1593 observations. Standard errors are
clustered by employer.
28
Appendix A: Estimations by Age Sub-Samples (AWRS 2013-2014). Full Set of 840
Employer-Dummies Included.
Pay is negotiated Successful since
joining I have asked
Age<41 Age>40 Age<41 Age>40 Age<41 Age>40
Female -0.008 -0.123*** -0.019 -0.077*** -0.041 0.009 (-0.329) (-4.100) (-0.875) (-2.912) (-1.445) (0.335)
English 0.033 0.033 0.024 -0.078** -0.003 0.008 (1.000) (1.022) (0.907) (-2.343) (-0.093) (0.190)
Married 0.032 0.011 0.031 0.033 0.058** -0.043* (1.187) (0.504) (1.314) (1.606) (2.145) (-1.815)
Dependents 0.068** 0.029 -0.004 -0.015 -0.060** 0.011 (2.427) (1.255) (-0.170) (-0.691) (-2.115) (0.434)
Certificate 0.021 -0.042 0.006 -0.036 0.049 0.040 (0.695) (-1.446) (0.228) (-1.320) (1.481) (1.217)
Diploma 0.039 -0.019 0.009 0.039 -0.016 0.080** (1.029) (-0.568) (0.265) (1.167) (-0.402) (2.089)
Bachelor degree 0.081** 0.086** 0.055* 0.045 0.038 0.085** (2.325) (2.557) (1.761) (1.309) (1.039) (2.074)
Graduate 0.040 0.094** 0.027 0.056 0.041 0.040 (0.743) (1.960) (0.673) (1.224) (0.787) (0.862)
Post-graduate 0.020 0.088* 0.066 0.065 0.052 0.046 (0.463) (1.916) (1.600) (1.541) (1.034) (0.928)
Employer tenure -0.003 -0.002 0.016*** 0.005*** 0.041*** 0.015*** (-0.940) (-1.544) (5.646) (3.408) (11.411) (8.872)
Weekly hours worked 0.004*** 0.001 0.002* 0.002** 0.004*** 0.007*** (2.787) (1.041) (1.681) (2.065) (3.321) (4.873)
Occupational dummies Yes Yes Yes Yes Yes Yes
Constant 0.442*** 0.592*** 0.012 0.105 0.428*** 0.354*** (3.974) (6.362) (0.125) (1.328) (4.006) (3.971)
R2 0.112 0.160 0.048 0.043 0.130 0.107
Observations 2370 2212 2370 2212 2370 2212
T-statistics are in parentheses. ***, ** and * represent statistical significance at the 1%, 5% and
10% levels. Standard errors are clustered by employer.
29
Appendix B: Estimations for I Have Asked for a Pay Raise by Tenure Sub-Samples
(AWRS 2013-2014). Includes a Full Set of 840 Employer-Dummy Variables.
I have asked for a pay raise
Tenure<1 year Tenure<3 years Tenure<5 years
Female -0.047 -0.017 -0.010 (-0.419) (-0.466) (-0.326)
Age 0.015 0.009 0.015**
(0.510) (0.931) (2.052)
Age squared -2.7x10⁻⁴ -1.4x10⁻⁴ -2.2x10⁻⁴**
(-0.718) (-1.198) (-2.328)
English 0.088 -0.050 -0.027 (0.607) (-1.241) (-0.813)
Married 0.107 0.017 0.015 (1.081) (0.500) (0.575)
Dependents -0.120 -0.063* -0.055* (-1.401) (-1.680) (-1.867)
Certificate -0.007 0.057 0.053 (-0.067) (1.328) (1.564)
Diploma -0.105 0.029 0.048 (-0.675) (0.566) (1.178)
Bachelor degree 0.270*** -0.021 0.033 (3.066) (-0.437) (0.837)
Graduate 0.252** 0.020 0.040 (2.066) (0.334) (0.780)
Post-graduate 0.489** 0.014 0.037 (2.482) (0.246) (0.739)
Weekly hours worked 0.001 0.003* 0.003** (0.183) (1.779) (2.209)
Occupational dummies Yes Yes Yes
Constant 1.171* 0.422* 0.365** (1.822) (1.945) (2.184)
R2 0.032 0.049 0.054
Observations 413 1976 2687
T-statistics are in parentheses. ***, ** and * represent statistical significance
at the 1%, 5% and 10% levels. Standard errors are clustered by employer.
30
Appendix C: Log-Wage Estimations (AWRS 2013-2014). Includes a full set of Employer-
Dummy Variables.
(1) (2) (3)
Female -0.385*** -0.289*** -0.147*** (-10.878) (-6.976) (-3.708)
Age 0.062*** 0.051*** 0.038***
(7.912) (5.942) (4.700)
Age squared -6.9x10⁻⁴*** -5.8x10⁻⁴*** -4.1x10⁻⁴***
(-7.464) (-5.818) (-4.381)
English -0.015 -0.016 -0.056 (-0.253) (-0.280) (-0.976)
Married -0.029 -0.014 (-0.865) (-0.419)
Dependents -0.070* 0.010 (-1.933) (0.302)
Certificate 0.068 0.037 (1.587) (0.914)
Diploma 0.014 0.017 (0.263) (0.332)
Bachelor degree 0.156*** 0.173*** (2.989) (3.497)
Graduate 0.115 0.091 (1.427) (1.192)
Post-graduate 0.274*** 0.261*** (3.677) (3.742)
Employer Tenure 0.009*** 0.007**
(3.287) (2.575)
Weekly hours worked 0.030*** (15.134)
Occupational dummies No Yes Yes
Constant 4.322*** 4.888*** 3.755*** (25.563) (24.036) (18.259)
R2 0.075 0.175 0.272
Observations 4467 4467 4467
T-statistics are in parentheses. ***, ** and * represent statistical significance
at the 1%, 5% and 10% levels. Standard errors are clustered by employer.
31
Appendix D: Extracts from the Questionnaire Wording in the AWRS Survey
Method of Setting Pay C1 How is your wage/salary determined?
Please select one response only
CODE FRAMES MOSP Negotiated amount with my employer 1
By an enterprise agreement (EBA) 2
By an award (i.e. the relevant pay rate contained in the award, and no more) 3
My employer offered me an amount that was more than the award/standard rate,
and I accepted
4
Other (Please specify) 990
Don’t know 997
Salary Negotiations (After Commencement) C2 Which of the following best describes the actions you have taken in relation to your
wage/salary since you commenced your employment with your employer?
Please select all that apply
[PROGRAMMER: A RESPONDENT CAN’T BE CODE 7 IF THEY ARE CODE 4, AND
CAN’T BE CODE 6 IF THEY ARE CODES 2, 3 OR 5]
CODE FRAMES SALNEG1 I received a better wage/salary without pursuing it 1
I have successfully attained a better wage/salary for myself through a promotion 2
I have successfully attained a better wage/salary for myself through negotiating
with my manager/employer (i.e. without changing roles)
3
I have attempted to attain a better wage/salary for myself though applying for a
promotion, but have been unsuccessful
4
I have attempted to attain a better wage/salary for myself in my role, but was
unsuccessful (e.g. request refused or ignored)
5
I have not attempted to attain a better wage/salary for myself since I commenced
employment with this employer
6
I have not attempted to get a promotion 7
Prefer not to say 998
Why No Salary Negotiations [ASK IF C2 (SALNEG) = CODE 6 OR CODE 7]
C2a Why have you not attempted to attain a better wage/promotion for yourself since you
commenced your employment?
Please select all that apply
CODE FRAMES SALNEG2 I’m satisfied with my wage/salary 1
There is no process/procedure to be able to access a better wage to perform my role 2
I’m concerned about negative effects on my relationship with my
manager/employer
3
My role wouldn’t be seen by my manager/employer as worthy of a higher wage 4
I am satisfied in my role 5
Other (Please specify) 990
Prefer not to say 998