Embed Size (px)
Citation preview
ABSTRACTS OF SCIENTIFIC PAPERS COMPUTERS IN ANESTHESIA VI October 9-11 Asilomar Conference Center Pacific Grove, California Sponsored by Department qf Anesthesia The University of Iowa College of Medicine
PROGRAM COMMITTEE Franklin L. Scamman, MD, Progra,, Chairman
and Abstracts Editor Larry M. Minthorn Robert Block, PhD Ruth E. Wachtel, PhD Edward S. A. Wegrzynowicz, MD
PROGRAM SECRETARY Amaette Meyer
COMPUTER STORAGE OF MASS SPECTROMETER DATA IV. Dettinger, AAS, C. A. Munshi, MD, and H. B. Hart, BS, LPN, Milwaukee, WI
For two years we have been using a mass spectrometer to moni tor inspired and expired concentrations o f anesthetic gases and selected respiratory variables in 11 operating rooms. Currently, a printer is used to preserve selected data from the mass spectrometer. Storage o f the data on computer disks would be easier and much more convenient. We have devel- oped a computerized system that can be used to permanently store, retrieve, and display respiratory data obtained from a mass spectrometer system.
The system incorporates a Perkin-Elmer MGA-1100A mass spectrometer, an IBM Personal Compute r (256K with two disk drives), an RS-232 interface cable, and two BASIC com- puter language programs. The mass spectrometer is equipped with an RS-232 input /output port from which all inspiratory and expiratory data are available. The BASIC storage pro- gram has several functions. It sends a request to the mass spectrometer to transmit data as they are generated. For our system, the types o f data sent are inspiratory and expiratory values of CO_~, 02, N 2 0 , N2, enflurane, halothane, isoflurane, ratio of inspiration to expiration, respiration rate, expiratory time, and any alarm conditions present. These data are fed to the computer, where they are checked for transmission errors. If the data are correct, a decision is made either to store them or to wait and receive new data. Our program is set up to store data only once every five minutes. If the decision is made to store the data, numerical information is converted to decimal numbers, a file is opened, the operating room number is used as the file name, and the data are stored on the disk. The program then loops back and awaits the next data transmis- sion from the mass spectrometer. The second program, the data display program, prompts the operator for the room number and the type o f data that he or she wishes to be dis- played. The program then retrieves these data from the disk and draws and labels a graph on the CRT. This graph may also be printed on paper.
The major problem we encountered was in the transmission o f data from the mass spectrometer. When the mass spec- t rometer transmits, it does not check to determine if the com- pt, tcr is ready to accept the data. Consequently, data is some- times lost or received in a garbled condition. To compensate for this problem, the length o f the program can be kept to a min imum so that the computer is less likely to be involved in other portions o f the program when a new data transmission occurs and will spend a higher percentage o f time waiting for data transmission. Alternatively, different language (or com- piled BASIC) could also bc used to speed execution o f the program. Our solution was to add to the program a routine that detects any transmission errors and discards the unusable data. Another difficulty was getting the proper wir ing on the RS-232 interface cable; ours was rewired several times before the correct interconnections were found. The final difficulty was the actual writ ing o f the program; because our experience and training in computer p rogramming is limited, this task was a t ime-consuming learning experience.
281
282 Journal of Clinical Monitoring Vol I No 4 October 1985
USE OF THE COMPUTERIZED ELECTRICALLY EVOKED ELECTROMYOGRAM FOR MONITORING NEUROMUSCULAR BLOCKADE IN COMATOSE PATIENTS H. L. Edmonds, Jr, PhD, S.J. Reiss, MD, and R. S. Humble, BS, Louisville, KY
It is now possible to quantify the effects of neuromuscular blocking agents with microprocessor-based electrically evoked electromyographic (EEMG) responses (Macdonald AM, et al: Br J Anaesth 1984;56:651-653). The technique compares favorably with the more cumbersome dec- tromechanical measurement of muscle twitch tension (Donati F, Bevan DR: Anesth Analg 1984;63:891-894). However, be- cause experience with the EEMG is limited, reports of system- atic studies detailing its appropriate application and limitations are currently unavailable. This report describes marked dis- crepancies between EEMG responses obtained from muscles of the forehead and hand following neuromuscular blockade. Recordings were made from comatose subjects to eliminate the potentially confounding influences of anesthetic agents.
Methods. The study protocol was approved by the institu- tional review board and informed consent was obtained from a relative of each comatose subject. The ulnar and facial nerves were stimulated every 20 seconds (supramaximal constant current, 0.1 ms, 2 Hz) with a train-of-four (TOF) pattern. Recording electrodes were placed over the abductor digiti mininai and frontalis muscles. The EEMG response was amplified, filtered, integrated (3 to 16 ms post-stimulus), and displayed both graphically and digitally by a Z80 micropro- cessor-based DATEX/Puritan-Bennett neuromuscular trans- mission (NMT) monitor. After establishment of a stable bascline response, the following neuromuscular blockers wcrc administered at 12-hour intervals: succinylcholinc, 1 mg/kg; pancuronium, 0.07 mg/kg; atracurium, 0.24 mg/kg; vecuronium, 0.50 mg/kg. Responses to the first (TI) and fourth (T4) TOF in the drug state were expressed as a percent of the predrug baseline to determine the degree of block. Fade was measured as the T1/T4 ratio.
Resuhs. For each of the relaxants, EEMG rcsponscs ob- tained from the hand were similar to those previously reported in anesthetized patients (Macdonald AM, ct al, 1984, Donati F, Bevan DR, 1984, Edmonds HL, Jr, ct al: Anesthesiology [in press]). Fade was clearly produced by each of the non- depolarizing blockers. Qualitatively similar patterns wcre ob- served on the frontalis muscle for succinylcholinc and pan- curonium. However, patterns that differed markedly from those of the hand were often sccn with the frontalis muscle EEMG for the newer relaxants. For example, after administra- tion ofvecuronium, the T1 in the hand response ranged from 45 to 0% of baseline. In contrast, the T1 response in the forehead varied between 40 and 250% of the predrug value.
Discussion. The results illustrate two clinically relevant points. First, the muscles of the hand and face do not appear to respond similarly to the newer blocking agents. Data obtaincd from one of these muscle groups should not bc used intcr- changeably with that from the other. Second, the huge inter- subject variation in response to fixed doses of the newer relaxants illustrates the potential value of the EEMG in comatose pa- tients. Such monitoring permits precise adjustment of relaxant dose to achieve the desired degree o f neuromuscular blockade.
The authors thank DATEX Instrumentarium Oy (Helsinki, Finland) and the Puritan-Bennett Corporation (Boston, MA) for supplying the N M T monitors used in this study.
ASSESSMENT OF POSTOPERATIVE ANALGESIA BY THE COMPUTERIZED SPONTANEOUS ELECTROMYOGRAM H. L. Edmonds, Jr, PhD, J. S. Buck, MS, K. Tsueda, MD, and B. M. Rigor, MD, Louisville, KY
Adequate general anesthesia is associated with a low level of spontaneous electromyographic (SEMG) activity derived from the frontalis muscle (Harmel, MH, et al: Acta Anaesth Scand 1978;70[suppl]:97-102). This activity increases mark- edly during either periods of inadequate anesthesia or emer- gence (Edmonds HL, Jr, Paloheimo M: IntJ Clin Monit Corn- put [in press]). Although the SEMG also increases during cognitive processing (Bartoshuk AK: Can J Psychol 1956; 10:156-164), its relationship to the conscious perception of pain has not been documented systematically. Therefore, the purpose of this study was to compare a subjective pain mea- sure with the objective computer-based SEMG during post- operative recovery.
Methods. The study protocol was approved by the institu- tional review board and informed consent was obtained from each subject. These ASA I-II patients underwent orthopedic surgical procedures o f a lower extremity. Adhesive recording electrodes were placed over the frontalis muscle and mastoid process. The complex biopotential obtained from these dec- trodcs was anaplified, filtered (70 to 300 Hz bandpass), rectified, and integrated by a Z80 microprocessor-based DATEX/Puritan-Bennett dual-channel anesthesia and brain activity (ABM2) monitor. This device calculated the mean integrated amplitude of successive 10-second epochs of SEMG activity and displayed it graphically on a semilogarithmic scale (Edmonds HL, Jr, Paloheimo M, in press). Baseline SEMG activity was recorded approximately 30 minutes after the sub- jects' entry into the recovery room. Recordings were not be- gun until consciousness was regained and shivering had sub- sided. After subjective assessment of pain intensity (1 to 10 scale), morphine sulfate (30 and 60 txg/kg) was administered intravenously or epidurally. SEMG activity and the pain score were determined again 30 minutes later.
Results. Once consciousness was regained, all patients ini- tially experienced moderate to severe pain (pain score >5). This level of pain was associated with a mean integrated SEMG value of >7 ~V. The lower dose of morphine resulted in decreased pain scores (3 to 5) and a diminished SEMG (3 to 7 txV). The higher dose of morphine was associated with pain scores of <3 and SEMG amplitudes of <3 ~.V.
Discussion. Because of the large interindividual variation in the emotional response to pain, as well as the multiplicity of pain types and sources, subjective assessment of analgesia is often difficult and unreliable. Although the present results were obtained from a small number of patients using a single analgesic, they suggest that the computerized SEMG may of- fer a useful alternative to the subjective measurement of pain. This method would be of particular value with patients who are unable to communicate and in clinical pharmacology stud- ies.
The authors thank DATEX Instrumentarium Oy (Helsinki, Finland) and the Puritan-Bennett Corporation (Boston, MA) for supplying the ABM2 monitor and the Hewlett-Packard computer used in this study.
Abstracts, Computers in Anesthesia VI 283
AUTOMATED DATA PRESENTATION USING SYNTHETIC VOICE J. M. Feldman, MD, G. Pugh, J. S. Gravenstein, MD, and J. van der Aa, lr, Gainesville, FL
Because the anesthesiologist cannot continuously scan physio- logic monitors, audible presentation of data is useful, as it provides current information even when he or she is otherwise occupied. Voice enunciation o f alarms provides clear identifi- cation of an untoward situation, rather than the usual nonspecific audible tone. We developed and clinically tested an automated system that uses synthetic voice to announce data to the anesthesiologist.
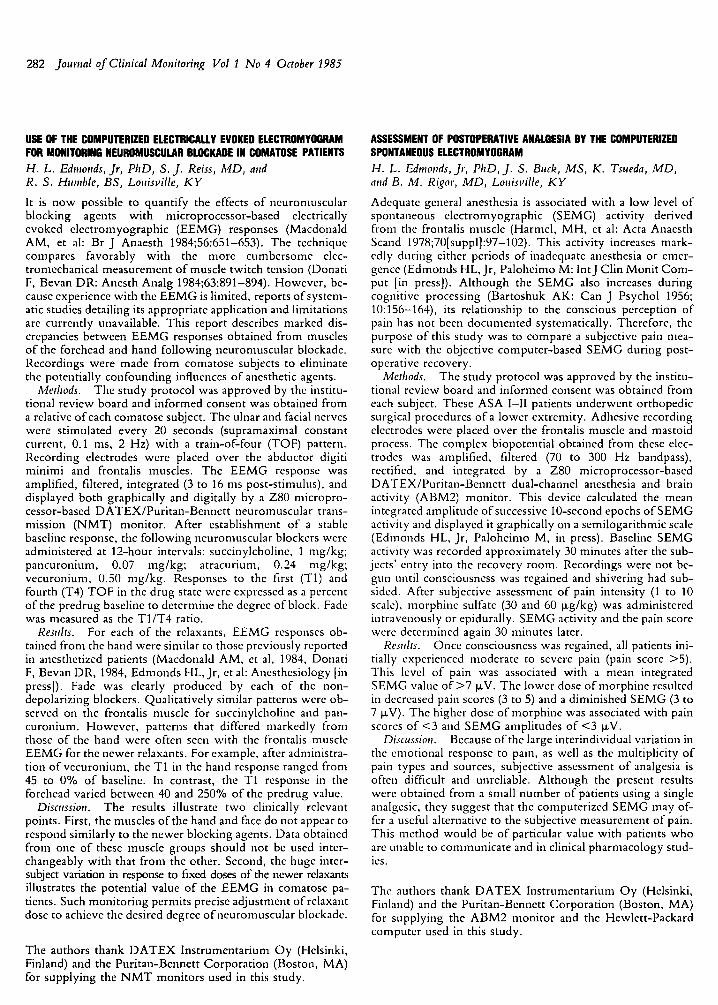
Methods. The hardware consists o f a PDP-11/23 mi- crocomputer configured with 8K bytes of RAM, ROM-based software, six RS-232C serial ports, and four 16-bit parallel ports. A Votrax personal speech system provides audible in- formation. An on/off switch, volume control, and reset but- ton are the only controls available to the user. Digital inter- faces to physiologic monitors provide real time values for heart rate (HR), invasive or noninvasive blood pressure (BP), arterial 02 saturation (SAO2), inspired O.~ concentration, in- spired CO2 concentration and end tidal CO2 concentration (Figure). Digital data from the monitors can bc erroneous due to artifacts in the signal source, e.g., catheter flushing and clcctrocautcry artifacts. Therefore, data acquired by the com- puter are evaluated t o eliminate faulty information before be- ing acted upon by the system. The user receives audible infor- mation through an earphone integrated with the precordial/ esophageal stethoscope. Normal BP and HR information is announced at five-minute intervals. Audible alarm prompts are repeated at specific intervals until the normal condition is reestablished.
Experience. This system has been used as a monitoring ad- junct in managing approximately t20 patients under both gen- eral and regional anesthesia. The system functioned in parallel with, but did not alter the function of, the usual set of moni- tors. From this experience, we are able to define the advan- tages and disadvantages of audible data presentation.
Many users were initially reluctant to accept the intrusion of additional electronic equipment into the operating room. Most, however, found the system easy to use and accepted its presence once they became familiar with it. A small group of users found the electronic nature of the synthesized voice bothersome. Some appreciated having normal information announced at five-minute intervals as a gentle reminder to update the record. Most users, however, objected to an- nouncement of normal information when they had time to scan the monitors for data. Almost all users appreciated the announcement of normal data during busy times. The most serious problem with the current design is that the alarm al- gorithms do not eliminate false positive alarms. Conse- quently, messages identifying an alarm condition are some-
I Hemedlnomic]
>/coz, o2 A
/ \ Iox.-,.,,] LsA0z �9
Block diagram of automated system for audible data presentation.
times spoken to the anesthesiologist when there is no cause for concern.
Conclusions. During the period o f clinical use, audible pre- sentation of data in the operating room has been found useful. Both announcement of normal data when the anesthesiologist is occupied and clear identification of untoward situations are proven advantages. The problem of announcing too much normal information can be solved by allowing the user to turn the announcement of normal data off and on as desired. The key challenge in successfully implementing voice presentation lies in the development of intelligent alarm algorithms that select appropriate alarm prompts. We foresee the time when voice presentation of data to the anesthesiologist is just one part of a complete automated monitoring and alarm system.
The authors express appreciation for ongoing support pro- vidcd for this work by Datascope Corporation.
MEDICATION SPREADSHEET FOR PEDIMRIC ANESTHESIA M. Ghi~none, MD, S. Sridaromont, MD, and O. Calvillo, MD, PhD, Lubbock, TX
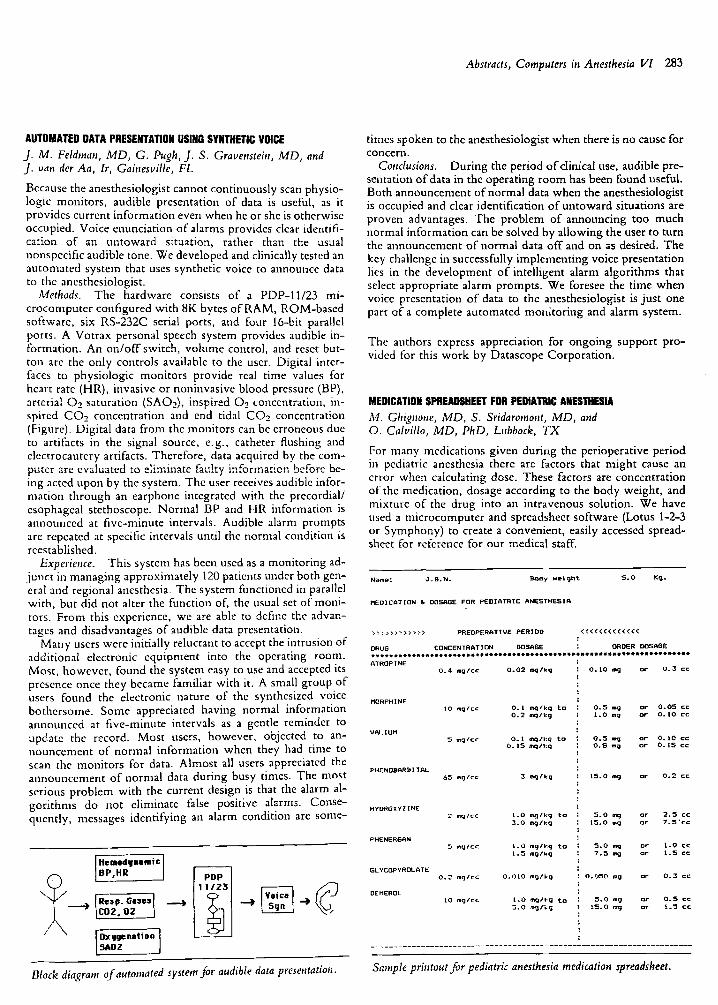
For many medications given during the perioperative period in pediatric anesthesia there are factors that might cause an error when calculating dose. These factors are concentration of the medication, dosage according to the body weight, and mixture of the drug into an intravenous solution. We have used a microcomputer and spreadsheet software (Lotus 1-2-3 or Symphony) to create a convenient, easily accessed spread- sheet for reference for our medical staff.
Mame: J.B.N. Bo~y ~e ight 5 .0 K~.
MEDICATION & DOSAGE FOR PEDIATRIC ANESTHESIA
>>;>>>~>>>>> PREDPERATIVE PERIDO < < < < ( { ( C ( < < { C
D R U G CONCENTRATION DOSAGE ~ ORDER DOSAGE eeveeet * * * * * * *e tee*ee*ee#ee** .eooeee**~out * *~e~ l * * *~e**eeeae** * * *e** ATROPINE
0.4 mglcr 0 . 0 2 mq /kq 0.10 r or 0 . 3 CC
MORPHINE I0 mglcc 0.1 mq/kg to
0.2 mQlkg
UALIUM 5 mg/cc 0.1 r to
0 .15mg/kq
PHENOBARBITAL b5 mg/cc 3 mg/kg
HYOROXYZINE 2 mglcs 1.0 m~Ikg to
3.0 mglkg
PRENERSAN 5 mqlcc 1.0 mglkg t o
1.5 mg/kg
GLYCOPYROLATE 0.2 mqlcc 0.010 mglkg
DEMEROL I0 mg/cc i . O mg/l:g to
3.0 mg/~g
O. 5 ~ or 0.05 cc
I *0 m 9 or 0. I0 cc
0.5 mq o r O. I0 cC 0.8 mg or O. 15 cc
15.0 mg or 0.2 cc
5.0 mg or 2.5 cc
15.0 mg or 7.5~r
s . 0 . ~ o , 1 . 0 = 7 . 5 mg Qr 1.5 CC
0. 050 mg O r O. 3 CC
~ . 0 . ~ o . 0.~oc 15.0 mg ar 1.5 cc
Sample printout for pediatric anesthesia medication spreadsheet.
284 Journal of Clinical Monitoring Vol 1 No 4 October 1985
The spreadsheet has different columns representing the name of the drug, its concentration, its dosage according to body weight, and the amount to order both in milligrams or grams and in cubic centimetcrs (Figure). For a single dose the formula is dosage • body weight/concentration. For an intra- venous drip the formula is body weight • dosage (l~g/kg/ min)/IV rate (cc/hr). Macro commands allow easy input for an inexperienced user and assistance for obtaining a printout. This spreadsheet for pediatric anesthesia provides quick refcr- ence and helps in avoiding dose calculation errors.
AN ALTERNATIVE TO PROGRAMMING EPROMs K. C. Huang, MD, Louisville, K Y
Many, if not most, monitoring instruments manufactured to- day include a microprocessor to give the instrument more power and flexibility. These are sometimes called turnkey sys- tems because the user has only to turn on the power switch or key and the computer takes over without requiring further human intervention. When power is first applied, most central processing units (CPUs) will go to a predesignated memory location (0 usually) for instructions. If no executable code is found there, the microprocessor will stop. This means that, at least, some instructions must reside in nonvolatile mcmory at this location. This memory can be ferrite core, complemen- tary metal oxide semiconductor (CMOS) with battery backup, magnetic bubble, read-only memory (ROM), or erasable programmable read-only memory (EPROM). EPROMs are now available in 8 bit by 16K on a single chip. They are most frequently employed where production volume is small (less than !0,000) and also for experimental purposes. EPROMs can be easily programmed with minimal additional equipment and can be erased for reprogramnaing should errors be found. A typical turnkey system will have at least a CPU, an EPROM with base address of zero, random access memory (RAM) (usually static RAM in blocks of 2K), plus input/output ports for interfacing hardwarc. Programs residing in EPROMs are usually written in assembly lan- guage. More recently, however, with the availability of larger EPROMs, interpreters of BASIC and FORTH can fit in the E P R O M along with code written in the respective languages. Although these interpreters make it easier to write control programs, the programs still must be written, tested (assum- ing a simulator exists), and stored in the EPROM with the use of a general purpose computer.
For experimenters who do not wish to design their own computer systems or program their own EPROMs, there is another method of constructing a turnkey computer system. This method takes advantage of a feature that exists in most operating systems, namely, when the system is first powered up, it will automatically execute a specific batch file, which is a series o f programs in sequence. These programs then direct the system in its tasks.
The computer I have used for more than a year is based on the Ampro Little Board, which consists of a Z80A micropro- cessor, 64K RAM, two serial ports, one parallel port, a timer port, and a floppy disk controller. The printed circuit board has the same dimensions as a 5-inch floppy disk drive and can be mounted in a piggyback fashion with a half-height drive to minimize use of space. The operating system is CP/M 80 and ZCPR. Program development is done by using the machine as a general purpose computer, using the languages and utility
programs available for CP/M 80. When the program is ade- quately debugged, the starting address is redirected appropri- ately. The advantages of this method are small physical size, easy program development, and the availability of a floppy disk drive to serve as mass storage for data collection.
DATABASE AND SPREADSHEET INTEGRATION IN OPERATING ROOM ANALYSIS J. Lousteau, MD, and A. W. Grogono, MD, New Orleans, LA
We describe an ongoing study of data regarding the use of operating room facilities at a university hospital. The study arose from concern about utilization and case scheduling.
Data were obtained from retrospective analysis of operating room nurses' records. This method was employed to elimi- nate bias introduced by the presence of a "visible" observer in the operating room. The data chosen for study included the date, anesthesia location, surgeon, service, anesthesiologist, resident/CRNA, time of entry to the operating room, starting and ending times for anesthesia, starting and ending times for surgery, and time of exit from the operating room.
The data entry system used was Nutshell. Although it al- lows easy data entry, sorting, and manipulation, the program lacks certain desirable mathematical and programming func- tions, such as INTEGER. Therefore, the data were later ex- ported to a spreadsheet program, Supercalc 3. This program allowed conversion of military time to decimal format, which is essential when calculating elapsed times. Two algorithms for this purpose will be presented that are suitable for use in spreadsheet applications.
Subsequent use of the sorting and data extraction capability of the spreadsheet permits study of critical time periods of activity and inactivity. The periods used for analysis in the present study focus on turnover time, delays in starting first cases, and use o f operating room time by services and by individual surgeons.
Results obtained from a study of this nature can be used in defining room allocation by service specialty, and in identify- ing inefficient practices and individuals who make dispropor- tionate contributions to operating room delays.
PRINCIPLES OF UPTAKE DEMONSTRATED USING COMPUTER ANIMATION H.J. Lowe, MD, and J. A. Lowe, Duarte, CA
The use of exponential time constants is unsatisfactory in teaching the mechanisms of anesthetic equilibrium in breath- ing circuits, functional residual volume (FRV), and organs. Exponentials, in assuming an infinite number of dilution steps, overpredict the degree of saturation achieved in a pro- cess involving a finite number of steps.
Saturation Process. When a volume of nitrogen is mixed into an equal volume of oxygen in a finite number of steps (#STEPS) of equal aliquots, the oxygen concentration (fO2) following any given step (STEP) can be described by the equation
#STEPS .) STEP. fO2
| X" #STEPS + 1
Abstracts, Computers in Anesthesia VI 285
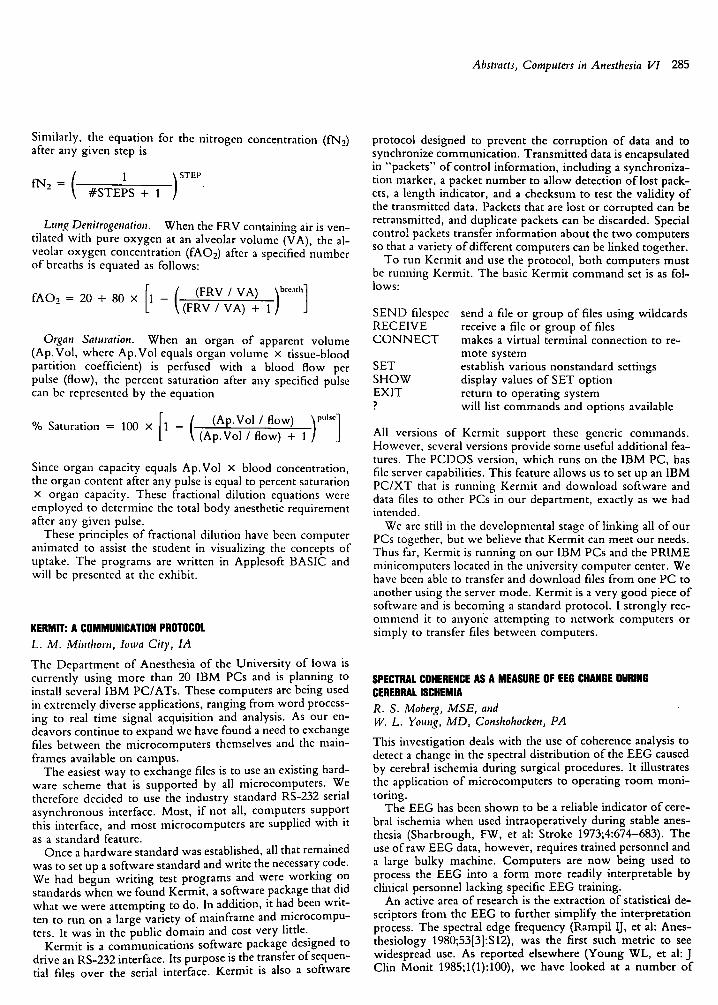
Similarly, the equation for the nitrogen concentration (fN_~) after any given step is
1 )sTy,, - #STEPS + 1
Lung Denitrogenation. When the FRV containing air is ven- tilated with pure oxygen at an alveolar volume (VA), the al- veolar oxygen concentration (fAO2) after a specified number of breaths is equated as follows:
[-I 1 fAO2 = 20 + 80 x 1 k(FR-V'7-VA')~ 1"
Organ Saturation. When an organ of apparent volume (Ap.Vol, where Ap.Vol equals organ volume x tissue-blood partition coefficient) is perfused with a blood flow per pulse (flow), the percent saturation after any specified pulse can be represented by the equation
[ ( (Ap.Vol / flow) )v,asc] % Saturation = 100 x 1 - ( A p . V o l / f o w ) + 1
Since organ capacity equals Ap.Vol x blood concentration, the organ content after any pulse is equal to percent saturation x organ capacity. These fractional dilution equations were employed to determine the total body anesthetic requirement after any given pulse.
These principles of fractional dilution have been computer animated to assist the student in visualizing the concepts of uptake. The programs are written in Applesoft BASIC and will be presented at the exhibit.
KERMIT: A COMMUNICATION PROTOCOl. L. M. Minthorn, Iowa City, IA
The Department of Anesthesia of the University of Iowa is currently using more than 20 IBM PCs and is planning to install several IBM PC/ATs. These computers are being used in extremely diverse applications, ranging from word process- ing to real time signal acquisition and analysis. As our en- deavors continue to expand we have found a need to exchange files between the microcomputers themselves and the main- frames available on campus.
The easiest way to exchange files is to use an existing hard- ware scheme that is supported by all microcomputers. We therefore decided to use the industry standard RS-232 serial asynchronous interface. Most, if not all, computers support this interface, and most microcomputers are supplied with it as a standard feature.
Once a hardware standard was established, all that remained was to set up a software standard and write the necessary code. We had begun writing test programs and were working on standards when we found Kermit, a software package that did what we were attempting to do. In addition, it had been writ- ten to run on a large variety of mainframe and microcompu- ters. It was in the public domain and cost very little.
Kermit is a communications software package designed to drive an RS-232 interface. Its purpose is the transfer of sequen- tial files over the serial interface. Kermit is also a software
protocol designed to prevent the corruption of data and to synchronize communication. Transmitted data is encapsulated in "packets" of control information, including a synchroniza- tion marker, a packet number to allow detection of lost pack- ets, a length indicator, and a checksum to test the validity of the transmitted data. Packets that are lost or corrupted can be retransmitted, and duplicate packets can be discarded. Special control packets transfer information about the two computers so that a variety of different computers can be linked together.
To run Kermit and use the protocol, both computers must be running Kermit. The basic Kermit command set is as fol- lows:
SEND filespec RECEIVE C O N N E C T
SET SHOW EXIT
send a file or group of files using wildcards receive a file or group of files makes a virtual terminal connection to re- mote system establish various nonstandard settings display values of SET option return to operating system will list commands and options available
All versions of Kermit support these generic commands. However, several versions provide some useful additional fea- tures. The PCDOS version, which runs on the IBM PC, has file server capabilities. This feature allows us to set up an IBM PC/XT that is running Kermit and download software and data files to other PCs in our department, exactly as we had intended.
We are still in the developmental stage of linking all of our PCs together, but we believe that Kermit can meet our needs. Thus far, Kermit is running on our IBM PCs and the PRIME minicomputers located in the university computer center. We have been able to transfer and download files from one PC to another using the server mode. Kermit is a very good piece of software and is becoming a standard protocol. I strongly rec- ommend it to anyone attempting to network computers or simply to transfer files between computers.
SPECTRAL COHERENCE AS A MEASURE OF EEG CHANGE DURING CEREBRAL ISCHEMIA R. S. Moberg, MSE, and W. L. Young, MD, Conshohocken, PA
This investigation deals with the use of coherence analysis to detect a change in the spectral distribution of the EEG caused by cerebral ischemia during surgical procedures. It illustrates the application of microcomputers to operating room moni- toring.
The EEG has been shown to be a reliable indicator of cere- bral ischemia when used intraoperatively during stable anes- thesia (Sharbrough, FW, et al: Stroke 1973;4:674-683). The use of raw EEG data, however, requires trained personnel and a large bulky machine. Computers are now being used to process the EEG into a form more readily interpretable by clinical personnel lacking specific EEG training.
An active area of research is the extraction of statistical de- scriptors from the EEG to further simplify the interpretation process. The spectral edge frequency (Rampil IJ, et al: Anes- thesiology 1980;5313]:$12), was the first such metric to see widespread use. As reported elsewhere (Young WL, et al: J Clin Monit 1985;1(1):100), we have looked at a number of
286 Journal of Clinical Monitoring Vol 1 No 4 October 1985
other descriptors to determine which are most sensitive to ischemic episodes. This was done using a library of taped carotid artery cross clampings (CACCs) compilcd by onc of us (W. Y.). This work has shown us that ischemic events generally involve a redistribution of the spectral content with or without a decrease in the total power from the immediately prior baseline EEG.
Spectral coherence is sensitive to changcs in the spectral distribution of two signals. It is a measure of how closely one spectrum matches another; its counterpart in the time domain is the correlation function. In the present study we investigate the utility of coherence as a marker for ischemia. Specifically, the coherence of successive spectra of two-second EEG epochs is calculated. This number is then compared to the same calcu- lation done at several points in time following a carotid clamp- ing. Calculations are done on two channels of EEG, one from each hemisphere (electrodes at F3-C3 and F4-C4). Coherences betwcen the two hemispheres were originally thought to be a good measure of EEG change in the clamped side versus the contralateral baseline. However, due to the high incidence of bilateral EEG changes from a unilateral CACC, this method is probably of limited utility.
The experimental setup consists o f a four-channel FM tape recorder (A. R. Vetter) connected to a Neurotrac EEG Moni- tor (Interspec), which digitizes the EEG and performs the spectral calculations. The data are then passed via a serial link from the Neurotrac to an IBM PC computer, where the coherence calculations are done. Time markers are also passed from the Neurotrac to synchronize the EEG to the coherence numbers. An audio track on the tape allows synchronization to the carotid clamping and to other intraoperative events.
Initial implementation of the coherence program was ap- plied to segments of EEG recorded during intraoperative events. Changes in the EEG detected visually due to a CACC corresponded to changes in the spectral coherence. Studies are now in progress to refine the coherence algorithm and to ana- lyze a larger number of CACCs, with the ultimate goal of incorporating this descriptor into the current computer-based monitoring procedure.
SPEECH RECOGNITION IN THE OPERATING ROOM: A REALITY L. S. Montejo, MD, Weston, MA
A major objective o f current work in computer science and engineering is to achieve more comfortable, natural, and efficient interfaces between people and their computers. Speech technology is an answer to this problem, as spoken language is our natural form of communication.
Research has shown that one way that humans understand each other is by the context in which words are spoken. If we can program into the computer system some sort of "gram- mar," the system will listen only to certain sounds within specific contexts. Recognition is greatly improved with this technique.
Through the use of technology, and software developed specifically to work along with it, a system has been devel- oped that enables the anesthesiologist to easily chart, do com- plex cardiovascular, pulmonary, and renal calculations, calcu- late infusion pump rates for multiple drugs, and trend data in a wireless mode and with both hands free. Speech has been the main driving force in the development of this system, since I
believe that the use of on-line data with supplementary key- board interaction is fraught with problems.
The system (Patient Data Systems, CVA), which is cur- rently undergoing FDA evaluation, runs on a personal com- puter located in the operating room in a convenient place near the anesthesiologist. A wireless FM transmitter is employed that has an actual range o f up to 100 yards. The transmitter is the size of a beeper, and the anesthesiologist wears it as such. A comfortable headset is worn for the microphone. Once the menu-driven system is loaded up, the anesthesiologist can use speech to run the system from anywhere in the room. The vocabulary currently consists o f approximately 70 words. The use of menus and the ability to move through them with utterances such as "cursor right" greatly diminishes the amount of vocabulary needed. There is error checking throughout the program; for example, if the anesthesiologist enters the pH for a blood gas and the system understands 4.71 instead of 7.41, the value will be rejected. Since the system employs "grammar-based" recognition, voice changes caused by colds or stress will rarely affect its accuracy. The system looks for words within a context. For example, if the user wishes to trend a cardiovascular parameter, he or she says "trend" and then states the desired parameter, for example, "SVO2." After " t rend" is uttered, the system will listen only to words it knows are parameters that the system can graph.
Currently, the system is user specific. That is, each end user needs to spend about 20 minutes training the computer before it will "understand" him or her. Since the system always looks for words within a context, other noises in the operating room are ignored with no contamination of the program. At the end of the case an anesthesia record is printed by the computer.
A SEMIAUTOMATED ANESTHESIA RECORD KEEPER: A CLINICAl. EVALUATION
D. A. Paulus, MD, J. J. van der Aa, lr, G. McLaughlin, I~N, M. K. Culberson, RN, E. A. Radson, RN, J. S. Gravenstein, MD, j . S. Eames, at,d J. Littlelield, MSE, Gainesville, FL
The anesthesia record has changed little since the initial one used in 1894. Being handwritten, it has several problems. Among them are accuracy of physiologic data, chronology of events, drug administration and event annotation, and legibil- ity. In one study of 100 cases (Zollinger RM, et al: J Surg Res 1977;22:419-424), major discrepancies between the data re- corded by anesthesiologists and that recorded by a com- puterized system occurred in 43% of cases. We designed and built a semiautomated anesthesia record-keeping system, an electronic clipboard (ECB), and evaluated it in terms of accu- racy of the physiologic data.
Methodology. We first established the accuracy of the ECB for blood pressure data by automatically recording the data on tape as they were transmitted by a Datascope 2000 electrocar- diograph and invasive blood pressure monitor and a Data- scope Accutor noninvasive blood pressure monitor. These data were compared with those recorded by the ECB; the differences were not significant. Once the accuracy of the ECB was established, we studied a total of 40 patients in two equal groups. With one group, the anesthesiologist used the ECB while a trained nurse recorded the heart rate and blood pressure data by hand on the institution's standard anesthesia
Abstracts, Computers in Anesthesia VI 287
record form. For the other group, the anesthesiologist kept the traditional handwri t ten record while the nurse used the ECB. Each case was studicd from the prcanesthetic induction period to the end o f the surgical procedure, or for 2 hours. Data from thc ECB and the handwrit ten records were tabulated so that physiologic as well as drug and evcnt data could be comparcd for each one-minute period. Data studied for accuracy were entries o f blood pressure, heart rate, and timing of drug ad- ministration and events. Multiple t test comparisons were per- formcd. The accuracy o f t iming has been previously reported (Paulus DA, et al: Anesth Analg 1985;64:264).
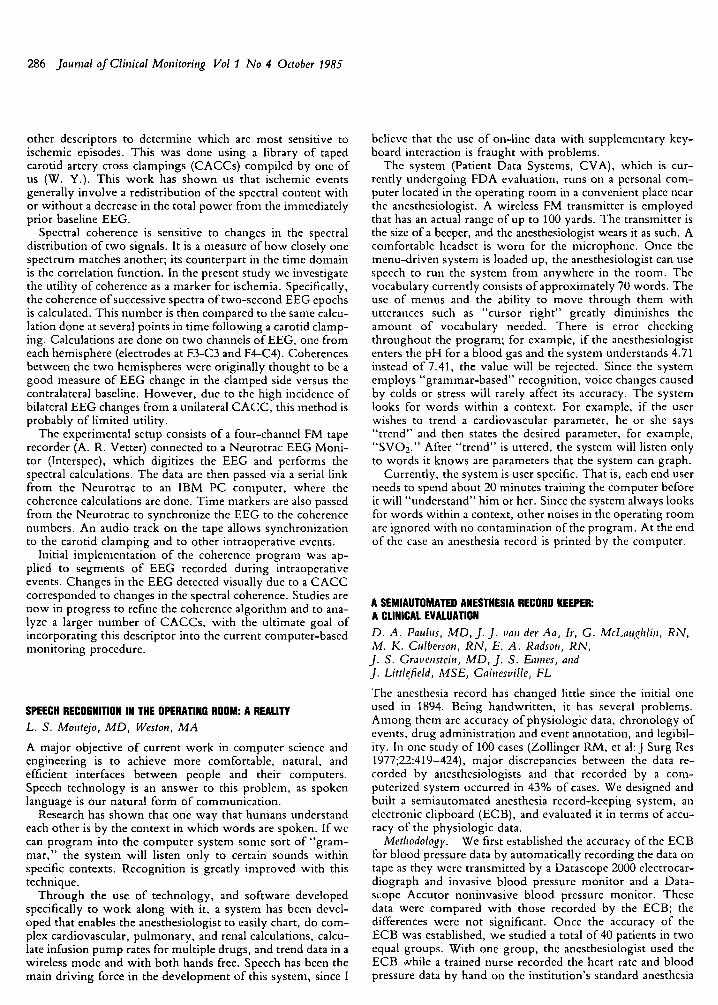
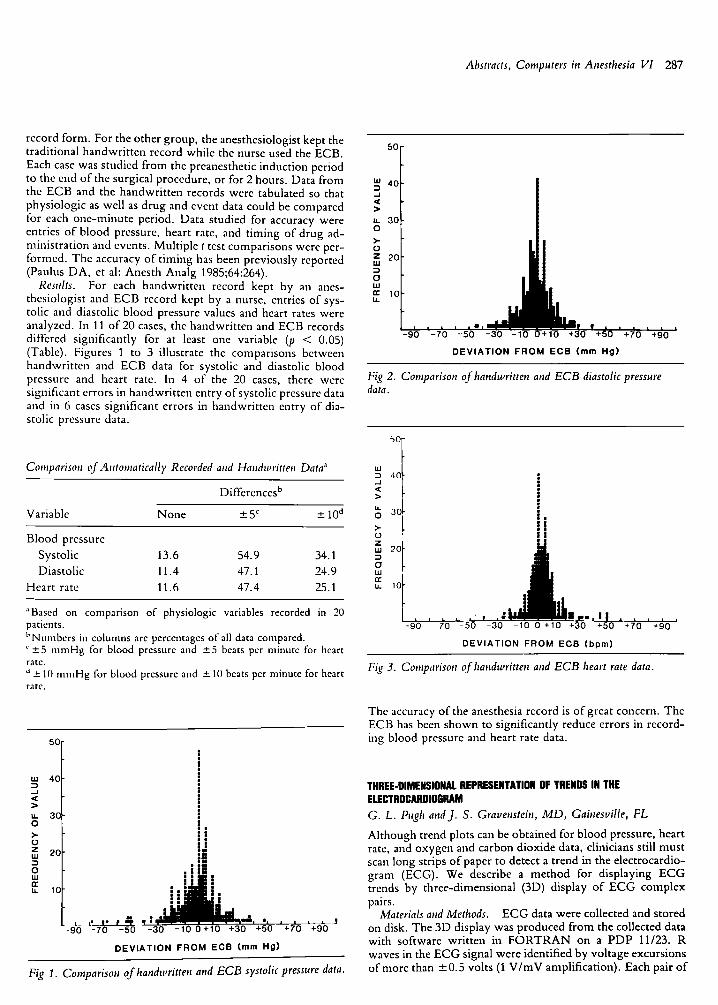
Results. For each handwrit ten record kept by an anes- thesiologist and E C B record kept by a nurse, entries o f sys- tolic and diastolic blood pressure values and heart rates were analyzed. In 11 o f 20 cases, the handwrit ten and ECB records diffcred significantly for at least one variable (p < 0.05) (Table). Figures 1 to 3 illustrate the comparisons between handwrit ten and ECB data for systolic and diastolic blood pressure and heart rate. In 4 o f the 20 cases, there were significant errors in handwrit ten entry o f systolic pressure data and in 6 cases significant errors in handwritten entry o f dia- stolic pressure data.
Comparison of Automatically Recorded and Handwritten Data ~
Differences u
Variable None + 5 ~ +_ 10 a
Blood pressure
Systolic 13.6 54.9 34.1
Diastolic 11.4 47.1 24.9
Heart rate 11.6 47.4 25.1
"Based on comparison of physiologic variables recorded in 20 patients. t, Numbers in columns are percentages of all data compared. ~---5 mntHg for blood pressure and ---5 beats per minute for heart rate. a • 10 mmHg for blood pressure and +- 10 beats per minute for heart rate.
50:
so I 40
u. 3 0 O
Jk 2 0
u_
i * ' ' , i i , | ~ i i i | i i
- 9 0 70 50 30 10 C +50 +70 +90 . . . . 1+10 +30
D E V I A T I O N F R O M ECB (rnm H g )
Fig 2. Comparison of handwritten and ECB diastolic pressure data.
bO
w :3 4(3 ,-I <{
LL O 3C
>- (.2 Z UJ 2(3 :3 O LU n" U. 1(3
! . : i ; I
- 9 0 70 - 5 0 - 3 0 - l U O +10 +30 +50 +70 +90
D E V I A T I O N FROM ECB ( b p m )
Fig 3. Comparison of l, andwritten and ECB heart rate data.
The accuracy o f the anesthesia record is o f great concern. The ECB has been shown to significantly reduce errors in record- ing blood pressure and heart rate data.
u.l 40 :3 .J <E 2> u. 30 O >,. O
2 0 - i O ul ee tu 1 0
I l l I I I �9 i m I , E
L L ' ! * P - 9 0 - 7 0 - 5 0 - 3 0 - 1 0 0 + 1 0 +30 +50
D E V I A T I O N F R O M ECB (ram Hg)
J +70 +90
Fig 1. Comparison of handwritten and ECB systolic pressure data.
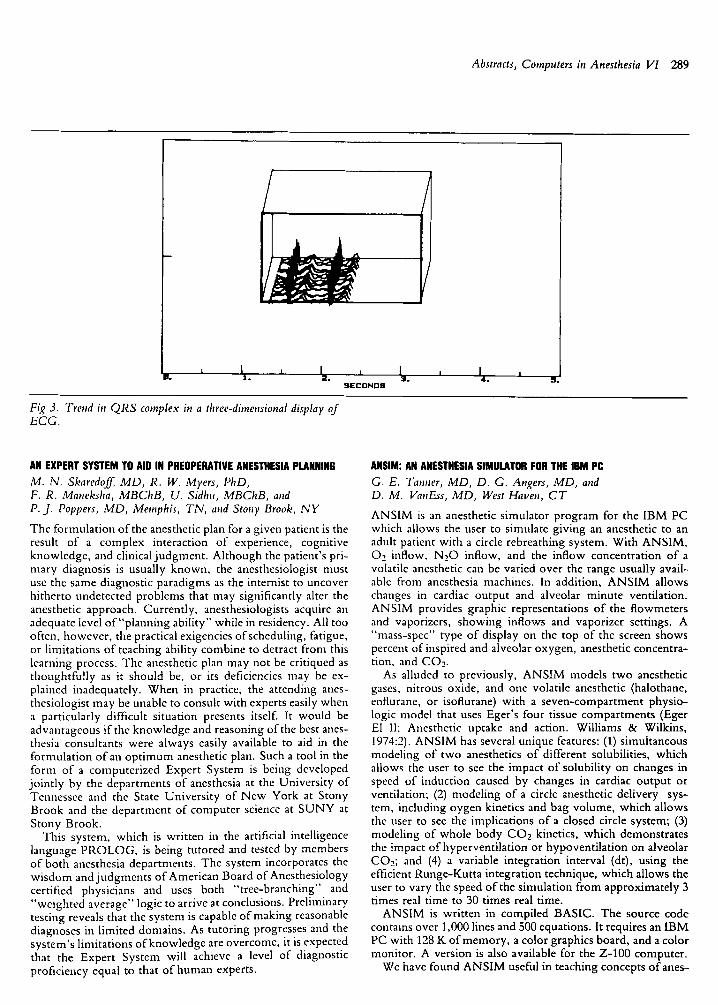
THREE-DIMENSIONAl. REPRESENTATION OF TRENDS IN THE ELECTROCARDIOGRAM G. L. Pugh at, d J. S. Gravenstein, MD, Gainesville, FL
Although trend plots can be obtained for blood pressure, heart rate, and oxygen and carbon dioxide data, clinicians still must scan long strips o f paper to detect a trend in the electrocardio- gram (ECG). We describe a method for displaying E C G trends by three-dimensional (3D) display o f E C G complex pairs.
Materials and Methods. E C G data were collected and stored on disk. The 3D display was produced f rom the collected data with software writ ten in F O R T R A N on a PDP 11/23. R waves in the E C G signal were identified by voltage excursions o f more than +0 .5 volts (1 V / m V amplification). Each pair o f
288 Journal of Clinictil Monitoring Vol I No 4 October 1985
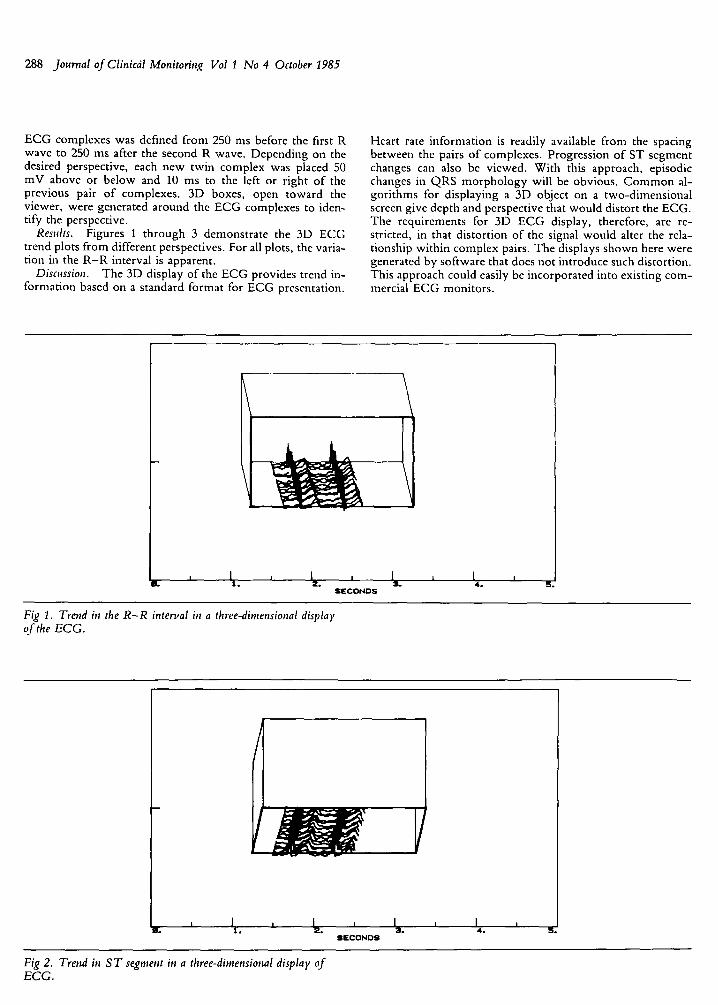
ECG complexes was defined from 250 ms before the first R wave to 250 ms after the second R wave. Depending on the desired perspective, each new twin complex was placed 50 mV above or below and 10 ms to the left or right of the previous pair o f complexes. 3D boxes, open toward the viewer, were generated around the ECG complexes to iden- tify the perspective.
Results. Figures 1 through 3 demonstrate the 3D ECG trend plots from different perspectives. For all plots, the varia- tion in the R - R interval is apparent.
Discnssion. The 3D display of the ECG provides trend in- formation based on a standard format for ECG presentation.
Heart rate information is readily available from the spacing between the pairs o f complexes. Progression of ST segment changes can also be viewed. With this approach, episodic changes in QRS morphology will be obvious. Common al- gorithms for displaying a 3D object on a two-dimensional screen give depth and perspective that would distort the ECG. The requirements for 3D ECG display, therefore, are re- stricted, in that distortion of the signal would alter the rela- tionship within complex pairs. The displays shown here were generated by software that does not introduce such distortion. This approach could easily be incorporated into existing com- mercial ECG monitors.
1 I I It. 1 . 2 .
SECONDS
I 1 ' 1 4 .
Fig 1. Trend in the R - R interval in a three-dimensional display of the ECG.
I J , 12 I 1 I B. 1 . . a . 4 .
SECONDS
Fig 2. Trend in S T segment in a three-dimensional display of ECG.
Abstracts, Computers in Anesthesia VI 289
I B. 1 .
I A I 2 . 3 .
S E C O N D S 4. S,
Fig 3. Trend in QRS complex in a three-dimensional display of ECG.
AN EXPERT SYSTEM TO AID IN PREOPERATIVE ANESTHESIA PLANNING M. N. Skaredoff, MD, R. W. Myers, PhD, F. R. Maneksha, MBChB, U. Sidhu, MBChB, and P. j . Poppers, MD, Memphis, TN, and Stony Brook, N Y
The formulation of the anesthetic plan for a given patient is the result of a complex interaction of experience, cognitive knowledge, and clinical judgment. Although the patient's pri- mary diagnosis is usually known, the anesthesiologist must use the same diagnostic paradigms as the internist to uncover hitherto undetected problems that may significantly alter the anesthetic approach. Currently, anesthesiologists acquire an adequate level of"planning ability" while in residency. All too often, however, the practical exigencies of scheduling, fatigue, or limitations of teaching ability combine to detract from this learning process. The anesthetic plan may not be critiqued as thoughtfully as it should be, or its deficiencies may be ex- plained inadequately. When in practice, the attending anes- thesiologist may be unable to consult with experts easily when a particularly difficult situation presents itself. It would be advantageous if the knowledge and reasoning of the best anes- thesia consultants were always easily available to aid in the formulation of an opt imum anesthetic plan. Such a tool in the form of a computerized Expert System is being developed jointly by the departments of anesthesia at the University of Tennessee and the State University of New York at Stony Brook and the department of computer science at SUNY at Stony Brook.
This system, which is written in the artificial intelligence language PROLOG, is being tutored and tested by members of both anesthesia departments. The system incorporates the wisdom and judgments of American Board of Anesthesiology certified physicians and uses both "tree-branching" and "weighted average" logic to arrive at conclusions. Preliminary testing reveals that the system is capable of making reasonable diagnoses in limited domains. As tutoring progresses and the system's limitations of knowledge are overcome, it is expected that the Expert System will achieve a level of diagnostic proficiency equal to that o f human experts.
ANSIM: AN ANESTHESIA SIMULATOR FOR THE IRM PC G. E. Tanner, MD, D. G. Angers, MD, and D. M. VanEss, MD, West Haven, CT
ANSIM is an anesthetic simulator program for the IBM PC which allows the user to simulate giving an anesthetic to an adult patient with a circle rebreathing system. With ANSIM, 02 inflow, N20 inflow, and the inflow concentration of a volatile anesthetic can be varied over the range usually avail- able from anesthesia machines. In addition, ANSIM allows changes in cardiac output and alveolar minute ventilation. ANSIM provides graphic representations of the flowmeters and vaporizers, showing inflows and vaporizer settings. A "mass-spec" type of display on the top of the screen shows percent of inspired and alveolar oxygen, anesthetic concentra- tion, and CO~_.
As alluded to previously, ANSIM models two anesthetic gases, nitrous oxide, and one volatile anesthetic (halothane, enflurane, or isoflurane) with a seven-compartment physio- logic model that uses Eger's four tissue compartments (Eger El II: Anesthetic uptake and action. Williams & Wilkins, 1974:2). ANSIM has several unique features: (1) simultaneous modeling of two anesthetics of different solubilities, which allows the user to see the impact of solubility on changes in speed of induction caused by changes in cardiac output or ventilation; (2) modeling of a circle anesthetic delivery sys- tem, including oygen kinetics and bag volume, which allows the user to see the implications of a closed circle system; (3) modeling of whole body CO2 kinetics, which demonstrates the impact of hyperventilation or hypoventilation on alveolar CO2; and (4) a variable integration interval (dr), using the efficient Runge-Kutta integration technique, which allows the user to vary the speed of the simulation from approximately 3 times real time to 30 times real time.
ANSIM is written in compiled BASIC. The source code contains over 1,000 lines and 500 equations. It requires an IBM PC with 128 K of memory, a color graphics board, and a color monitor. A version is also available for the Z-100 computer.
We have found ANSIM useful in teaching concepts ofanes-
290 Journal of Clinical Monitoring Vol 1 No 4 October 1985
thetic uptake and distribution. Specifically, with ANSIM the user can "recreate" the experimental conditions that were used to demonstrate the concentration effect, second gas effect, "re- versed second gas effect" and the impact of N 2 0 uptake and excretion on alveolar CO2 (Egcr El II: Anesthesiology 1963; 24:153-157, Stoelting RK, Eger El ll: Anesthesiology 1969; 30:273-277, Kitahata LM, et al: Anesthesiology 1971;33:607- 611, Masuda T, Ikeda K: Anesthesiology 1984;60:567-568).
A COMPARISON OF PROPRIETARY SOFTWARE FOR ORGANIZING REPRINT FILES R. E. Wachtel, PhD, Iowa City, IA
With the proliferation of scientific journals, it has become a major task to keep curreut with the medical literature. Making copies of pertinent papers as they appear or requesting reprints from the author can generate large files of information that must be organized for later use. This is especially true if the number of reprints exceeds several hundred.
Six commercially available software packages were exam- ined to determine their usefulness for organizing reprint infor- mation (Table). Most are available for IBM PC, Apple, or CP/M systems. These programs provide useful database structures for reference information and allow printing of stored citations. Complete information concerni,ag each refer- ence, including optional keywords or notes chosen by thc user, is entered into the program. A refere,~ce number is as- signed sequentially to each new entry.
O f the six packages, three are especially useful for maintain- ing scientific reprint files and assisting in the preparation of manuscripts. These programs permit the user to locate a cita- tion by searching on a specific field, such as reference number, author, title, or keyword. Several search terms may be com- bined using A N D / O R logic. These packages will also gener- ate a list of references to become part of a manuscript for publication. The reference list can be in any format specified by the user, depending on the journal to which the manuscript will be sent.
Reference Manager, from Research Information Systems, is menu driven and can readily be used by someone with little knowledge of computers. To an experienced user, however, the repetitive display of menus can become rather tedious. Reference Manager performed almost all tasks required of re- print software, and was even able to read in files directly from BRS/Colleague.
Martz Bibliofile uses user-invoked commands to manipu- late files and thus requires a rather extensive knowledge of the operating system. Familiarity with an external word processor program, such as WordStar, is also required. This system is quite versatile, however, since the user is not limited by pre- programmed sequences.
Ref-11 is partially menu driven, but also requires some file- handling capabilities on the part of the user. It may be a rea- sonable compromise for the novice.
The selection of a particular software package will depend on consideration of the background of its users. If reprint information is to be processed by clerks or part-time students on an infrequent basis, Reference Manager would be a good choice. If the user enjoys working with computers and manip- ulating commands, and will use the software on a regular basis, then Martz Bibliofile may be a better choice. However, no single package would be best for everyone.
Sqftware Packages
Martz Bibliofile: Power Tools, 48 Hunter 's Hill Circle, Amherst MA 01002;(413)256-0751
Professional Bibliographic System: Bibliographic Software, PO Box 4250, Ann Arbor, MI 48106;(313)996-1580
Ref-11: DG Systems, 322 Prospect Ave, Hartford, CT 06106;(203)247-8500
Reference Manager: GreyStone Software, PO Box 6002, Omaha, NE 68105;(402)449-1770
Reference Manager: Research Information Systems, 2707 Costebelle Dr, La Jolla, CA 92037;(619)457-4027
Sci-Mate, Institute for Scientific Information, 3501 Market St, Philadelphia, PA 19104;(800)523-4092