Embed Size (px)
Citation preview
ABU DHABI HOTEL PERFORMANCE REPORTQ4 & FULL YEAR 2019
TABLE OFCONTENTS
KEY HIGHLIGHTS
HOTEL SUPPLY
HOTEL GUESTS
PERFORMANCE BY REGION
PERFORMANCE BY STAR RATING
PERFORMANCE BY ZONES
0203040506
HOTEL KPI MONTHLY TRENDS07EVENTS08
09 GLOSSARY
01
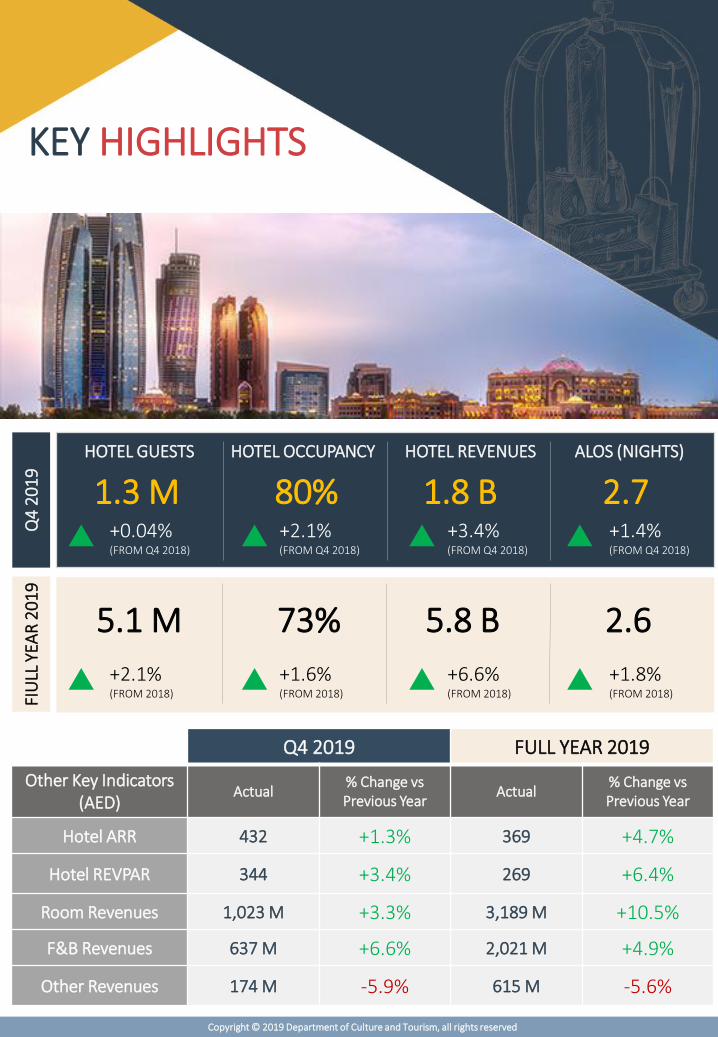
KEY HIGHLIGHTS
Q4
20
19
FIU
LL Y
EAR
20
19
Q4 2019 FULL YEAR 2019
Other Key Indicators (AED)
Actual% Change vs Previous Year
Actual% Change vs Previous Year
Hotel ARR 432 +1.3% 369 +4.7%
Hotel REVPAR 344 +3.4% 269 +6.4%
Room Revenues 1,023 M +3.3% 3,189 M +10.5%
F&B Revenues 637 M +6.6% 2,021 M +4.9%
Other Revenues 174 M -5.9% 615 M -5.6%
HOTEL GUESTS HOTEL OCCUPANCY HOTEL REVENUES ALOS (NIGHTS)
1.3 M+0.04%(FROM Q4 2018)
80% 1.8 B 2.7+2.1%(FROM Q4 2018)
+3.4%(FROM Q4 2018)
+1.4%(FROM Q4 2018)
5.1 M 73% 5.8 B 2.6
+2.1%(FROM 2018)
+1.6%(FROM 2018)
+6.6%(FROM 2018)
+1.8%(FROM 2018)
Copyright © 2019 Department of Culture and Tourism, all rights reserved
SOU
RC
E: D
CT
LIC
ENSI
NG
DEP
AR
TMEN
T
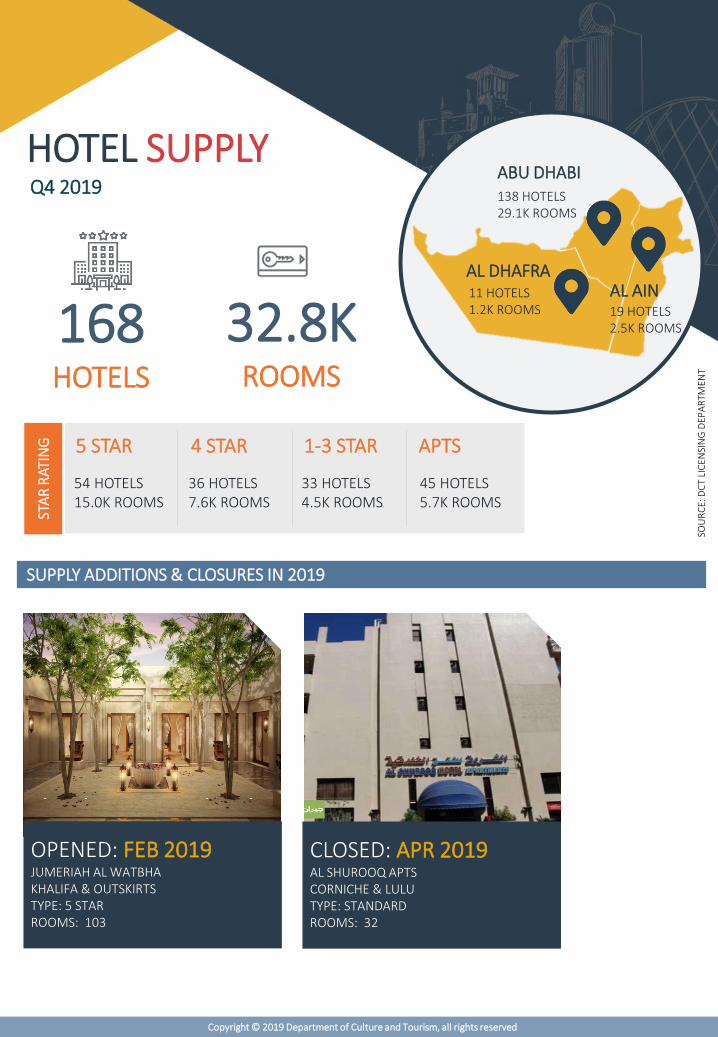
HOTEL SUPPLY
168HOTELS
32.8KROOMS
STA
R R
ATIN
G 5 STAR
54 HOTELS15.0K ROOMS
4 STAR
36 HOTELS7.6K ROOMS
1-3 STAR
33 HOTELS4.5K ROOMS
APTS
45 HOTELS5.7K ROOMS
Q4 2019ABU DHABI138 HOTELS29.1K ROOMS
AL DHAFRA11 HOTELS1.2K ROOMS
AL AIN19 HOTELS2.5K ROOMS
Copyright © 2019 Department of Culture and Tourism, all rights reserved
SUPPLY ADDITIONS & CLOSURES IN 2019
OPENED: FEB 2019JUMERIAH AL WATBHAKHALIFA & OUTSKIRTS TYPE: 5 STARROOMS: 103
CLOSED: APR 2019AL SHUROOQ APTSCORNICHE & LULUTYPE: STANDARDROOMS: 32
HOTEL GUESTS
10%
7%
6%
4%
3%
3%
3%
2%
2%
2%
% Share
129
98
78
53
45
39
35
30
29
28
INDIA
CHINA
UK
USA
EGYPT
PHILIPPINES
GERMANY
KSA
RUSSIA
PAKISTAN
2.12.8
1.6
3.73.0 2.8
2.0
4.4
2.42.12.8
1.7
4.02.9 3.0
2.0
4.7
2.2
UA
E
IND
IA
CH
INA
UK
USA
EGYP
T
PH
ILIP
PIN
ES
GER
MA
NY
KSA
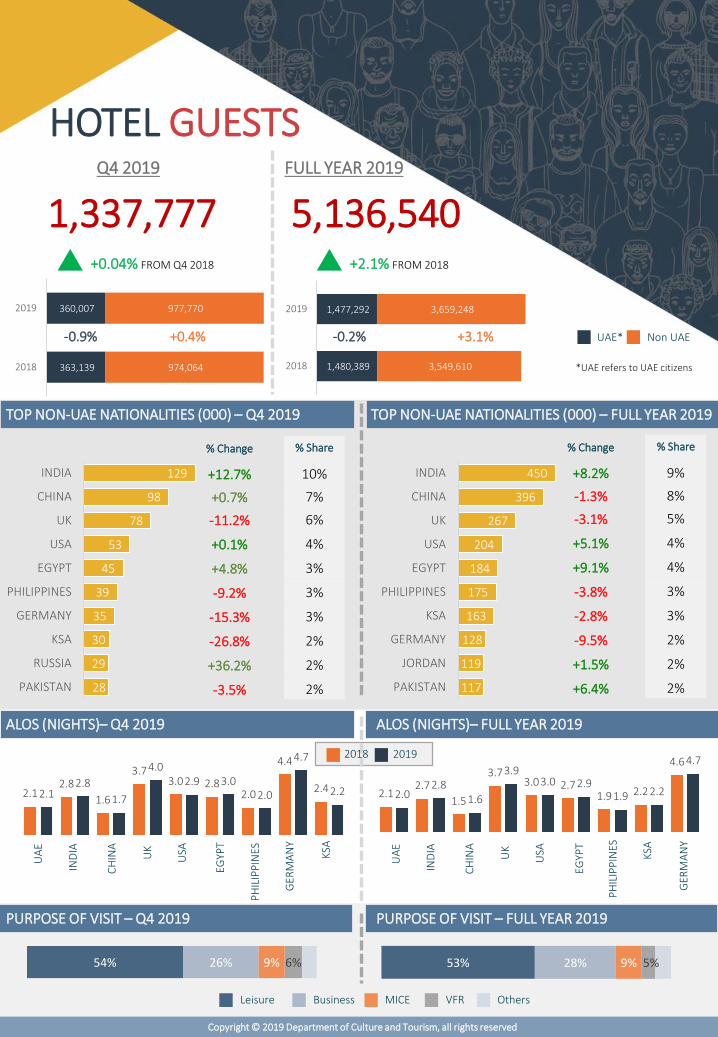
54% 26% 9% 6%
MICEBusiness OthersVFRLeisure
2.12.7
1.5
3.73.0 2.7
1.9 2.2
4.6
2.02.8
1.6
3.93.0 2.9
1.9 2.2
4.7
UA
E
IND
IA
CH
INA
UK
USA
EGYP
T
PH
ILIP
PIN
ES
KSA
GER
MA
NY
53% 28% 9% 5%
Copyright © 2019 Department of Culture and Tourism, all rights reserved
% Change
+12.7%
+0.7%
-11.2%
+0.1%
+4.8%
-9.2%
-15.3%
-26.8%
+36.2%
-3.5%
9%
8%
5%
4%
4%
3%
3%
2%
2%
2%
% Share
450
396
267
204
184
175
163
128
119
117
INDIA
CHINA
UK
USA
EGYPT
PHILIPPINES
KSA
GERMANY
JORDAN
PAKISTAN
% Change
+8.2%
-1.3%
-3.1%
+5.1%
+9.1%
-3.8%
-2.8%
-9.5%
+1.5%
+6.4%
Q4 2019 FULL YEAR 2019
1,337,777+0.04% FROM Q4 2018
5,136,540+2.1% FROM 2018
Non UAEUAE*
1,480,389
1,477,292
3,549,610
3,659,248
2018
2019
-0.2% +3.1%-0.9% +0.4%
*UAE refers to UAE citizens
TOP NON-UAE NATIONALITIES (000) – Q4 2019 TOP NON-UAE NATIONALITIES (000) – FULL YEAR 2019
ALOS (NIGHTS)– Q4 2019
20192018
ALOS (NIGHTS)– FULL YEAR 2019
PURPOSE OF VISIT – Q4 2019 PURPOSE OF VISIT – FULL YEAR 2019
363,139
360,007
974,064
977,770
2018
2019
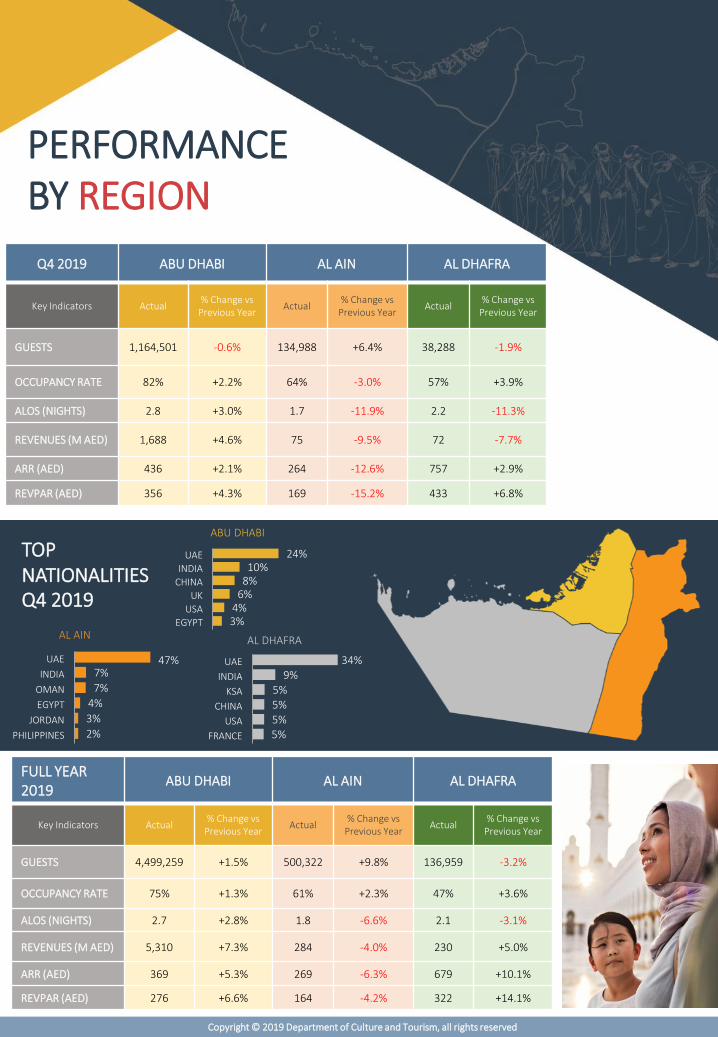
PERFORMANCEBY REGION
Q4 2019 ABU DHABI AL AIN AL DHAFRA
Key Indicators Actual% Change vs
Previous YearActual
% Change vs Previous Year
Actual% Change vs
Previous Year
GUESTS 1,164,501 -0.6% 134,988 +6.4% 38,288 -1.9%
OCCUPANCY RATE 82% +2.2% 64% -3.0% 57% +3.9%
ALOS (NIGHTS) 2.8 +3.0% 1.7 -11.9% 2.2 -11.3%
REVENUES (M AED) 1,688 +4.6% 75 -9.5% 72 -7.7%
ARR (AED) 436 +2.1% 264 -12.6% 757 +2.9%
REVPAR (AED) 356 +4.3% 169 -15.2% 433 +6.8%
TOPNATIONALITIES
AL AIN AL DHAFRA
24%10%
8%6%
4%3%
UAE
INDIA
CHINA
UK
USA
EGYPT
FULL YEAR 2019
ABU DHABI AL AIN AL DHAFRA
Key Indicators Actual% Change vs
Previous YearActual
% Change vs Previous Year
Actual% Change vs
Previous Year
GUESTS 4,499,259 +1.5% 500,322 +9.8% 136,959 -3.2%
OCCUPANCY RATE 75% +1.3% 61% +2.3% 47% +3.6%
ALOS (NIGHTS) 2.7 +2.8% 1.8 -6.6% 2.1 -3.1%
REVENUES (M AED) 5,310 +7.3% 284 -4.0% 230 +5.0%
ARR (AED) 369 +5.3% 269 -6.3% 679 +10.1%
REVPAR (AED) 276 +6.6% 164 -4.2% 322 +14.1%
Q4 2019
ABU DHABI
34%9%
5%5%5%5%
UAE
INDIA
KSA
CHINA
USA
FRANCE
47%7%
7%
4%
3%
2%
UAE
INDIA
OMAN
EGYPT
JORDAN
PHILIPPINES
Copyright © 2019 Department of Culture and Tourism, all rights reserved
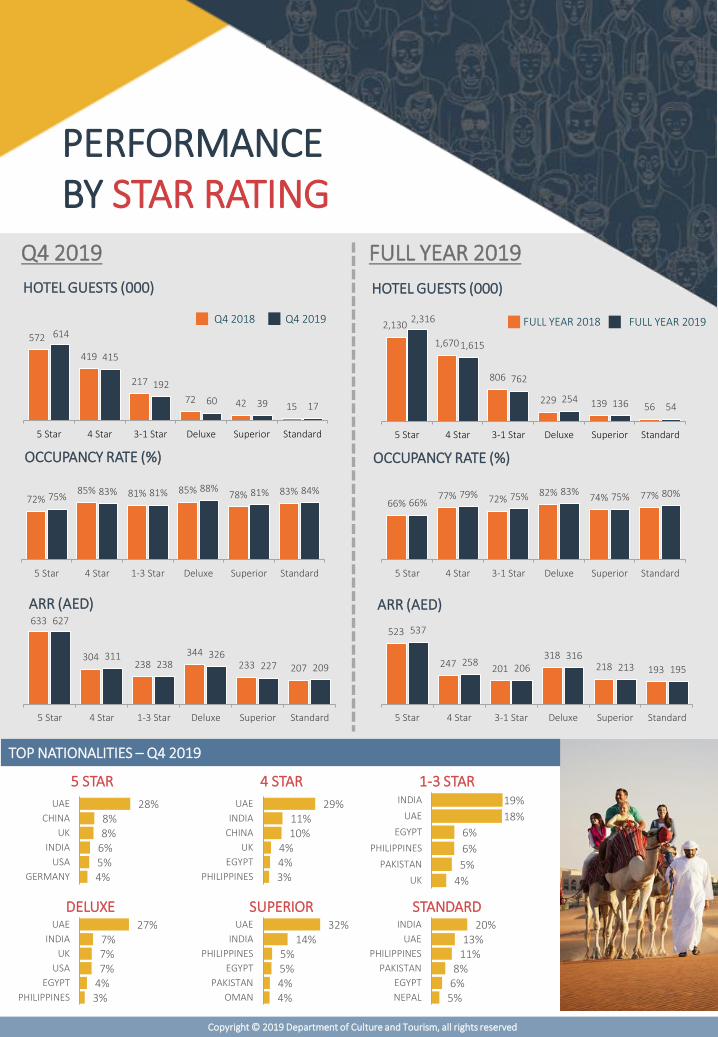
PERFORMANCEBY STAR RATING
72%85% 81% 85% 78% 83%
75% 83% 81% 88% 81% 84%
5 Star 4 Star 1-3 Star Deluxe Superior Standard
633
304238
344233 207
627
311238
326227 209
5 Star 4 Star 1-3 Star Deluxe Superior Standard
Q4 2019 FULL YEAR 2019
Q4 2018 Q4 2019 FULL YEAR 2018 FULL YEAR 2019
HOTEL GUESTS (000) HOTEL GUESTS (000)
2,130
1,670
806
229 139 56
2,316
1,615
762
254 136 54
5 Star 4 Star 3-1 Star Deluxe Superior Standard
OCCUPANCY RATE (%) OCCUPANCY RATE (%)
66%77% 72%
82% 74% 77%66%
79% 75% 83%75% 80%
5 Star 4 Star 3-1 Star Deluxe Superior Standard
ARR (AED) ARR (AED)
523
247 201
318218 193
537
258206
316213 195
5 Star 4 Star 3-1 Star Deluxe Superior Standard
5 STAR 4 STAR 1-3 STAR
DELUXE SUPERIOR STANDARD
28%8%8%
6%5%4%
UAE
CHINA
UK
INDIA
USA
GERMANY
29%11%10%
4%4%3%
UAE
INDIA
CHINA
UK
EGYPT
PHILIPPINES
19%
18%
6%
6%
5%
4%
INDIA
UAE
EGYPT
PHILIPPINES
PAKISTAN
UK
27%7%7%7%
4%3%
UAE
INDIA
UK
USA
EGYPT
PHILIPPINES
32%14%
5%5%4%4%
UAE
INDIA
PHILIPPINES
EGYPT
PAKISTAN
OMAN
20%13%
11%8%
6%5%
INDIA
UAE
PHILIPPINES
PAKISTAN
EGYPT
NEPAL
572
419
217
72 42 15
614
415
192
60 39 17
5 Star 4 Star 3-1 Star Deluxe Superior Standard
Copyright © 2019 Department of Culture and Tourism, all rights reserved
TOP NATIONALITIES – Q4 2019
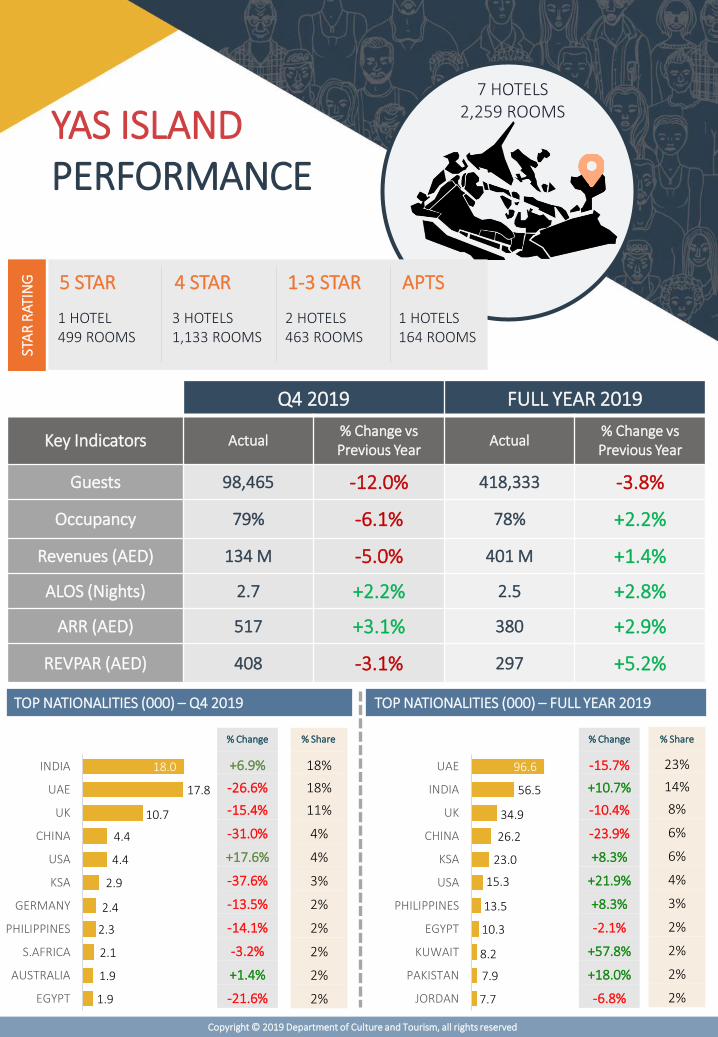
YAS ISLANDPERFORMANCE
7 HOTELS2,259 ROOMS
STA
R R
ATIN
G 5 STAR
1 HOTEL499 ROOMS
4 STAR
3 HOTELS1,133 ROOMS
1-3 STAR
2 HOTELS463 ROOMS
APTS
1 HOTELS164 ROOMS
Q4 2019 FULL YEAR 2019
Key Indicators Actual% Change vs Previous Year
Actual% Change vs Previous Year
Guests 98,465 -12.0% 418,333 -3.8%
Occupancy 79% -6.1% 78% +2.2%
Revenues (AED) 134 M -5.0% 401 M +1.4%
ALOS (Nights) 2.7 +2.2% 2.5 +2.8%
ARR (AED) 517 +3.1% 380 +2.9%
REVPAR (AED) 408 -3.1% 297 +5.2%
Copyright © 2019 Department of Culture and Tourism, all rights reserved
18%
18%
11%
4%
4%
3%
2%
2%
2%
2%
2%
% Share% Change
+6.9%
-26.6%
-15.4%
-31.0%
+17.6%
-37.6%
-13.5%
-14.1%
-3.2%
+1.4%
-21.6%
% Change
-15.7%
+10.7%
-10.4%
-23.9%
+8.3%
+21.9%
+8.3%
-2.1%
+57.8%
+18.0%
-6.8%
23%
14%
8%
6%
6%
4%
3%
2%
2%
2%
2%
% Share
96.6
56.5
34.9
26.2
23.0
15.3
13.5
10.3
8.2
7.9
7.7
UAE
INDIA
UK
CHINA
KSA
USA
PHILIPPINES
EGYPT
KUWAIT
PAKISTAN
JORDAN
TOP NATIONALITIES (000) – Q4 2019 TOP NATIONALITIES (000) – FULL YEAR 2019
18.0
17.8
10.7
4.4
4.4
2.9
2.4
2.3
2.1
1.9
1.9
INDIA
UAE
UK
CHINA
USA
KSA
GERMANY
PHILIPPINES
S.AFRICA
AUSTRALIA
EGYPT
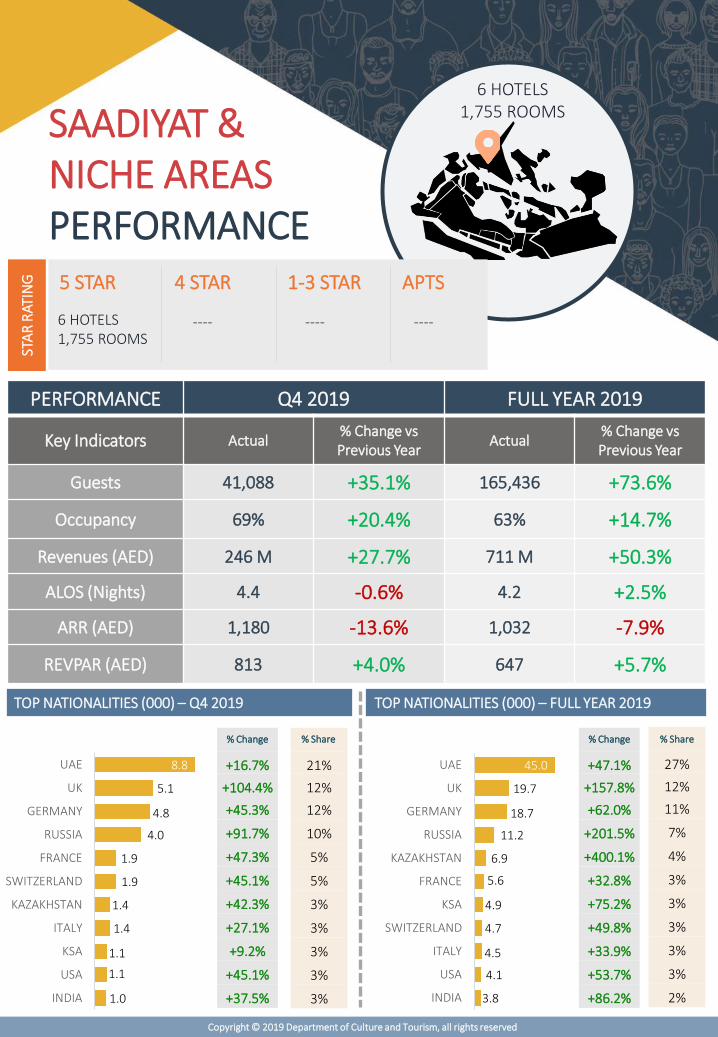
6 HOTELS1,755 ROOMS
STA
R R
ATIN
G 5 STAR
6 HOTELS1,755 ROOMS
4 STAR 1-3 STAR APTS
PERFORMANCE Q4 2019 FULL YEAR 2019
Key Indicators Actual% Change vs Previous Year
Actual% Change vs Previous Year
Guests 41,088 +35.1% 165,436 +73.6%
Occupancy 69% +20.4% 63% +14.7%
Revenues (AED) 246 M +27.7% 711 M +50.3%
ALOS (Nights) 4.4 -0.6% 4.2 +2.5%
ARR (AED) 1,180 -13.6% 1,032 -7.9%
REVPAR (AED) 813 +4.0% 647 +5.7%
SAADIYAT & NICHE AREASPERFORMANCE
---- ---- ----
Copyright © 2019 Department of Culture and Tourism, all rights reserved
21%
12%
12%
10%
5%
5%
3%
3%
3%
3%
3%
% Change
+16.7%
+104.4%
+45.3%
+91.7%
+47.3%
+45.1%
+42.3%
+27.1%
+9.2%
+45.1%
+37.5%
8.8
5.1
4.8
4.0
1.9
1.9
1.4
1.4
1.1
1.1
1.0
UAE
UK
GERMANY
RUSSIA
FRANCE
SWITZERLAND
KAZAKHSTAN
ITALY
KSA
USA
INDIA
% Change
+47.1%
+157.8%
+62.0%
+201.5%
+400.1%
+32.8%
+75.2%
+49.8%
+33.9%
+53.7%
+86.2%
27%
12%
11%
7%
4%
3%
3%
3%
3%
3%
2%
45.0
19.7
18.7
11.2
6.9
5.6
4.9
4.7
4.5
4.1
3.8
UAE
UK
GERMANY
RUSSIA
KAZAKHSTAN
FRANCE
KSA
SWITZERLAND
ITALY
USA
INDIA
% Share % Share
TOP NATIONALITIES (000) – Q4 2019 TOP NATIONALITIES (000) – FULL YEAR 2019
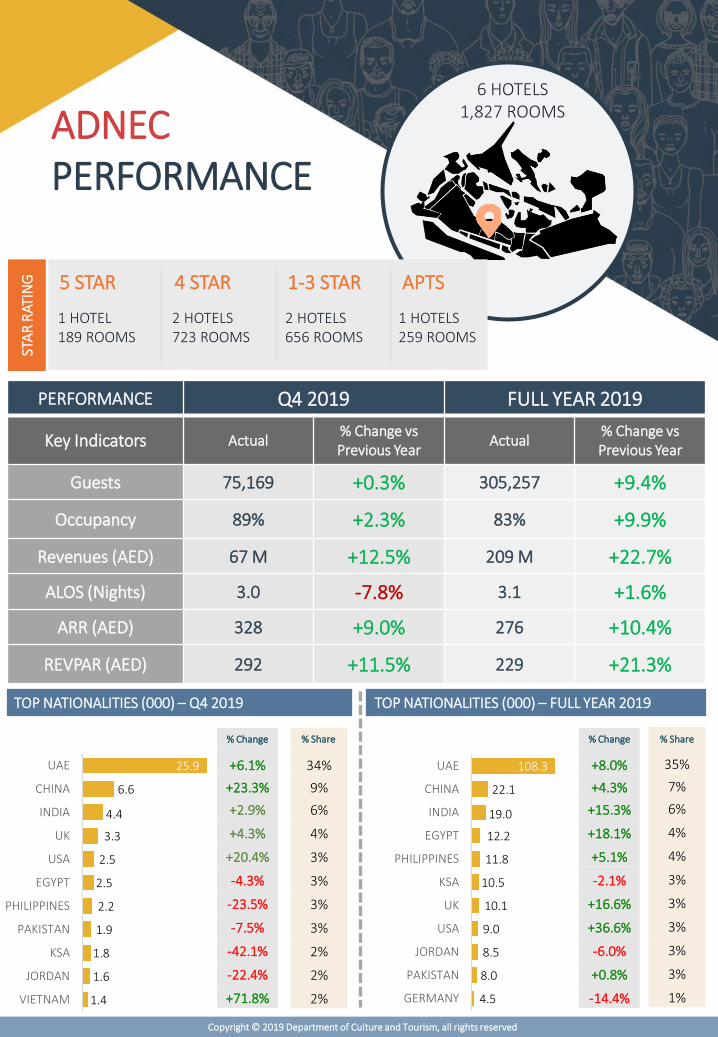
ADNECPERFORMANCE
6 HOTELS1,827 ROOMS
STA
R R
ATIN
G 5 STAR
1 HOTEL189 ROOMS
4 STAR
2 HOTELS723 ROOMS
1-3 STAR
2 HOTELS656 ROOMS
APTS
1 HOTELS259 ROOMS
PERFORMANCE Q4 2019 FULL YEAR 2019
Key Indicators Actual% Change vs Previous Year
Actual% Change vs Previous Year
Guests 75,169 +0.3% 305,257 +9.4%
Occupancy 89% +2.3% 83% +9.9%
Revenues (AED) 67 M +12.5% 209 M +22.7%
ALOS (Nights) 3.0 -7.8% 3.1 +1.6%
ARR (AED) 328 +9.0% 276 +10.4%
REVPAR (AED) 292 +11.5% 229 +21.3%
Copyright © 2019 Department of Culture and Tourism, all rights reserved
34%
9%
6%
4%
3%
3%
3%
3%
2%
2%
2%
% Change
+6.1%
+23.3%
+2.9%
+4.3%
+20.4%
-4.3%
-23.5%
-7.5%
-42.1%
-22.4%
+71.8%
25.9
6.6
4.4
3.3
2.5
2.5
2.2
1.9
1.8
1.6
1.4
UAE
CHINA
INDIA
UK
USA
EGYPT
PHILIPPINES
PAKISTAN
KSA
JORDAN
VIETNAM
% Change
+8.0%
+4.3%
+15.3%
+18.1%
+5.1%
-2.1%
+16.6%
+36.6%
-6.0%
+0.8%
-14.4%
35%
7%
6%
4%
4%
3%
3%
3%
3%
3%
1%
% Share % Share
TOP NATIONALITIES (000) – Q4 2019 TOP NATIONALITIES (000) – FULL YEAR 2019
108.3
22.1
19.0
12.2
11.8
10.5
10.1
9.0
8.5
8.0
4.5
UAE
CHINA
INDIA
EGYPT
PHILIPPINES
KSA
UK
USA
JORDAN
PAKISTAN
GERMANY
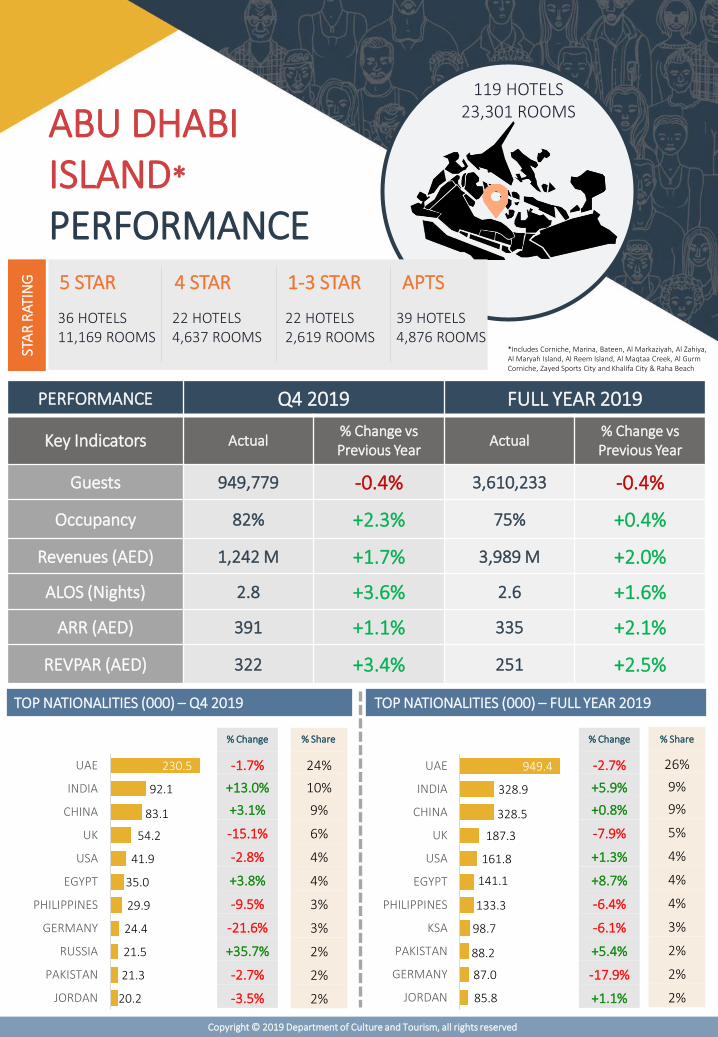
119 HOTELS23,301 ROOMS
PERFORMANCE Q4 2019 FULL YEAR 2019
Key Indicators Actual% Change vs Previous Year
Actual% Change vs Previous Year
Guests 949,779 -0.4% 3,610,233 -0.4%
Occupancy 82% +2.3% 75% +0.4%
Revenues (AED) 1,242 M +1.7% 3,989 M +2.0%
ALOS (Nights) 2.8 +3.6% 2.6 +1.6%
ARR (AED) 391 +1.1% 335 +2.1%
REVPAR (AED) 322 +3.4% 251 +2.5%
ABU DHABI ISLAND*
PERFORMANCE
*Includes Corniche, Marina, Bateen, Al Markaziyah, Al Zahiya, Al Maryah Island, Al Reem Island, Al Maqtaa Creek, Al Gurm Corniche, Zayed Sports City and Khalifa City & Raha Beach
STA
R R
ATIN
G 5 STAR
36 HOTELS11,169 ROOMS
4 STAR
22 HOTELS4,637 ROOMS
1-3 STAR
22 HOTELS2,619 ROOMS
APTS
39 HOTELS4,876 ROOMS
Copyright © 2019 Department of Culture and Tourism, all rights reserved
24%
10%
9%
6%
4%
4%
3%
3%
2%
2%
2%
% Change
-1.7%
+13.0%
+3.1%
-15.1%
-2.8%
+3.8%
-9.5%
-21.6%
+35.7%
-2.7%
-3.5%
230.5
92.1
83.1
54.2
41.9
35.0
29.9
24.4
21.5
21.3
20.2
UAE
INDIA
CHINA
UK
USA
EGYPT
PHILIPPINES
GERMANY
RUSSIA
PAKISTAN
JORDAN
% Change
-2.7%
+5.9%
+0.8%
-7.9%
+1.3%
+8.7%
-6.4%
-6.1%
+5.4%
-17.9%
+1.1%
26%
9%
9%
5%
4%
4%
4%
3%
2%
2%
2%
% Share % Share
TOP NATIONALITIES (000) – Q4 2019 TOP NATIONALITIES (000) – FULL YEAR 2019
949.4
328.9
328.5
187.3
161.8
141.1
133.3
98.7
88.2
87.0
85.8
UAE
INDIA
CHINA
UK
USA
EGYPT
PHILIPPINES
KSA
PAKISTAN
GERMANY
JORDAN
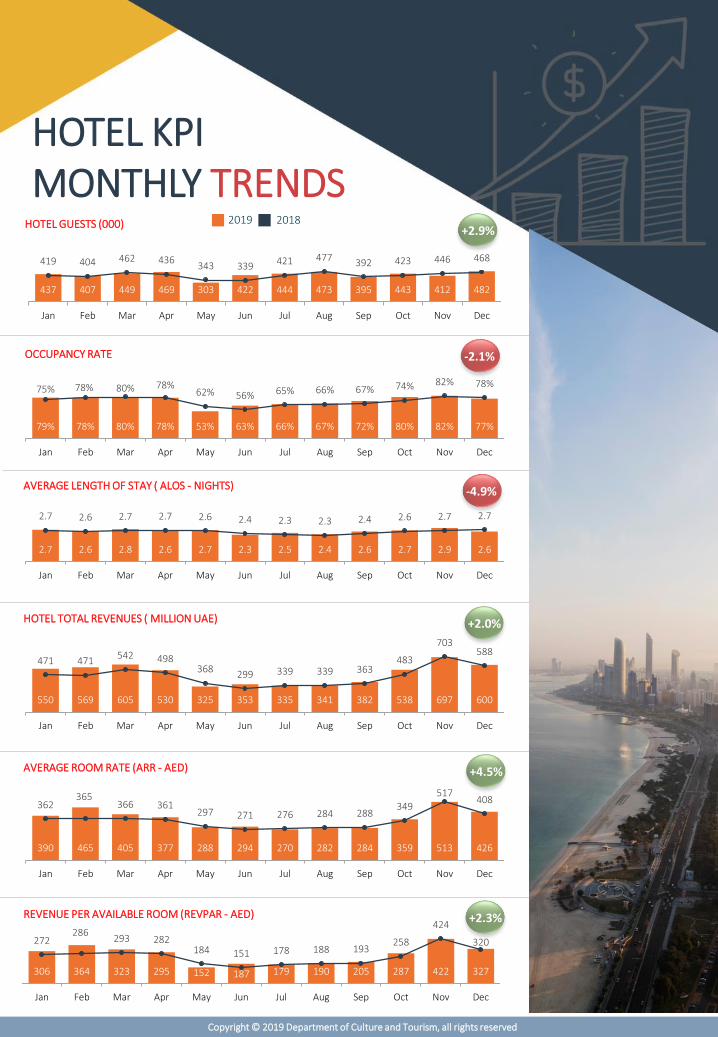
HOTEL KPI MONTHLY TRENDS
2019 2018HOTEL GUESTS (000)
OCCUPANCY RATE
79% 78% 80% 78% 53% 63% 66% 67% 72% 80% 82% 77%
75% 78% 80% 78%62% 56% 65% 66% 67% 74% 82% 78%
Jan Feb Mar Apr May Jun Jul Aug Sep Oct Nov Dec
AVERAGE LENGTH OF STAY ( ALOS - NIGHTS)
2.7 2.6 2.8 2.6 2.7 2.3 2.5 2.4 2.6 2.7 2.9 2.6
2.7 2.6 2.7 2.7 2.6 2.4 2.3 2.3 2.4 2.6 2.7 2.7
Jan Feb Mar Apr May Jun Jul Aug Sep Oct Nov Dec
HOTEL TOTAL REVENUES ( MILLION UAE)
550 569 605 530 325 353 335 341 382 538 697 600
471 471542 498
368299 339 339 363
483
703588
Jan Feb Mar Apr May Jun Jul Aug Sep Oct Nov Dec
AVERAGE ROOM RATE (ARR - AED)
390 465 405 377 288 294 270 282 284 359 513 426
362365
366 361297 271 276 284 288
349
517408
Jan Feb Mar Apr May Jun Jul Aug Sep Oct Nov Dec
REVENUE PER AVAILABLE ROOM (REVPAR - AED)
306 364 323 295 152 187 179 190 205 287 422 327
272286
293 282184 151 178 188 193
258
424
320
Jan Feb Mar Apr May Jun Jul Aug Sep Oct Nov Dec
437 407 449 469 303 422 444 473 395 443 412 482
419 404 462 436343 339 421 477
392 423 446 468
Jan Feb Mar Apr May Jun Jul Aug Sep Oct Nov Dec
Copyright © 2019 Department of Culture and Tourism, all rights reserved
+2.9%
-2.1%
-4.9%
+2.0%
+4.5%
+2.3%

EVENTSKEY Q4 2019 EVENTS
Copyright © 2019 Department of Culture and Tourism, all rights reserved
DU EMINEM CONCERT
25th Oct
Yas Island
ADIPEC 2019
11th -14th Nov
ADNEC
F1 ABU DHABI
28th Nov – 1st Dec
Yas Island
BRUNO MARS LIVE
31st Dec
Yas Island
KEY UPCOMING EVENTS – Q1 2020
AD SUSTAINABILITY WEEK
11th – 18th Jan
Saadiyat, ADNEC, Masdar City
WORLD ENERGY SUMMIT
ADNEC
HSBC GOLF CHAMPIONSHIP
Abu Dhabi Island
CHINESE NEW YEAR
Yas & AD Island
ULTRA MUSIC FESTIVAL
Yas Island
VIDCON ABU DHABI 2020
ADNEC
25th -28th Mar
13th – 16th Jan 16th – 20th Jan
5th -6h Mar
17th Jan – 2nd Feb
WINTER CONSUMER FAIR
23th Jan – 10th Feb
Al Ain
ABU DHABI CLASSICS
28th Jan – 7th Feb
Abu Dhabi Island

GLOSSARY
Disclaimer:
• All rights are reserved regarding the data contained in the Department of Culture and Tourism – Abu Dhabi (DCT Abu Dhabi) attached report.
• The content and data included in the report are subject to alteration with the emergence of more accurate data or the acquisition of the full required data, in accordance with the requirements of the data updating process or audit conducted in accordance with UAE legislation and procedures.
• DCT Abu Dhabi shall not be held accountable to the requestor or any other parties regarding alterations made to the data or information contained in this report as a result of the updating process, the conducted audit, the emergence of new data obtained from partners' overseas sources, or in any other case.
Available rooms for sale
Number of rooms available during the month covered by the report excluding out-of-order (a room status term indicating that a room is scheduled for maintenance, refurbishment, deep cleaning, etc.)
Occupied Rooms Number of rooms used on a daily basis including complimentary rooms.
Occupancy Rate % Occupancy is the percentage of available rooms that are occupied, calculated by dividing the number of occupied rooms by the available rooms.
Hotel Guests Number of guests staying in the hotel including those who occupied complimentary or non-revenue generating rooms either for day-stay or overnight-stay.
Guests Nights Number of night guests spent in the hotel regardless of the type of rooms they occupy.
Average Lengthof Stay (ALOS)
Average number of nights guests spent in a single stay, calculated by dividing guest nights by hotel guests.
Total Revenues Revenue generated by hotels from all their operations, including service charge and taxes.
Average Room(Daily) rate ARR / ADR
A ratio that indicates average room rate and to what extent rooms are being up-sold or discounted; calculated by dividing room revenue by the number of occupied rooms. (excludes complimentary & house use)
Revenue Per Available Room(RevPAR)
Revenue per Available rooms, calculated by dividing the total revenues by total rooms in hotel minus out-of-service rooms.
Copyright © 2019 Department of Culture and Tourism, all rights reserved


![Trabajador Tradicional VS Trabajador Actual [Infografía]](https://img.pdfslide.net/doc/110x75/587ca6fd1a28ab356c8b5cd5/trabajador-tradicional-vs-trabajador-actual-infografia.jpg)