Embed Size (px)
Citation preview
ABU DHABI STATE OF ENVIRONMENT REPORT 2017
WASTE LEAD AUTHOR – SALEM MUBARAK AL BRAIKDirector – Environment Quality Policy & RegulationsEnvironment Agency – Abu Dhabi
3
Population growth (resulting in increasing consumption and waste), rapid economic development without a concomitant increase in waste treatment infrastructure, and consumer behaviour are key drivers of a change in the state of waste in the emirate.
Currently, there is a lack of incentives and deterrents and an absence of adequate infrastructure to encourage the proper management and treatment of waste.
Current waste management practices in the emirate have an impact on energy consumption and release of emissions, and adverse impacts on human health, air quality, climate change, biodiversity, land and water.
The emirate has developed a number of measures to improve waste management, including: public awareness initiatives and engagement in sustainable consumption; improved infrastructure based upon accurate data; incentive programmes to encourage waste minimisation, reuse and recycling; and enhanced, enforceable regulations. A comprehensive regulatory framework and the proposed integrated waste management master plan will also help Abu Dhabi Emirate achieve national and local targets.
There is a continued increase in waste volumes and illegal dumping, reflecting the lack of appropriate infrastructure in the emirate. In 2015 the waste per capita was 1.65 kg/day of municipal solid waste.
KEY MESSAGESDRIVERS
PRESSURES
IMPACTS
RESPONSES
STATE
Waste can be categorised as either hazardous or non-hazardous, and it is either disposed of or is waiting to be disposed [1]. It may be generated during the extraction of raw materials, the processing of raw materials into intermediate and final products, the consumption of final products, or through other human activities.
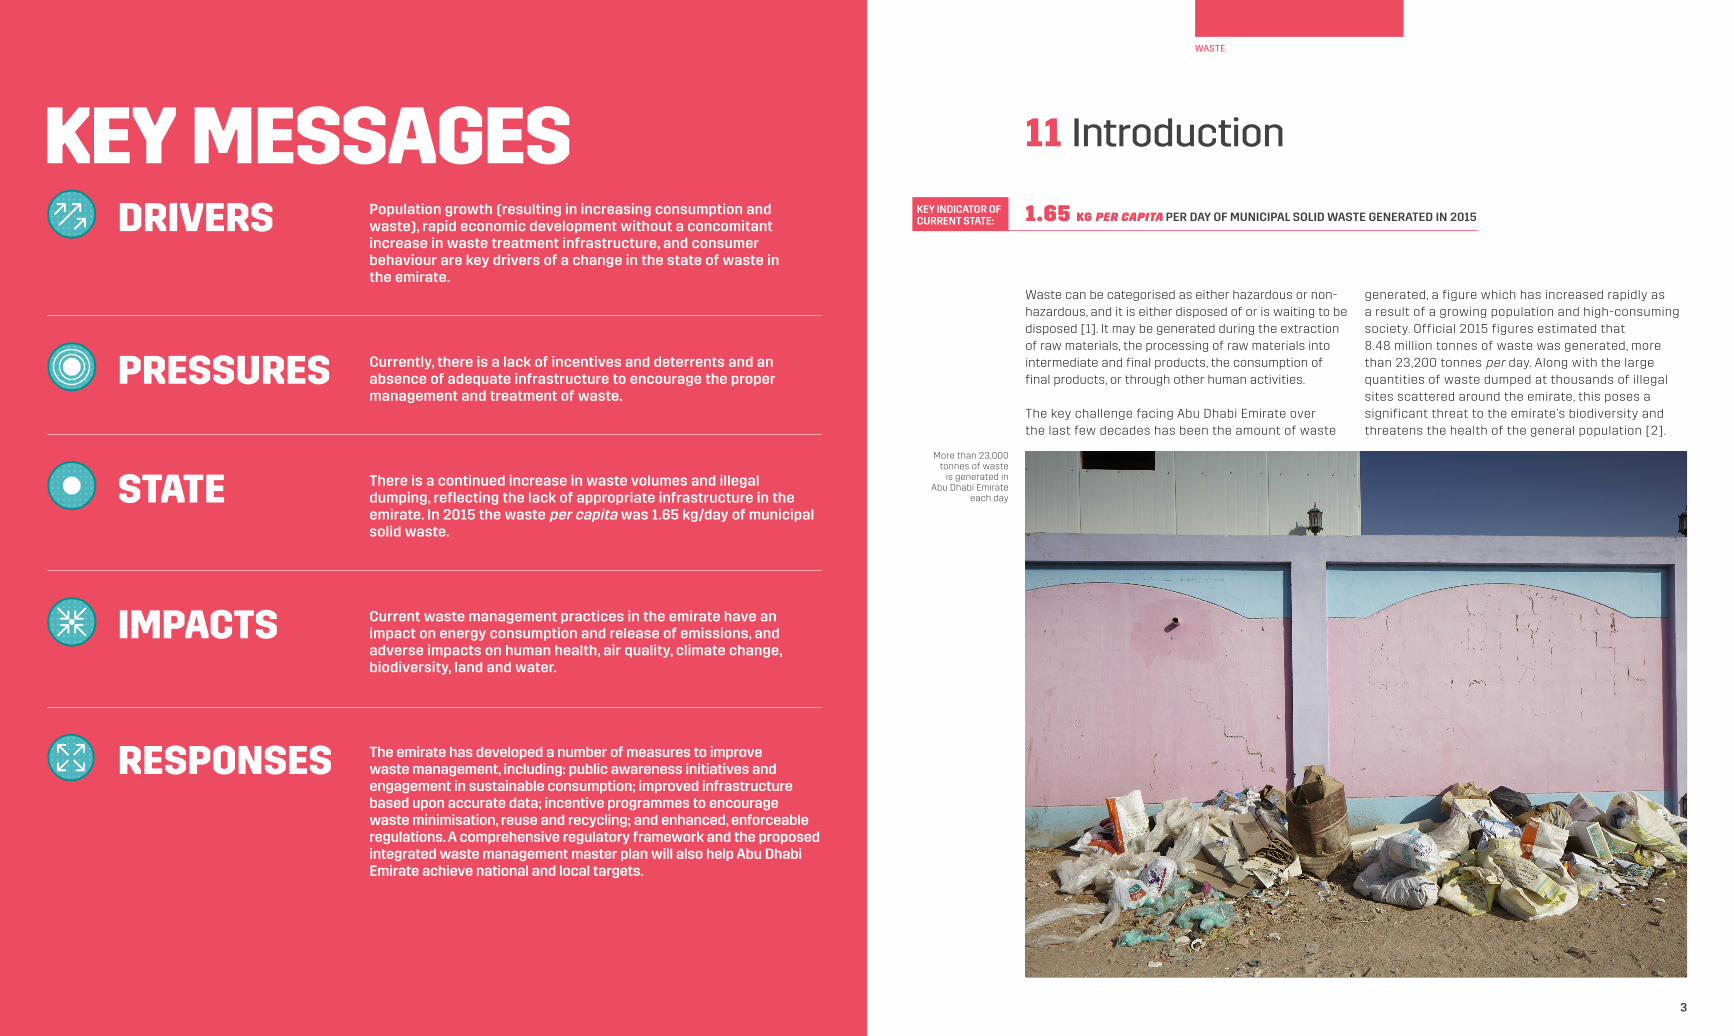
The key challenge facing Abu Dhabi Emirate over the last few decades has been the amount of waste
generated, a figure which has increased rapidly as a result of a growing population and high-consuming society. Official 2015 figures estimated that 8.48 million tonnes of waste was generated, more than 23,200 tonnes per day. Along with the large quantities of waste dumped at thousands of illegal sites scattered around the emirate, this poses a significant threat to the emirate’s biodiversity and threatens the health of the general population [2].
More than 23,000 tonnes of waste
is generated in Abu Dhabi Emirate
each day
WASTE
11 Introduction
1.65 KG PER CAPITA PER DAY OF MUNICIPAL SOLID WASTE GENERATED IN 2015KEY INDICATOR OF CURRENT STATE:
5
During the last three decades, waste management in the Emirate of Abu Dhabi was a government service provided by municipalities in Abu Dhabi, Al Ain and the Al Dhafra Region. Mixed solid waste was collected manually by labourers on a daily basis from mixed containers located in public and residential areas. In 2008, Abu Dhabi Government established Tadweer (The Center of Waste Management – Abu Dhabi) to centralise waste management operations in the emirate.
In 2015, the average person in the Emirate of Abu Dhabi produced 1.65 kg of municipal solid waste per day [2]. This rate is comparable to global figures.
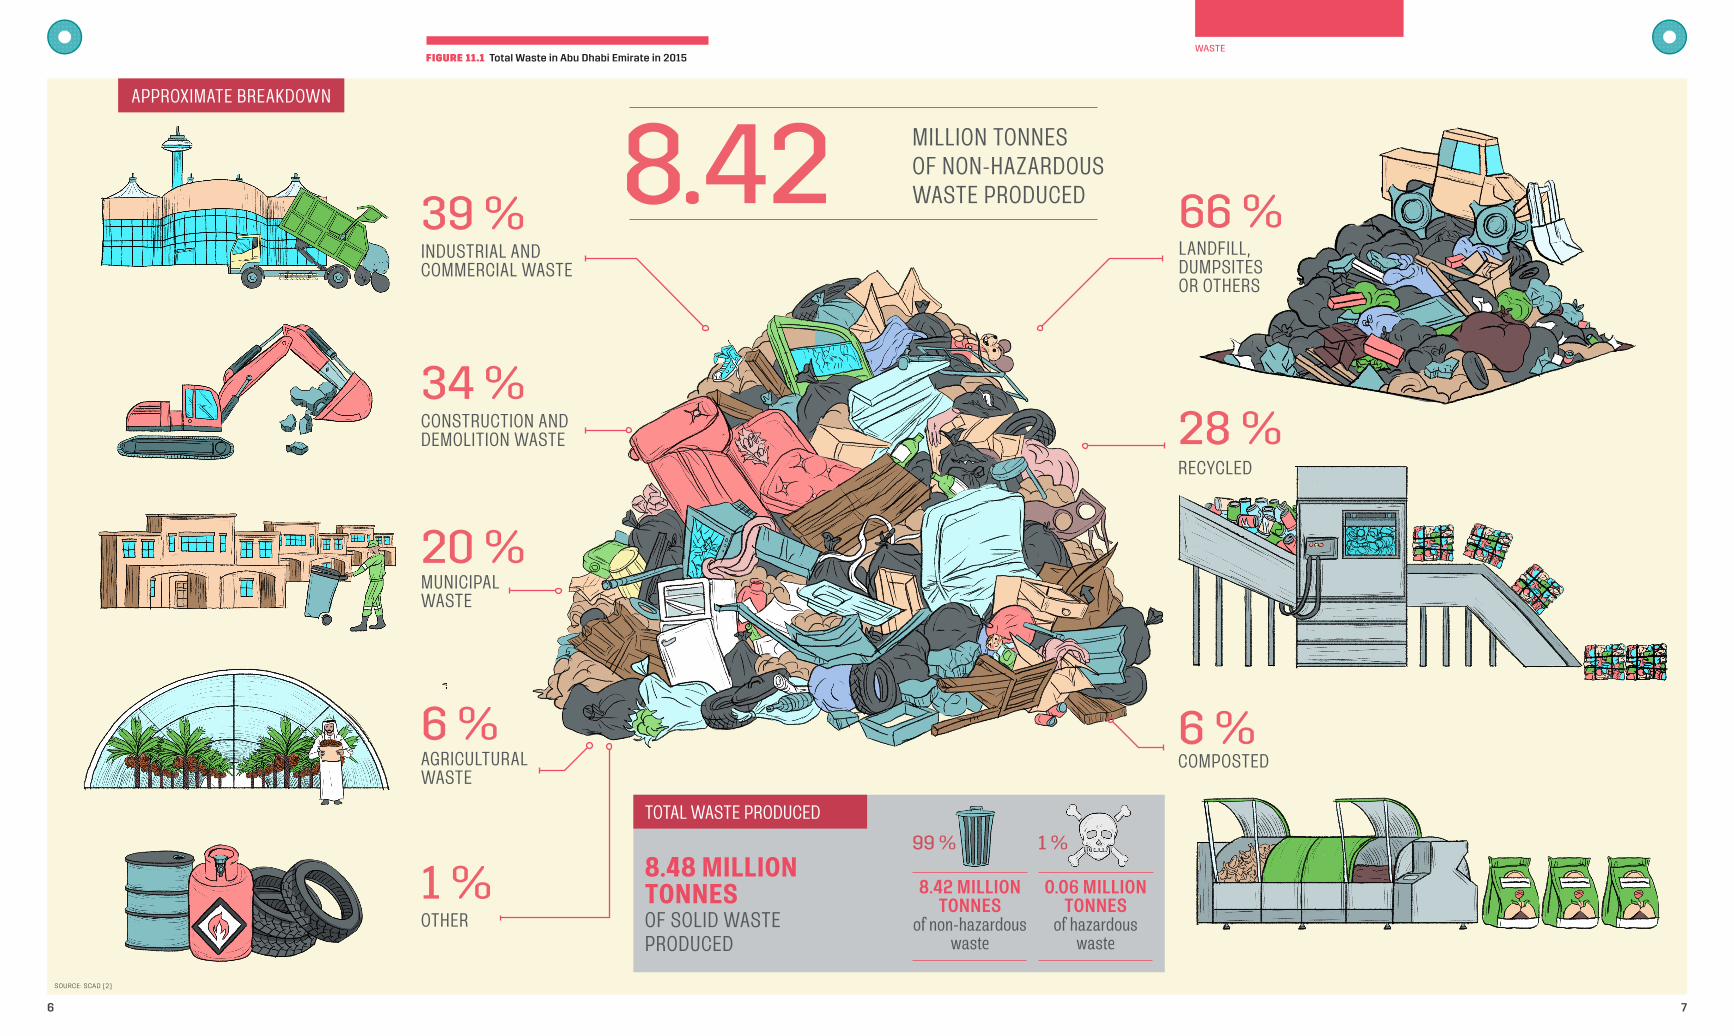
Solid WasteIn 2015, the total amount of solid waste generated in Abu Dhabi Emirate was estimated at 8.48 million tonnes, of which 99 % was non-hazardous and 1 % was hazardous. From this total, 34 % was construction and demolition (C&D) waste, 20 % municipal waste, 39 % industrial and commercial waste, 6 % agricultural waste and 1 % from other sources. Of the total waste generated in 2015, 28 % was recycled, around 6 % was composted and 66 % was sent to landfill, dumpsites or others [2].
Radioactive WasteIn September 2009, UAE President H.H. Sheikh Khalifa bin Zayed Al Nahyan approved federal Law No. (6) of 2009. This concerned the peaceful uses of nuclear
energy, and established the Federal Authority for Nuclear Regulation (FANR) as the UAE’s nuclear regulatory body. FANR is responsible for regulating, controlling and licensing nuclear activities in the UAE which (in addition to the nuclear power programme) includes radioactive material and radiation sources used in medicine, research, oil exploration and other industries.
The UAE Government is developing a national strategy for radioactive waste management, fully aligned with the standards and processes set by the International Atomic Energy Agency (IAEA). This covers all forms of radioactive and nuclear waste, including waste from nuclear plants.
There are a number of ways to manage effectively the other types of radioactive waste, according to their type and source:
For radioactive sources used in industry and some of the radioactive sources used by the healthcare sector, the current mechanism is to return the waste to the supplier of the material outside the UAE. This practice is regulated in accordance with a permit issued by FANR.
Other radioactive sources in healthcare facilities are stored for a period of time to reduce their radioactivity levels to normal, so they can be treated in the same way as medical waste. These include contaminated clothing, medical tools and human waste that may have been contaminated with radioactive materials [4].
Hazardous WasteHazardous waste is defined as waste with properties that make it dangerous or potentially harmful to human health or the environment. Hazardous wastes can include liquids, solids, contained gases or sludge. They can be by-products of manufacturing processes or simply discarded commercial products, like cleaning
11.1 State
4
TABLE 11.1 Municipal Waste Generation
COUNTRY WASTE PRODUCED (KG/CAPITA/DAY)
OECD 2.2
USA 2.04
ABU DHABI 1.65
UK 1.32
SOURCE: SCAD [2], EAD [3]
fluids or pesticides. Hazardous waste is generated from different sources including industry (non-oil and gas, and oil and gas industries) and healthcare facilities. The emirate’s hazardous solid wastes totalled 57,500 tonnes in 2015 [2].
Illegal DumpingToday, illegal dumping in Abu Dhabi Emirate remains a challenge. This is defined as the disposal of waste in a manner contrary to environmental laws and waste management in the Emirate of Abu Dhabi. EAD worked closely with Bayanat (a national company for
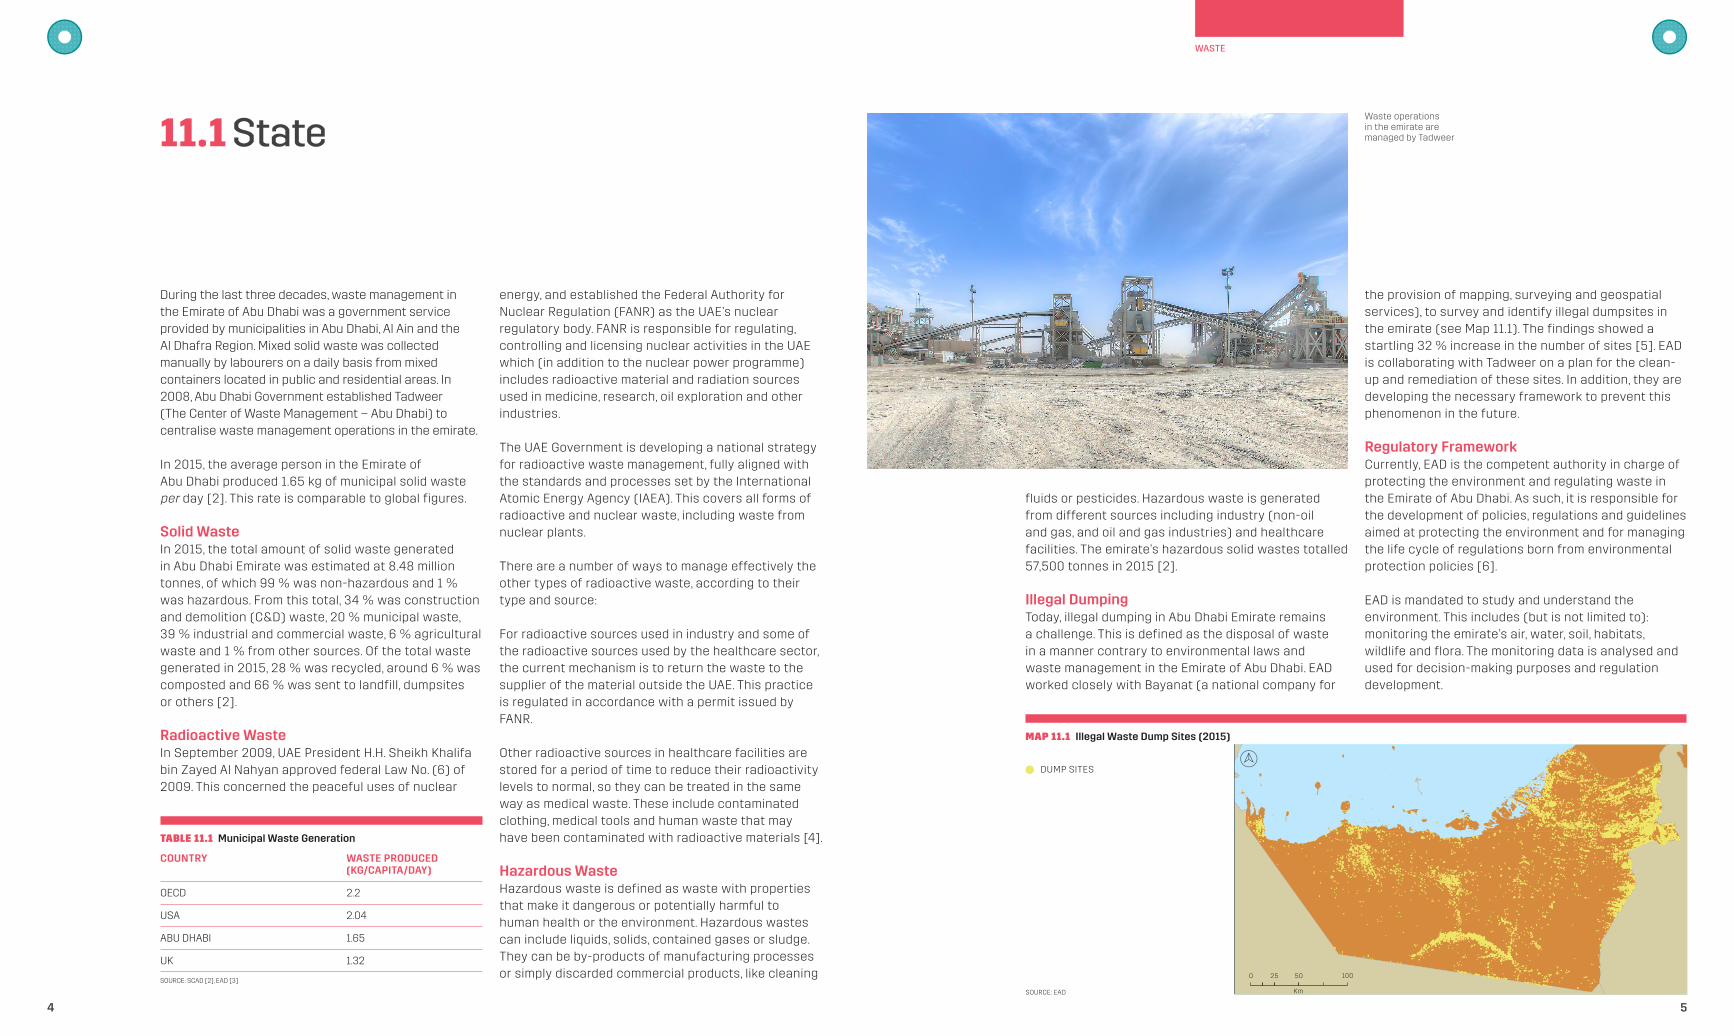
the provision of mapping, surveying and geospatial services), to survey and identify illegal dumpsites in the emirate (see Map 11.1). The findings showed a startling 32 % increase in the number of sites [5]. EAD is collaborating with Tadweer on a plan for the clean- up and remediation of these sites. In addition, they are developing the necessary framework to prevent this phenomenon in the future.
Regulatory FrameworkCurrently, EAD is the competent authority in charge of protecting the environment and regulating waste in the Emirate of Abu Dhabi. As such, it is responsible for the development of policies, regulations and guidelines aimed at protecting the environment and for managing the life cycle of regulations born from environmental protection policies [6].
EAD is mandated to study and understand the environment. This includes (but is not limited to): monitoring the emirate’s air, water, soil, habitats, wildlife and flora. The monitoring data is analysed and used for decision-making purposes and regulation development.
MAP 11.1 Illegal Waste Dump Sites (2015)
SOURCE: EAD
DUMP SITES
0 25 50 100
Km
Waste operations in the emirate are managed by Tadweer
WASTE
APPROXIMATE BREAKDOWN
6 7
8.42
34 %28 %
39 % 66 %
20 %
6 % 6 %
1 %
MILLION TONNES OF NON-HAZARDOUS WASTE PRODUCED
CONSTRUCTION AND DEMOLITION WASTE
RECYCLED
INDUSTRIAL AND COMMERCIAL WASTE
LANDFILL, DUMPSITES OR OTHERS
MUNICIPAL WASTE
AGRICULTURAL WASTE
COMPOSTED
OTHER
FIGURE 11.1 Total Waste in Abu Dhabi Emirate in 2015
SOURCE: SCAD [2]
WASTE
TOTAL WASTE PRODUCED
8.48 MILLION TONNES OF SOLID WASTE PRODUCED
0.06 MILLION TONNES
of hazardous waste
8.42 MILLION TONNES
of non-hazardous waste
1 %99 %
9
EAD is responsible for raising awareness and educating stakeholders about key environmental issues and for collecting feedback from stakeholders.The laws establishing and delineating the relevant authorities are as follows: l Law No. (21) of 2005 for Waste Management in
the Emirate of Abu Dhabi empowers EAD with a supervisory and regulatory role
l Law No. (17) of 2008 establishes The Center of Waste Management – Abu Dhabi (Tadweer) and entrusts it with a management role
Even though EAD is the competent authority on waste management in the Emirate of Abu Dhabi, waste management responsibilities are split among the following institutions: Tadweer (municipal solid, commercial, medical, agricultural, industrial, construction and demolition); ADNOC (oil and gas); FANR (radioactive). This division of responsibility presents a challenge when it comes to developing regulations and enforcement. Furthermore, there is a lack of standardisation across the UAE (such as the diversion of waste to emirates with the lowest
8
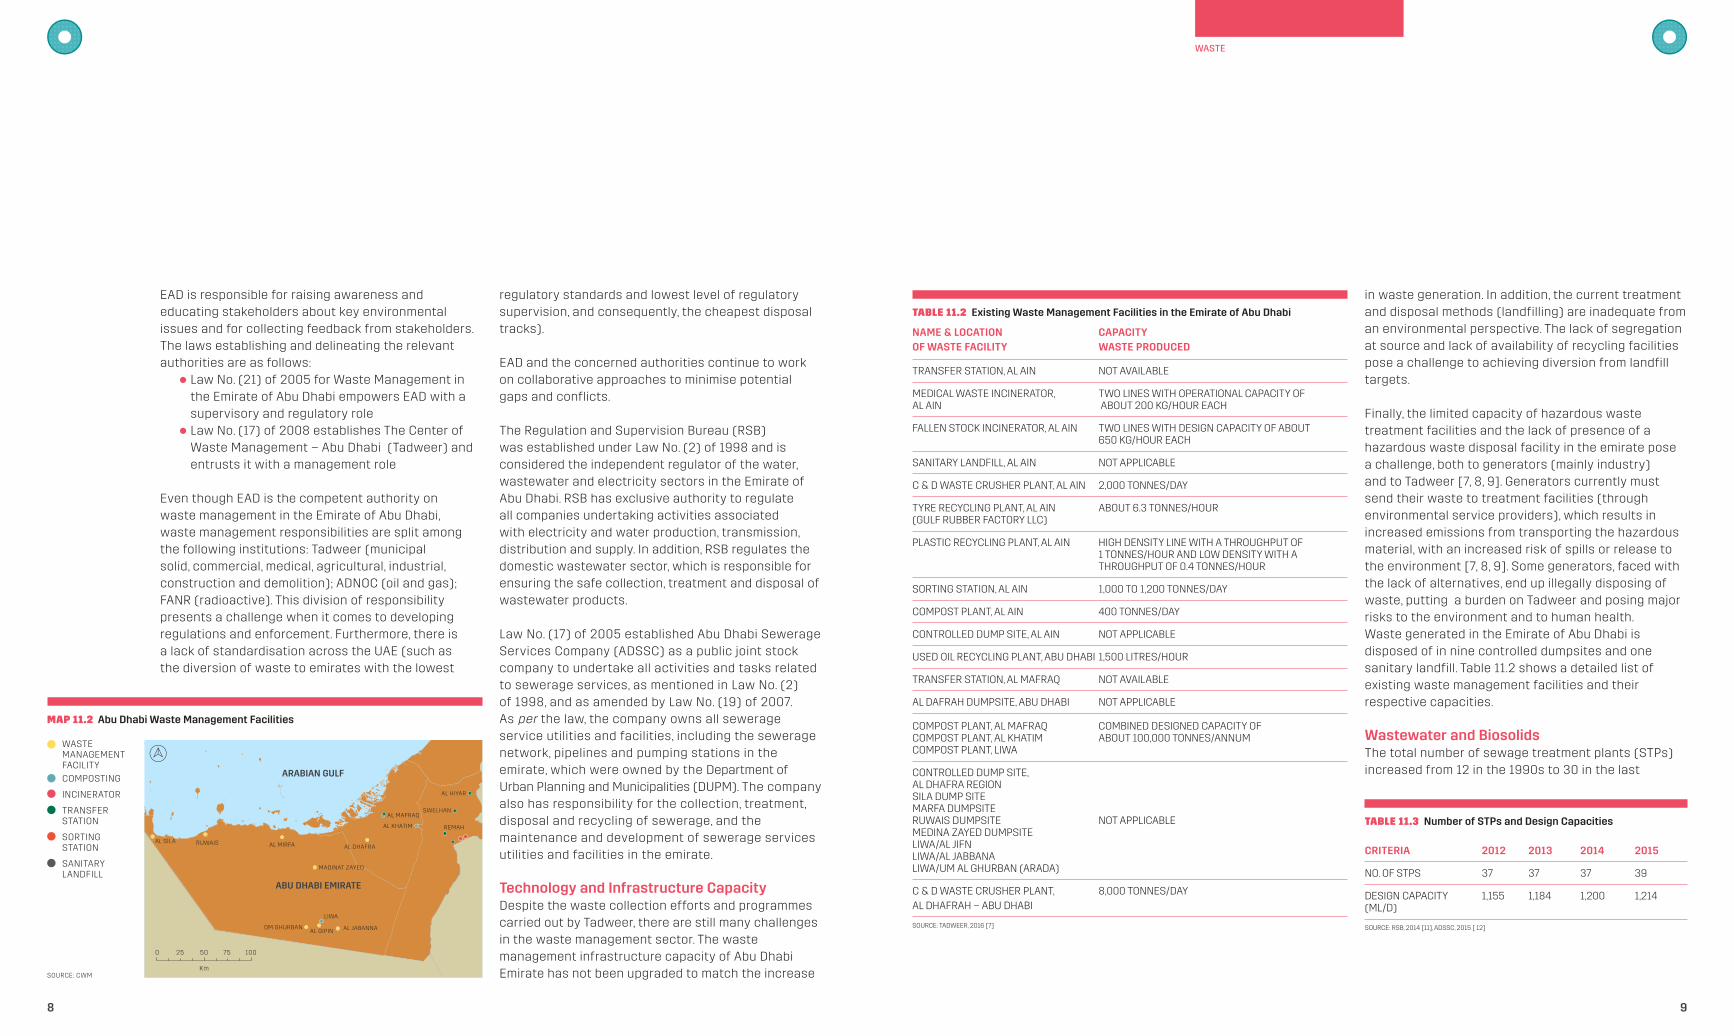
in waste generation. In addition, the current treatment and disposal methods (landfilling) are inadequate from an environmental perspective. The lack of segregation at source and lack of availability of recycling facilities pose a challenge to achieving diversion from landfill targets.
Finally, the limited capacity of hazardous waste treatment facilities and the lack of presence of a hazardous waste disposal facility in the emirate pose a challenge, both to generators (mainly industry) and to Tadweer [7, 8, 9]. Generators currently must send their waste to treatment facilities (through environmental service providers), which results in increased emissions from transporting the hazardous material, with an increased risk of spills or release to the environment [7, 8, 9]. Some generators, faced with the lack of alternatives, end up illegally disposing of waste, putting a burden on Tadweer and posing major risks to the environment and to human health.Waste generated in the Emirate of Abu Dhabi is disposed of in nine controlled dumpsites and one sanitary landfill. Table 11.2 shows a detailed list of existing waste management facilities and their respective capacities.
Wastewater and BiosolidsThe total number of sewage treatment plants (STPs) increased from 12 in the 1990s to 30 in the last
regulatory standards and lowest level of regulatory supervision, and consequently, the cheapest disposal tracks).
EAD and the concerned authorities continue to work on collaborative approaches to minimise potential gaps and conflicts.
The Regulation and Supervision Bureau (RSB) was established under Law No. (2) of 1998 and is considered the independent regulator of the water, wastewater and electricity sectors in the Emirate of Abu Dhabi. RSB has exclusive authority to regulate all companies undertaking activities associated with electricity and water production, transmission, distribution and supply. In addition, RSB regulates the domestic wastewater sector, which is responsible for ensuring the safe collection, treatment and disposal of wastewater products.
Law No. (17) of 2005 established Abu Dhabi Sewerage Services Company (ADSSC) as a public joint stock company to undertake all activities and tasks related to sewerage services, as mentioned in Law No. (2) of 1998, and as amended by Law No. (19) of 2007. As per the law, the company owns all sewerage service utilities and facilities, including the sewerage network, pipelines and pumping stations in the emirate, which were owned by the Department of Urban Planning and Municipalities (DUPM). The company also has responsibility for the collection, treatment, disposal and recycling of sewerage, and the maintenance and development of sewerage services utilities and facilities in the emirate.
Technology and Infrastructure CapacityDespite the waste collection efforts and programmes carried out by Tadweer, there are still many challenges in the waste management sector. The waste management infrastructure capacity of Abu Dhabi Emirate has not been upgraded to match the increase
MAP 11.2 Abu Dhabi Waste Management Facilities
SOURCE: CWM
0 25 50 75 100
Km
WASTE MANAGEMENT FACILITY
COMPOSTING
INCINERATOR
TRANSFER STATION
SORTING STATION
SANITARY LANDFILL
ABU DHABI EMIRATE
ARABIAN GULF
AL SILAAL MIRFA
MADINAT ZAYED
AL DHAFRA
AL MAFRAQ
REMAH
SWELHAN
AL HIYAR
AL KHATIM
AL JABANNAAL GIPINOM GHURBAN
LIWA
RUWAIS
TABLE 11.2 Existing Waste Management Facilities in the Emirate of Abu Dhabi
NAME & LOCATION CAPACITY OF WASTE FACILITY WASTE PRODUCED
TRANSFER STATION, AL AIN NOT AVAILABLE
MEDICAL WASTE INCINERATOR, TWO LINES WITH OPERATIONAL CAPACITY OF AL AIN ABOUT 200 KG/HOUR EACH
FALLEN STOCK INCINERATOR, AL AIN TWO LINES WITH DESIGN CAPACITY OF ABOUT 650 KG/HOUR EACH
SANITARY LANDFILL, AL AIN NOT APPLICABLE
C & D WASTE CRUSHER PLANT, AL AIN 2,000 TONNES/DAY
TYRE RECYCLING PLANT, AL AIN ABOUT 6.3 TONNES/HOUR (GULF RUBBER FACTORY LLC)
PLASTIC RECYCLING PLANT, AL AIN HIGH DENSITY LINE WITH A THROUGHPUT OF 1 TONNES/HOUR AND LOW DENSITY WITH A THROUGHPUT OF 0.4 TONNES/HOUR
SORTING STATION, AL AIN 1,000 TO 1,200 TONNES/DAY
COMPOST PLANT, AL AIN 400 TONNES/DAY
CONTROLLED DUMP SITE, AL AIN NOT APPLICABLE
USED OIL RECYCLING PLANT, ABU DHABI 1,500 LITRES/HOUR
TRANSFER STATION, AL MAFRAQ NOT AVAILABLE
AL DAFRAH DUMPSITE, ABU DHABI NOT APPLICABLE
COMPOST PLANT, AL MAFRAQ COMBINED DESIGNED CAPACITY OF COMPOST PLANT, AL KHATIM ABOUT 100,000 TONNES/ANNUM COMPOST PLANT, LIWA
CONTROLLED DUMP SITE, AL DHAFRA REGION SILA DUMP SITE MARFA DUMPSITE RUWAIS DUMPSITE NOT APPLICABLE MEDINA ZAYED DUMPSITE LIWA/AL JIFN LIWA/AL JABBANA LIWA/UM AL GHURBAN (ARADA)
C & D WASTE CRUSHER PLANT, 8,000 TONNES/DAY AL DHAFRAH – ABU DHABI
SOURCE: TADWEER, 2016 [7]
TABLE 11.3 Number of STPs and Design Capacities CRITERIA 2012 2013 2014 2015
NO. OF STPS 37 37 37 39
DESIGN CAPACITY 1,155 1,184 1,200 1,214 (ML/D)
SOURCE: RSB, 2014 [11], ADSSC, 2015 [ 12]
WASTE
1110
Outreach and CommunicationIn 2010 the level of awareness on waste management-related issues among residents of Abu Dhabi Emirate was 62.9 %. The figure indicates a fair understanding of waste management issues and their impact on the environment. However, the trend in waste practices in 2010 highlights that in spite of a good level of understanding of the waste impact on the environment, only a few percent of the public were taking action and adapting sustainable waste management practices. The behaviour results for waste-related issues in 2010 indicate that only 11.6 % of the public were taking active steps to reduce the number of plastic bags they used. Likewise, only 13.3 % were segregating their waste, 7.9 % were printing on both sides of paper and just 9.3 % were actively recycling at least some items [13].
In order to encourage the general population to be more environmentally responsible, over the last five years, EAD, Tadweer and a number of other relevant entities have conducted several educational and awareness activities on waste issues. These include: the Paperless Day Initiative; the Sustainable Schools and Sustainable Campus Initiatives; clean-up campaigns; the UAE Plastic Bag Free campaign; regular workshops; and the development of educational materials such as The Sustainable Waste Management For Organisations guide and waste-related infographics [14, 15, 16].
Outreach educational tools and activities had a noticeable impact on the overall level of awareness and behaviour on waste issues among the residents of Abu Dhabi Emirate. The results from 2014 indicated an increase in the level of awareness and behaviour since 2010. In 2014, the level of awareness on waste management issues increased to 70 %, with the overall level of sustainable behaviour rising to 52 % [17].
decade, and 39 in 2015. The maximum volumetric treatment design capacity increased from 372.8 million litres per day (Ml/d)) in the 1990s to 418 Ml/d in the last decade, and 1,214 Ml/d in 2015. The total percentage increase between 2015 and the 1990s was 226 % [10].
Table 11.3 shows the change in the number of STPs and maximum volumetric treatment design capacity between 2012 and 2015 [11, 12].
The treatment levels adopted for wastewater over the last 20 years are almost the same, with tertiary treatment technology in most of the STPs, and trickling filters in some small-scale treatment facilities. However, the technologies of sewage sludge treatment were enhanced. The main treatment during the 1990s was stabilisation only, with thickening and drying beds being used over the last 10 years [10].
Table 11.4 shows the total annual flow and average daily flow handled by the STPs between 2011 and 2015. In 2015 the treatment systems managed an annual total flow of 344,389 Ml/d with an increase of about 40 % compared to the annual flow in 2011 [11, 12].
It is noteworthy that the limited quantities of wastewater transferred by tankers is not accepted for disposal by ADSSC networks due to quality. Currently, RSB is developing tankering regulations to tackle this issue.
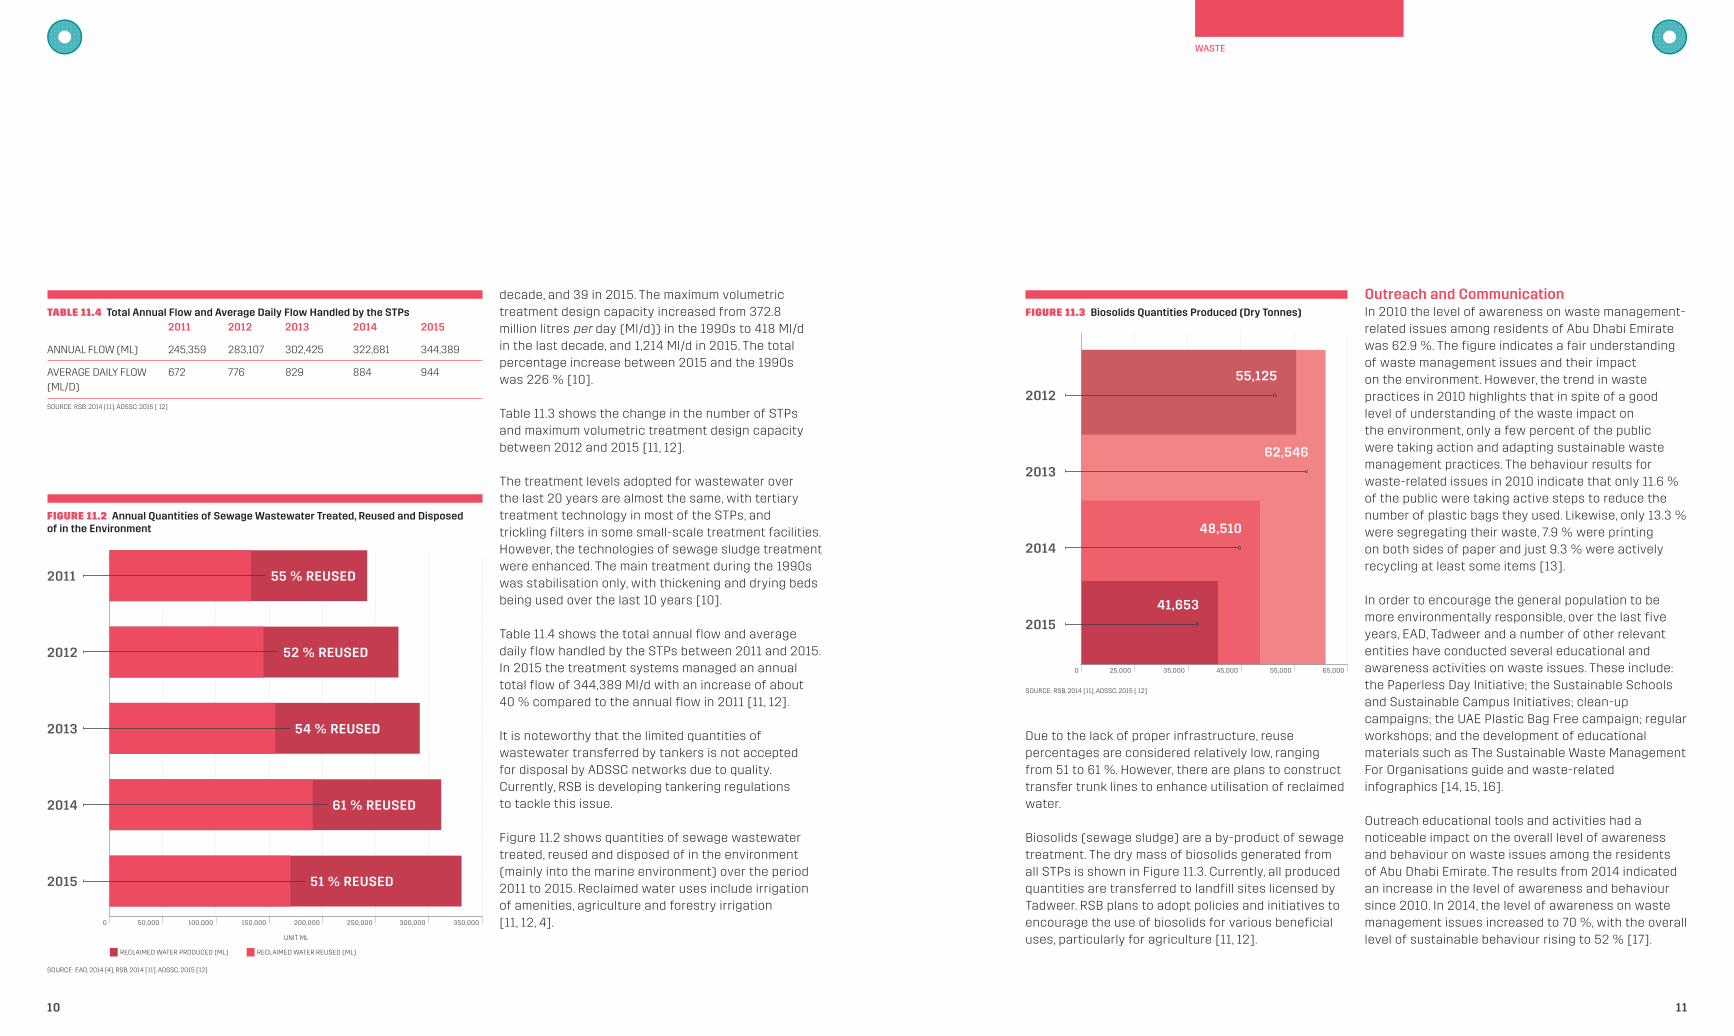
Figure 11.2 shows quantities of sewage wastewater treated, reused and disposed of in the environment (mainly into the marine environment) over the period 2011 to 2015. Reclaimed water uses include irrigation of amenities, agriculture and forestry irrigation [11, 12, 4].
TABLE 11.4 Total Annual Flow and Average Daily Flow Handled by the STPs 2011 2012 2013 2014 2015
ANNUAL FLOW (ML) 245,359 283,107 302,425 322,681 344,389
AVERAGE DAILY FLOW 672 776 829 884 944 (ML/D)
SOURCE: RSB, 2014 [11], ADSSC, 2015 [ 12]
FIGURE 11.2 Annual Quantities of Sewage Wastewater Treated, Reused and Disposed of in the Environment
FIGURE 11.3 Biosolids Quantities Produced (Dry Tonnes)
2011 55 % REUSED
55,125
62,546
48,510
41,653
2012
2012
2013
2013
2014
2014
2015
2015
UNIT ML
RECLAIMED WATER PRODUCED (ML) RECLAIMED WATER REUSED (ML)
SOURCE: EAD, 2014 [4], RSB, 2014 [11], ADSSC, 2015 [12]
SOURCE: RSB, 2014 [11], ADSSC, 2015 [ 12]
0
0
100,000
35,000
200,000
55,000
150,000
45,000
50,000
25,000
300,000250,000
65,000
350,000
52 % REUSED
54 % REUSED
61 % REUSED
51 % REUSED
Due to the lack of proper infrastructure, reuse percentages are considered relatively low, ranging from 51 to 61 %. However, there are plans to construct transfer trunk lines to enhance utilisation of reclaimed water.
Biosolids (sewage sludge) are a by-product of sewage treatment. The dry mass of biosolids generated from all STPs is shown in Figure 11.3. Currently, all produced quantities are transferred to landfill sites licensed by Tadweer. RSB plans to adopt policies and initiatives to encourage the use of biosolids for various beneficial uses, particularly for agriculture [11, 12].
WASTE
23.1
74.3
33.2
3.4
13
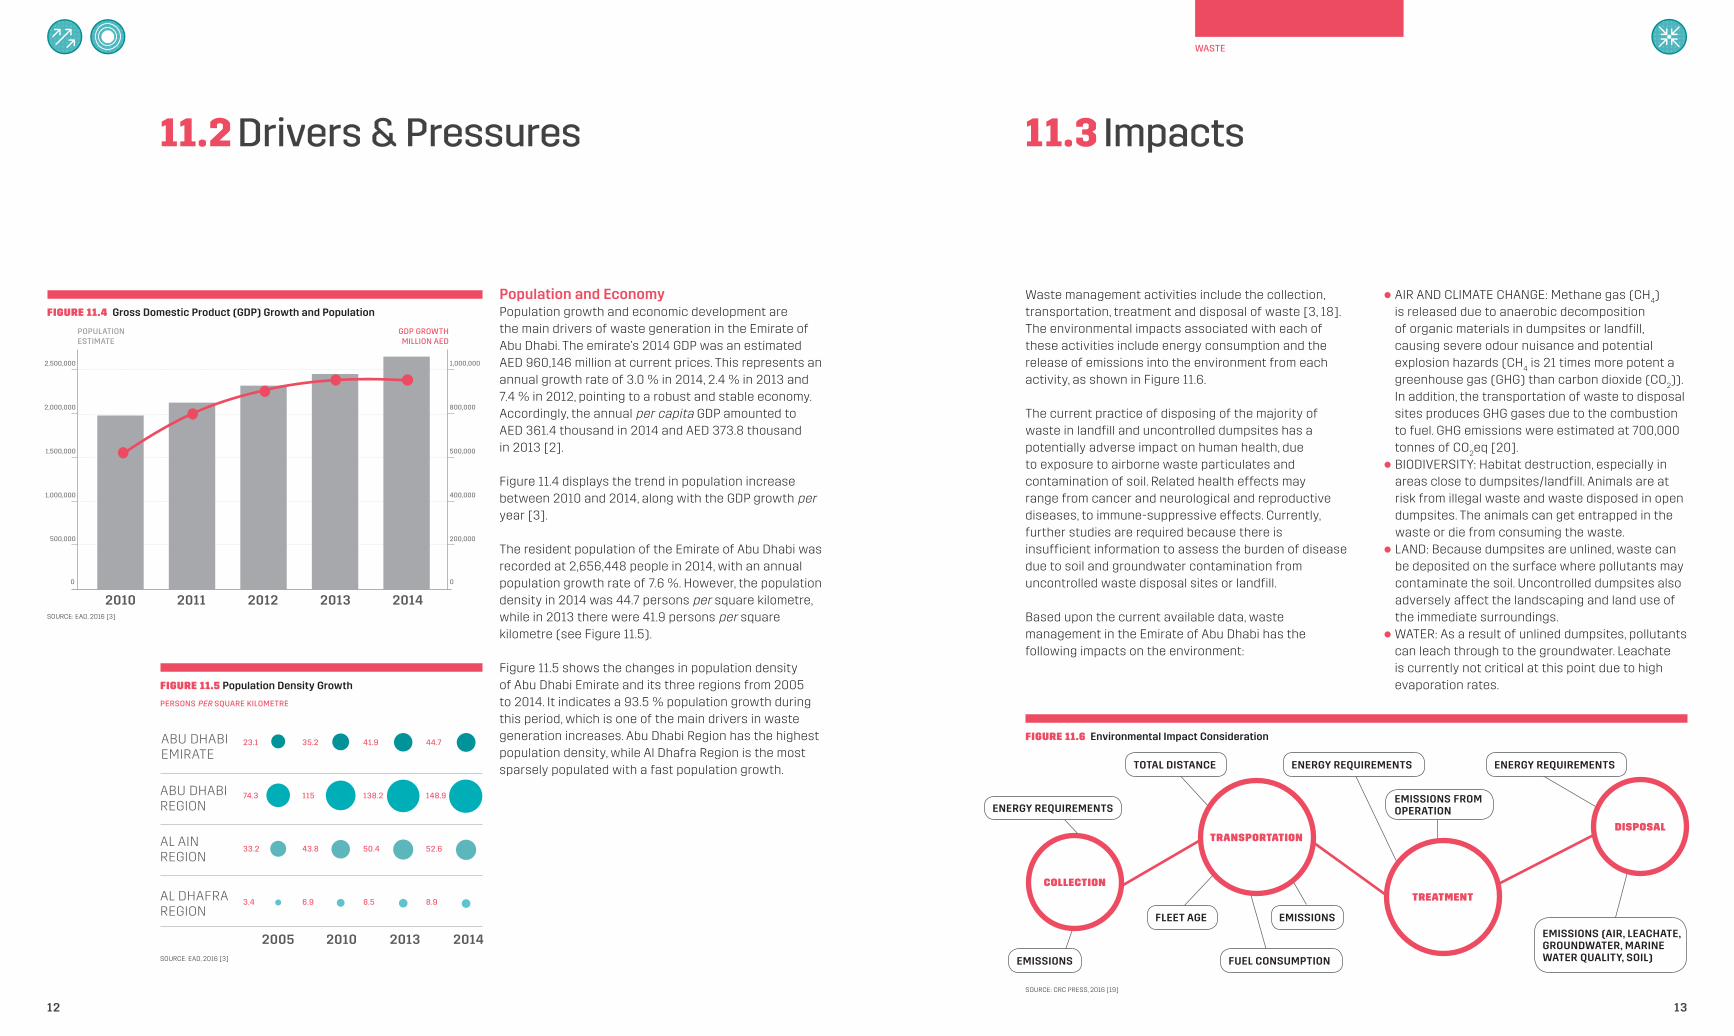
Population and EconomyPopulation growth and economic development are the main drivers of waste generation in the Emirate of Abu Dhabi. The emirate’s 2014 GDP was an estimated AED 960,146 million at current prices. This represents an annual growth rate of 3.0 % in 2014, 2.4 % in 2013 and 7.4 % in 2012, pointing to a robust and stable economy. Accordingly, the annual per capita GDP amounted to AED 361.4 thousand in 2014 and AED 373.8 thousand in 2013 [2].
Figure 11.4 displays the trend in population increase between 2010 and 2014, along with the GDP growth per year [3].
The resident population of the Emirate of Abu Dhabi was recorded at 2,656,448 people in 2014, with an annual population growth rate of 7.6 %. However, the population density in 2014 was 44.7 persons per square kilometre, while in 2013 there were 41.9 persons per square kilometre (see Figure 11.5).
Figure 11.5 shows the changes in population density of Abu Dhabi Emirate and its three regions from 2005 to 2014. It indicates a 93.5 % population growth during this period, which is one of the main drivers in waste generation increases. Abu Dhabi Region has the highest population density, while Al Dhafra Region is the most sparsely populated with a fast population growth.
Waste management activities include the collection, transportation, treatment and disposal of waste [3, 18]. The environmental impacts associated with each of these activities include energy consumption and the release of emissions into the environment from each activity, as shown in Figure 11.6.
The current practice of disposing of the majority of waste in landfill and uncontrolled dumpsites has a potentially adverse impact on human health, due to exposure to airborne waste particulates and contamination of soil. Related health effects may range from cancer and neurological and reproductive diseases, to immune-suppressive effects. Currently, further studies are required because there is insufficient information to assess the burden of disease due to soil and groundwater contamination from uncontrolled waste disposal sites or landfill.
Based upon the current available data, waste management in the Emirate of Abu Dhabi has the following impacts on the environment:
l AIR AND CLIMATE CHANGE: Methane gas (CH4)
is released due to anaerobic decomposition of organic materials in dumpsites or landfill, causing severe odour nuisance and potential explosion hazards (CH
4 is 21 times more potent a
greenhouse gas (GHG) than carbon dioxide (CO2)).
In addition, the transportation of waste to disposal sites produces GHG gases due to the combustion to fuel. GHG emissions were estimated at 700,000 tonnes of CO
2eq [20].
l BIODIVERSITY: Habitat destruction, especially in areas close to dumpsites/landfill. Animals are at risk from illegal waste and waste disposed in open dumpsites. The animals can get entrapped in the waste or die from consuming the waste.
l LAND: Because dumpsites are unlined, waste can be deposited on the surface where pollutants may contaminate the soil. Uncontrolled dumpsites also adversely affect the landscaping and land use of the immediate surroundings.
l WATER: As a result of unlined dumpsites, pollutants can leach through to the groundwater. Leachate is currently not critical at this point due to high evaporation rates.
11.2 Drivers & Pressures
12
FIGURE 11.4 Gross Domestic Product (GDP) Growth and Population
FIGURE 11.6 Environmental Impact Consideration
FIGURE 11.5 Population Density Growth
GDP GROWTHMILLION AED
PERSONS PER SQUARE KILOMETRE
POPULATIONESTIMATE
2010 2011 2013
2013
2012 2014
2014
0 0
500,000 200,000
1,000,000 400,000
1,500,000 500,000
2,000,000 800,000
2,500,000 1,000,000
SOURCE: EAD, 2016 [3]
SOURCE: EAD, 2016 [3]
2005 2010
AL DHAFRA REGION
ABU DHABI EMIRATE
ABU DHABI REGION
AL AIN REGION
35.2
115
43.8
6.9
41.9
138.2
50.4
8.5
44.7
148.9
52.6
8.9
11.3 Impacts
EMISSIONS
FLEET AGE
FUEL CONSUMPTION
ENERGY REQUIREMENTS ENERGY REQUIREMENTS
EMISSIONS (AIR, LEACHATE, GROUNDWATER, MARINE WATER QUALITY, SOIL)
EMISSIONS FROM OPERATION
EMISSIONS
COLLECTION
DISPOSAL
TREATMENT
TRANSPORTATION
ENERGY REQUIREMENTS
TOTAL DISTANCE
SOURCE: CRC PRESS, 2016 [19]
WASTE
15
management in the Emirate of Abu Dhabi. The new policies include: waste planning; waste classification, licensing and enforcement; waste collection, segregation, transfer and tracking; waste reuse and recycling; and resource recovery, treatment and disposal. They also include a technical guideline for waste classification [21].
These policies will serve as a framework for the waste sector, and will assist EAD in its mission to create a completely integrated system that encourages recycling and reuse, reducing the waste sent to landfills. This step marks a major milestone in EAD’s contribution
to the Abu Dhabi Government’s strategy to transform the emirate into a city that continues to meet global standards [6].
Hazardous Waste ManagementIn 2001, ADNOC built the BeAAT facility to safely manage hazardous waste generated by its operations. This facility is currently undergoing expansion of its treatment units to cater for future requirements. ADNOC also identified a need for the treatment and disposal of sludge and drill-cuttings contaminated with naturally occurring radioactive material (NORM), so new treatment units are under construction in coordination with FANR [4].
Licenses, Tariffs and Customer ServiceImposing tariffs on waste is one of the many means which has been universally adopted to reduce the volume of waste production by promoting waste reduction at its source. Tadweer has adopted a tariff system that applies to commercial and industrial sectors [3].
Behaviour Change: Paperless DayIn order to encourage the minimisation of waste, on one day each year organisations, schools and individuals commit to reducing their wasteful paper. The Paperless Day initiative has highlighted just how easy it is to make better paper-related decisions and deliver positive change within organisations, schools and the environment.
Many participants have seen the benefits of reducing wasteful paper use: as well as reducing waste, it saves money and time, and encourages a more thoughtful approach to resource use, life in general and doing business. Saving paper also reduces the impact on the environment and the population’s contribution to climate change by reducing the amount of waste that goes to landfill, saving trees (forest habitats and species), and reducing water use, water and air pollution and carbon emissions [3].
In addition to the Paperless Day, other initiatives include Earth Day, clean the beach day, diving to clean, and the beach activists.
DUPM’s Estidama’s Pearl Rating SystemEstidama, Arabic for sustainability, is an initiative developed and promoted by the DUPM. Estidama is not just a rating method or a specific action, rather it is a vision and desire to achieve a new sustainable way of life in the Arab world. The ultimate goal of Estidama is to preserve and enrich Abu Dhabi Emirate’s physical and cultural identity, while creating an always-improving quality of life for its residents on four equal pillars of sustainability: environmental, economic, social and cultural. This touches all aspects of life in Abu Dhabi Emirate in order to attain a sustainable way of life, from the way construction is built and products are resourced, to the manner in which people live and choices are made.
Estidama arose from the need to properly plan, design, construct and operate sustainable developments. On one hand, this must take into account a respect for the traditions embedded within the rich local culture, with the harsh climatic nature of the region on the other. To this end, project owners, developers, design teams and even residents must think differently about how they approach design and planning processes [3].
Saving GraceThe Saving Grace Project, known locally as Hefth Al Ne’ma, is a humanitarian initiative overseen by the Red Crescent. It aims to overcome the extravagance and waste of food surpluses, redistributing them to the poor and needy with the support of ADFCA and DUPM. Since its establishment in 2005, the project has helped alleviate the suffering of thousands of needy families, orphans and workers, as well as increasing public awareness about the importance of empathy with the suffering of the disadvantaged in society. The project is divided into several sections aimed at reducing waste of food and other products, such as furniture, clothing and medicine [3].
14
Waste Management Strategy for the Emirate of Abu DhabiThe high-level strategy for waste management in Abu Dhabi Emirate was developed jointly by EAD, Tadweer, FANR and ADSSC. This is inclusive of all types of waste, including those from the oil and gas sector. The strategy aims to upgrade the emirate’s waste management infrastructure, operations, monitoring and funding mechanisms over the next five years [4].
Abu Dhabi Waste Policies and GuidelinesIn 2015, EAD and Tadweer issued a set of policies and guidelines aiming to reinforce sustainable waste
11.4 Responses
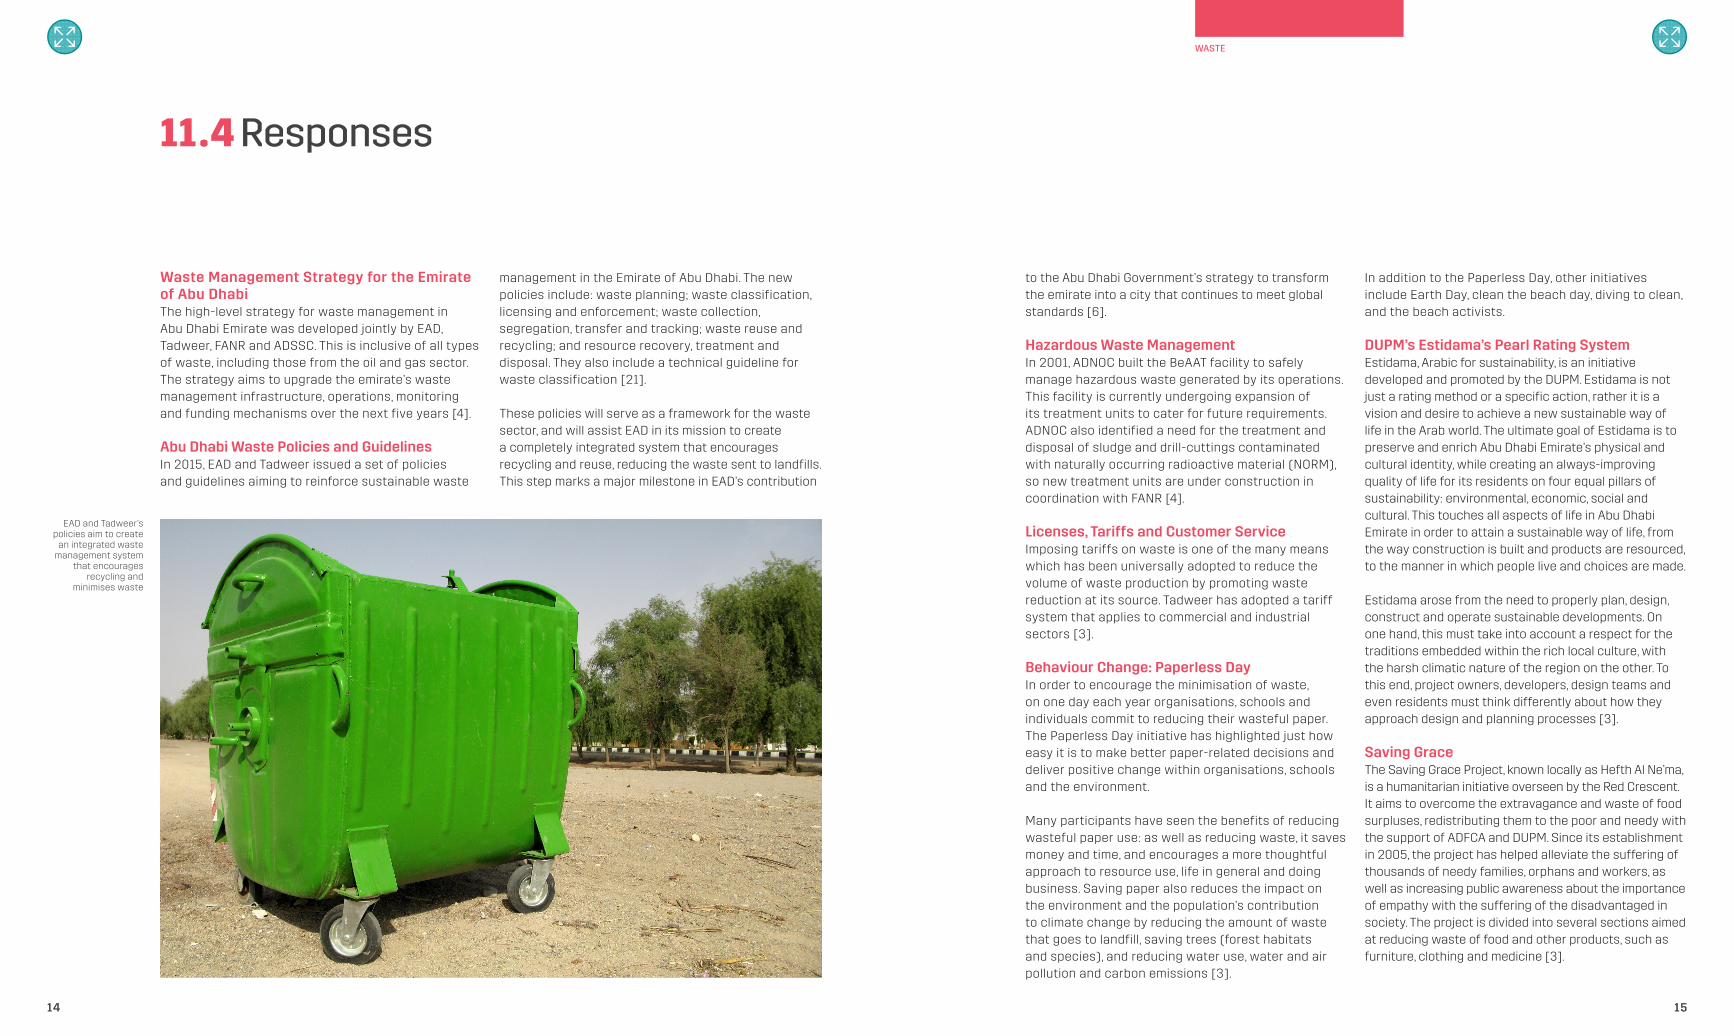
EAD and Tadweer’s policies aim to create
an integrated waste management system
that encourages recycling and
minimises waste
WASTE
Looking AheadWaste generation in Abu Dhabi Emirate is expected to increase due to the growth of the population and economy, alongside increasing affluence. Sectoral quantities for municipal solid waste (MSW), construction and demolition waste, and hazardous and industrial waste are likely to increase by 6 %, 2 % and 7 % respectively. To establish a world-class sustainable waste management system which diverts polluting waste away from landfill disposal and maximises resource recovery properly, the UAE set two strategic targets to be achieved by all emirates by 2021 (1.5 kg MSW capita/day and 75 % of MSW generated to be treated). Also, Abu Dhabi Emirate, through the Abu Dhabi Plan, set a national target that should be achieved by 2020 (60 % of total waste generated to be treated using environmentally and economically sustainable methods).
Regulatory FrameworkBased on the five waste management policies that were developed, a set of regulatory instruments (regulations, codes of practices and guidelines) will be established. These include: permits and enforcement for waste sector; waste classification; waste reuse; waste treatment and disposal; extended producer responsibility; illegal dumping; landfills management; and waste tariffs. The development of this regulatory framework will be based on the principles depicted by the waste hierarchy and life cycle analysis (LCA). The waste hierarchy and LCA will take into account the reduction in the amount of waste generated, reuse or recycling of the waste (including resource recovery), waste treatment using best available technology, and disposal in a sanitary landfill (only when it cannot be otherwise managed). Sustainable consumption and LCA are key factors for reducing waste generation in the emirate [6].
Integrated Waste Management Master PlanThrough CWM, the Emirate of Abu Dhabi is developing an Integrated Waste Management Master Plan (IWMMP) to achieve sustainable waste management over a period of 25 years. IWMMP will cover non-hazardous solid waste, hazardous solid waste, hazardous liquid waste and recyclables [22].
IWMMP will be developed adopting an LCA approach, focusing on: the integration of activities from the point of waste generation; and collection through to the final reuse, recycling, resource recovery or disposal. It aims to put in place a proper solution for the challenges facing sustainable waste management in the emirate, such as: availability of hazardous and medical waste treatment facilities; availability of sanitary landfill for solid waste; illegal dumping of waste; and deficiencies and gaps in the availability and quality of data for proper decision-making.
IWMMP will consider different scenarios for material recovery facilities (MRF), energy from residual
waste, as well as treatment of hazardous waste in a sustainable manner, evaluating these factors technologically, environmentally, financially and for versatility, to present the most preferred scenario.Strategically, the emirate will move away from landfill and will plan closure of the existing dumpsites in the long term.
Wastewater and BiosolidsIn January 2015, RSB issued Forward Plan 2015-2019, identifying priority areas and initiatives that will be undertaken to drive progress in these areas [23]. Relevant initiatives are: l Updating regulations to facilitate social and
economic development l Improving the performance of wastewater
networks l Improving license protocols for engaging
customers, connecting premises and supplying services
l Developing a robust policy for implementing more cost-reflective tariffs and supporting implementation through effective communication
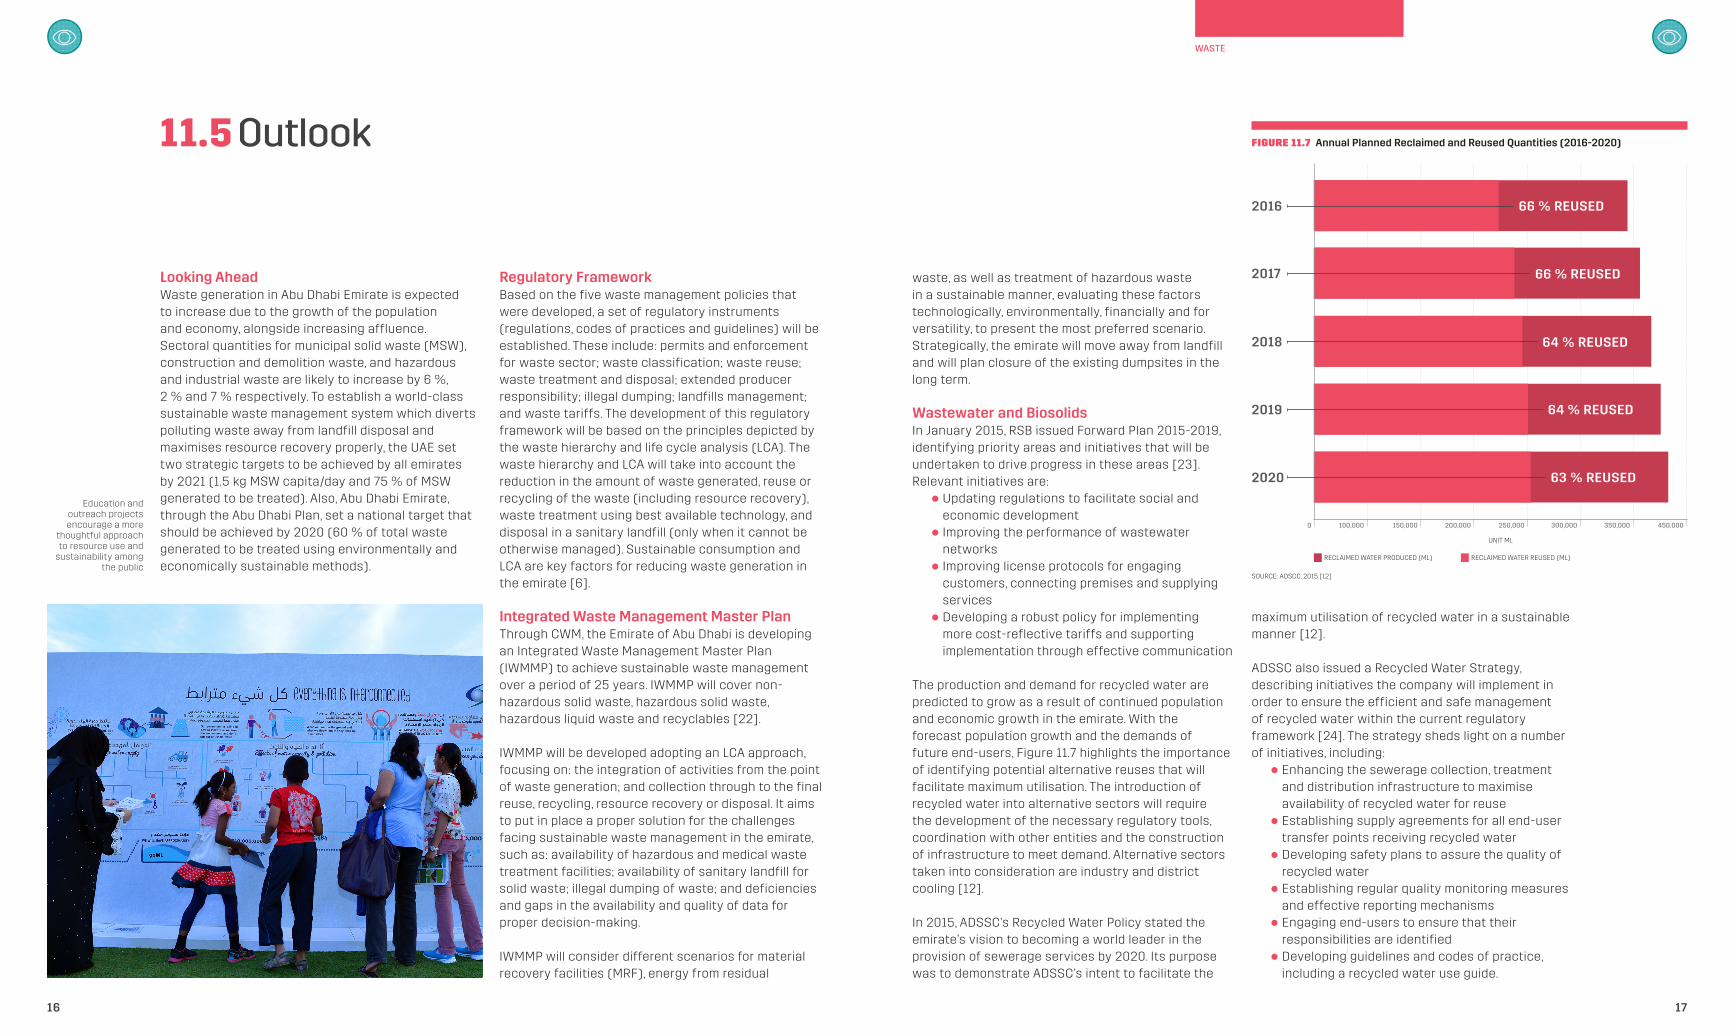
The production and demand for recycled water are predicted to grow as a result of continued population and economic growth in the emirate. With the forecast population growth and the demands of future end-users, Figure 11.7 highlights the importance of identifying potential alternative reuses that will facilitate maximum utilisation. The introduction of recycled water into alternative sectors will require the development of the necessary regulatory tools, coordination with other entities and the construction of infrastructure to meet demand. Alternative sectors taken into consideration are industry and district cooling [12].
In 2015, ADSSC’s Recycled Water Policy stated the emirate’s vision to becoming a world leader in the provision of sewerage services by 2020. Its purpose was to demonstrate ADSSC’s intent to facilitate the
maximum utilisation of recycled water in a sustainable manner [12].
ADSSC also issued a Recycled Water Strategy, describing initiatives the company will implement in order to ensure the efficient and safe management of recycled water within the current regulatory framework [24]. The strategy sheds light on a number of initiatives, including: l Enhancing the sewerage collection, treatment
and distribution infrastructure to maximise availability of recycled water for reuse
l Establishing supply agreements for all end-user transfer points receiving recycled water
l Developing safety plans to assure the quality of recycled water
l Establishing regular quality monitoring measures and effective reporting mechanisms
l Engaging end-users to ensure that their responsibilities are identified
l Developing guidelines and codes of practice, including a recycled water use guide.
11.5 Outlook FIGURE 11.7 Annual Planned Reclaimed and Reused Quantities (2016-2020)
2016 66 % REUSED
2017
2018
2019
2020
UNIT ML
RECLAIMED WATER PRODUCED (ML) RECLAIMED WATER REUSED (ML)
SOURCE: ADSCC, 2015 [12]
0 150,000 250,000200,000100,000 350,000300,000 450,000
64 % REUSED
64 % REUSED
66 % REUSED
63 % REUSED
Education and outreach projects encourage a more
thoughtful approach to resource use and
sustainability among the public
WASTE
1716