Embed Size (px)
Citation preview

Introduction
In the last decade, east-west differences in the planktoncommunity have been reported for the subarctic Pacific.For example, rates of primary production and phytoplank-ton concentration are reported to be higher for the western,than the eastern region (Shiomoto & Asami 1999, Sh-iomoto & Hashimoto 2000). These east-west differences inthe phytoplankton community and production are consid-ered to be caused by the differences in the iron concentra-tion (higher in the west, Harrison et al. 1999, Suzuki et al.2002). This east-west difference in the phytoplankton com-munity may also reflect differences in the grazing pressureof the zooplankton community (Mackas & Tsuda 1999,Takahashi et al. 2008). Energy transfer efficiency betweentrophic levels is reported to be higher in the western region
(Taniguchi 1999), the life cycles of the dominant copepodtaxa are known to vary between east-west (Kobari & Ikeda2001, Tsuda et al. 2004, Shoden et al. 2005), and the bodysize of copepods also varies (Tsuda et al. 2001, Kobari etal. 2003b). In these studies the regional variations in cope-pod ecology are attributed to regional variations in tempera-ture and magnitude of the spring phytoplankton bloom (cf.Tsuda et al. 2004).
Regional differences in the plankton community struc-ture have also been reported between the north and south ofthe North Pacific. For example, the phytoplankton concen-tration and biomass are higher in the subarctic than in thetransition or subtropical regions (Odate T 1994) and thenorth-south differences in zooplankton biomass are attribut-able to faunal differences (Odate K 1994). The zooplanktonbiomass of the subarctic and transition regions is dominatedby the large copepod Neocalanus spp., and their abundanceis highest in the transitional region (Nagasawa et al. 2001,Kobari et al. 2003a). The developmental rate of copepods is
Abundance and biomass of mesozooplankton along north-south transects (165°E and 165°W) in summer in the North Pacific: an analysis with an optical plankton counter
KOHEI MATSUNO* & ATSUSHI YAMAGUCHI
Laboratory of Marine Biology, Graduate School of Fisheries Sciences, Hokkaido University, 3–1–1 Minatomachi, Hakodate,Hokkaido 041–8611, Japan
Received 13 November 2009; Accepted 2 July 2010
Abstract: Zooplankton abundance and biomass along 165°E and 165°W in the North Pacific were estimated using anoptical plankton counter on preserved samples collected with a plankton net of 335 mm mesh-size from 0–150 m at 89stations from the subarctic to subtropical regions during the summers of 2003–2006; the stations were grouped intosubarctic (SA), transitional (TR) and subtropical (ST) regions for latitudinal comparisons. The two-way ANOVA and apost hoc test showed that total abundance and biomass were significantly larger in SA and smaller in ST stations, re-spectively, than in the other regions, but were not significantly different between 165°E and 165°W. Total ranges ofabundance and biomass were: 34�103–65�103 indiv. m�2 and 2.9–7.9 g dry mass m�2, respectively. The variation inabundance was mainly governed by the variation of 0.34–1.00 mm equivalent spherical diameter (ESD) size class zoo-plankton, but total biomass variations were due mainly to the 2.00–3.00 mm ESD size class, which corresponds to thecalanoid copepod Neocalanus spp. copepodid stage 5 (C5) that had a greater abundance in SA and TR than in ST. De-spite possibly higher abundances of Neocalanus C5 in TR than in SA, abundance and biomass of the 2.00–3.00 mmESD size class were not significantly different between the two regions. Size reduction of individuals due to higher tem-peratures in TR than in SA may be a possible explanation.
Key words: abundance, biomass, optical plankton counter, size, zooplankton
Plankton Benthos Res 5(4): 123–130, 2010
* Corresponding author: Kohei Matsuno; E-mail, [email protected]
Plankton & Benthos Research
© The Plankton Society of Japan

also reported to be faster in the south, which may be causedby the higher temperature there than in the northern regions(Batten et al. 2003).
The reported east-west and north-south differences inmesozooplankton communities (Mackas & Tsuda 1999,Batten et al. 2003) suggest that there are also regional dif-ferences in abundance and biomass of total zooplankton be-tween these regions. However information especially on re-gional variations in abundance and biomass according tozooplankton size have not been evaluated in detail, becausequantitative comparison of previous studies between eastand west regions is difficult due to differences in samplingmethodologies such as mesh size of plankton nets used,sampling depth and season.
In the present study, we analyzed samples collected withthe same sampling methodologies in the same season, andmade east-west and north-south comparisons of abundanceand biomass of mesozooplankton among regions of theNorth Pacific Ocean during the summers of 2003 to 2006.We did the analysis with an optical plankton counter (OPC)on net-collected samples to estimate zooplankton abun-dance and biomass. Regional differences (north vs south oreast vs west) of abundance and biomass were tested withtwo-way ANOVA, and are discussed.
Materials and Methods
Sampling of zooplankton
Zooplankton samplings were conducted at 4–10 stations(36°00�N–49°30�N) along the 165°E line and at 11–20 sta-tions (22°00�N–53°30�N) along 165°W in the North Pacificduring the cruises of the T/S Oshoro-Maru in the summersof 2003–2006 (total: 96 samples at 89 stations, Fig. 1).Zooplankters were collected by vertical hauls of a NOR-PAC net (mouth diameter 45 cm, mesh size 0.335 mm, Mo-toda 1957) from the upper 150 m during day and/or night.The volume of water filtered through the net was estimatedusing a flow-meter (Rigosha Co. Ltd.) mounted in the netmouth. Volume of water filtered ranged between 15.6 and47.7 m3 (mean�sd: 25.0�4.6 m3). Zooplankton sampleswere immediately fixed with 5% buffered formalin. At eachstation, profiles of water temperature and salinity were ob-tained with a Sea-Bird SBE 911 Plus CTD system.
OPC analysis
After the cruise, formalin-preserved zooplankton sam-ples were processed with an Optical Plankton Counter(OPC, Model OPC-1L: Focal Technologies Corp.). TheOPC can measure the number of particles with 4096 sizecategories between 0.250–20 mm with a precision of0.001–0.021 mm. The OPC measurements were made with1/2–1/8 sub-samples. For avoiding phytoplankton and detri-tus detection, the measurements were done at a flow rateand particle density of about 10 L min�1 and �10 countssec.�1, respectively, using the procedure of Mullin et al.
(2000) and Yokoi et al. (2008).
Abundance
Abundance per square meter (N, indiv. m�2) for each ofthe 4096 equivalent spherical diameter (ESD) size cate-gories was calculated from the following equation:
where n is the number of particles (�zooplankton indiv.), sis the split factor of each sample, F is the filtered volume ofthe net (m3) and 150 is the length of the vertical net tow(m). Because the regional differences in abundance weregreater than the day-night differences (see Results belowand Fig. 4), we made no conversion according to day-nightregime. For the stations where both day and night sam-plings were conducted (Fig. 1), we used the mean values forthe day-night data.
Nn
s F�
�
�
150
124 K. MATSUNO & A. YAMAGUCHI
Fig. 1. Location of sampling transects along 165°E and 165°Win the North Pacific (A). Sampling stations along 165°E (B) and165°W (C) during 2003–2006. Open, solid and half-solid symbolsdenote stations where day, night and both day and night samplingswere conducted, respectively. Open and solid triangles indicate ap-proximate positions of the subarctic front and subarctic boundary,respectively.

Biomass
Wet mass (WM) of the zooplankton community in the4096 size categories was calculated from ESD data by as-suming the relative density of zooplankton to be equal toseawater (�1 mg mm�3). WM was converted to dry mass(DM) assuming that the water content of zooplankton was90% (DM�0.1�WM), which is the mean water content ofzooplankton from subarctic to subtropical areas in theNorth Pacific Ocean above 1,000 m (Yamaguchi et al. 2005,Matsuno et al. 2009). For calibration of OPC derived bio-mass, direct WM measurements were made on all samples
with a precision of 10 mg.
Statistical analysis
To make regional comparisons of abundance and bio-mass data, we further binned the data from the 4096 sizecategories obtained with the OPC into five size classes(0.34–1.00, 1.00–2.00, 2.00–3.00, 3.00–4.00 and 4.00–5.00mm ESD) and the total. For each size class, we used a two-way ANOVA to test for regional differences in the esti-mated variables. We used the definitions of Favorite et al.(1976) for the subarctic front (SAF; 4°C isotherm from 100
Zooplankton community analysis by OPC 125
Fig. 2. Vertical profiles of temperature and salinity along 165°E and 165°W in the North Pacific during summers of2003–2006. Approximate positions of the subarctic front (SAF) and subarctic boundary (SAB) are shown with open and solid tri-angles, respectively.
m to 500 m depth) and the subarctic boundary (SAB; 34PSU isohaline in the upper 150 m depth) to define the threeregions. Thus the subarctic region (SA) was north of theSAF, the transitional region (TR) was between the SAF andthe SAB and the subtropical region (ST) was south of theSAB. In the present study, we treated six regions as inde-pendent variables of two-way ANOVA, e.g. east-west(165°E and 165°W) and north-south (SA, TR and ST). Ifthe ANOVA indicated there were significant differences be-tween regions, then a post hoc test by Fisher’s ProtectedLeast Significant Difference test (PLSD) was carried out.
Results
Hydrography
The temperature in the upper 150 m varied greatly withlatitude (1.6–19.6°C on 165°E, and 3.3–27.0°C on 165°W)(Fig. 2). The position of the SAF, which is the northernboundary of the TR, was stable around 45°N on the 165°Eline in 2003, 2004 and 2006, whereas on the 165°W line itwas located further north and varied between years(47–49°N). In 2005 on 165°E, the SAF was not observed.The position of the SAB, which is at the southern end ofTR, was 40–42°N on 165°E in 2003 and 2004, but variedfrom 39–44°N on 165°W between years. In 2005 and 2006on 165°E, the SAB was not observed. Thus the hydro-graphic variation was greater for the 165°W line.
Zooplankton abundance and biomass
The result of the comparison between direct measuredwet-mass and estimated OPC derived wet-mass is shown inFig. 3. A highly significant correlation (r2�0.79, p�0.0001) was observed between these variables (Fig. 3). Theslope of the regression line was 1.16, indicating that theOPC data overestimated by 16% on average compared todirectly measured mass.
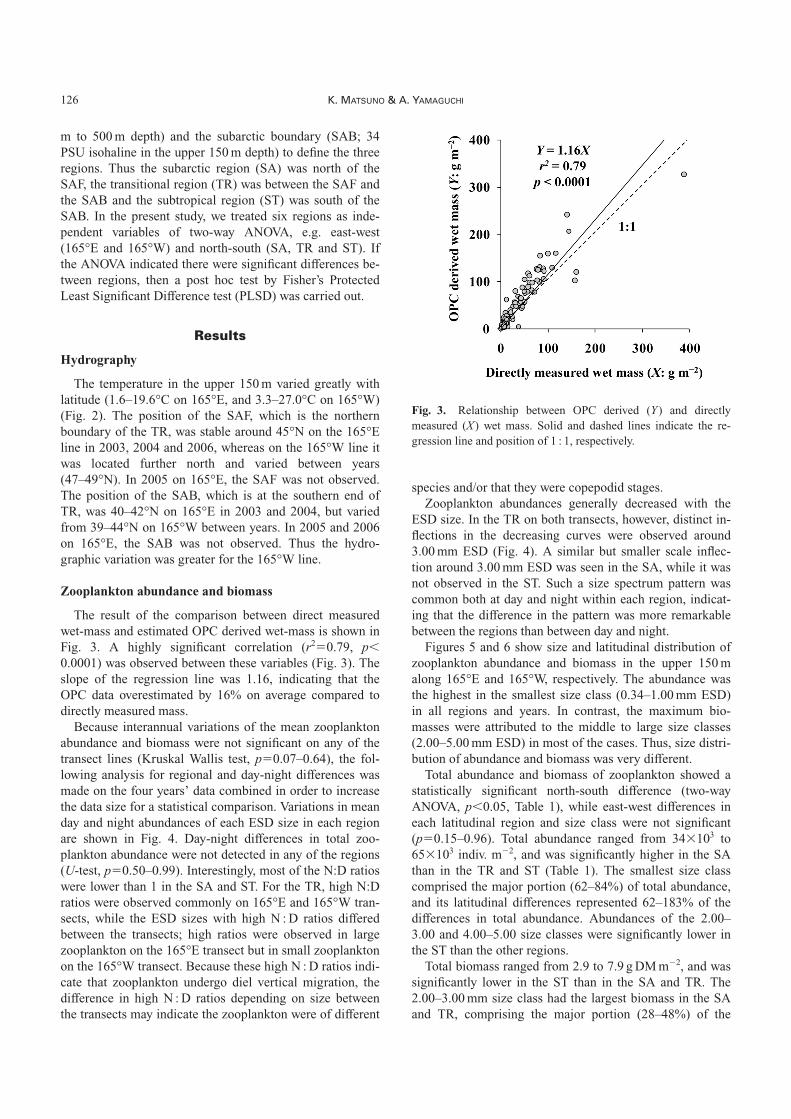
Because interannual variations of the mean zooplanktonabundance and biomass were not significant on any of thetransect lines (Kruskal Wallis test, p�0.07–0.64), the fol-lowing analysis for regional and day-night differences wasmade on the four years’ data combined in order to increasethe data size for a statistical comparison. Variations in meanday and night abundances of each ESD size in each regionare shown in Fig. 4. Day-night differences in total zoo-plankton abundance were not detected in any of the regions(U-test, p�0.50–0.99). Interestingly, most of the N:D ratioswere lower than 1 in the SA and ST. For the TR, high N:Dratios were observed commonly on 165°E and 165°W tran-sects, while the ESD sizes with high N : D ratios differedbetween the transects; high ratios were observed in largezooplankton on the 165°E transect but in small zooplanktonon the 165°W transect. Because these high N : D ratios indi-cate that zooplankton undergo diel vertical migration, thedifference in high N : D ratios depending on size betweenthe transects may indicate the zooplankton were of different
species and/or that they were copepodid stages.Zooplankton abundances generally decreased with the
ESD size. In the TR on both transects, however, distinct in-flections in the decreasing curves were observed around3.00 mm ESD (Fig. 4). A similar but smaller scale inflec-tion around 3.00 mm ESD was seen in the SA, while it wasnot observed in the ST. Such a size spectrum pattern wascommon both at day and night within each region, indicat-ing that the difference in the pattern was more remarkablebetween the regions than between day and night.
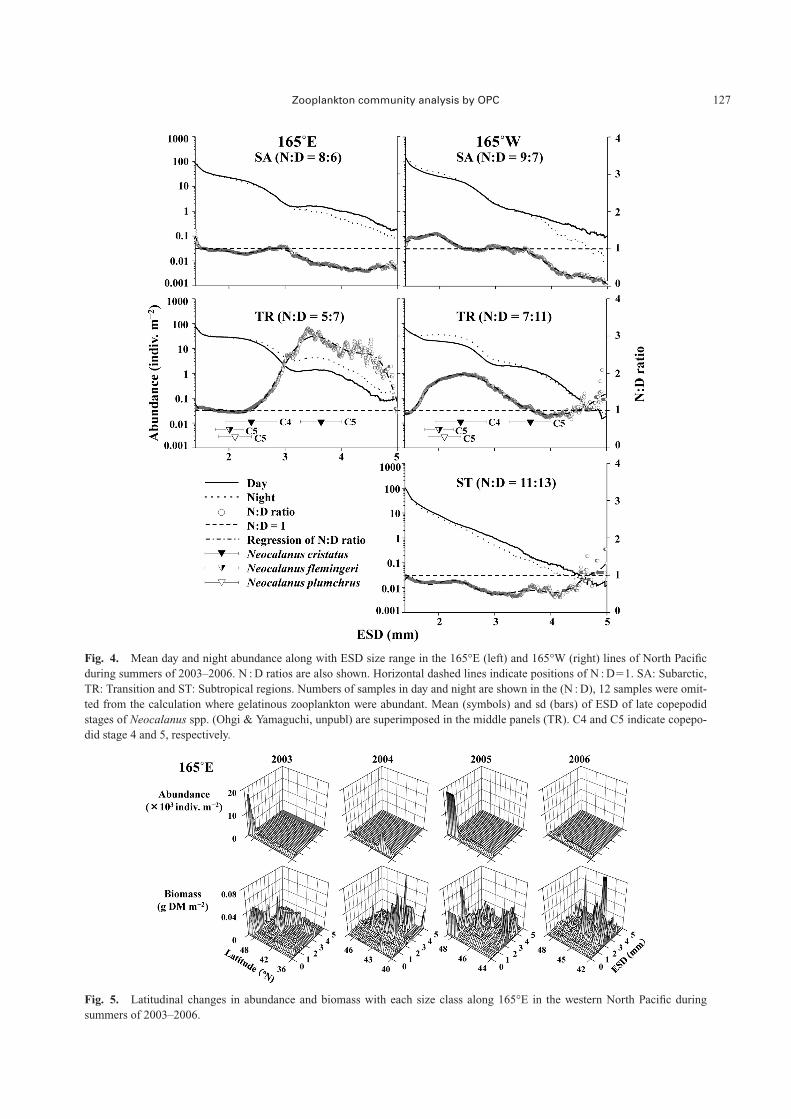
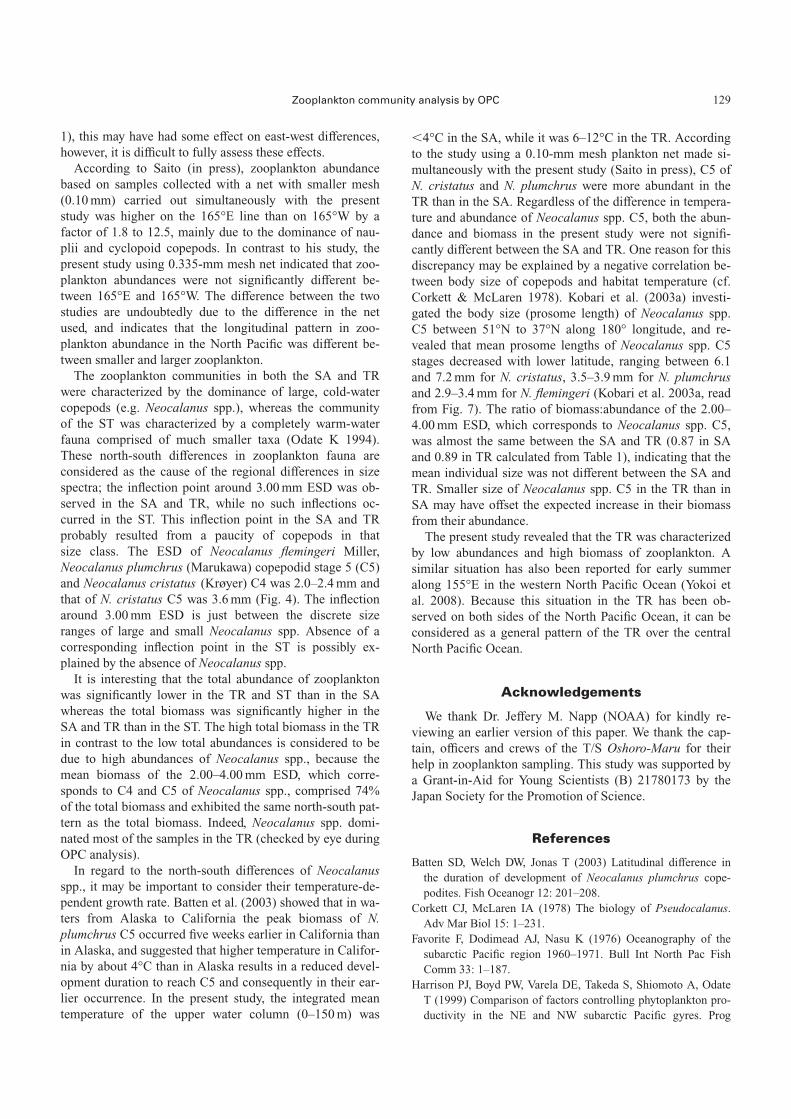
Figures 5 and 6 show size and latitudinal distribution ofzooplankton abundance and biomass in the upper 150 malong 165°E and 165°W, respectively. The abundance wasthe highest in the smallest size class (0.34–1.00 mm ESD)in all regions and years. In contrast, the maximum bio-masses were attributed to the middle to large size classes(2.00–5.00 mm ESD) in most of the cases. Thus, size distri-bution of abundance and biomass was very different.
Total abundance and biomass of zooplankton showed astatistically significant north-south difference (two-wayANOVA, p�0.05, Table 1), while east-west differences ineach latitudinal region and size class were not significant(p�0.15–0.96). Total abundance ranged from 34�103 to65�103 indiv. m�2, and was significantly higher in the SAthan in the TR and ST (Table 1). The smallest size classcomprised the major portion (62–84%) of total abundance,and its latitudinal differences represented 62–183% of thedifferences in total abundance. Abundances of the 2.00–3.00 and 4.00–5.00 size classes were significantly lower inthe ST than the other regions.
Total biomass ranged from 2.9 to 7.9 g DM m�2, and wassignificantly lower in the ST than in the SA and TR. The2.00–3.00 mm size class had the largest biomass in the SAand TR, comprising the major portion (28–48%) of the
126 K. MATSUNO & A. YAMAGUCHI
Fig. 3. Relationship between OPC derived (Y) and directlymeasured (X) wet mass. Solid and dashed lines indicate the re-gression line and position of 1 : 1, respectively.
Zooplankton community analysis by OPC 127
Fig. 4. Mean day and night abundance along with ESD size range in the 165°E (left) and 165°W (right) lines of North Pacificduring summers of 2003–2006. N : D ratios are also shown. Horizontal dashed lines indicate positions of N : D�1. SA: Subarctic,TR: Transition and ST: Subtropical regions. Numbers of samples in day and night are shown in the (N : D), 12 samples were omit-ted from the calculation where gelatinous zooplankton were abundant. Mean (symbols) and sd (bars) of ESD of late copepodidstages of Neocalanus spp. (Ohgi & Yamaguchi, unpubl) are superimposed in the middle panels (TR). C4 and C5 indicate copepo-did stage 4 and 5, respectively.
Fig. 5. Latitudinal changes in abundance and biomass with each size class along 165°E in the western North Pacific duringsummers of 2003–2006.

mean total biomass, and its latitudinal pattern was the sameas that of the total biomass, representing 45–126% of thedifferences in the mean total biomass. The 3.00–4.00 mmESD had the second largest biomass in the TR, and the bio-mass of the 2.00–3.00 plus 4.00–5.00 size classes com-prised 74% of the mean total biomass.
Discussion
In the subarctic Pacific, east-west differences have beenreported for the oceanic environment: low temperature in
the west (Favorite et al. 1976), phytoplankton and primaryproductivity: high in the west (Shiomoto & Asami 1999,Shiomoto & Hashimoto 2000), zooplankton life cycles: dif-ferent periods necessary to complete their life cycles (Ko-bari & Ikeda 2001, Tsuda et al. 2004, Shoden et al. 2005)and zooplankton body size: larger in the west (Tsuda et al.2001, Kobari et al. 2003b). Regardless of these east-westdifferences, east-west differences were not detected for totalzooplankton abundance and biomass in this study. It shouldbe noted that the study period varied slightly between165°E and 165°W (ca. two weeks earlier in 165°E, cf. Fig.
128 K. MATSUNO & A. YAMAGUCHI
Fig. 6. Latitudinal changes in abundance and biomass with each size class along 165°W in the eastern North Pacific duringsummers of 2003–2006.
Table 1. North-south differences in abundance and biomass of zooplankton in the North Pacific during summers of2003–2006. Since the east-west differences were not evident, data of both 165°E and 165°W are combined in this calculationand statistical analysis. “Differences” is the results of two-way ANOVA and between region differences were tested by post-hoc test of Fisher’s PLSD. The letters assigned to each region label indicate the significant of difference; the region labels hav-ing different letters are significantly different from each other. Values are mean�sd. Numbers in parentheses indicate thenumber of stations included in each region. *: p�0.05, **: p�0.01. NS: not significant. SA: Subarctic, TR: Transitional andST: Subtropical region.
Zooplankton RegionDifferences Fisher’s PLSD
Size class SA (30) TR (28) ST (31)
Abundance (�103 indiv. m�2)Total 64.64�66.79 33.95�18.37 41.74�32.27 * SA (a) TR (b) ST (b)0.34–1.00 mm 49.42�61.15 20.90�15.84 35.13�24.93 * SA (a) TR (b) ST (ab)1.00–2.00 mm 10.51�7.03 6.35�3.46 5.09�6.34 ** SA (a) TR (b) ST (b)2.00–3.00 mm 3.96�3.36 5.63�4.68 1.09�2.17 ** SA (a) TR (a) ST (b)3.00–4.00 mm 0.60�0.64 0.92�1.00 0.40�1.63 NS4.00–5.00 mm 0.16�0.22 0.14�0.21 0.03�0.11 * SA (a) TR (a) ST (b)
Biomass (g DM m�2)Total 6.95�4.15 7.85�5.46 2.86�6.14 ** SA (a) TR (a) ST (b)0.34–1.00 mm 0.46�0.52 0.23�0.19 0.34�0.27 * SA (a) TR (b) ST (ab)1.00–2.00 mm 1.83�1.29 1.24�0.79 0.75�0.98 ** SA (a) TR (b) ST (b)2.00–3.00 mm 2.65�2.27 3.78�3.06 0.80�1.70 ** SA (a) TR (a) ST (b)3.00–4.00 mm 1.31�1.47 2.04�2.30 0.83�3.43 NS4.00–5.00 mm 0.70�0.93 0.56�0.86 0.14�0.42 * SA (a) TR (a) ST (b)
1), this may have had some effect on east-west differences,however, it is difficult to fully assess these effects.
According to Saito (in press), zooplankton abundancebased on samples collected with a net with smaller mesh(0.10 mm) carried out simultaneously with the presentstudy was higher on the 165°E line than on 165°W by afactor of 1.8 to 12.5, mainly due to the dominance of nau-plii and cyclopoid copepods. In contrast to his study, thepresent study using 0.335-mm mesh net indicated that zoo-plankton abundances were not significantly different be-tween 165°E and 165°W. The difference between the twostudies are undoubtedly due to the difference in the netused, and indicates that the longitudinal pattern in zoo-plankton abundance in the North Pacific was different be-tween smaller and larger zooplankton.
The zooplankton communities in both the SA and TRwere characterized by the dominance of large, cold-watercopepods (e.g. Neocalanus spp.), whereas the communityof the ST was characterized by a completely warm-waterfauna comprised of much smaller taxa (Odate K 1994).These north-south differences in zooplankton fauna areconsidered as the cause of the regional differences in sizespectra; the inflection point around 3.00 mm ESD was ob-served in the SA and TR, while no such inflections oc-curred in the ST. This inflection point in the SA and TRprobably resulted from a paucity of copepods in that size class. The ESD of Neocalanus flemingeri Miller, Neocalanus plumchrus (Marukawa) copepodid stage 5 (C5)and Neocalanus cristatus (Krøyer) C4 was 2.0–2.4 mm andthat of N. cristatus C5 was 3.6 mm (Fig. 4). The inflectionaround 3.00 mm ESD is just between the discrete sizeranges of large and small Neocalanus spp. Absence of acorresponding inflection point in the ST is possibly ex-plained by the absence of Neocalanus spp.
It is interesting that the total abundance of zooplanktonwas significantly lower in the TR and ST than in the SAwhereas the total biomass was significantly higher in theSA and TR than in the ST. The high total biomass in the TRin contrast to the low total abundances is considered to bedue to high abundances of Neocalanus spp., because themean biomass of the 2.00–4.00 mm ESD, which corre-sponds to C4 and C5 of Neocalanus spp., comprised 74%of the total biomass and exhibited the same north-south pat-tern as the total biomass. Indeed, Neocalanus spp. domi-nated most of the samples in the TR (checked by eye duringOPC analysis).
In regard to the north-south differences of Neocalanusspp., it may be important to consider their temperature-de-pendent growth rate. Batten et al. (2003) showed that in wa-ters from Alaska to California the peak biomass of N. plumchrus C5 occurred five weeks earlier in California thanin Alaska, and suggested that higher temperature in Califor-nia by about 4°C than in Alaska results in a reduced devel-opment duration to reach C5 and consequently in their ear-lier occurrence. In the present study, the integrated meantemperature of the upper water column (0–150 m) was
�4°C in the SA, while it was 6–12°C in the TR. Accordingto the study using a 0.10-mm mesh plankton net made si-multaneously with the present study (Saito in press), C5 ofN. cristatus and N. plumchrus were more abundant in theTR than in the SA. Regardless of the difference in tempera-ture and abundance of Neocalanus spp. C5, both the abun-dance and biomass in the present study were not signifi-cantly different between the SA and TR. One reason for thisdiscrepancy may be explained by a negative correlation be-tween body size of copepods and habitat temperature (cf.Corkett & McLaren 1978). Kobari et al. (2003a) investi-gated the body size (prosome length) of Neocalanus spp.C5 between 51°N to 37°N along 180° longitude, and re-vealed that mean prosome lengths of Neocalanus spp. C5stages decreased with lower latitude, ranging between 6.1and 7.2 mm for N. cristatus, 3.5–3.9 mm for N. plumchrusand 2.9–3.4 mm for N. flemingeri (Kobari et al. 2003a, readfrom Fig. 7). The ratio of biomass:abundance of the 2.00–4.00 mm ESD, which corresponds to Neocalanus spp. C5,was almost the same between the SA and TR (0.87 in SAand 0.89 in TR calculated from Table 1), indicating that themean individual size was not different between the SA andTR. Smaller size of Neocalanus spp. C5 in the TR than inSA may have offset the expected increase in their biomassfrom their abundance.
The present study revealed that the TR was characterizedby low abundances and high biomass of zooplankton. Asimilar situation has also been reported for early summeralong 155°E in the western North Pacific Ocean (Yokoi etal. 2008). Because this situation in the TR has been ob-served on both sides of the North Pacific Ocean, it can beconsidered as a general pattern of the TR over the centralNorth Pacific Ocean.
Acknowledgements
We thank Dr. Jeffery M. Napp (NOAA) for kindly re-viewing an earlier version of this paper. We thank the cap-tain, officers and crews of the T/S Oshoro-Maru for theirhelp in zooplankton sampling. This study was supported bya Grant-in-Aid for Young Scientists (B) 21780173 by theJapan Society for the Promotion of Science.
References
Batten SD, Welch DW, Jonas T (2003) Latitudinal difference inthe duration of development of Neocalanus plumchrus cope-podites. Fish Oceanogr 12: 201–208.
Corkett CJ, McLaren IA (1978) The biology of Pseudocalanus.Adv Mar Biol 15: 1–231.
Favorite F, Dodimead AJ, Nasu K (1976) Oceanography of thesubarctic Pacific region 1960–1971. Bull Int North Pac FishComm 33: 1–187.
Harrison PJ, Boyd PW, Varela DE, Takeda S, Shiomoto A, OdateT (1999) Comparison of factors controlling phytoplankton pro-ductivity in the NE and NW subarctic Pacific gyres. Prog
Zooplankton community analysis by OPC 129

Oceanogr 43: 205–234.Kobari T, Ikeda T (2001) Life cycle of Neocalanus flemingeri
(Crustacea: Copepoda) in the Oyashio region, western subarcticPacific, with notes on its regional variations. Mar Ecol Prog Ser209: 243–255.
Kobari T, Ikeda T, Kanno Y, Shiga N, Takagi S, Azumaya T(2003a) Interannual variations in abundance and body size inNeocalanus copepods in the central North Pacific. J PlanktonRes 25: 483–494.
Kobari T, Tadokoro K, Shiomoto A, Hashimoto S (2003b) Geo-graphical variations in prosome length and body weight of Neo-calanus copepods in the North Pacific. J Oceanogr 59: 3–10.
Mackas DL, Tsuda A (1999) Mesozooplankton in the eastern andwestern subarctic Pacific: Community structure, seasonal lifehistories, and interannual variability. Prog Oceanogr 43: 335–363.
Matsuno K, Kim HS, Yamaguchi A (2009) Causes of under- oroverestimation of zooplankton biomass using Optical PlanktonCounter (OPC): effect of size and taxa. Plankton Benthos Res4: 154–159.
Motoda S (1957) North Pacific standard net. Inform Bull PlanktolJapan 4: 13–15. (in Japanese with English abstract)
Mullin MM, Goetze E, Beaulieu SE, Lasker JM (2000) Compar-isons within and between years resulting in contrasting recruit-ment of Pacific hake (Merluccius productus) in the CaliforniaCurrent System. Can J Fish Aquat Sci 57: 1434–1447.
Nagasawa K, Ohtsuka S, Saeki S, Ohtani S, Zhu GH, Shiomoto A(2001) Abundance and in-situ feeding habits of Neocalanuscristatus (Copepoda: Calanoida) in the Central and WesternNorth Pacific Ocean in summer and winter. Bull Natl Res InstFar Seas Fish 38: 37–52.
Odate K (1994) Zooplankton biomass and its long-term variationin the western North Pacific Ocean, Tohoku Sea Area, Japan.Bull Tohoku Natl Fish Res Inst 56: 115–173. (in Japanese withEnglish abstract)
Odate T (1994) Plankton abundance and size structure in thenorthern North Pacific Ocean in early summer. Fish Oceanogr3: 267–278.
Saito R, Yamaguchi A, Saitoh S-I, Kuma K, Imai I (in press) East-west comparison of the zooplankton community in thesubarctic Pacific during summers of 2003–2006. J Plankton Resdoi:10.1093/plankt/fbq101.
Shiomoto A, Asami H (1999) High-west and low-east distributionpatterns of chlorophyll a, primary productivity and diatoms inthe subarctic North Pacific surface waters, midwinter 1996. JOceanogr 55: 493–503.
Shiomoto A, Hashimoto S (2000) Comparison of east and westchlorophyll a standing stock and oceanic habitat along theTransition Domain of the North Pacific. J Plankton Res 22:1–14.
Shoden S, Ikeda T, Yamaguchi A (2005) Vertical distribution,population structure and life cycle of Eucalanus bungii (Cope-poda: Calanoida) in the Oyashio region, with notes on its re-gional variations. Mar Biol 146: 497–511.
Suzuki K, Liu H, Saino T, Obata H, Takano M, Okamura K,Sohrin Y, Fujishima Y, (2002) East-west gradients in the photo-synthetic potential of phytoplankton and iron concentration inthe subarctic Pacific Ocean during early summer. LimnolOceanogr 47: 1581–1594.
Takahashi K, Kuwata A, Saito H, Ide K (2008) Grazing impact ofthe copepod community in the Oyashio region of the westernsubarctic Pacific Ocean. Prog Oceanogr 78: 222–240.
Taniguchi A (1999) Differences in the structure of the lowertrophic levels of pelagic ecosystems in the eastern and westernsubarctic Pacific. Prog Oceanogr 43: 289–315.
Tsuda A, Saito H, Kasai H (2001) Geographical variation of bodysize of Neocalanus cristatus, N. plumchrus and N. flemingeri inthe subarctic Pacific and its marginal seas: Implications for theorigin of large form of N. flemingeri in the Oyashio area. JOceanogr 57: 341–352.
Tsuda A, Saito H, Kasai H (2004) Life histories of Eucalanusbungii and Neocalanus cristatus (Copepoda: Calanoida) in thewestern subarctic Pacific Ocean. Fish Oceanogr 13: 10–20.
Yamaguchi A, Watanabe Y, Ishida H, Harimoto T, Maeda M,Ishizaka J, Ikeda T, Takahashi MM (2005) Biomass and chemi-cal composition of net-plankton down to greater depths(0–5800 m) in the western North Pacific Ocean. Deep-Sea Res I52: 341–353.
Yokoi Y, Yamaguchi A, Ikeda T (2008) Regional and inter-annualchange in the abundance, biomass and community structure ofmesozooplankton in the western North Pacific in early summer;as analyzed with an optical plankton counter. Bull Plankton SocJapan 55: 9–24. (in Japanese with English abstract)
130 K. MATSUNO & A. YAMAGUCHI