Embed Size (px)
DESCRIPTION
Analytical Chemistry
Citation preview
7/21/2019 AC 16 Colorimetric Analysis for Lab Notebook
http://slidepdf.com/reader/full/ac-16-colorimetric-analysis-for-lab-notebook 1/7
7/21/2019 AC 16 Colorimetric Analysis for Lab Notebook
http://slidepdf.com/reader/full/ac-16-colorimetric-analysis-for-lab-notebook 2/7
7/21/2019 AC 16 Colorimetric Analysis for Lab Notebook
http://slidepdf.com/reader/full/ac-16-colorimetric-analysis-for-lab-notebook 3/7
Student Inquiry Worksheet
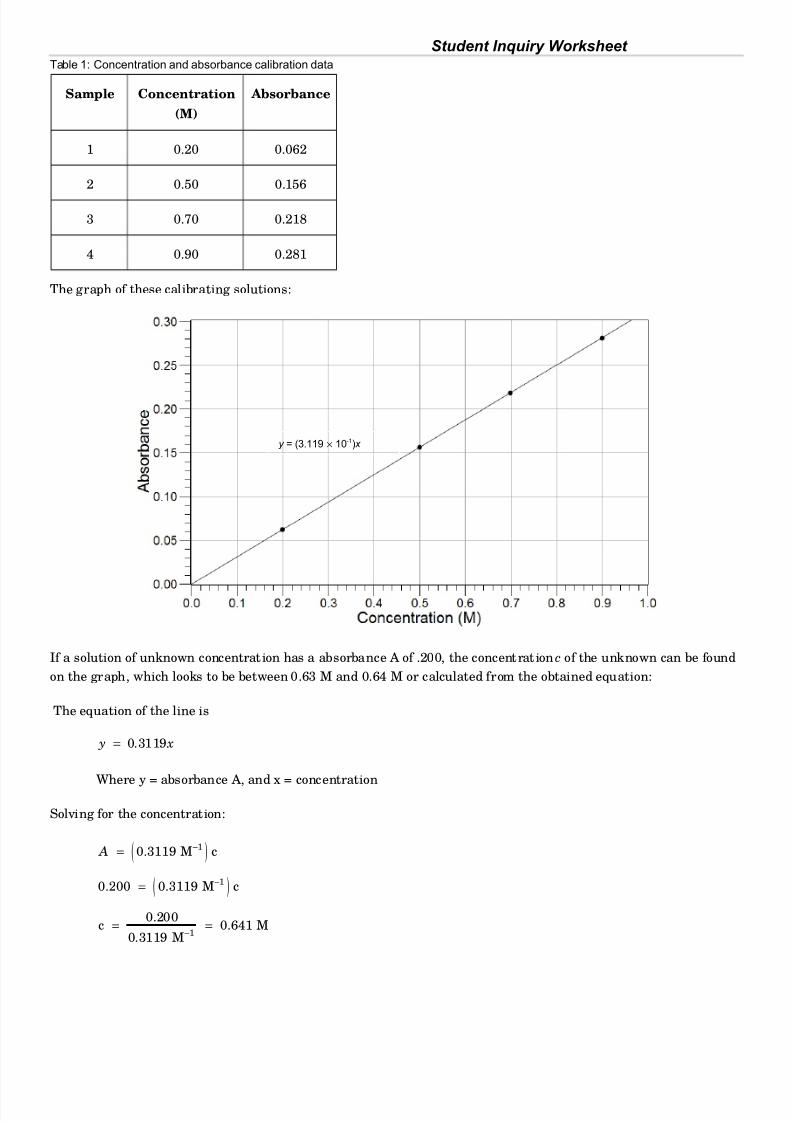
It is worth mentioning that the equation provides a more accurate estimate of the unknown concentration, since the
graph-based estimate can be subjective.
6. Colorimetric Analysis
*
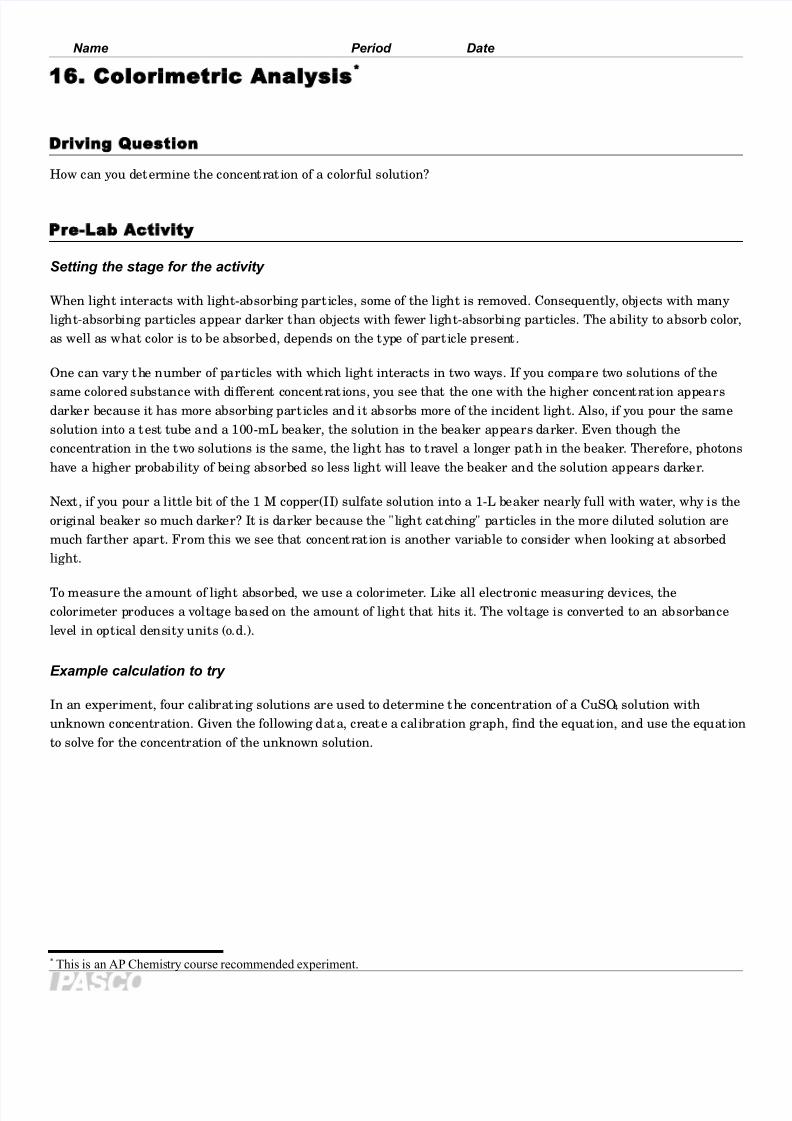
Driving Question
How can you determine the concentration of a colorful solution?
Materials and Eui!ment
For each student or group
♦ Data collection system ♦ Graduated cylinder !0-m"
♦ Colorimeter ♦ #i$et %it& $um$ or bulb 10-m"
♦ Cu'ette ♦ Glass stirrin rod
♦ ensor e*tension cable ♦ 0.40 + co$$er(,,) sulate (Cu4) 30 m"
♦ /eaers () 100-m" ♦ Distilled %ater 30 m"
♦ Test tubes (2) lare ♦ +arin $en
♦ Test tube rac ♦ as& bottle %it& distilled %ater
"a#ety
Follow all standard laboratory procedures.
Procedure
After you complete a step (or answer a question), place a check mark in the box ( ) next to that step.
Set !p
1. Connect the colorimeter to the data collection system using the extension cable.
2. Start a new experiment on the data collection system. Click on Sparkvue and then Build.
* This is an AP Chemistry course recommended experiment.
7/21/2019 AC 16 Colorimetric Analysis for Lab Notebook
http://slidepdf.com/reader/full/ac-16-colorimetric-analysis-for-lab-notebook 4/7
Student Inquiry Worksheet
3. Con!igure the data collection system to manually collect absorbance o! orange "#$ nm% light and the
concentration in a table. To do this scroll down and click on &'ser entered numeral data(. )or measurementtype in &concentration( and !or unit name type in &molarity(.
4. ext click on both absorbance orange and concentration. Then click on the table button and
ok. +n the bottom by the clock, click on it and change to manual.
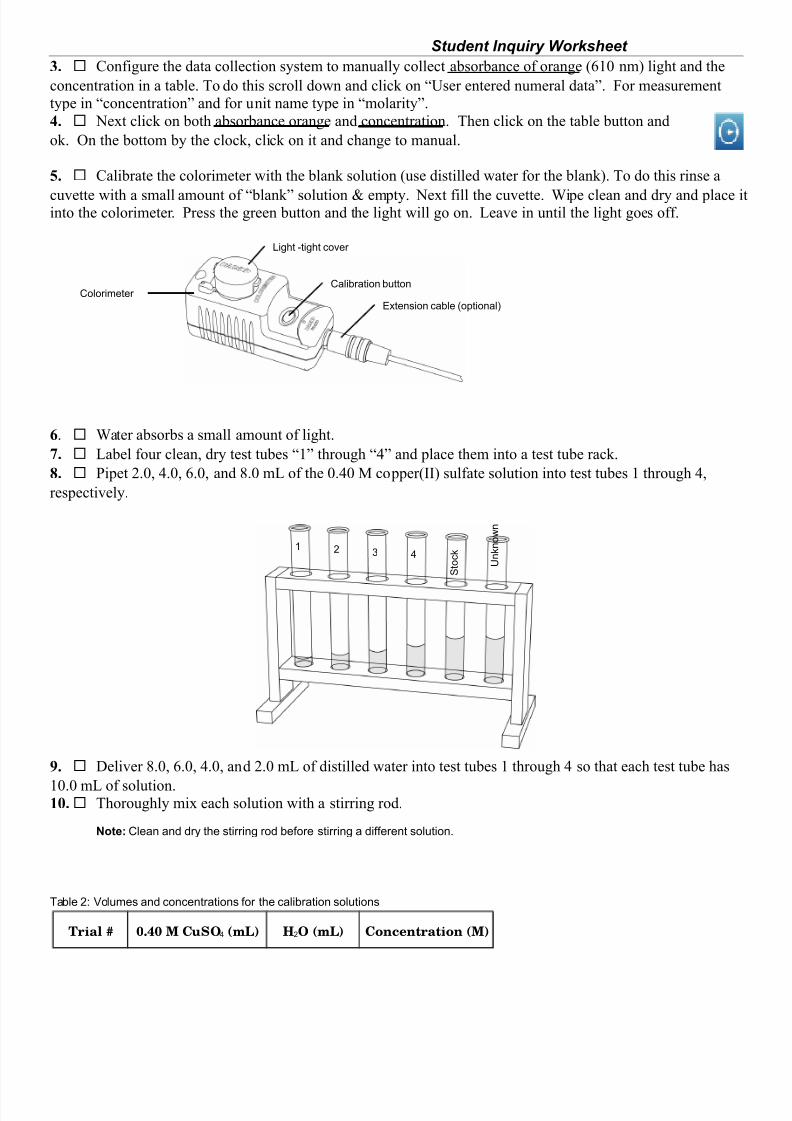
5. Calibrate the colorimeter with the blank solution "use distilled water !or the blank%. To do this rinse a
cuvette with a small amount o! &blank( solution - empty. ext !ill the cuvette. ipe clean and dry and place itinto the colorimeter. Press the green button and the light will go on. /eave in until the light goes o!!.
6. ater absorbs a small amount o! light.
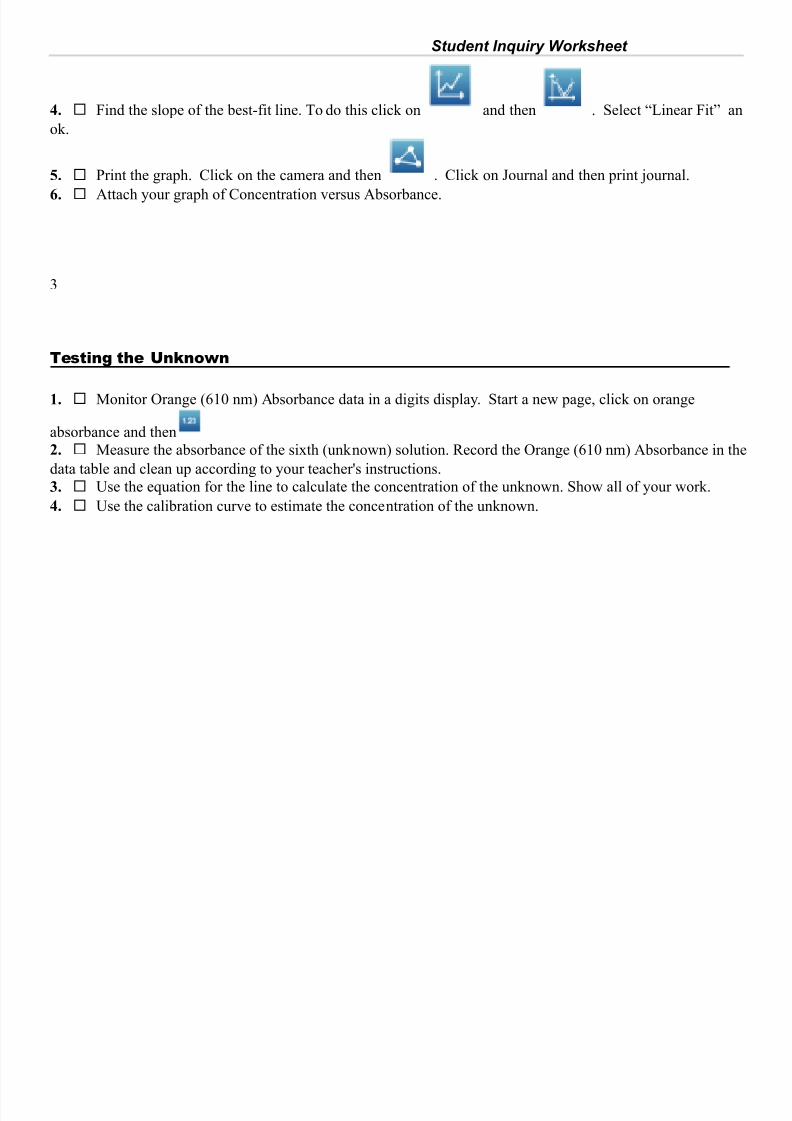
7. /abel !our clean, dry test tubes &( through &0( and place them into a test tube rack.
8. Pipet 1.$, 0.$, #.$, and 2.$ m/ o! the $.0$ 3 copper"44% sul!ate solution into test tubes through 0,
respectively.
9. 5eliver 2.$, #.$, 0.$, and 1.$ m/ o! distilled water into test tubes through 0 so that each test tube has
$.$ m/ o! solution.10. Thoroughly mix each solution with a stirring rod.
Note: Clean and dry t&e stirrin rod beore stirrin a dierent solution.
Table : olumes and concentrations or t&e calibration solutions
Trial # 0.40 M CuSO4 (mL) HO (mL) Concentration (M)
Colorimeter
"i&t -ti&t co'er
Calibration button
5*tension cable (o$tional)
1 3 4
) t o c 0
6 n 0 n o % n

7/21/2019 AC 16 Colorimetric Analysis for Lab Notebook
http://slidepdf.com/reader/full/ac-16-colorimetric-analysis-for-lab-notebook 5/7
Student Inquiry Worksheet
1 2.0 8.0 0.08
2 4.0 6.0 0.16
3 6.0 4.0 0.24
4 8.0 2.0 0.32
5 10.0 0 0.40
ollect Data
""# Start a new, manually sampled data set. Click on and then the arrow button. Click on theconcentration trials and enter the concentrations above !or the !irst 6 test tubes.
12. 3easure the absorbance o! the !ive known solutions !ollowing the steps below.
a. 7inse the cuvette twice with a small portion o! the !irst solution and then !ill the cuvette two8thirds !ull.
ipe the cuvette clean and dry and place it into the colorimeter.
b. &Turn on( the colorimeter by clicking the &on( button. A!ter the reading stabili9es, record a data
point by clicking on the green button again.
c. 5ispose o! the solution appropriately and rinse the cell thoroughly with water.
d. :ach time you place a new cuvette in, wait !or it to stabili9e and again click to record. hen you haverecorded all o! your data, stop the data set by clicking on;
Note: T&e data or test tube 2 is not yet recorded because it &as an unno%n molarity and it %ill not be $art o t&e
standardi7ation cur'e.
13. Save your experiment. To do this click on and then save as<.
=
Data Analysis
1. Create a data table to record the concentration an absorbance o! the 6 solutions. Also include a place torecord the unknown "to be done later in the lab%
2. To graph your data start a new page by clicking on . Select the absorbance orange and
concentration again, but now click on the graph button and ok.
3. Ad>ust the scale o! the graph to show all data, i! needed.
7/21/2019 AC 16 Colorimetric Analysis for Lab Notebook
http://slidepdf.com/reader/full/ac-16-colorimetric-analysis-for-lab-notebook 6/7
Student Inquiry Worksheet
4. )ind the slope o! the best8!it line. To do this click on and then . Select &/inear )it( an
ok.
5. Print the graph. Click on the camera and then . Click on ?ournal and then print >ournal.
6. Attach your graph o! Concentration versus Absorbance.
=
$esting t%e &n'no(n
1. 3onitor +range "#$ nm% Absorbance data in a digits display. Start a new page, click on orange
absorbance and then
2. 3easure the absorbance o! the sixth "unknown% solution. 7ecord the +range "#$ nm% Absorbance in the
data table and clean up according to your teacher@s instructions.
3. 'se the euation !or the line to calculate the concentration o! the unknown. Show all o! your work.
4. 'se the calibration curve to estimate the concentration o! the unknown.

7/21/2019 AC 16 Colorimetric Analysis for Lab Notebook
http://slidepdf.com/reader/full/ac-16-colorimetric-analysis-for-lab-notebook 7/7
Student Inquiry Worksheet
4