Embed Size (px)
Citation preview
AC 2012-3429: TEACHING COMMUNICATION SYSTEMS WITH SIMULINKAND THE USRP
Dr. Joseph P. Hoffbeck, University of Portland
Joseph P. Hoffbeck is an Associate Professor of electrical engineering at the University of Portland inPortland, Ore. He has a Ph.D. from Purdue University, West Lafayette, Indi. He previously worked withdigital cell phone systems at Lucent Technologies (formerly AT&T Bell Labs) in Whippany, N.J. Histechnical interests include communication systems, digital signal processing, and remote sensing.
c©American Society for Engineering Education, 2012
Teaching Communication Systems with Simulink and the USRP
Abstract
This paper discusses a system to demodulate and decode radio signals in real-time using the
universal software radio peripheral (USRP) in combination with Simulink in an undergraduate
teaching environment. Several previous papers have shown the value of using real world radio
signals to inspire and motivate students in traditional communication systems courses and
laboratories. Recent versions of Simulink now support a direct connection to the newer versions
of the USRP, and Simulink can connect to the original USRP1 through an existing open source
software package. This capability allows users to rapidly prototype radio systems that run in
real-time on the host computer, which enables more realistic and interesting projects, laboratory
experiments, and demonstrations. To illustrate this capability, a Simulink model is presented
that implements a real-time FM radio that demodulates and plays the audio signal, and it also
decodes the digital Radio Data System (RDS) signal and prints out the RadioText messages
which usually convey the name of the artist and song that is currently playing. The use of this
receiver as a demonstration in an undergraduate communication systems course is discussed, and
its effectiveness is assessed. The source files for this receiver are available for free from the
author.
Background
Communication systems classes usually contain highly mathematical and theoretical material
which is sometimes difficult for students to learn. It can be very helpful to motivate the students
by showing how the material is used in real systems. Simulations are an effective and easily
deployed method, but they do not have as direct connection to the real world as real systems.
However most real communication systems are very complex, and it is often difficult to utilize
them in a class. Some laboratory experiments have been based on the USRP because they can be
used to build communication systems that run in real-time without the need for building low
level hardware and software1,2
.
The USRP is an open source hardware platform provided by Ettus Research3. It converts radio
frequency (RF) signals to digital signals that can be processed by a computer, and also converts
digital signals from a computer to RF signals. Its function is analogous to a sound card, except
that it can capture and generate high frequency RF signals. Using the USRP allows the students
to work with RF signals from existing communication systems and to generate their own RF
signals.

Simulink is a programming environment that works in conjunction with MATLAB4. It allows
the user to build a program by connecting blocks that represent basic functions into a block
diagram. This programming environment is often used to run simulations, but it can also process
data on a standard computer in real-time as long as the system does not require too much
computation.
Simulink now has the ability to take data directly from the USRP and deliver data to the USRP,
which allows a real-time communication system to be constructed using a high level language
like Simulink and commercially available hardware. Since it greatly simplifies the process of
implementing a communication system, this platform is very useful for demonstrating
communication systems in a lecture format and for experimenting with communication systems
in a laboratory.
The Radio Data System (RDS), which is also called Radio Broadcast Data System (RBDS) in the
United States, is a digital signal that is sent along with the analog audio signals in FM radio
broadcasts. This signal is usually used to transmit the title of the song, the name of the artist, the
name of the program, and other information. The RDS signal, which is added to the analog
audio signals before frequency modulation, uses a carrier frequency of 57 kHz, bi-phase (or
Manchester) encoding, a raised cosine pulse shape, and a bit rate of 1187.5 bits/sec5,6
. The RDS
signal is useful in teaching communication systems because it can be demodulated and decoded
with a reasonably simple receiver, and because it is a signal that is familiar to most students7.
Hardware
In order to demonstrate the abilities of Simulink and the USRP in an educational setting, an FM
receiver was developed that not only demodulates and plays the audio signal from an FM radio
station, but it also demodulates the digital RDS signal and prints out the RadioText messages that
usually contain the title of the song, name of the artist, and other information.
The hardware consists of an antenna, USRP1 with an appropriate daughterboard such as the
TVRX or the WBX, and a standard PC or laptop as shown in Figure 1. The antenna can be a
length of wire or an FM antenna. The author used the USRP1, which costs about $700 and is
one of the inexpensive versions of the USRP3, but it should be possible to use the other versions
of the USRP as well.

Figure 1. Hardware (USRP1, Laptop, and Antenna)
Software
The Simulink-USRP Project is an open source project that created software that allows Simulink
to interface with the USRP18. (Simulink can interface directly to the newer USRP models, in
which case it is not necessary to install this software.) Once this software is installed, models
that use data from the USRP1 can be built and run using MATLAB/Simulink from Mathworks.
The top level Simulink model for the FM mono receiver with RDS decoder is shown in Figure 2.
Figure 2: Top Level Simulink Model
USRP FM Radio - Mono audio receiver with RDS receiver
L+R
B-1 IQ
usrp_sourceTo Wave
Device
In1
Timing Recovery, etc.
Digital
Filter
Matched Filter
FDATool
LPF
In1Out1
FM Demodulation
14
Downsample1
7
Downsample
Digital
Filter
Deemphasis Filter
In1 Out1
Costas Loop
FDATool
BPF

The block on the top left of Figure 2 is labeled usrp_source, and it represents the USRP1.
Double-clicking on this block opens a dialog box for configuring the USRP. The Simulink
model was designed for a sampling rate of 250 kHz. Since the analog-to-digital converters on
the USRP1 run at 64 MHz, the USRP was configured for a Decimation Factor of 256 which
leads to a sampling rate of 64 MHz/256 = 250 kHz. The sample width was set to 16 bits, and the
vector length was set to 1024 samples. The TVRX or WXB daughterboard was set to a data type
of INT16 Complex, and the frequency was set to the carrier frequency for the desired radio
station. The gain is set depending on the signal strength of the station. The data from the USRP
is a complex signal that represent the complex envelope of the sampled RF radio signal from the
FM station.
Some values, such as filter coefficients, that are used in the model are computed when the
Simulink model is initialized. These values can be examined by opening the model with
Simulink and then clicking on File, Model Properties, Callbacks, InitFcn.
The FM Demodulation block, which is shown in Figure 3, demodulates the FM signal, which
results in the stereo multiplex signal, whose spectrum is represented in Figure 4.
Figure 3: FM Demodulation Block
0.03 15 19 23 38 53 57
L+R
L-R RDS
Pilot
Carrier
f (kHz)
W(f
)
54.5 59.5
Figure 4: Spectrum of the Stereo Multiplexed Signal
FM Demodulaiton
1
Out1Product
u
Math
Function
z-1
Delay
double
Data Type Conversion
u
Complex to
Magnitude-Angle
1
In1[1024x1]
[1024x1]
[1024x1]
[1024x1] [1024x1]
[1024x1]
[1024x1] [1024x1] [1024x1]
After the FM signal is demodulated by the FM Demodulation Block, the analog mono (L+R)
signal is isolated by a lowpass filter, which is then down sampled to reduce the amount of
computation required, passed through the FM de-emphasis filter, and sent to the computer’s
speakers (see Figure 2).
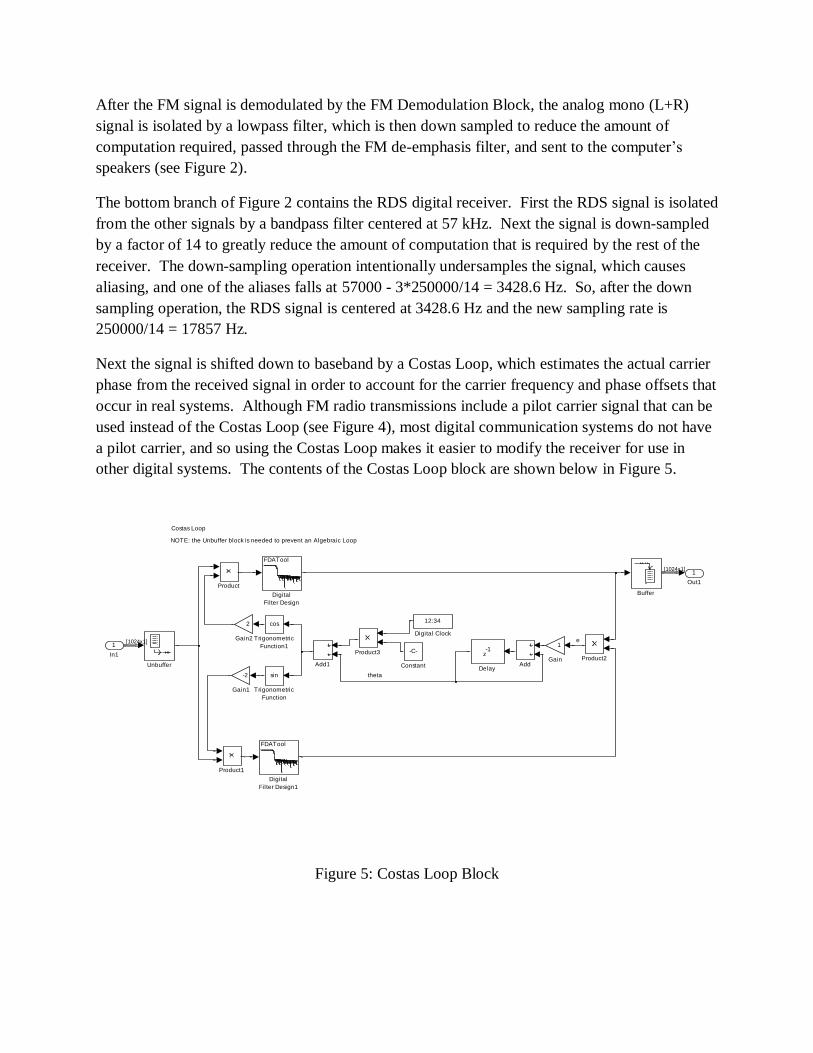
The bottom branch of Figure 2 contains the RDS digital receiver. First the RDS signal is isolated
from the other signals by a bandpass filter centered at 57 kHz. Next the signal is down-sampled
by a factor of 14 to greatly reduce the amount of computation that is required by the rest of the
receiver. The down-sampling operation intentionally undersamples the signal, which causes
aliasing, and one of the aliases falls at 57000 - 3*250000/14 = 3428.6 Hz. So, after the down
sampling operation, the RDS signal is centered at 3428.6 Hz and the new sampling rate is
250000/14 = 17857 Hz.
Next the signal is shifted down to baseband by a Costas Loop, which estimates the actual carrier
phase from the received signal in order to account for the carrier frequency and phase offsets that
occur in real systems. Although FM radio transmissions include a pilot carrier signal that can be
used instead of the Costas Loop (see Figure 4), most digital communication systems do not have
a pilot carrier, and so using the Costas Loop makes it easier to modify the receiver for use in
other digital systems. The contents of the Costas Loop block are shown below in Figure 5.
Figure 5: Costas Loop Block
Costas Loop
NOTE: the Unbuffer block is needed to prevent an Algebraic Loop
theta
e
1
Out1
Unbuffer
cos
Trigonometric
Function1
sin
Trigonometric
Function
Product3Product2
Product1
Product
2
Gain2
-2
Gain1
1
Gain
12:34
Digital Clock
FDATool
Digital
Filter Design1
FDATool
Digital
Filter Design
z-1
Delay
-C-
Constant
Buffer
Add1 Add
1
In1
[1024x1]
[1024x1]
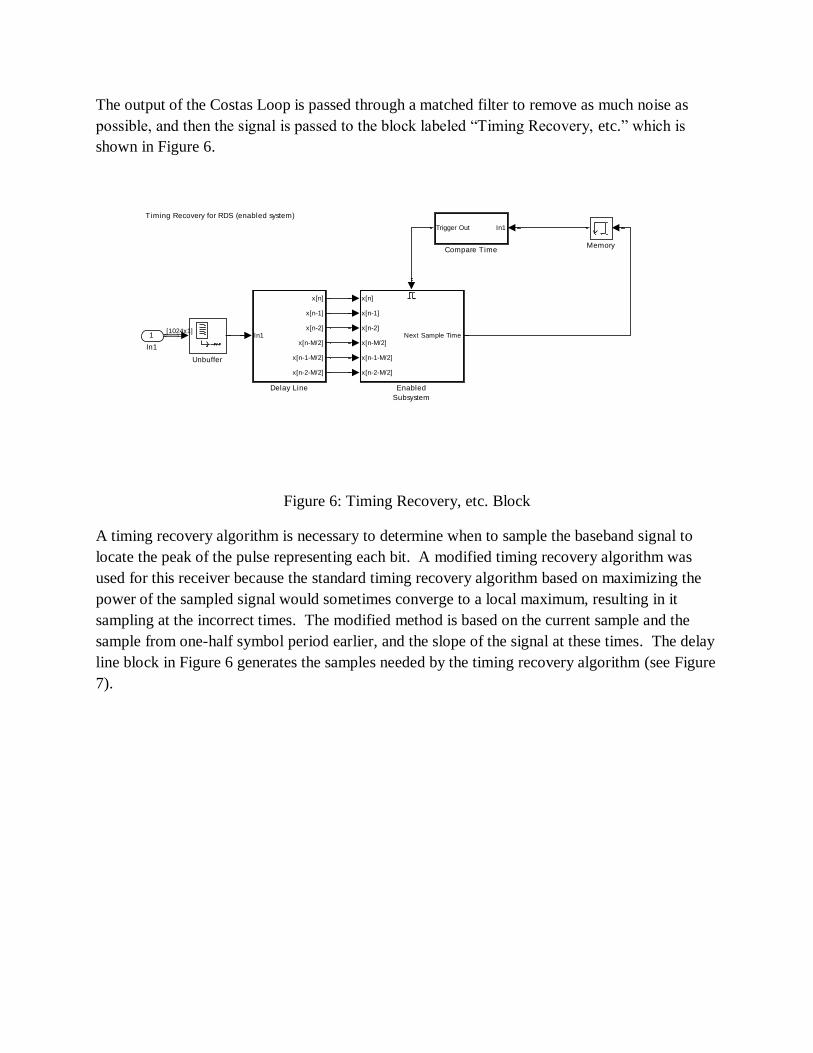
The output of the Costas Loop is passed through a matched filter to remove as much noise as
possible, and then the signal is passed to the block labeled “Timing Recovery, etc.” which is
shown in Figure 6.
Figure 6: Timing Recovery, etc. Block
A timing recovery algorithm is necessary to determine when to sample the baseband signal to
locate the peak of the pulse representing each bit. A modified timing recovery algorithm was
used for this receiver because the standard timing recovery algorithm based on maximizing the
power of the sampled signal would sometimes converge to a local maximum, resulting in it
sampling at the incorrect times. The modified method is based on the current sample and the
sample from one-half symbol period earlier, and the slope of the signal at these times. The delay
line block in Figure 6 generates the samples needed by the timing recovery algorithm (see Figure
7).
Timing Recovery for RDS (enabled system)
Unbuffer
Memory
x[n]
x[n-1]
x[n-2]
x[n-M/2]
x[n-1-M/2]
x[n-2-M/2]
Next Sample Time
Enabled
Subsystem
In1
x[n]
x[n-1]
x[n-2]
x[n-M/2]
x[n-1-M/2]
x[n-2-M/2]
Delay Line
In1Trigger Out
Compare Time
1
In1
[1024x1]

Figure 7: Delay Line
The Compare Time block, which is shown in Figure 8, enables the Enabled System block when
the current time is greater than the next sample time.
Figure 8: Compare Time Block
Since the rest of the processing is performed only when the system samples the signal, the rest of
the processing is enclosed in the Enabled Subsystem, which is shown in Figure 9.
Delay line
6
x[n-2-M/2]
5
x[n-1-M/2]
4
x[n-M/2]
3
x[n-2]
2
x[n-1]
1
x[n]
z-6
Delay6
z-1
Delay5
z-1
Delay4
z-1
Delay3
z-1
Delay2
z-1
Delay1
1
In1
1
Trigger Out
>
Relational
Operator
Count
UpRst Cnt
Counter
0
Constant
1
In1
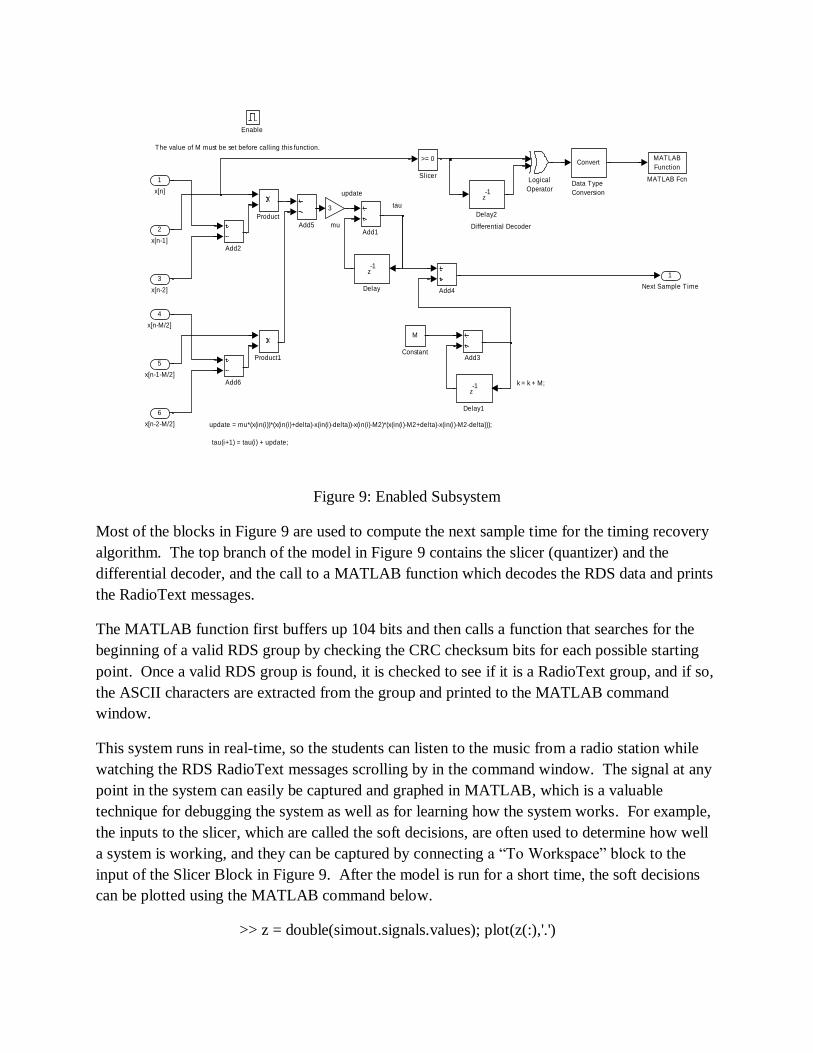
Figure 9: Enabled Subsystem
Most of the blocks in Figure 9 are used to compute the next sample time for the timing recovery
algorithm. The top branch of the model in Figure 9 contains the slicer (quantizer) and the
differential decoder, and the call to a MATLAB function which decodes the RDS data and prints
the RadioText messages.
The MATLAB function first buffers up 104 bits and then calls a function that searches for the
beginning of a valid RDS group by checking the CRC checksum bits for each possible starting
point. Once a valid RDS group is found, it is checked to see if it is a RadioText group, and if so,
the ASCII characters are extracted from the group and printed to the MATLAB command
window.
This system runs in real-time, so the students can listen to the music from a radio station while
watching the RDS RadioText messages scrolling by in the command window. The signal at any
point in the system can easily be captured and graphed in MATLAB, which is a valuable
technique for debugging the system as well as for learning how the system works. For example,
the inputs to the slicer, which are called the soft decisions, are often used to determine how well
a system is working, and they can be captured by connecting a “To Workspace” block to the
input of the Slicer Block in Figure 9. After the model is run for a short time, the soft decisions
can be plotted using the MATLAB command below.
>> z = double(simout.signals.values); plot(z(:),'.')
The value of M must be set before calling this function.
k = k + M;
update = mu*(x(in(i))*(x(in(i)+delta)-x(in(i)-delta))-x(in(i)-M2)*(x(in(i)-M2+delta)-x(in(i)-M2-delta)));
update
tau(i+1) = tau(i) + update;
Differential Decoder
tau
1
Next Sample Time
3
mu
>= 0
Slicer
Product1
Product
MATLAB
Function
MATLAB FcnLogical
Operator
z-1
Delay2
z-1
Delay1
z-1
Delay
Convert
Data Type
Conversion
M
Constant
Add6
Add5
Add4
Add3
Add2
Add1
Enable
6
x[n-2-M/2]
5
x[n-1-M/2]
4
x[n-M/2]
3
x[n-2]
2
x[n-1]
1
x[n]
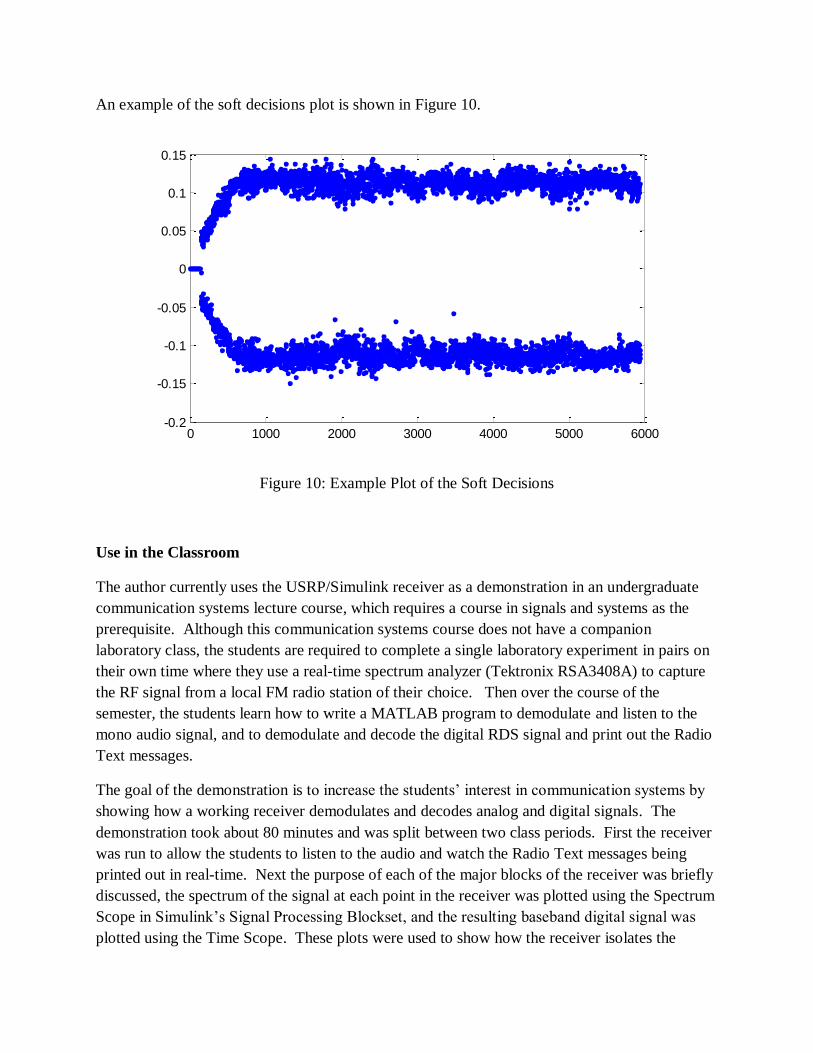
An example of the soft decisions plot is shown in Figure 10.
Figure 10: Example Plot of the Soft Decisions
Use in the Classroom
The author currently uses the USRP/Simulink receiver as a demonstration in an undergraduate
communication systems lecture course, which requires a course in signals and systems as the
prerequisite. Although this communication systems course does not have a companion
laboratory class, the students are required to complete a single laboratory experiment in pairs on
their own time where they use a real-time spectrum analyzer (Tektronix RSA3408A) to capture
the RF signal from a local FM radio station of their choice. Then over the course of the
semester, the students learn how to write a MATLAB program to demodulate and listen to the
mono audio signal, and to demodulate and decode the digital RDS signal and print out the Radio
Text messages.
The goal of the demonstration is to increase the students’ interest in communication systems by
showing how a working receiver demodulates and decodes analog and digital signals. The
demonstration took about 80 minutes and was split between two class periods. First the receiver
was run to allow the students to listen to the audio and watch the Radio Text messages being
printed out in real-time. Next the purpose of each of the major blocks of the receiver was briefly
discussed, the spectrum of the signal at each point in the receiver was plotted using the Spectrum
Scope in Simulink’s Signal Processing Blockset, and the resulting baseband digital signal was
plotted using the Time Scope. These plots were used to show how the receiver isolates the
0 1000 2000 3000 4000 5000 6000-0.2
-0.15
-0.1
-0.05
0
0.05
0.1
0.15
signals and shifts them back to baseband. With the author’s setup, the computer is not fast
enough to demodulate the audio and RDS signals while simultaneously displaying these graphs,
but this limitation had little effect on the demonstration.
Assessment
In an attempt to measure the impact of the demonstration, an anonymous survey was distributed
to the students prior to and after the demonstration. Neither survey was given on the same day as
the demonstration. The survey asked the following questions:
1. How would you rate your current knowledge about communication systems?
2. How would you rate your current level of motivation to learn more about
communication systems?
3. How interesting do you currently find communication systems?
4. List the major parts of a receiver in a digital communication system.
5. Do you have any suggestions for how the course could be improved?
The first three questions were scored on a 1 to 5 scale, with a score of 5 indicating very
knowledgeable, motivated, or interested, and a score of 1 being not at all knowledgeable,
motivated, or interested. The answer to Question 4 was graded by the instructor on a scale of 1
to 5, with 1 indicating no answer or no correct answer, and 5 being a complete list of the major
parts of a digital receiver (carrier recovery, matched filter, timing recovery, and quantizer). The
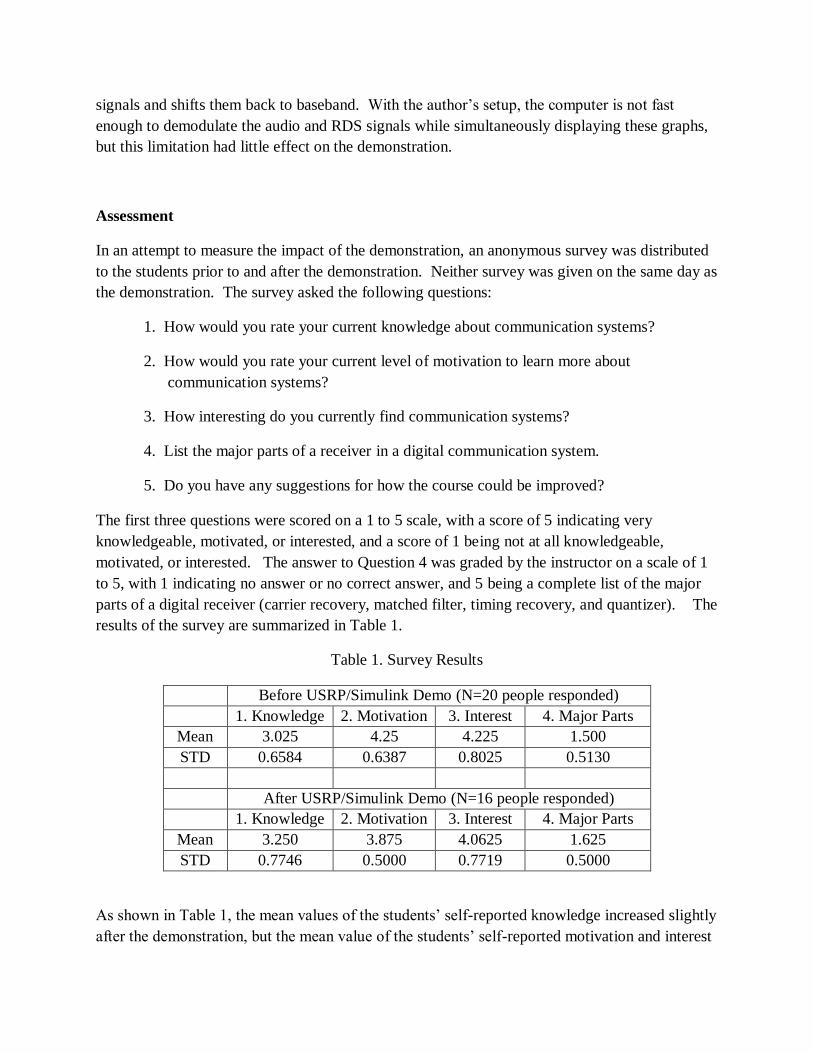
results of the survey are summarized in Table 1.
Table 1. Survey Results
Before USRP/Simulink Demo (N=20 people responded)
1. Knowledge 2. Motivation 3. Interest 4. Major Parts
Mean 3.025 4.25 4.225 1.500
STD 0.6584 0.6387 0.8025 0.5130
After USRP/Simulink Demo (N=16 people responded)
1. Knowledge 2. Motivation 3. Interest 4. Major Parts
Mean 3.250 3.875 4.0625 1.625
STD 0.7746 0.5000 0.7719 0.5000
As shown in Table 1, the mean values of the students’ self-reported knowledge increased slightly
after the demonstration, but the mean value of the students’ self-reported motivation and interest

decreased slightly. The instructor’s score for Question 4 increase slightly after the
demonstration. However, none of these differences was big enough to be considered statistically
significant at the 5% significance level according to the t-test for difference of population means
for unknown and not necessarily equal variances.
In response to Question 5 in the survey before the demonstration, three of the students (out of 20)
mentioned that they liked real-world examples and/or applications. In the post-demonstration
survey, three of the students (out of 16) stated that they liked the demonstration or wanted more
demonstrations. One student wrote, “More demos! I love em!”
Although the numerical results of the survey were inconclusive, the responses to Question 5
seem to indicate that at least some of the students thought that the demonstration was
worthwhile.
Discussion
This system demonstrates that the Simulink/USRP platform can be used to build real-time digital
and analog communication systems without low level hardware and software development. The
digital RDS receiver is a much more complicated system than the relatively simple mono FM
receiver, and the platform can run both in real-time. This platform can be used in a
communication systems course for demonstrations or lab experiments, or to allow students to test
a subsystem that they create inside a complete system. For example, in a course that teaches the
Costas Loop, the students could create their own Costas Loop model in Simulink, insert it into
the receiver, and test it as part of a real receiver running in real-time.
The source files for the receiver described in this paper can be obtained for free by sending email
to the author.
Conclusion
This paper presented an example analog and digital communication system built using Simulink
and the USRP that runs in real-time. The advantages of this relatively low cost platform for
education is that it allows communication systems to be built that run in real-time using a high
level programming environment and commercially available hardware.
References
1. Wyglinski, Alexander M.; Pu, Di; Cullen, Daniel J.; “Digital communication systems education via
software-defined radio experimentation,” ASEE Annual Conference and Exposition, Conference
Proceedings, 2011.
2. Welch, Thad B.; Shearman, Sam; “Labview, the USRP, and their Implications on Software Defined
Radio,” ASEE Annual Conference and Exposition, Conference Proceedings, 2011.
3. Ettus, Matt, Ettus Research LLC, www.ettus.com.
4. Mathworks, Inc., www.mathworks.com.
5. Kopitz, Diet, and Marks, Bev, RDS: The Radio Data System, Artech House, ISBN: 0-89006-744-9, 1999.
6. RDS Forum, The New RDS IEC 62106:1999 Standard, Specification of the Radio Data System (RDS) for
VHF/FM Sound Broadcasting in the Frequency Range From 87,5 to 108,0 MHZ, www.rds.org, 1999.
7. Hoffbeck, Joseph P., "Using Real RF Signals Such as FM Radio to Teach Concepts in Communication
Systems," American Society for Engineering Education Annual Conference and Exposition (ASEE 2008),
Pittsburg, Pennsylvania, June 22 - 25, 2008.
8. Simulink-USRP Project, Communication Engineering Lab (CEL), Karlsruhe Institute of Technology (KIT),
Germany, http://www.cel.kit.edu/english/downloads.php.