1
Paul Penzella Staff Artist 2010 API GROWTH 2009 -2010 GROWTH MET STATE TARGET Elementary Schools EL SEGUNDO UNIFIED Center Street 894 1 Y Richmond Street 906 -3 Y HAWTHORNE Eucalyptus 772 57 Y Jefferson 793 17 Y Kornblum 770 11 Y Ramona 797 12 Y Washington 812 29 Y York 773 16 Y Zela Davis 796 8 Y HERMOSA BEACH Hermosa Valley 937 16 Y Hermosa View 938 4 Y INGLEWOOD UNIFIED Bennett/Kew 823 41 Y Centinela 769 52 Y Freeman 732 -24 N Highland 826 -26 Y Hudnall 755 2 N Kelso 802 -20 Y La Tijera 711 -6 N Lane 687 15 Y Oak Street 826 84 Y Parent 776 5 Y Payne 836 35 Y Wilder’s Prep. 932 68 Y Woodworth 783 59 Y Worthington 813 61 Y LAWNDALE Anderson 769 27 Y Green 810 28 Y Mitchell 823 33 Y Roosevelt 761 26 Y Smith 846 38 Y Twain 853 21 Y LENNOX Buford Avenue 792 33 Y Huerta 766 5 Y Felton 797 26 Y Jefferson 795 35 Y Moffett 756 18 Y MANHATTAN BEACH UNIFIED Grand View 955 0 Y Meadows Avenue 937 -11 Y Pacific 961 -2 Y Pennekamp 957 -9 Y Robinson 965 0 Y PALOS VERDES PENINSULA UNIFIED Connerstone 967 1 Y Dapplegray 941 13 Y Lunada Bay 926 -12 Y Mira Catalina 920 -16 Y Montemalaga 967 8 Y Point Vicente 953 22 Y Rancho Vista 941 8 Y 2010 API GROWTH 2009 -2010 GROWTH MET STATE TARGET Elementary Schools CARSON 232nd Place 850 10 Y Ambler Avenue 795 11 Y Annalee Avenue 696 -31 N Bonita Street 786 8 Y Broadacres Avenue 706 -17 N Caroldale 808 10 Y Carson Street 831 26 Y Catskill Avenue 794 13 Y Del Amo 786 -33 N Dolores Street 796 14 Y Dominguez 753 0 N Leapwood Avenue 764 37 Y Towne Avenue 822 38 Y GARDENA 135th Street 688 -27 N 153rd Street 722 17 Y 156th Street 907 12 Y 186th Street 819 5 Y Amestoy 803 33 Y Chapman 817 24 Y Crescendo Prepatory West 751 -63 N Denker Avenue 794 0 N Gardena 716 -29 N Purche Avenue 765 38 Y HARBOR CITY Halldale 837 36 Y Harbor City 758 26 N Meyler Street 735 -16 N Normont 774 37 Y President Avenue 785 20 Y Van Deene Avenue 795 0 N HAWTHORNE Cimarron Avenue 737 -19 N Academic Performance Index School-by-school rankings The Academic Performance Index (API), the cornerstone of the state’s Public Schools Account- ability Act of 1999, is an achievement gauge for California public schools based on standardized test results. The index assigns a score for each campus, ranging from a low of 200 to a high of 1,000, with 800 as the long-term performance target. Though it’s changed over the years, API scores in 2009-2010 were primarily calculated using results of the state’s Standardized Testing and Report- ing Program (STAR) and from the California High School Exit Examination (CAHSEE). This chart reflects state accountability measures. However, many schools failed to meet federal expectations, known as Adequate Yearly Progress or AYP. For results related to AYP and for API data, go to: http://dq.cde.ca.gov/dataquest. South Bay scores and rankings LAUSD scores and rankings 2010 API GROWTH 2009 -2010 GROWTH MET STATE TARGET Silver Spur 974 9 Y Soleado 936 12 Y Vista Grande 952 -5 Y REDONDO BEACH UNIFIED Alta Vista 937 4 Y Beryl Heights 948 6 Y Birney 879 8 Y Jefferson 949 11 Y Lincoln 888 9 Y Madison 896 -4 Y Tulita 910 21 Y Washington 835 -5 Y TORRANCE UNIFIED Adams 888 15 Y Anza 907 12 Y Arlington 892 12 Y Arnold 877 -1 Y Carr 831 -1 Y Edison 854 0 Y Fern 836 1 Y Hickory 896 2 Y Lincoln 862 11 Y Riviera 916 1 Y Seaside 901 -6 Y Torrance 850 9 Y Towers 894 2 Y Victor 891 -14 Y Walteria 913 11 Y Wood 841 19 Y Yukon 852 0 Y WISEBURN Anza 875 12 Y Burnett 865 12 Y Cabrillo 887 59 Y Middle Schools EL SEGUNDO UNIFIED El Segundo 890 7 Y HAWTHORNE Bud Carson 754 26 Y Hawthorne 780 26 Y Prairie Vista 770 15 Y INGLEWOOD UNIFIED Crozier 679 58 Y Monroe 654 40 Y LAWNDALE Addams 800 28 Y Rogers 775 45 Y LENNOX Century Academy for Excellence 616 3 N Lennox 719 9 Y MANHATTAN BEACH UNIFIED Manhattan Beach 941 6 Y PALOS VERDES PENINSULA UNIFIED Miraleste 903 8 Y Palos Verdes 959 19 Y Ridgecrest 940 23 Y 2010 API GROWTH 2009 -2010 GROWTH MET STATE TARGET INGLEWOOD Century Park 709 32 Y LOMITA Eshelman Avenue 817 8 Y Lomita Math/Sci. Magnet 864 5 Y SAN PEDRO 15th Street 769 17 Y Bandini Street 788 27 Y Barton Hill 766 34 Y Cabrillo Avenue 762 22 Y Crestwood Street 818 20 Y Leland Street 789 -25 N Park Western Place 949 8 Y Point Fermin 838 45 Y Seventh Street 849 -1 Y South Shores Magnet 878 -15 Y Taper Avenue 876 36 Y White Point 857 -2 Y WEST LOS ANGELES Braddock Drive 800 14 Y Stoner Avenue 763 39 Y WESTCHESTER Cowan Avenue 837 10 Y Kentwood 870 11 Y Loyola Village 800 -23 Y Paseo del Rey Magnet 857 8 Y Westport Heights 769 -26 N Windsor Hills Math-Science- Aerospace Magnet 783 28 Y WILMINGTON Broad Avenue 746 -4 N De La Torre 754 -2 N Fries Avenue 739 40 Y Gulf Avenue 770 42 Y 2010 API GROWTH 2009 -2010 GROWTH MET STATE TARGET REDONDO BEACH UNIFIED Adams 858 30 Y Parras 911 24 Y TORRANCE UNIFIED Calle Mayor 920 32 Y Casmir 868 19 Y Hull 814 32 Y Jefferson 884 25 Y Lynn 922 37 Y Madrona 858 4 Y Magruder 842 13 Y Richardson 892 11 Y WISEBURN Dana 817 15 Y High Schools CENTINELA VALLEY Hawthorne 639 3 N Lawndale 735 5 Y Leuzinger 611 34 Y EL SEGUNDO UNIFIED El Segundo 873 12 Y HAWTHORNE Hawthorne Mathematics & Science Academy 883 16 Y INGLEWOOD UNIFIED City Honors 805 9 Y Inglewood 594 -7 N Morningside 633 44 Y LAWNDALE Environmental Charter 774 9 Y LENNOX Animo Leadership 745 56 Y Lennox Math/ Sci. and Tech. 778 18 Y MANHATTAN BEACH UNIFIED Mira Costa 898 26 Y PALOS VERDES PENINSULA UNIFIED Palos Verdes 848 -17 Y Palos Verdes Peninsula 891 6 Y REDONDO BEACH UNIFIED Redondo Union 825 2 Y TORRANCE UNIFIED North 807 14 Y South 830 -4 Y Torrance 814 17 Y West 858 6 Y WISEBURN Da Vinci Design 693 Da Vinci Science 807 OTHER Animo Inglewood 758 56 Y California Academy of Math and Science 973 -2 Y 2010 API GROWTH 2009 -2010 GROWTH MET STATE TARGET Hawaiian Avenue 818 35 Y Wilmington Park 762 -11 N Middle Schools CARSON Carnegie 698 27 Y Curtiss 650 0 N Magnolia Science 777 35 Y White 754 5 Y GARDENA Peary 680 34 Y LOMITA Fleming 731 -2 N SAN PEDRO Dana 716 29 Y Dodson 825 26 Y WESTCHESTER Wright 755 16 Y WILMINGTON Wilmington 690 21 Y High Schools CARSON Carson 641 31 Y New Millennium 650 35 Y GARDENA Gardena 586 11 Y HARBOR CITY Narbonne 651 1 N SAN PEDRO San Pedro 692 17 Y Port of LA 778 47 Y WESTCHESTER Westchester 649 21 Y WILMINGTON Banning 646 33 Y Harbor Teacher Prepatory 936 52 Y The first column shows the school’s 2010 growth API figure (on a scale of 200 to 1,000) based on 2009-10 test scores. The second column indicates the change from the school’s 2009 Base API score. The third column indicates “yes” or “no” — whether the campus met its schoolwide state accountability target growth for last year. HOW TO USE THIS CHART Source: California Department of Education

Academic Performance Index - …extras.mnginteractive.com/.../2010/0913/20100913_065350_API.pdf · Rancho Vista 941 8 Y 2010 API GROWTH 2009-2010 GROWTH MET STATE TARGET Elementary

  • Upload
    votram

  • View
    213

  • Download
    0

Embed Size (px)

Citation preview

Paul Penzella Sta� Artist

2010API

GROWTH

2009-2010

GROWTH

METSTATE

TARGET

Elementary SchoolsEL SEGUNDO UNIFIEDCenter Street 894 1 YRichmond Street 906 -3 YHAWTHORNEEucalyptus 772 57 YJe� erson 793 17 YKornblum 770 11 YRamona 797 12 YWashington 812 29 YYork 773 16 YZela Davis 796 8 YHERMOSA BEACHHermosa Valley 937 16 YHermosa View 938 4 YINGLEWOOD UNIFIEDBennett/Kew 823 41 YCentinela 769 52 YFreeman 732 -24 NHighland 826 -26 YHudnall 755 2 NKelso 802 -20 YLa Tijera 711 -6 NLane 687 15 YOak Street 826 84 YParent 776 5 YPayne 836 35 YWilder’s Prep. 932 68 YWoodworth 783 59 YWorthington 813 61 YLAWNDALEAnderson 769 27 YGreen 810 28 YMitchell 823 33 YRoosevelt 761 26 YSmith 846 38 YTwain 853 21 YLENNOXBuford Avenue 792 33 YHuerta 766 5 YFelton 797 26 YJe� erson 795 35 YMo� ett 756 18 YMANHATTAN BEACH UNIFIEDGrand View 955 0 YMeadows Avenue 937 -11 YPacifi c 961 -2 YPennekamp 957 -9 YRobinson 965 0 YPALOS VERDES PENINSULA UNIFIEDConnerstone 967 1 YDapplegray 941 13 YLunada Bay 926 -12 YMira Catalina 920 -16 YMontemalaga 967 8 YPoint Vicente 953 22 YRancho Vista 941 8 Y

2010API

GROWTH

2009-2010

GROWTH

METSTATE

TARGET

Elementary SchoolsCARSON232nd Place 850 10 YAmbler Avenue 795 11 YAnnalee Avenue 696 -31 NBonita Street 786 8 YBroadacres Avenue 706 -17 NCaroldale 808 10 YCarson Street 831 26 YCatskill Avenue 794 13 YDel Amo 786 -33 NDolores Street 796 14 YDominguez 753 0 NLeapwood Avenue 764 37 YTowne Avenue 822 38 YGARDENA135th Street 688 -27 N153rd Street 722 17 Y156th Street 907 12 Y186th Street 819 5 YAmestoy 803 33 YChapman 817 24 YCrescendo Prepatory West 751 -63 NDenker Avenue 794 0 NGardena 716 -29 NPurche Avenue 765 38 YHARBOR CITYHalldale 837 36 YHarbor City 758 26 NMeyler Street 735 -16 NNormont 774 37 YPresident Avenue 785 20 YVan Deene Avenue 795 0 NHAWTHORNECimarron Avenue 737 -19 N

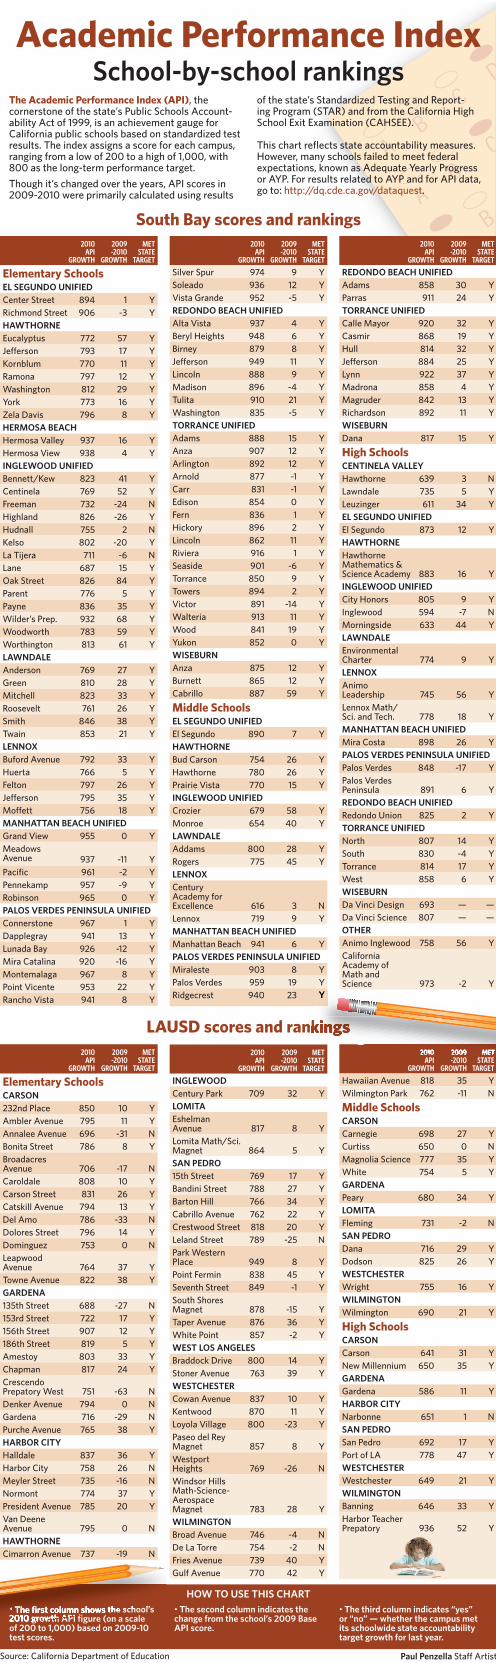
Academic Performance IndexSchool-by-school rankings

The Academic Performance Index (API), the cornerstone of the state’s Public Schools Account-ability Act of 1999, is an achievement gauge for California public schools based on standardized test results. The index assigns a score for each campus, ranging from a low of 200 to a high of 1,000, with 800 as the long-term performance target.Though it’s changed over the years, API scores in 2009-2010 were primarily calculated using results

of the state’s Standardized Testing and Report-ing Program (STAR) and from the California High School Exit Examination (CAHSEE).

This chart refl ects state accountability measures. However, many schools failed to meet federal expectations, known as Adequate Yearly Progress or AYP. For results related to AYP and for API data, go to: http://dq.cde.ca.gov/dataquest.

South Bay scores and rankings

LAUSD scores and rankings

2010API

GROWTH

2009-2010

GROWTH

METSTATE

TARGET

Silver Spur 974 9 YSoleado 936 12 YVista Grande 952 -5 YREDONDO BEACH UNIFIEDAlta Vista 937 4 YBeryl Heights 948 6 YBirney 879 8 YJe� erson 949 11 YLincoln 888 9 YMadison 896 -4 YTulita 910 21 YWashington 835 -5 YTORRANCE UNIFIEDAdams 888 15 YAnza 907 12 YArlington 892 12 YArnold 877 -1 YCarr 831 -1 YEdison 854 0 YFern 836 1 YHickory 896 2 YLincoln 862 11 YRiviera 916 1 YSeaside 901 -6 YTorrance 850 9 YTowers 894 2 YVictor 891 -14 YWalteria 913 11 YWood 841 19 YYukon 852 0 YWISEBURNAnza 875 12 YBurnett 865 12 YCabrillo 887 59 YMiddle SchoolsEL SEGUNDO UNIFIEDEl Segundo 890 7 YHAWTHORNEBud Carson 754 26 YHawthorne 780 26 YPrairie Vista 770 15 YINGLEWOOD UNIFIEDCrozier 679 58 YMonroe 654 40 YLAWNDALEAddams 800 28 YRogers 775 45 YLENNOXCentury Academy for Excellence 616 3 NLennox 719 9 YMANHATTAN BEACH UNIFIEDManhattan Beach 941 6 YPALOS VERDES PENINSULA UNIFIEDMiraleste 903 8 YPalos Verdes 959 19 YRidgecrest 940 23 Y

2010API

GROWTH

2009-2010

GROWTH

METSTATE

TARGET

INGLEWOODCentury Park 709 32 YLOMITAEshelman Avenue 817 8 YLomita Math/Sci.Magnet 864 5 YSAN PEDRO15th Street 769 17 YBandini Street 788 27 YBarton Hill 766 34 YCabrillo Avenue 762 22 YCrestwood Street 818 20 YLeland Street 789 -25 NPark Western Place 949 8 YPoint Fermin 838 45 YSeventh Street 849 -1 YSouth Shores Magnet 878 -15 YTaper Avenue 876 36 YWhite Point 857 -2 YWEST LOS ANGELESBraddock Drive 800 14 YStoner Avenue 763 39 YWESTCHESTERCowan Avenue 837 10 YKentwood 870 11 YLoyola Village 800 -23 YPaseo del Rey Magnet 857 8 YWestport Heights 769 -26 NWindsor Hills Math-Science-AerospaceMagnet 783 28 YWILMINGTONBroad Avenue 746 -4 NDe La Torre 754 -2 NFries Avenue 739 40 YGulf Avenue 770 42 Y

2010API

GROWTH

2009-2010

GROWTH

METSTATE

TARGET

REDONDO BEACH UNIFIEDAdams 858 30 YParras 911 24 YTORRANCE UNIFIEDCalle Mayor 920 32 YCasmir 868 19 YHull 814 32 YJe� erson 884 25 YLynn 922 37 YMadrona 858 4 YMagruder 842 13 YRichardson 892 11 YWISEBURNDana 817 15 YHigh SchoolsCENTINELA VALLEYHawthorne 639 3 NLawndale 735 5 YLeuzinger 611 34 YEL SEGUNDO UNIFIEDEl Segundo 873 12 YHAWTHORNEHawthorne Mathematics & Science Academy 883 16 YINGLEWOOD UNIFIEDCity Honors 805 9 YInglewood 594 -7 NMorningside 633 44 YLAWNDALEEnvironmental Charter 774 9 YLENNOXAnimo Leadership 745 56 YLennox Math/Sci. and Tech. 778 18 YMANHATTAN BEACH UNIFIEDMira Costa 898 26 YPALOS VERDES PENINSULA UNIFIEDPalos Verdes 848 -17 YPalos Verdes Peninsula 891 6 YREDONDO BEACH UNIFIEDRedondo Union 825 2 YTORRANCE UNIFIEDNorth 807 14 YSouth 830 -4 YTorrance 814 17 YWest 858 6 YWISEBURNDa Vinci Design 693 — —Da Vinci Science 807 — —OTHERAnimo Inglewood 758 56 YCalifornia Academy of Math and Science 973 -2 Y

2010API

GROWTH

2009-2010

GROWTH

METSTATE

TARGET

Hawaiian Avenue 818 35 YWilmington Park 762 -11 NMiddle SchoolsCARSONCarnegie 698 27 YCurtiss 650 0 NMagnolia Science 777 35 YWhite 754 5 YGARDENAPeary 680 34 YLOMITAFleming 731 -2 NSAN PEDRODana 716 29 YDodson 825 26 YWESTCHESTERWright 755 16 YWILMINGTONWilmington 690 21 YHigh SchoolsCARSONCarson 641 31 YNew Millennium 650 35 YGARDENAGardena 586 11 YHARBOR CITYNarbonne 651 1 NSAN PEDROSan Pedro 692 17 YPort of LA 778 47 YWESTCHESTERWestchester 649 21 YWILMINGTONBanning 646 33 YHarbor TeacherPrepatory 936 52 Y

• The fi rst column shows the school’s 2010 growth API fi gure (on a scale of 200 to 1,000) based on 2009-10 test scores.

• The second column indicates the change from the school’s 2009 Base API score.

• The third column indicates “yes” or “no” — whether the campus met its schoolwide state accountability target growth for last year.

HOW TO USE THIS CHART• The fi rst column shows the school’s 2010 growth API fi gure (on a scale

Source: California Department of Education

LAUSD scores and rankings

Y

2010 2009 MET