Embed Size (px)
Citation preview

8/7/2019 acc discretion of bank during fin crisis
http://slidepdf.com/reader/full/acc-discretion-of-bank-during-fin-crisis 1/59
8/7/2019 acc discretion of bank during fin crisis
http://slidepdf.com/reader/full/acc-discretion-of-bank-during-fin-crisis 2/59
1. Introduction
The current global financial crisis has reinvigorated a debate on the effectiveness of the
existing accounting and regulatory frameworks for banks. Questions abound, ranging
from adequate capitalization levels of banks to the boundaries of financial regulation (see
Financial Stability Forum (2008)). Part of the debate on financial reform centers around
required information on banks for effective market discipline and supervisory action.
This includes not only thinking on the required level of detail on disclosure of bank assets
and liabilities but also on their valuation techniques and the appropriateness of current
accounting rules more generally (see Laux and Leuz (2009) for a survey).
Accounting techniques generally do not generate large differences between the
book and market value of bank assets. At times of financial crisis when assets become
distressed, however, large differences between book and market values may arise,
especially when assets are carried at historical cost, or when assets become illiquid or
hard to value. Such differences may give rise to incentives for banks to use accounting
discretion to increase the book value of the bank, for example, by using advantageous
valuation techniques or by reclassifying assets. Overstated book values of bank assets
may further give rise to undue regulatory forbearance.1
During the ongoing financial crisis, large differences have indeed arisen between
market and book values of U.S. banks as the crisis has sharply eroded their market
values. By end-2008, more than 60% of U.S. bank holding companies had a market-to-
book value of assets of less than one, while this was the case for only 8% of banks at end-
2001. At the same time, the average ratio of Tier 1 capital to bank assets has stayed
1 For evidence of regulatory forbearance and the political economy of bank intervention, see Kane (1989),Kroszner and Strahan (1996), Barth et al. (2006), and Brown and Dinc (2005, 2009).
1
8/7/2019 acc discretion of bank during fin crisis
http://slidepdf.com/reader/full/acc-discretion-of-bank-during-fin-crisis 3/59
constant at about 11% throughout this period. The market value of bank equity thus has
dropped precipitously against a backdrop of virtually constant book capital. This raises
doubts about the accuracy and relevance of accounting information reported on banks’
balance sheets at a time of financial crisis.
This paper shows that banks systematically understate the impairment of their real
estate related assets, especially following the onset of the present global financial crisis,
in an effort to preserve book capital. Our paper provides the first evaluation of such
behavior and we provide three pieces of compelling evidence to support our thesis that
banks use accounting discretion to overstate the book value of capital.
First, we estimate large market discounts on real estate related assets, including
real estate loans and mortgage-backed securities (MBS). To estimate implicit market
discounts on bank assets, we empirically relate Tobin’s q, computed as the market-to-
book value of assets, to banks’ asset exposures using quarterly accounting data on U.S.
bank holding companies for the period 2001 to 2008. Our primary focus is on real estate
related assets, as these assets constitute a large fraction of the total assets of the average
bank, and as recent declines in U.S. real estate prices have raised doubts about the
underlying value of these assets. However, we also apply our methodology to other on-
and off-balance sheet items. We estimate significant discounts on banks’ real estate loans
(relative to other loans) starting in 2005, averaging about 10% in 2008. The discount on
real estate loans for low-valuation banks (with a value of q below the median) is
estimated to be relatively small, possibly reflecting expected safety net benefits to offset
loan impairment. As the average U.S. bank holding company in 2008 holds about 54% of
its assets in the form of real estate loans, the implicit discount in loan values goes a long
2
8/7/2019 acc discretion of bank during fin crisis
http://slidepdf.com/reader/full/acc-discretion-of-bank-during-fin-crisis 4/59
way toward explaining the current depressed state of bank share prices. We further find
that investors first discounted banks’ holdings of MBS in 2008. For that year, we find an
average discount on these assets of 24% (relative to other securities), while the average
MBS exposure amounted to 10% of assets. The market discount on MBS that are
available-for-sale (and carried at fair value) is estimated to be 23%, against a discount of
32% for MBS that are held-to-maturity (and carried at historical cost). Thus, even MBS
that are carried at fair value appear to be overvalued on the books of the banks.
Second, using an event study methodology we find that banks with large exposure
to MBS experienced relatively large excess returns when rules regarding fair value
accounting are relaxed. Pressures arose during the summer of 2008 to provide banks with
more leniency to determine the fair value of illiquid assets such as thinly traded MBS to
prevent these fair values from reflecting ‘fire-sale’ prices.2 Correspondingly, on October
10, 2008 the Financial Accounting Standards Board (FSAB) clarified the allowable use of
non-market information for determining the fair value of financial assets when the market
for that asset is not active. Subsequently, on April 9, 2009, the FSAB announced a related
decision to provide banks greater discretion in the use of non-market information in
determining the fair-value of hard-to-value assets. As expected, the stock market on both
occasions cheered the banks’ enhanced ability to maintain accounting solvency in an
environment of low transaction prices for MBS. Using an event study methodology, we
find that banks with large exposure to MBS experienced relatively large excess returns
2 The primary concern was one of maintaining solvency at affected banks. There was also a concern thatfire sales associated losses could spread to other financial institutions. Allen and Carletti (2008) and Plantinet al. (2008) offer theoretical models investigating potential contagion effects among banks if fair valueaccounting forces banks to value their securities according to observed ‘fire-sale’ prices.
3
8/7/2019 acc discretion of bank during fin crisis
http://slidepdf.com/reader/full/acc-discretion-of-bank-during-fin-crisis 5/59
around both announcement dates, indicating that these banks in particular are expected to
benefit from the expanded accounting discretion.
Third, we show that banks use accounting discretion regarding the realization of
loan losses and the classification of assets to preserve book capital. Banks have
considerable discretion in the timing of their loan loss provisioning for bad loans and in
the realization of loan losses in the form of charge-offs. Thus, banks with large exposure
to MBS and related losses can attempt to compensate by reducing the provisioning for
bad debt. We indeed find that banks with large portfolios of MBS report relatively low
rates of loan loss provisioning and loan charge-offs.
We also examine banks’ choices regarding the classification of MBS as either
held-to-maturity or available-for-sale. We consider this categorization separately for
MBS that are covered or issued by a government agency. In 2008, the fair value of
especially non-guaranteed MBS tended to be less than their amortized cost. This implies
that banks could augment the book value of assets by reclassifying MBS available-for-
sale as held-to-maturity. Indeed, we show that the share of non-guaranteed MBS that are
held-to-maturity increased substantially in 2008. Reclassification of this kind is also
advantageous for banks whose share price is depressed on account of large real estate
related exposures. Consistent with this, we find that the share of MBS kept as held-to-
maturity is significantly related to both real estate loan and MBS exposures. Moreover,
these relationships are stronger for low-valuation banks.
Taken together, the evidence of this paper shows that banks use considerable
accounting discretion regarding the categorization of assets, valuation techniques, and the
treatment of loan losses. At the present time of financial crisis, accounting discretion
4
8/7/2019 acc discretion of bank during fin crisis
http://slidepdf.com/reader/full/acc-discretion-of-bank-during-fin-crisis 6/59
appears to be used to soften the impact of the crisis on the book valuation of assets.
Some accounting discretion is unavoidable as accounting systems in part are mechanisms
for firms to reveal asymmetric information to investors and other outside parties. A
theoretical literature outlines that managers of firms may have incentives to smooth
reported accounting incomes either to smooth their own compensation, to increase their
job security, or to increase firm valuation by investors (see, e.g., Trueman and Titman,
1988, Fudenberg and Tirole, 1995, and Sankar and Subramanyam, 2000). 3
Accounting discretion, however, entails the risk of generating highly inaccurate
accounting information at a time of great turmoil, such as the present financial crisis.
Highly inaccurate accounting information in the case of banks can be especially harmful,
as it may lead to regulatory forbearance with concomitant risks for tax payers. In the
present crisis, the financial statements of banks appear to overstate the book value of
assets to the point of becoming misleading guides to investors and regulators alike.4
Thus, the present crisis can be seen as a ‘stress test’ of the accounting framework that
reveals that book valuation should more accurately reflect true values at a time of sharp
declines in market values. Accounting reforms announced so far and discussed in thi
paper, however, seem to go in the opposite direction of increasing the gap between boo
and market values. This may be testimony that bank interests weigh heavily in this
s
k
debate.
Our paper relates to a large literature in accounting and finance on how
accounting principles and systems affect corporate behavior and that of banks in
3 Fudenberg and Tirole (1995) show that accounting discretion giving rise to reported income smoothing
may be a property of the optimal contract offered to firm managers to elicit their private information. 4 The outcomes of stress tests of major U.S. banks conducted by the U.S. Treasury in 2009, which
calculated capital shortfalls at several major banks, are testimony to the fact that publicly available
accounting information at the time provided an inadequate picture of the health of the concerned banks.
5
8/7/2019 acc discretion of bank during fin crisis
http://slidepdf.com/reader/full/acc-discretion-of-bank-during-fin-crisis 7/59
particular (see, e.g., Collins et al. 1995, Shackelford et al., 2008, and Leuz and Wysocki,
2008). Much of this work analyzes the cost and benefits of earnings management of firm
(see, e.g., Leuz et al., 2003, and Hutton et al., 2008). There is also work on the cost an
benefits of enhanced corporate disclosure and accounting transparency (see Leuz a
Wysocki, 2008, for a review). For example, Karpoff et al. (2008) using firm-level
information on legal enforcement actions show that financial misre
s
d
nd
presentation has
reputat
tor of bank
failures
8,
ital being eroded as the asset price bubble in real estate markets
burst starting in 2007.
ional consequences for firms and depresses firm valuation.
A related literature reviewed by Barth et al. (2001) and Holthausen and Watts
(2001) asks whether accounting information is value relevant in the sense that it conforms
to the information that bank shareholders use to price bank shares. Barth et al. (1996) and
Eccher et al. (1996) find that fair value estimates of loan portfolios and securities help to
explain bank share prices beyond amortized cost. There is also recent work on the market
pricing of bank assets reported under different fair valuation techniques (e.g., Kolev,
2009, Goh et al., 2009, and Song et al., 2009). Bongini et al. (2002) further find that
measures of bank fragility based on market information are a better predic
than measures of bank fragility based on accounting information.
Our paper is part of an emerging literature on the causes and effects of the 2007
U.S. financial crisis. This work shows that house price appreciation (e.g., Demyanyk and
Van Hemert, 2008) and asset securitization (e.g., Keys et al., 2008; Mian and Sufi, 200
Loutskina and Strahan, 2009), combined with a more general deterioration of lending
standards by banks (e.g., Dell’Ariccia et al., 2008), helped fuel a crisis in U.S. mortgage
markets, with bank cap
6
8/7/2019 acc discretion of bank during fin crisis
http://slidepdf.com/reader/full/acc-discretion-of-bank-during-fin-crisis 8/59
The paper continues as follows. Section 2 sets out the relationship between
Tobin’s q and market discounts on bank assets. Section 3 discusses the data. Section 4
first presents empirical evidence on market discounts of real estate related assets relative
to book values. Subsequently, it provides evidence on the stock market response to the
announcements of more lenient rules for accounting for illiquid assets. Section 5
examines the use of bank discretion regarding loan loss provisioning, loan charge-offs,
and the classification of MBS into different accounting categories. Section 6 concludes.
2. Tobin’s q value and market discounts
In this section, we describe how observations of Tobin’s q can be used to infer
discounts on bank assets implicit in the stock market.5
Let MV be the market value of the
bank. At the same time, let Ai be the accounting value of asset i and let Li be the
accounting value of liability i. Assuming there are operating markets for a bank’s assets
and liabilities, we can state a bank’s market value as follows:
i
l
i
i
i
a
i
i
LvAvMV (1)
where is the market value of asset i and is the market value of liability i.a
iv l
iv6
We can define q as the market value of the equity of the bank plus the book value
of all liabilities divided by the book value of all assets as follows:
5 In similar fashion, Sachs and Huizinga (1987) estimate discounts on third world debt on the books of U.S. commercial banks at the time of the international debt crisis of the 1980s. A related literature, startingwith Lang and Stulz (1994) and including Laeven and Levine (2007), has studied discounts in Tobin’s q arising from corporate diversification. In that literature, discounts are computed for each business unit of aconglomerate with respect to the value of comparable stand-alone firms, while here we compute discountsfor different assets and liabilities of the same bank.6 In eq. (1), we ignore that market value may depend on the co-existence of certain assets and liabilities asdiscussed in, for instance, DeYoung and Yom (2008).
7
8/7/2019 acc discretion of bank during fin crisis
http://slidepdf.com/reader/full/acc-discretion-of-bank-during-fin-crisis 9/59
i
i
i
i
A
LMV
q
Substituting for MV from (1) into the expression for q, we get:
i
l
i
i
i
a
i
i
l d ad q 1 (2)
where d aa v 1 , l l vd 1 ,ii ii
i
i
ii
A
Aa and
i
i
ii
A
Ll . Note that and are the
discounts implicit in the bank’s stock price of a bank’s assets and liabilities relative to
book values. At the same time, and are the accounting values of particular assets
and liabilities relative to the book value of all assets.
ad l d
i i
i
ai
l
From eq. (2), we see that if all assets and liabilities of the bank are valued at
market value in the bank’s balance sheet, then q equals 1. Alternatively, a deviation of q
from 1 implies that the market valuation of at least one balance sheet items differs from
its accounting value.7
3. The data
In this study, we consider U.S. bank holding companies that are stock exchange
listed. These companies report a range of accounting data to the Federal Reserve System
by way of the Report on condition and income (Call report). We are using quarterly data
from these Call reports from the final quarter of 2001 till the end of 2008. This covers a
full business cycle as defined by the National Bureau of Economic Research (NBER)
7 Current book values of, say, real estate loans could already reflect some loan loss provisioning. Estimateddiscounts on bank assets then reflect the difference between market perception of asset impairment and therecognition of this impairment through reported loan loss provisioning (rather than the difference betweenmarket value and origination value). Put differently, the estimated discount reflects the difference betweenmarket perception of any asset impairment and the accounting treatment of this impairment.
8
8/7/2019 acc discretion of bank during fin crisis
http://slidepdf.com/reader/full/acc-discretion-of-bank-during-fin-crisis 10/59
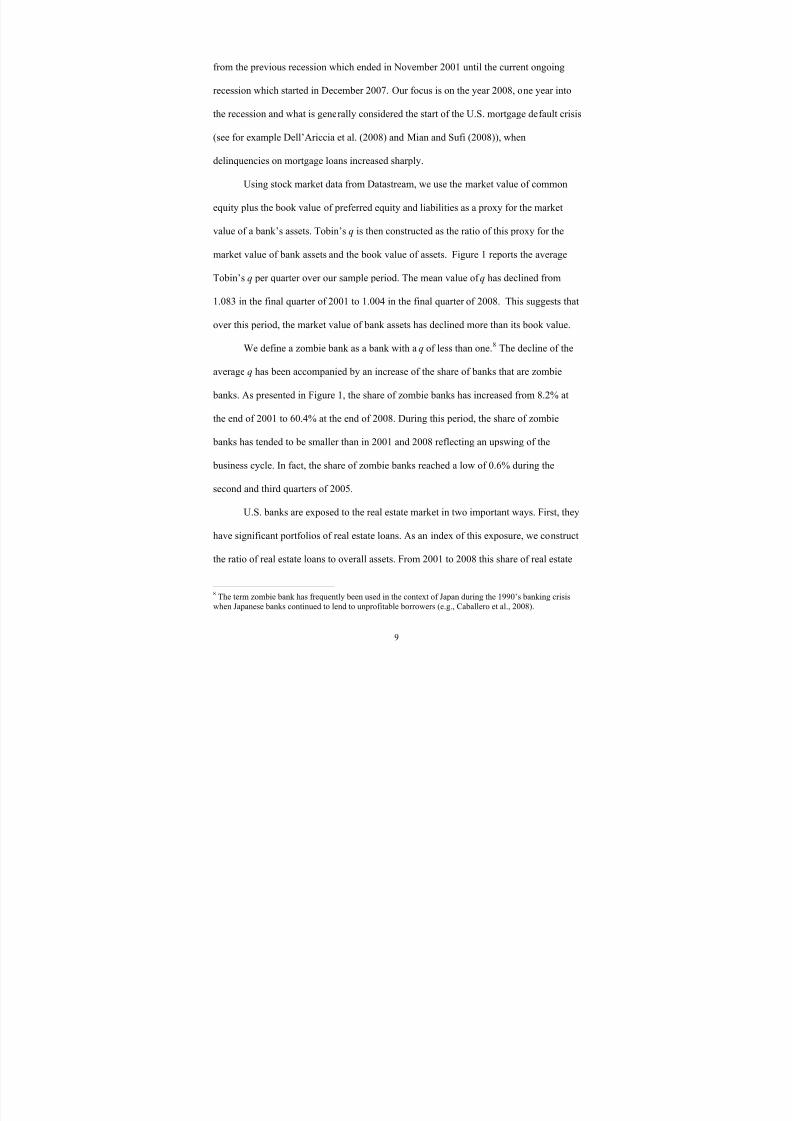
from the previous recession which ended in November 2001 until the current ongoing
recession which started in December 2007. Our focus is on the year 2008, one year into
the recession and what is generally considered the start of the U.S. mortgage default crisis
(see for example Dell’Ariccia et al. (2008) and Mian and Sufi (2008)), when
delinquencies on mortgage loans increased sharply.
Using stock market data from Datastream, we use the market value of common
equity plus the book value of preferred equity and liabilities as a proxy for the market
value of a bank’s assets. Tobin’s q is then constructed as the ratio of this proxy for the
market value of bank assets and the book value of assets. Figure 1 reports the average
Tobin’s q per quarter over our sample period. The mean value of q has declined from
1.083 in the final quarter of 2001 to 1.004 in the final quarter of 2008. This suggests that
over this period, the market value of bank assets has declined more than its book value.
We define a zombie bank as a bank with a q of less than one.8 The decline of the
average q has been accompanied by an increase of the share of banks that are zombie
banks. As presented in Figure 1, the share of zombie banks has increased from 8.2% at
the end of 2001 to 60.4% at the end of 2008. During this period, the share of zombie
banks has tended to be smaller than in 2001 and 2008 reflecting an upswing of the
business cycle. In fact, the share of zombie banks reached a low of 0.6% during the
second and third quarters of 2005.
U.S. banks are exposed to the real estate market in two important ways. First, they
have significant portfolios of real estate loans. As an index of this exposure, we construct
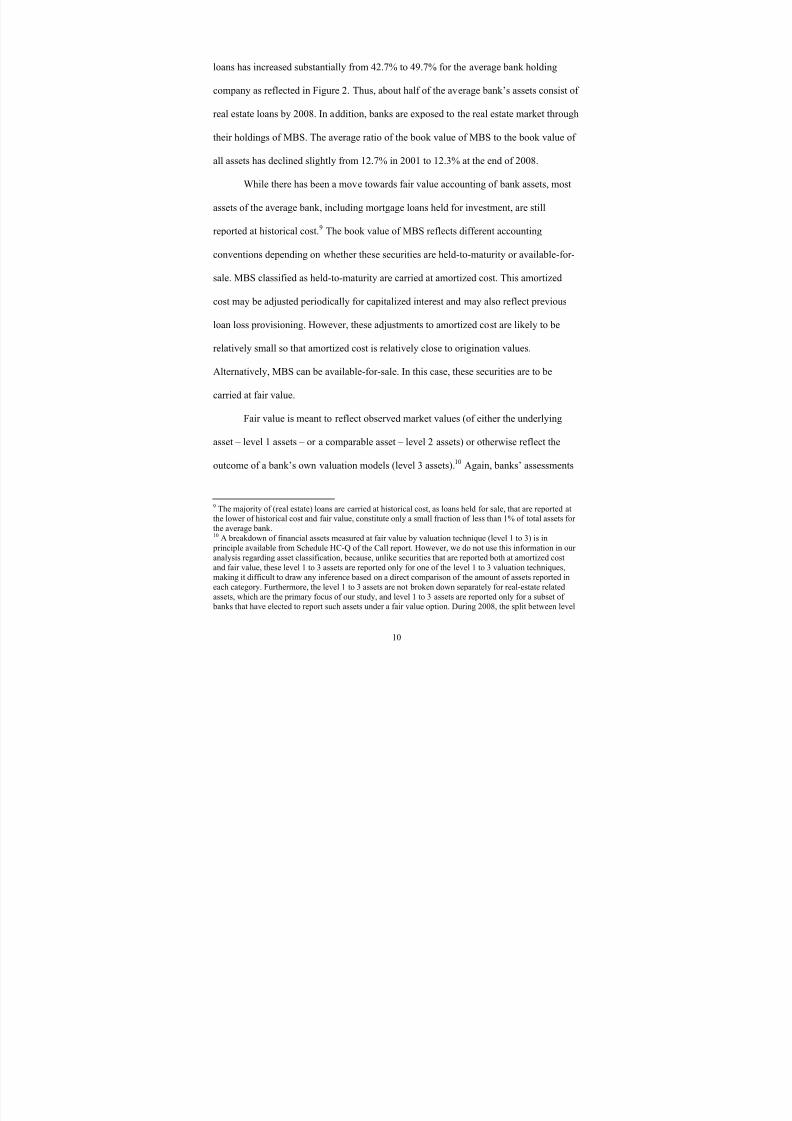
the ratio of real estate loans to overall assets. From 2001 to 2008 this share of real estate
8 The term zombie bank has frequently been used in the context of Japan during the 1990’s banking crisiswhen Japanese banks continued to lend to unprofitable borrowers (e.g., Caballero et al., 2008).
9
8/7/2019 acc discretion of bank during fin crisis
http://slidepdf.com/reader/full/acc-discretion-of-bank-during-fin-crisis 11/59
loans has increased substantially from 42.7% to 49.7% for the average bank holding
company as reflected in Figure 2. Thus, about half of the average bank’s assets consist of
real estate loans by 2008. In addition, banks are exposed to the real estate market through
their holdings of MBS. The average ratio of the book value of MBS to the book value of
all assets has declined slightly from 12.7% in 2001 to 12.3% at the end of 2008.
While there has been a move towards fair value accounting of bank assets, most
assets of the average bank, including mortgage loans held for investment, are still
reported at historical cost.9 The book value of MBS reflects different accounting
conventions depending on whether these securities are held-to-maturity or available-for-
sale. MBS classified as held-to-maturity are carried at amortized cost. This amortized
cost may be adjusted periodically for capitalized interest and may also reflect previous
loan loss provisioning. However, these adjustments to amortized cost are likely to be
relatively small so that amortized cost is relatively close to origination values.
Alternatively, MBS can be available-for-sale. In this case, these securities are to be
carried at fair value.
Fair value is meant to reflect observed market values (of either the underlying
asset – level 1 assets – or a comparable asset – level 2 assets) or otherwise reflect the
outcome of a bank’s own valuation models (level 3 assets).10 Again, banks’ assessments
9 The majority of (real estate) loans are carried at historical cost, as loans held for sale, that are reported at
the lower of historical cost and fair value, constitute only a small fraction of less than 1% of total assets for the average bank.10 A breakdown of financial assets measured at fair value by valuation technique (level 1 to 3) is inprinciple available from Schedule HC-Q of the Call report. However, we do not use this information in our analysis regarding asset classification, because, unlike securities that are reported both at amortized costand fair value, these level 1 to 3 assets are reported only for one of the level 1 to 3 valuation techniques,making it difficult to draw any inference based on a direct comparison of the amount of assets reported ineach category. Furthermore, the level 1 to 3 assets are not broken down separately for real-estate relatedassets, which are the primary focus of our study, and level 1 to 3 assets are reported only for a subset of banks that have elected to report such assets under a fair value option. During 2008, the split between level
10
8/7/2019 acc discretion of bank during fin crisis
http://slidepdf.com/reader/full/acc-discretion-of-bank-during-fin-crisis 12/59
of fair value may differ across banking institutions as the determination of fair value in
practice leaves banks with significant discretion.11 At any rate, at a time of declining
asset values, one expects fair values to be less than amortized cost.
Interestingly, banks report in their Call report filings both the amortized cost and
fair value of MBS regardless of whether these are held-to-maturity or available-for-sale.
Thus, for MBS that are carried at amortized cost we also know the assessed fair value,
while for MBS carried at fair value we also know the reported amortized cost. This
enables us to compute a bank’s share of MBS that are held-to-maturity (rather than
available-for-sale) on a single accounting basis. Specifically, we can compute the share of
MBS that is held-to-maturity using amortized costs for all MBS.
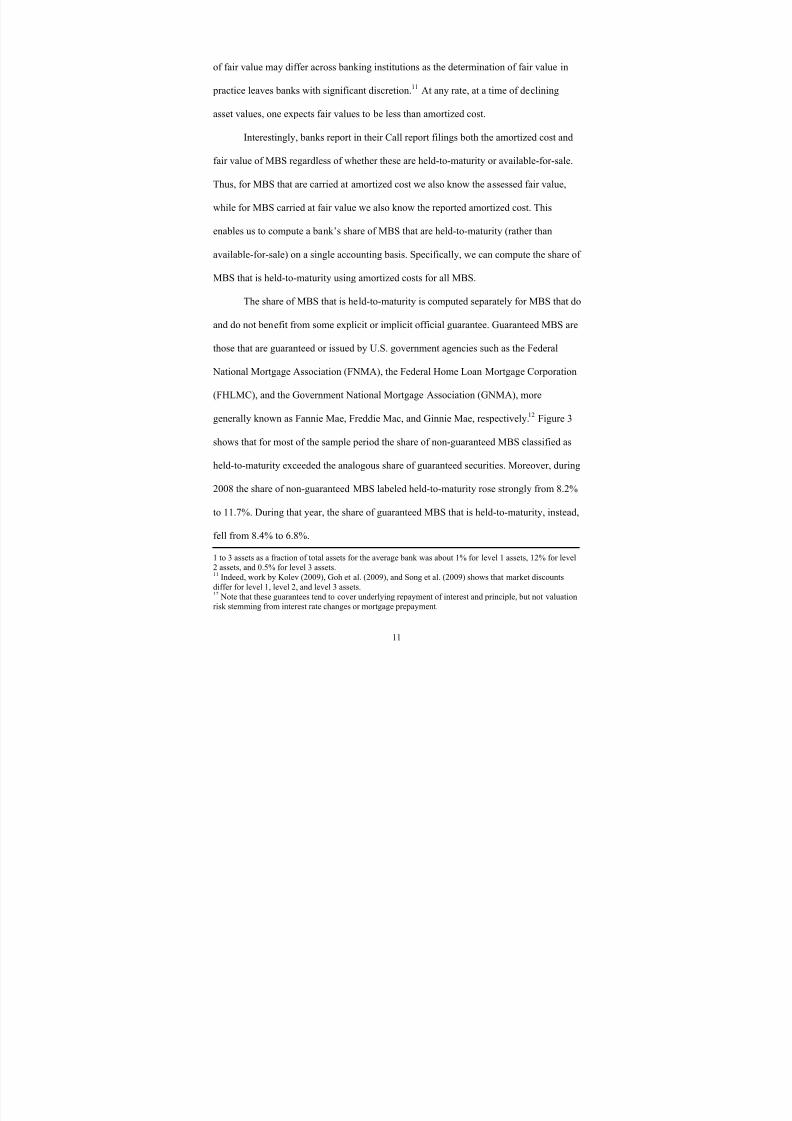
The share of MBS that is held-to-maturity is computed separately for MBS that do
and do not benefit from some explicit or implicit official guarantee. Guaranteed MBS are
those that are guaranteed or issued by U.S. government agencies such as the Federal
National Mortgage Association (FNMA), the Federal Home Loan Mortgage Corporation
(FHLMC), and the Government National Mortgage Association (GNMA), more
generally known as Fannie Mae, Freddie Mac, and Ginnie Mae, respectively.12 Figure 3
shows that for most of the sample period the share of non-guaranteed MBS classified as
held-to-maturity exceeded the analogous share of guaranteed securities. Moreover, during
2008 the share of non-guaranteed MBS labeled held-to-maturity rose strongly from 8.2%
to 11.7%. During that year, the share of guaranteed MBS that is held-to-maturity, instead,
fell from 8.4% to 6.8%.
1 to 3 assets as a fraction of total assets for the average bank was about 1% for level 1 assets, 12% for level2 assets, and 0.5% for level 3 assets.11 Indeed, work by Kolev (2009), Goh et al. (2009), and Song et al. (2009) shows that market discountsdiffer for level 1, level 2, and level 3 assets.12 Note that these guarantees tend to cover underlying repayment of interest and principle, but not valuationrisk stemming from interest rate changes or mortgage prepayment.
11
8/7/2019 acc discretion of bank during fin crisis
http://slidepdf.com/reader/full/acc-discretion-of-bank-during-fin-crisis 13/59
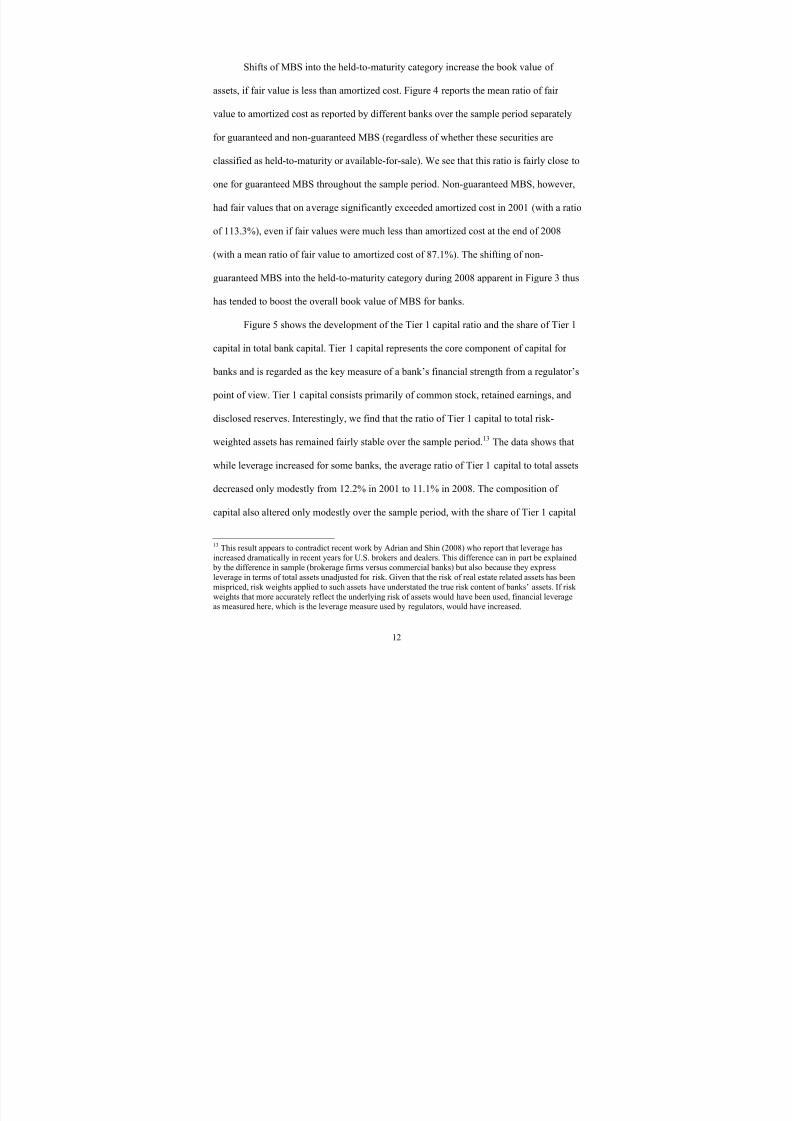
Shifts of MBS into the held-to-maturity category increase the book value of
assets, if fair value is less than amortized cost. Figure 4 reports the mean ratio of fair
value to amortized cost as reported by different banks over the sample period separately
for guaranteed and non-guaranteed MBS (regardless of whether these securities are
classified as held-to-maturity or available-for-sale). We see that this ratio is fairly close to
one for guaranteed MBS throughout the sample period. Non-guaranteed MBS, however,
had fair values that on average significantly exceeded amortized cost in 2001 (with a ratio
of 113.3%), even if fair values were much less than amortized cost at the end of 2008
(with a mean ratio of fair value to amortized cost of 87.1%). The shifting of non-
guaranteed MBS into the held-to-maturity category during 2008 apparent in Figure 3 thus
has tended to boost the overall book value of MBS for banks.
Figure 5 shows the development of the Tier 1 capital ratio and the share of Tier 1
capital in total bank capital. Tier 1 capital represents the core component of capital for
banks and is regarded as the key measure of a bank’s financial strength from a regulator’s
point of view. Tier 1 capital consists primarily of common stock, retained earnings, and
disclosed reserves. Interestingly, we find that the ratio of Tier 1 capital to total risk-
weighted assets has remained fairly stable over the sample period.13The data shows that
while leverage increased for some banks, the average ratio of Tier 1 capital to total assets
decreased only modestly from 12.2% in 2001 to 11.1% in 2008. The composition of
capital also altered only modestly over the sample period, with the share of Tier 1 capital
13 This result appears to contradict recent work by Adrian and Shin (2008) who report that leverage hasincreased dramatically in recent years for U.S. brokers and dealers. This difference can in part be explainedby the difference in sample (brokerage firms versus commercial banks) but also because they expressleverage in terms of total assets unadjusted for risk. Given that the risk of real estate related assets has beenmispriced, risk weights applied to such assets have understated the true risk content of banks’ assets. If risk weights that more accurately reflect the underlying risk of assets would have been used, financial leverageas measured here, which is the leverage measure used by regulators, would have increased.
12
8/7/2019 acc discretion of bank during fin crisis
http://slidepdf.com/reader/full/acc-discretion-of-bank-during-fin-crisis 14/59
in total capital shrinking from 88.2% in 2001 to 86.3% in 2008. This suggests that,
although some banks have looked for less traditional, non-core sources of capital, such as
subordinated debt or perpetual stock, to boost capital and increase assets, most banks
continued to do so while also increasing Tier 1 capital.
A bank’s q should be close to one in a world where all bank assets and liabilities
are readily tradable and marked to market. At the same time, deviations of q from one can
be explained by discrepancies between market values and book values of any bank
balance sheet items. Below, we relate a bank’s q to a range of bank balance sheet items to
explain bank-level variation in q. Variable market values of bank balance sheet items in
an environment of slowly adjusting book values suggest that the dependence of q on bank
balance sheet items varies over time. It is especially interesting to assess whether the
valuation of bank balance sheet items implicit in bank stock prices differs from book
values at a time of financial crisis. Therefore, the emphasis of the empirical work will be
on the year 2008, the year following the onset of the U.S. mortgage default crisis.
Summary statistics for the main variables in 2008 are provided in Table 1. We
exclude banks with Tobin’s q exceeding its 99th percentile (amounting to a Tobin’s q
greater than 1.5) as these are not ordinary banks that carry primarily financial assets. The
mean ratio of loans to assets is 71.4%, while the mean ratio of real estate loans to assets is
53.6%. The ratio of securities to assets (using amortized cost to value held-to-maturity
securities and fair values for securities available-for-sale) is 16.9%. As a subcategory, the
average ratio of MBS to assets is 9.6%. This can be split into MBS held-to-maturity at
0.8% of assets, and MBS available-for-sale at 8.8% of assets. MBS that are held-to-
maturity can again be split into guaranteed and non-guaranteed securities equivalent to
13
8/7/2019 acc discretion of bank during fin crisis
http://slidepdf.com/reader/full/acc-discretion-of-bank-during-fin-crisis 15/59
0.7% and 0.1% of assets, respectively. Guaranteed and non-guaranteed MBS that are
available-for-sale in turn amount to 8.0% and 0.8% of assets.
Next, Big is a dummy variable that equals one, if a bank’s total assets exceed the
sample average total assets in a given quarter. HPI is a state-level house price index from
the U.S. Office of Federal Housing Enterprise Oversight (OFHEO). Low valuation is a
dummy variable that equals one in a given quarter if a bank’s q is less than one, and zero
otherwise. By the end of 2008, 46% of U.S. banks had a value of q of less than one.
Several additional asset categories are considered as well. Trading is defined as
trading assets relative to total assets (obtained from Schedule HC-B of the Call report).
Trading assets, which include some MBS, are carried at fair value and held in the bank’s
trading book.14A detailed split-up of trading assets is only available for the domestic
offices of bank holding companies and is not reported. On average, trading assets only
amount to a share of 0.5% of assets, because only large banks tend to have such assets.
Among bank liability variables, Deposits is defined as total deposits divided by
total assets, and it amounts to 72.0% of assets on average. These deposits include
relatively stable retail deposits and more unstable wholesale deposits. Data on deposits
are obtained from Schedule HC-E of the Call report files. As an index of unstable
wholesale deposits, we construct the ratio of deposits that exceed $ 100,000 and have a
remaining maturity of less than one year to total assets. These large and short-term
deposits on average are 2.5% of assets. Banks are further seen to issue relatively little
commercial paper, with commercial paper amounting to only 0.l% of assets on average.
14 Trading assets are to be reported only by bank holding companies with average trading assets of $2million or more in any of the four preceding quarters.
14
8/7/2019 acc discretion of bank during fin crisis
http://slidepdf.com/reader/full/acc-discretion-of-bank-during-fin-crisis 16/59
Bank capital, being the sum of Tier 1 and Tier 2 capital, is composed mostly of Tier 1
capital, amounting to 86.3% of capital on average.
Off-balance sheet items can equally matter for bank valuation. However, we find
that they tend to constitute a small fraction of total assets for the average bank, in part
because only large banks tend to have significant off-balance exposure. Data on off-
balance sheet items are obtained from Schedule HC-L of the Call report files. Credit
derivatives positive and Credit derivatives negative are the mean ratios of credit
protection purchased and credit protection sold to total assets, respectively. These ratios
are equivalent to 1.5% and 1.4% of assets.
We also obtain information on banks’ securitization and asset sale activities from
Schedule HC-S of the Call report files. The variable Securitized is the ratio of assets sold
and securitized with servicing retained by the bank, or with recourse or other seller
provided credit enhancements, to total assets. Securitized takes on a value of 1.5% of
assets on average. Next, Recourse is the maximum amount of credit exposure arising
from recourse or other seller-provided credit enhancements provided to securitization
structures relative to total assets. Recourse is relatively small at 0.05% of assets on
average. Sponsored is the maximum amount of credit exposure arising from credit
enhancements provided to other institutions’ securitization structures relative to assets.
This kind of exposure is even smaller at 0.01% of assets on average. Finally, Sales stands
for the ratio of assets sold with recourse or other seller-provided credit enhancements and
not securitized to total assets, with a mean value of 3.2%. The mean values of these off-
balance sheet items are seen to be small on average and they are expected to affect bank
valuation correspondingly little.
15
8/7/2019 acc discretion of bank during fin crisis
http://slidepdf.com/reader/full/acc-discretion-of-bank-during-fin-crisis 17/59
In principle, investors could respond mainly to the fact that a bank has a particular
kind of off-balance sheet exposure rather than to the size of this exposure. To allow for
this, we also construct several dummy variables corresponding to our five off-balance
sheet variables that denote whether or not the bank has exposure to a particular off-
balance sheet item. Thus, Credit derivative, positive is a dummy variable that equals one
if the Credit derivative, positive variable is positive, and zero if Credit derivative, positive
is zero. In the table, we see that 5.8% of banks have, in fact, either bought or sold any
credit protection. Relatively many banks, in fact 28.8% of banks in the sample, have a
positive Sales dummy variable, indicating that they sold some non-securitized assets with
recourse or seller-provided credit enhancements.
Next, loan loss provisioning is calculated as loan loss provisions divided by the
book value of all loans. The mean loan loss provisioning rate is 0.8%. Net charge-offs, in
turn, is the ratio of the difference between loan charge-offs and loan recoveries to the
book value of loans. The mean net loan charge-off rate is 0.5%. Thus, loan loss
provisioning exceeded net loan charge-offs in 2008, as expectations of additional loan
losses surpassed actual loan write-offs. Finally, the share of real estate loans is the ratio of
real estate loans to total loans with a mean value of 74.3%.
4. Market discounts and valuation effects of real estate related assets
This section first provides empirical estimates of market discounts of real estate
related assets relative to book values. Subsequently, it examines bank stock price
reactions to amendments of fair value accounting rules. Finally, it investigates the use of
16
8/7/2019 acc discretion of bank during fin crisis
http://slidepdf.com/reader/full/acc-discretion-of-bank-during-fin-crisis 18/59
banks’ discretion regarding the accounting for bad loans in the form of loan loss
provisioning and loan charge-offs.
4.1 Empirical evidence on market discounts
This subsection reports the results of regressions of q to reveal implicit stock
market valuations of key balance sheet and off-balance sheet items. All regressions
include U.S. state fixed effects and quarterly period fixed effects to control for systematic
differences across U.S. states and time periods, such as housing and labor market
conditions, or the monetary policy stance.
To start, Table 2 reports regressions of q that include the overall loans and overall
securities variables with data for 2008.15 The Securities variable enters with a positive
coefficient of 0.096, which suggests that overall securities are valued more highly
implicit in bank share prices than on banks’ books, though the effects is not statistically
significant. The Loans variable also does not enter significantly.
Next, regression 2 in addition includes the real estate loans and MBS variables.
Note that the inclusion of both the Real estate loans variable and the Loans variable,
which includes real estate loans, implies that the effect of real estate loans is measured
relative to that of other loans. Similarly, for MBS, the effect is computed relative to the
overall effect for Securities, since MBS are a part of total securities. The real estate loans
variable enters with a coefficient of -0.107 that is significant at the 1% level implying that
15 The estimation model implicitly sets the discount on excluded asset categories to zero. Loans andsecurities included in the regression amount to 89% of total assets for the average bank in our sample.Asset categories excluded from the regression are cash-like assets, including cash and federal funds soldand totaling 9% of total assets, and non-cash like assets, including trading assets and fixed assets andtotaling the remainder of 2% of total assets. Thus, with cash-like assets carrying a discount of close to zeroand constituting the majority of excluded assets, the implicit assumption of a discount of zero on excludedasset categories appears to be reasonable.
17
8/7/2019 acc discretion of bank during fin crisis
http://slidepdf.com/reader/full/acc-discretion-of-bank-during-fin-crisis 19/59
the discount of real estate loans (relative to other loans) is 10.7%.16 The direct effect of
real estate loans on Tobin’s q, computed by adding the coefficients of the Loans and Real
estate loans variables, is close to zero, indicating that non-real estate loans carry a
negative discount. The MBS variable similarly enters with a coefficient of -0.244 that is
significant at the 1% level so that MBS appear to be discounted 24.4% relative to other
securities.17
In regression 3, we replace the MBS variable with two separate variables, MBS,
held and MBS, for sale that represent the parts of MBS that are held-to-maturity (and
carried at amortized cost) and available-for-sale (and carried at fair value). The MBS,
held variable obtains a coefficient of -0.321 that is significant at 1%, while the MBS, for
sale variable enters with a coefficient of -0.227 that is significant at 5%. Thus, MBS
classified as held-to-maturity appear to be discounted significantly at 32.1%, while the
MBS available-for-sale tend to have a smaller discount of 22.7% on average relative to
other securities. Thus, the gap between implicit market prices and accounting values
appears to be largest for MBS classified as held-to-maturity.
Finally, in regression 4 we split the MBS, held and MBS, for sale variables into
their guaranteed and non-guaranteed parts. Now we see that the guaranteed and non-
guaranteed parts of the MBS, held variable are estimated with coefficients of -0.293 and -
0.472 that are both significant at the 1% level, while the two MBS, for sale variables
attract negative coefficients of -0.220 and -0.324 that are smaller in absolute value. Thus,
16 Real estate loan exposure can lower a bank’s q value by reducing expected bank return as well as byincreasing bank return risk. Consistent with the latter channel, Knaup and Wagner (2009) find that thesensitivity of bank share prices to a credit default swap index increases in its ratio of real estate loans tototal loans.17 In this paper we only consider the market valuation of MBS as implicit in share prices. Empirical modelsof the direct pricing of MBS are offered by Dunn and Singleton (1983), Boudoukh, Richardson, Stantonand Whitelaw (1997), and Schwartz and Torous (1989).
18
8/7/2019 acc discretion of bank during fin crisis
http://slidepdf.com/reader/full/acc-discretion-of-bank-during-fin-crisis 20/59
especially the non-guaranteed MBS classified as held-to-maturity are discounted (relative
to securities other than MBS). The implied discount of 47.2% for these non-guaranteed
MBS is sizeable.
The evidence thus points at sizeable market discounts on real-estate related assets
relative to book values for U.S. bank holding companies in 2008. As we have data from
2001 onward, it is interesting to see whether such discounts existed before 2008. For this
purpose, we re-estimate regression 3 of Table 2 with data for each of the years in the
period 2001-2007. The results are reported in Table 3.
Throughout the period 2001 to 2004, none of the real estate asset categories is
estimated with a significant discount. From 2005, the real estate loan variable obtains
increasingly negative coefficients of -0.074, -0.081 and -0.101 that are significant at the
1% level to indicate a gradual deterioration of the implicit market value of real estate
loans relative to book value. The MBS variables, however, are not estimated with
significant discounts throughout the 2001-2007 period. The deterioration of real estate
loans thus appears to have preceded the deterioration of MBS by several years, until in
2008 both asset categories are estimated with significant discounts.
For distressed banks with depressed market values, a further deterioration of asset
quality will have relatively little impact on the bank’s market value compared to sound
banks. At the same time, for these banks asset deterioration could materially increase the
bank’s implicit claim on the financial safety net in the form of access to cheap capital
from public sources. As a result, estimated discounts on impaired real estate assets are
expected to be relatively small for distressed banks.
19
8/7/2019 acc discretion of bank during fin crisis
http://slidepdf.com/reader/full/acc-discretion-of-bank-during-fin-crisis 21/59
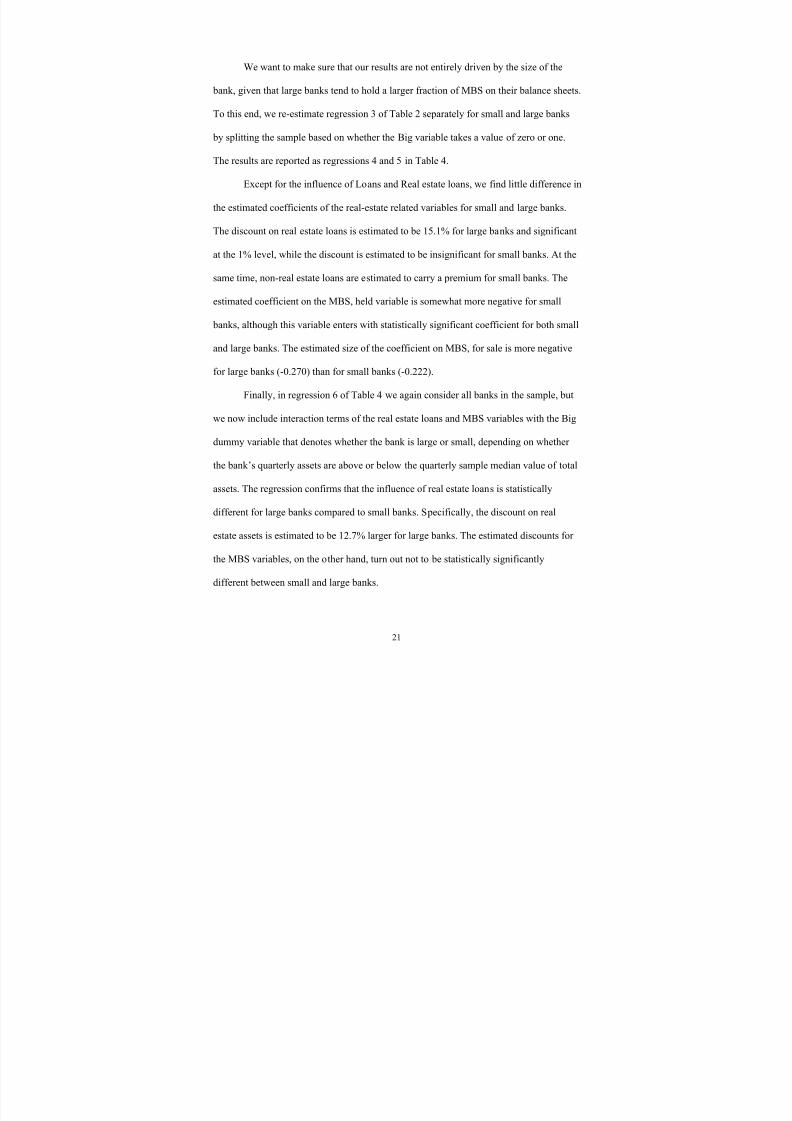
To test this, we re-estimate regression 3 of Table 2 separately for samples of
banks with either below or above median value of q, defined each quarter. The results are
reported as regressions 1 and 2 in Table 4. For the high-valuation banks, real estate loans
enters with a coefficient of -0.067 that is significant at the 5% level, while the MBS, held
and MBS, for sale variables enter with coefficients of -0.342 and -0.327 that are both
significant at the 1% level. For the low-valuation banks, none of the real estate related
variables are estimated with significant coefficients. Thus, the estimated discounts on real
estate loans and MBS are only significant for high-valuation banks.
Next, in regression 3 of Table 4 we again consider all banks in the sample, but we
now include interaction terms of the real estate loans and MBS, held and MBS, for sale
variables with a Low valuation dummy variable that denotes whether or not the q of the
bank is below the quarterly sample median value of q. These interaction terms are
expected to obtain positive coefficients to reflect smaller estimated discounts on real
estate related assets for low-valuation banks. Indeed, all three interactions terms obtain
positive coefficients and the coefficients for the interacted real estate loans and MBS, for
sale variables are estimated to be significant in regression 3. Specifically, the discount on
real estate assets is estimated to be 8.9% smaller for low-valuation banks (while the
discount estimated for high-valuation banks is 10.0%). At the same time, the estimated
discount on MBS, for sale is estimated to be 11.3% smaller for low-valuation banks
(against an estimated discount for high-valuation banks of 22.7% that is statistically
significant at the 1% level).
Overall these results indicate that discounts on real estate related assets implicit in
bank stock prices are, as expected, smaller for low-valuation banks.
20
8/7/2019 acc discretion of bank during fin crisis
http://slidepdf.com/reader/full/acc-discretion-of-bank-during-fin-crisis 22/59
8/7/2019 acc discretion of bank during fin crisis
http://slidepdf.com/reader/full/acc-discretion-of-bank-during-fin-crisis 23/59
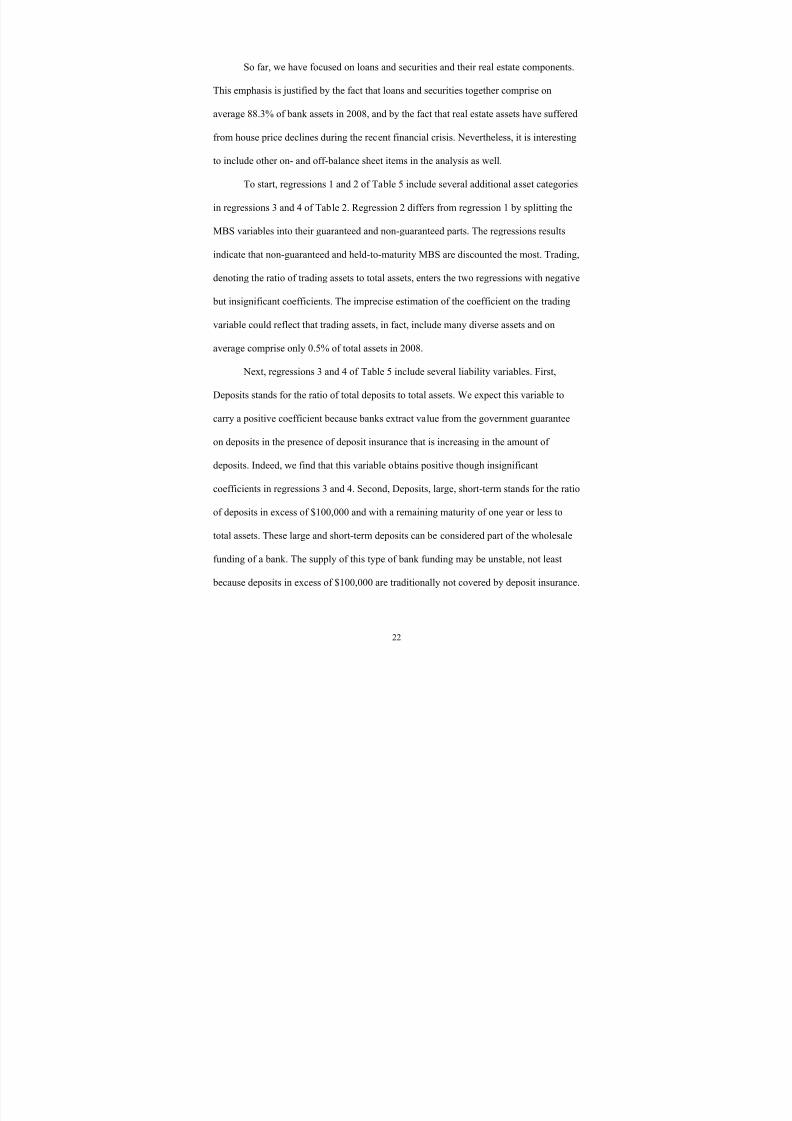
So far, we have focused on loans and securities and their real estate components.
This emphasis is justified by the fact that loans and securities together comprise on
average 88.3% of bank assets in 2008, and by the fact that real estate assets have suffered
from house price declines during the recent financial crisis. Nevertheless, it is interesting
to include other on- and off-balance sheet items in the analysis as well.
To start, regressions 1 and 2 of Table 5 include several additional asset categories
in regressions 3 and 4 of Table 2. Regression 2 differs from regression 1 by splitting the
MBS variables into their guaranteed and non-guaranteed parts. The regressions results
indicate that non-guaranteed and held-to-maturity MBS are discounted the most. Trading,
denoting the ratio of trading assets to total assets, enters the two regressions with negative
but insignificant coefficients. The imprecise estimation of the coefficient on the trading
variable could reflect that trading assets, in fact, include many diverse assets and on
average comprise only 0.5% of total assets in 2008.
Next, regressions 3 and 4 of Table 5 include several liability variables. First,
Deposits stands for the ratio of total deposits to total assets. We expect this variable to
carry a positive coefficient because banks extract value from the government guarantee
on deposits in the presence of deposit insurance that is increasing in the amount of
deposits. Indeed, we find that this variable obtains positive though insignificant
coefficients in regressions 3 and 4. Second, Deposits, large, short-term stands for the ratio
of deposits in excess of $100,000 and with a remaining maturity of one year or less to
total assets. These large and short-term deposits can be considered part of the wholesale
funding of a bank. The supply of this type of bank funding may be unstable, not least
because deposits in excess of $100,000 are traditionally not covered by deposit insurance.
22

8/7/2019 acc discretion of bank during fin crisis
http://slidepdf.com/reader/full/acc-discretion-of-bank-during-fin-crisis 24/59
This variable enters with a coefficient of -0.157 in regressions 3 and 4 that is significant
at the 5% level. This suggests that 1 dollar of these wholesale deposits reduces bank
value by about 0.16 dollars (more than other deposits). This, of course, does not mean
that the market value of these deposits is substantially different from unity. Rather, a
bank that heavily relies on wholesale funding is exposed to considerable funding risk as
potentially reflected in bank share prices. Third, the commercial paper variable stands for
the ratio of issued commercial paper to total assets. This variable enters with positive but
insignificant coefficients in regressions 3 and 4.
Regressions 5 and 6 include a variable that captures the composition of equity
capital. Specifically, we include the share of Tier 1 capital in total capital, denoted by the
Tier 1 variable. We expect that this variable enters with a positive coefficient, especially
for the year 2008, as markets have reassessed the superior value of Tier 1 capital to Tier 2
capital, partly in response to stricter capital requirements proposed by regulators. We
indeed find that the Tier 1 capital variable enter with positive coefficients of 0.105 and
0.104 in regressions 5 and 6 that are significant at the 1% level. This suggests that a one
standard deviation increase of 10% in the share of Tier 1 capital in total capital increases
bank value by 1%, which is not irrelevant given a standard deviation of q of 5%.
Interestingly, in unreported regressions we find that prior to 2008 the effect of the share
of Tier 1 capital on q is not statistically significant, indicating that Tier 1 or core capital
became a highly valued component of bank capital only starting in 2008.
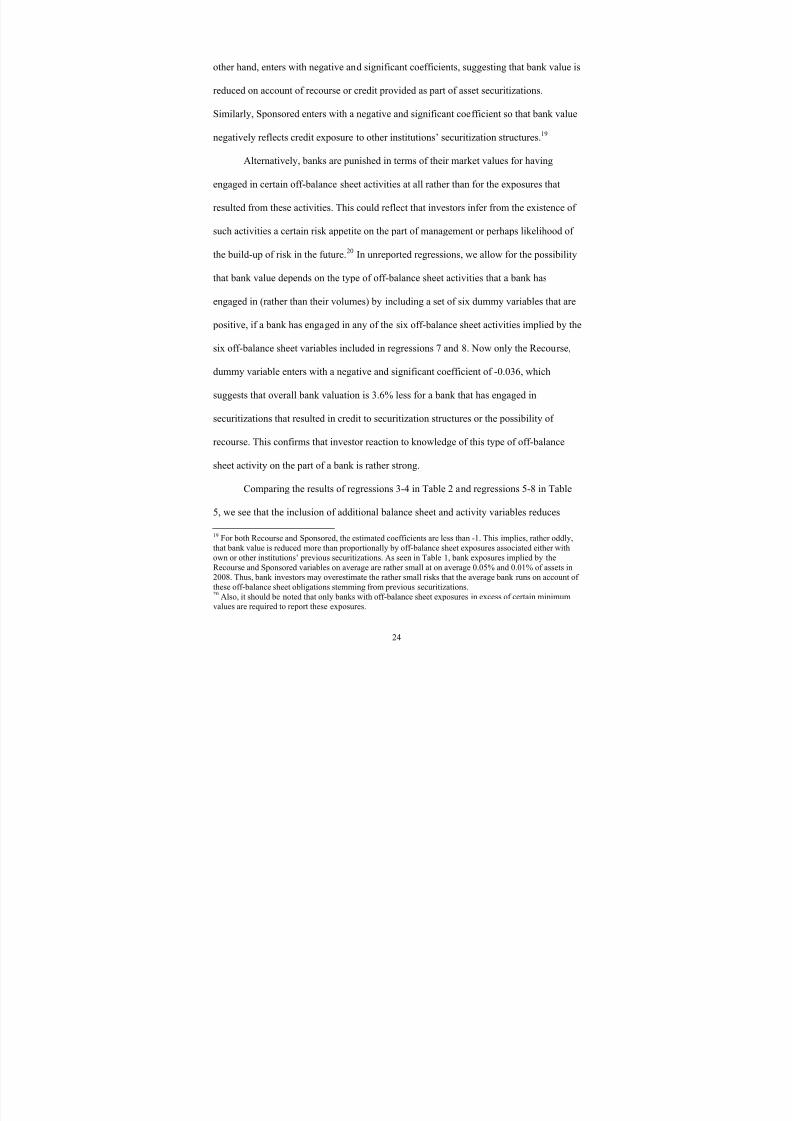
We next include several off-balance sheet items in regressions 7 and 8. 18 Credit
protection purchased or sold, as reflected in the Credit derivatives, positive and Credit
derivates, negative variables, do not enter significantly. The Recourse variable, on the
18 The variables in the expression for q remain defined as shares of the value of on-balance sheet assets.
23
8/7/2019 acc discretion of bank during fin crisis
http://slidepdf.com/reader/full/acc-discretion-of-bank-during-fin-crisis 25/59
other hand, enters with negative and significant coefficients, suggesting that bank value is
reduced on account of recourse or credit provided as part of asset securitizations.
Similarly, Sponsored enters with a negative and significant coefficient so that bank value
negatively reflects credit exposure to other institutions’ securitization structures.19
Alternatively, banks are punished in terms of their market values for having
engaged in certain off-balance sheet activities at all rather than for the exposures that
resulted from these activities. This could reflect that investors infer from the existence of
such activities a certain risk appetite on the part of management or perhaps likelihood of
the build-up of risk in the future.
20
In unreported regressions, we allow for the possibility
that bank value depends on the type of off-balance sheet activities that a bank has
engaged in (rather than their volumes) by including a set of six dummy variables that are
positive, if a bank has engaged in any of the six off-balance sheet activities implied by the
six off-balance sheet variables included in regressions 7 and 8. Now only the Recourse,
dummy variable enters with a negative and significant coefficient of -0.036, which
suggests that overall bank valuation is 3.6% less for a bank that has engaged in
securitizations that resulted in credit to securitization structures or the possibility of
recourse. This confirms that investor reaction to knowledge of this type of off-balance
sheet activity on the part of a bank is rather strong.
Comparing the results of regressions 3-4 in Table 2 and regressions 5-8 in Table
5, we see that the inclusion of additional balance sheet and activity variables reduces
19 For both Recourse and Sponsored, the estimated coefficients are less than -1. This implies, rather oddly,that bank value is reduced more than proportionally by off-balance sheet exposures associated either withown or other institutions’ previous securitizations. As seen in Table 1, bank exposures implied by theRecourse and Sponsored variables on average are rather small at on average 0.05% and 0.01% of assets in2008. Thus, bank investors may overestimate the rather small risks that the average bank runs on account of these off-balance sheet obligations stemming from previous securitizations.20 Also, it should be noted that only banks with off-balance sheet exposures in excess of certain minimumvalues are required to report these exposures.
24
8/7/2019 acc discretion of bank during fin crisis
http://slidepdf.com/reader/full/acc-discretion-of-bank-during-fin-crisis 26/59
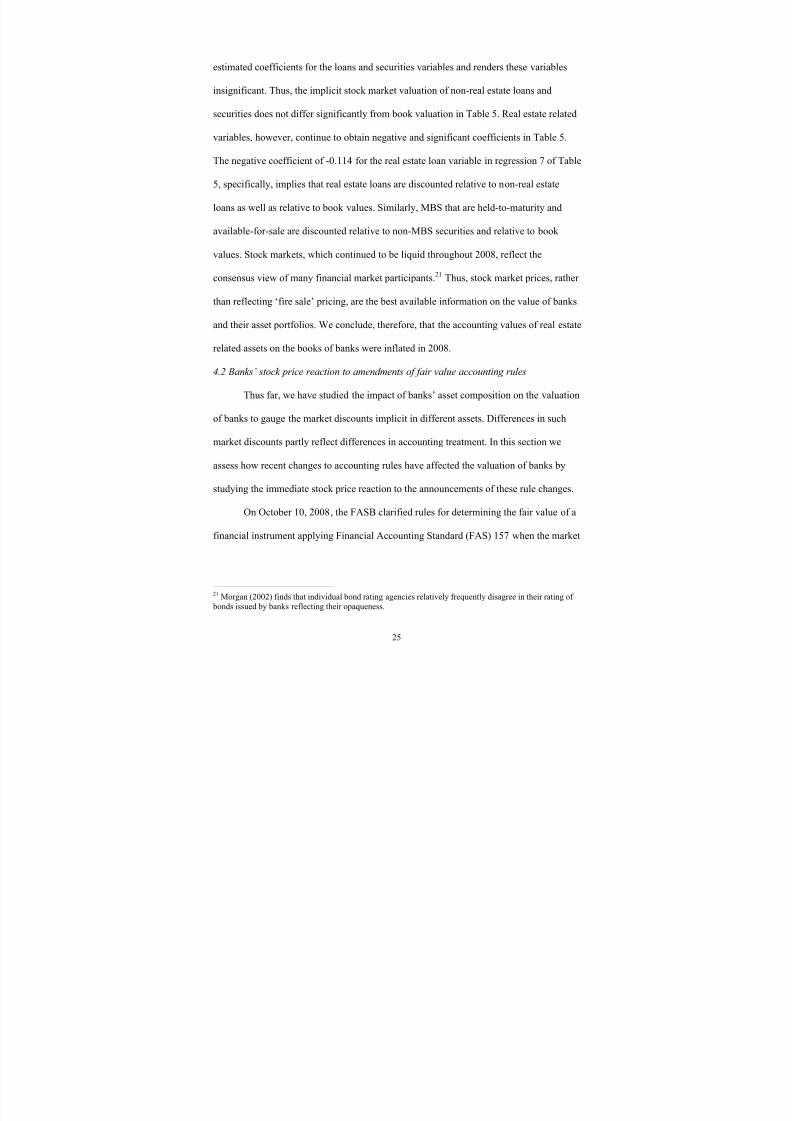
estimated coefficients for the loans and securities variables and renders these variables
insignificant. Thus, the implicit stock market valuation of non-real estate loans and
securities does not differ significantly from book valuation in Table 5. Real estate related
variables, however, continue to obtain negative and significant coefficients in Table 5.
The negative coefficient of -0.114 for the real estate loan variable in regression 7 of Table
5, specifically, implies that real estate loans are discounted relative to non-real estate
loans as well as relative to book values. Similarly, MBS that are held-to-maturity and
available-for-sale are discounted relative to non-MBS securities and relative to book
values. Stock markets, which continued to be liquid throughout 2008, reflect the
consensus view of many financial market participants.21 Thus, stock market prices, rather
than reflecting ‘fire sale’ pricing, are the best available information on the value of banks
and their asset portfolios. We conclude, therefore, that the accounting values of real estate
related assets on the books of banks were inflated in 2008.
4.2 Banks’ stock price reaction to amendments of fair value accounting rules
Thus far, we have studied the impact of banks’ asset composition on the valuation
of banks to gauge the market discounts implicit in different assets. Differences in such
market discounts partly reflect differences in accounting treatment. In this section we
assess how recent changes to accounting rules have affected the valuation of banks by
studying the immediate stock price reaction to the announcements of these rule changes.
On October 10, 2008, the FASB clarified rules for determining the fair value of a
financial instrument applying Financial Accounting Standard (FAS) 157 when the market
21 Morgan (2002) finds that individual bond rating agencies relatively frequently disagree in their rating of bonds issued by banks reflecting their opaqueness.
25
8/7/2019 acc discretion of bank during fin crisis
http://slidepdf.com/reader/full/acc-discretion-of-bank-during-fin-crisis 27/59
for that financial asset is not active.22 The clarification made explicit that the use of a
bank’s own assumptions about future cash flows and appropriately risk-adjusted discount
rates is acceptable when relevant observable inputs into value calculation are not
available. Also, it was made clear that broker (or pricing service) quotes may be
appropriate input when measuring fair value.23 These announced interpretations of FAS
157 were seen to provide banks with more discretion in determining the fair value of
securities and to enable them to limit mark-downs in the face of illiquid securities
markets during the U.S. mortgage default crisis.
Subsequently, on April 9, 2009 the FASB approved amendments to FAS 157 that
give banks more discretion in using non-market information to determine fair values of
securities.24In practice, firms will be allowed to re-classify level 2 assets, which were
previously valued using proxy reference market prices, to level 3 assets, whose valuation
is model-based.25 By providing greater flexibility in excluding illiquid transactions from
level 2 fair value determination, the new rules effectively expand the scope for firms to
prevent significant mark-downs in illiquid markets subject to great price declines, and
possibly to mark-up assets that had been aggressively written down previously.26 Both
22 These rules, issued under Final Staff Position on FAS 157-3, were effective upon issuance, includingprior periods for which financial statements have not been issued. 23 The Office of the Chief Accountant of the U.S. Securities and Exchange Commission (SEC) and theFASB staff had already jointly issued a press release on September 30, 2008, that addresses similar application issues of FAS 157. See http://www.fasb.org/news/2008-FairValue.pdf for further details.24
The changes became effective for financial statements ending June 2009, with early adoption permittedfor first-quarter 2009 results.25 See http://www.fasb.org/news/nr040909.shtml for further details.26 On the same day, new accounting rules were announced that will reduce the level of losses to bedisclosed in firms’ income statements for available-for-sale and held-to-maturity debt securities. Under theold rules, provided the firm had the “intent and ability to hold” the security until recovery, “other-than-temporary” impairment would need to be recognized in the income statement. Under the new rules,provided the firm “does not have the intent to sell” the security, it only needs to recognize the creditcomponent of the other-than-temporary impairment in income, while recording the remaining portion in aspecial category of equity (“other comprehensive income”). The change from “intent and ability to hold” to
26
8/7/2019 acc discretion of bank during fin crisis
http://slidepdf.com/reader/full/acc-discretion-of-bank-during-fin-crisis 28/59
the October 2008 and April 2009 announcements of the FASB were seen by mark
commentators as efforts to artificially prop up the accounting value of banks.
et
In this section, we use a standard event study methodology to compute the
average price effect on bank shares of these announcements of changes in accounting
rules. Also, we assess whether the share prices of different types of banks reacted
differently to these announcements. In particular, we examine whether abnormal returns
vary by bank size, Tobin’s q, and the degree to which banks hold MBS. We use a
standard market model to estimate abnormal returns.
Table 6 reports the event study results for the October 10, 2008 announcement.
Cumulative abnormal returns are based on a market model with estimation window of [t-
250, t-30], where t denotes October 10, 2008, and time is counted in trading days. We use
the total return on the S&P 500 as proxy for the daily market return. We report results for
two different event windows. Panel A reports results using an event window of (t-3, t+2],
where t denotes October 10, 2008, and time is counted in trading days, while Panel B
reports results using an event window of (t-1, t]. Using such a short event window of a
single day is acceptable given the high stock market volatility around the time of this
event, culminating in a stock market crash. To mitigate concerns that returns from illiquid
firms are driving the result, we exclude from the sample observations from firms with
more than 100 zero returns over the estimation window or a zero return on the event date.
Average cumulative abnormal returns are reported both for the full sample of
banks and for different subsamples of banks, with sample splits based on a host of bank
characteristics, specifically bank size, Tobin’s q, and the degree to which banks hold
“no intention to sell” may provide sufficient flexibility to significantly reduce the level of total impairment,of which only the credit component is deducted from income.
27

8/7/2019 acc discretion of bank during fin crisis
http://slidepdf.com/reader/full/acc-discretion-of-bank-during-fin-crisis 29/59
MBS. The sample splits are as follows: Large (small) denotes firms with total assets
above (below) the quarterly sample median; High (Low) q denotes firms with Tobin’s q
above (below) the quarterly sample median; and High (Low) share of MBS denotes firms
with MBS as a fraction of total assets above (below) the quarterly sample median. We
use third quarter 2008 Call report data to construct these bank-specific variables, while
daily total return data on equities are obtained from Datastream.
Table 7 reports event study results for the second event on April 9, 2009. Again,
we report results separately for two different event windows in Panels A and B. To avoid
valuation effects arising from events that occurred during the period following the
announcement of the first event, including the first event itself, from biasing the market
model induced estimates of normal returns, we apply the same estimation window as
used in the first event study to estimate normal returns.
The cumulative abnormal returns (CAR) are large on the event day itself for both
events but in the case of the first event, the average CAR across all banks is much lower
and barely significant if we extend the event window. The reason is that October 10, 2008
was the only day that week during which the stock market experienced positive returns in
what otherwise was a rapidly falling market, in which the prices of bank stocks were
falling more sharply than those of non-bank stocks.
The sample splits reveal a number of interesting differences in the valuation effect
across different types of banks. The CAR of large banks is consistently higher and
economically large. One explanation for this result is that larger U.S. banks tend to have a
larger fraction of hard-to-value assets, including off-balance sheet, and thus tend to
benefit most from the changes in accounting rules.
28
8/7/2019 acc discretion of bank during fin crisis
http://slidepdf.com/reader/full/acc-discretion-of-bank-during-fin-crisis 30/59
In terms of valuation, the results are ambiguous. The share price of banks with
above-median Tobin’s q reacted favorably to the October 10, 2008 event but we do not
find such effect for the April 9, 2009 event. The impact of this type of news on banks
with low or high Tobin’s q is theoretically ambiguous. If banks have low Tobin’s q on
account of high impaired real estate exposure (rather than high impaired MBS exposure),
then the banks stand to gain little from an accounting change that primarily benefits
banks with large exposure to MBS. This could explain the results on October 10, 2008.
However, if banks have low Tobin’s q on account of high exposure to impaired MBS,
then they may benefit more from good news related to MBS simply because they have
more of such assets, and we expect their share price to react more favorably. This can
explain the results on April 9, 2009, as then banks with low Tobin’s q do slightly better,
though the difference is not statistically significant. We know from results presented in
the previous section of this paper that discounts in share prices on account of MBS only
arose in 2008. An increase in the discount of MBS relative to that of real estate loans
between October 2008 and April 2009 could explain the ambiguous impact of Tobin’s q.
Finally, we find that the share price of banks with a large fraction of MBS react
favorably to the relaxation of fair value accounting, at least for the October 10, 2008
event, as expected.
Overall, we find that the valuation of large banks and banks with a large fraction
of MBS gains relatively much on account of both announcements. This can be explained
by the fact that these banks have relatively many assets such as MBS that are affected by
more lenient rules regarding the calculation of their fair value.
29
8/7/2019 acc discretion of bank during fin crisis
http://slidepdf.com/reader/full/acc-discretion-of-bank-during-fin-crisis 31/59
5. Accounting discretion on impaired assets and asset classification
In this section, we assess the relevance of banks’ discretion in accounting for bad loans
and in classifying MBS into categories that render more favorable accounting values.
Together with the valuation results presented in section 4, these results shed light on the
reliability of banks’ financial statements, and in particular on the extent to which book
values of banks’ assets accurately account for future asset impairment.
5.1 Accounting discretion on accounting for bad loans
The relative importance of real estate assets in the average bank’s portfolio
renders bank capital very sensitive to the performance of real estate loans. In case of
expected future loan losses, a bank needs to provision for these losses. Provisioning for
loan losses, however, reduces income and regulatory capital. Thus, distressed banks may
be tempted to provision relatively less for real estate loans or any other loans in an
attempt to overstate capital.27
In this subsection, we report regressions that test whether distressed banks report
relatively low loan loss provisions. To capture loan loss provisioning, we construct the
ratio of loan loss provisions to total loans.28 We obtain data on loan charge-offs and
provisions from Schedule HI-B of the Call report files.
In regression 1 of Table 8, the loan loss provisioning variable is first related to the
share of real estate loans in total loans. We expect loan loss provisioning to be positively
related to the share of real estate loans, as these loans have been particularly affected by
27 Previously, Moyer (1990) and Ahmed et al. (1999) have found that banks use their discretion regardingloan loss provisioning to manage their capital. Docking et al. (1997) consider the information andcontagion effects of bank loan loss reserve announcements.28 No breakdown of loan loss provisioning for real estate loans and other loan categories is available frombanks’ Call reports.
30
8/7/2019 acc discretion of bank during fin crisis
http://slidepdf.com/reader/full/acc-discretion-of-bank-during-fin-crisis 32/59
recent house price declines. The share of real estate loans indeed enters the regression
with a positive coefficient, but it is statistically insignificant.
Banks that need to absorb large losses arising from exposure to MBS may lower
their provisioning standards in an effort to preserve capital. As a proxy for potential
losses arising from exposure to MBS, we use the ratio of MBS to assets denoted MBS.
This exposure variable obtains a negative coefficient of -0.015 that is statistically
significant at the 5% level, suggesting that banks with large MBS exposure tend to
attenuate reported loan loss provisions.
Regressions 2 and 3 re-estimate regression 1 for the samples of banks with below-
median and above-median q, respectively. Regression 2 confirms a negative and
statistically significant coefficient for the MBS variable, while the coefficient for the
MBS variable is negative but insignificant in regression 3. Thus, low-q banks appear to
be the ones that compensate for their MBS exposure by scaling back their loan loss
provisioning.
Distressed banks also may be slow in recognizing losses on their real estate loan
portfolio in the form of write-downs29 or charge-offs.30 To analyze this, regressions 4 to
6 in the table take as the dependent variable the ratio of net charge-offs to loans (where
net charge-offs are the difference between charge-offs and recoveries). Otherwi
regressions 4 to 6 are similar to regressions 1 to 3. Consistent with the earlier results, we
now find that the ratio of net charge-offs to loans is negatively related to the MBS
variable, though the effect is not statistically significant.
se,
29 Loan writedowns include writedowns arising from transfers of loans to a held-for-sale account.30 Loan charge-offs reduce allowances for loan losses rather than bank capital if previous loan loss
provisions were made. In any case, charge-offs may trigger further loan loss provisioning which reducesregulatory capital.
31
8/7/2019 acc discretion of bank during fin crisis
http://slidepdf.com/reader/full/acc-discretion-of-bank-during-fin-crisis 33/59
In sum, we find evidence that low-valuation banks with large MBS exposures are
found to hold back on their loan loss provisioning.
5.2 Classification of mortgage-backed securities
According to FAS 159, banks have the option to classify securities as held-to-
maturity or available-for-sale. Securities are to be classified as held-to-maturity and
carried at amortized cost, if management has the intention to hold them until maturity.
Otherwise, securities are available-for-sale and carried at fair value. This classification is
to be made on the date of purchase of the security and it is in principle irreversible. On
the purchase date, amortized cost and fair value should be essentially the same and hence
no valuation advantage can be obtained by classifying securities either way.31
Reclassification of previously acquired securities potentially does affect the
overall book value of securities. Specifically, overall book value rises if available-for-sale
securities are reclassified as held-to-maturity at a time when amortized cost exceeds fair
value. In 2008, the mean ratio of fair value to amortized cost for non-guaranteed MBS
was 0.927, against a mean ratio of fair value to amortized cost for guaranteed MBS of
1.005. These accounting valuations gave banks an incentive to classify non-guaranteed
MBS as held-to-maturity to the extent possible. In this section, we examine whether
banks, and especially distressed banks, responded to this incentive by classifying a larger
fraction of their MBS as held-to-maturity.
Table 9 reports regressions of the shares of MBS that are held-to-maturity for
guaranteed as well as non-guaranteed securities. In the calculation of these shares, the
MBS that are actually available-for-sale are also valued at amortized cost. The number of
31 A consideration guiding this classification at the time of securities acquisition can be to obtain an
appropriate mix of assets and liabilities that are carried at fair value.
32
8/7/2019 acc discretion of bank during fin crisis
http://slidepdf.com/reader/full/acc-discretion-of-bank-during-fin-crisis 34/59
observations differs depending on whether the dependent variable is computed for
guaranteed or non-guaranteed securities because a significant fraction of banks reports
not to have any non-guaranteed MBS. The fraction of MBS that is held-to-maturity
increases from 7.5% at end-2007 to 11.7% at end-2008, consistent with the notion that
banks had incentives during the year 2008 to classify a larger fraction of their MBS as
held-to-maturity.
The regression 1 results indicate that the share of guaranteed MBS classified as
held-to-maturity is positively but insignificantly related to both the real estate loans and
the overall MBS (valued at amortized cost) to assets variables. In regression 2, we see
that the non-guaranteed share of MBS that is held-to-maturity is positively and
insignificantly related to the MBS, amortized cost variable but positively and
significantly to the real estate loans variable with a coefficient of 0.731.
Thus, we find evidence that banks pressured by real estate exposure tend to report
a relatively large share of non-guaranteed MBS as held-to-maturity, and that this effect
operated chiefly through exposure to real estate loans rather than MBS.
Regressions 3 and 4 differ from regressions 1 and 2 in that we include the Low
valuation variable as an additional variable to assess differences in the classification of
MBS between banks with high or low q. The Low valuation variables enters both
regressions with a positive but insignificant coefficient, indicating that there is no
significant difference between high and low valuation banks in the fraction of non-
guaranteed MBS that they report as held-to-maturity.
Finally, regressions 5 and 6 differ from regressions 3 and 4 in that we include
interaction terms of the real estate exposure variables and the Low valuation variable.
33
8/7/2019 acc discretion of bank during fin crisis
http://slidepdf.com/reader/full/acc-discretion-of-bank-during-fin-crisis 35/59
Positive estimated coefficients imply that especially banks with below-average q report a
larger share of their MBS as held-to-maturity in response to large real estate exposures.
Indeed, the interaction terms in regressions 5 and 6 all enter with positive estimated
coefficients, although the coefficients are statistically significant only for the interaction
with the MBS variable in regression 6. This suggests that banks with below-average q
increase the share of non-guaranteed MBS that is held-to-maturity to a relatively large
extent in response to real estate exposures. This is to be expected as the gains in terms of
the book value of assets are relatively large in the case of non-guaranteed MBS, as for
these securities the ratio of fair value to amortized cost was relatively low in 2008.
Next, we examine whether banks have also exploited discretion in the
classification of their MBS with a view to boost the accounting value of their assets prior
to 2008. To do this, we re-estimate regression 4 of Table 9 with data for each of the years
in the period 2001-2007. A focus on non-guaranteed MBS is justified, as the ratio of fair
value to amortized cost of these MBS deviates relatively frequently from unity as seen in
Figure 4. In 2001, for instance, fair values of non-guaranteed MBS tended to exceed
amortized cost. The results are presented in Table 10.
The MBS, amortized variable enters the regressions in Table 10 with either
negative or positive coefficient, depending on the year, although none of these estimated
coefficients is statistically significantly different from zero.
The real estate loan variable enters the regressions in Table 10 with positive
coefficients that are significant at the 5% level from the year 2005 onwards, suggesting
that banks with large real estate exposure classified a larger fraction of their non-
34
8/7/2019 acc discretion of bank during fin crisis
http://slidepdf.com/reader/full/acc-discretion-of-bank-during-fin-crisis 36/59
guaranteed MBS as held-to-maturity. Over the 2002-2008 period, the real estate loans
variable increases in a non-monotonic way from 0.137 to 0.457.
Turning to the Low valuation variable, we find that this variable enters with
positive but insignificant coefficients for the years 2001 through 2004 that turn negative
from the year 2005 onwards. Overall, the results for the period 2001-2007 confirm that
also prior to 2008 banks classified their non-guaranteed MBS with a view to boasting the
book value of these assets.
6. Conclusions
In 2008, the majority of U.S. banks were zombie banks as evidenced by market
values of bank assets being lower than their book values. This is prima facie evidence
that the book value of banks’ balance sheets is inflated. In this paper, we find that the
stock market attaches less value to real estate loans and MBS than their accounting
values. This discrepancy between the accounting and market value of bank assets
suggests that banks have been slow to adjust the book value of their assets to conform to
market expectations about future declines in asset values.
We further find a relatively high discount for MBS that are held-to-maturity (and
carried at amortized cost) relative to MBS that are available-for-sale (and carried at fair
value). This suggests that fair values recognize the impairment of MBS to a greater extent
than amortized costs do.
Share values of distressed banks, as indicated by a below-average Tobin’s q, are
reduced relatively little by exposures to real-estate related assets. This suggests that low-
valuation banks with large real-estate related exposure derive relatively large benefits
35
8/7/2019 acc discretion of bank during fin crisis
http://slidepdf.com/reader/full/acc-discretion-of-bank-during-fin-crisis 37/59
from the financial safety net, for instance in the form of access of cheap public loans and
other capital, to offset asset impairment.
We estimate valuations implicit in bank share prices for a range of bank liabilities
and off-balance sheet items as well. Bank share prices are found to negatively reflect
bank funding in the form of large and short-term deposits. This may reflect that
‘wholesale’ funding of this type exposes the bank to considerable funding risks. Bank
share prices are further found to be affected by off-balance sheet items such as credit
insurance bought and sold, as well as credit commitments to own and other financial
institutions’ securitization structures.
A major concern has been that fair value accounting of bank assets has procyclical
implications for credit supply with credit expanding at a time of rising asset prices and
contracting when asset prices fall (see IMF, 2009, and Heaton et al., 2009).
Procyclicality can arise when higher asset prices lead to the recognition of gains on bank
assets, augmenting bank capital and rendering further credit expansion possible. In this
paper, we do not directly address this issue as we do not examine the variability of
amortized costs versus fair values over a typical asset boom and bust cycle. However, we
find that at a time of depressed asset prices such as in 2008, one year into the U.S.
mortgage crisis, the stock market applies discounts to banks that are larger than those
implicit in the fair values of MBS. This suggests that fair value accounting, as currently
implemented, is still less procyclical than any accounting based exclusively on stock
market valuations would be.32
32 At any rate, in our view the main task of accounting systems is to provide reliable information, and thisgoal should not be compromised by concerns about any procyclicality of credit supply. A common view isthat bank regulation should target any undesirable credit procyclicality directly, for instance by prescribing
36
8/7/2019 acc discretion of bank during fin crisis
http://slidepdf.com/reader/full/acc-discretion-of-bank-during-fin-crisis 38/59
In October 2008 and April 2009, the FASB announced sets of accounting rule
amendments providing banks with additional discretion in the determination of fair value
of securities in case markets are illiquid and transaction prices may result from ‘fire
sales’. On both occasions, banks with large exposures to MBS are found to have
experienced relatively large excess returns. Additional discretion in the determination of
fair values in an environment of depressed asset prices makes it easier for banks with
large affected exposures to maintain accounting solvency, which is apparently cheered by
bank equity investors.
This paper further demonstrates that banks with large exposures to MBS
systematically use their accounting discretion so as to inflate asset values and book
capital. Specifically, banks with large exposure to MBS are found to report relatively low
loan loss provisioning rates and loan charge-off rates, and at the same time they tend to
classify a relatively large share of their MBS as held-to-maturity, to be able to carry these
assets at amortized costs.
Our finding that distressed banks tend to exploit their discretion in loan loss
provisioning, loan charge-offs, and classification of MBS to boost their accounting value
should be reason for concern, as it implies that the discretion implicit in current
accounting rules lead to systematic biases in valuations on bank balance sheets.
Accounting discretion enables banks with impaired asset portfolios to satisfy capital
adequacy requirements, but it makes it difficult to assess the true health of the affected
banks. Replacing accounting discretion by more rules-based accounting could serve to
improve the information value of public accounts. Banks could be required, for instance,
cyclical capital requirements (for a more detailed discussion of this debate, see Laeven and Majnoni, 2003,Kashyap and Stein, 2004, and Repullo and Suarez, 2008).
37

8/7/2019 acc discretion of bank during fin crisis
http://slidepdf.com/reader/full/acc-discretion-of-bank-during-fin-crisis 39/59
to carry all their MBS at fair value, obviating incentives to reclassify MBS between
different categories. Similarly, a more rules-based approach to provisioning for bad loans
could mitigate incentives for banks to use current discretion on loan loss provisioning
rates to inflate the book value of assets and capital during economic downturns. The
debate about the pros and cons of fair value accounting will likely go on for a while,
although historical cost accounting is unlikely to be the remedy, as fair values are
potentially more informative, even if fair value calculations themselves are also subject to
discretion by banks.
38

8/7/2019 acc discretion of bank during fin crisis
http://slidepdf.com/reader/full/acc-discretion-of-bank-during-fin-crisis 40/59
References
Adrian, Tobias and Hyun S. Shin, 2008, Liquidity and leverage, Journal of Financial Intermediation, forthcoming.
Ahmed, Anwer S. and Carolyn Takeda and Shawn Thomas, 1999, Bank loan lossprovisions: a reexamination of capital management, earnings management and signalingeffect, Journal of Accounting and Economics 28, 1-25.
Allen, Franklin and Elena Carletti, 2008, Mark-to-market accounting and liquiditypricing, Journal of Accounting and Economics 45, 358-378.
Barth, James R., Gerard Caprio, and Ross Levine. 2006. Rethinking Bank Regulation.Cambridge: Cambridge University Press.
Barth, Mary E., William H. Beaver and Wayne R. Landsman, 1996, Value-relevance of
banks’ fair value disclosures under SFAS No. 107, Accounting review, 513-537.
Barth, Mary E., William H. Beaver and Wayne R. Landsman, 2001, The relevance of thevalue relevance literature for financial accounting standard setting: another view, Journal of Accounting and Economics 31, 77-104.
Berger, Allen, Sally M. Davies, and Mark J. Flannery, 2000, Comparing market andregulatory assessments of bank performance: who knows what when? Journal of Money,Credit and Banking 32(3), 641-667.
Bongini, P., L. Laeven, and G. Majnoni. 2002. How good is the market at assessing bank fragility? A horse race between different indicators, Journal of Banking and Finance26,1011–28.
Brown, Craig O., and I. Serdar Dinc, 2005, The politics of bank failures: evidence fromemerging markets. Quarterly Journal of Economics 120(4), 1413-1444.
Brown, Craig O., and I. Serdar Dinc, 2009, Too many to fail? Evidence of regulatoryforbearance when the banking sector is weak. Review of Financial Studies, forthcoming.
Boudoukh, Jacob, Matthew Richardson, Richard Stanton, and Robert F. Whitelaw, 1997,Pricing mortgage-backed securities in a multifactor interest rate environment: amultivariate density estimation approach, Review of Financial Studies 10, 405-446.
Caballero, Ricardo, Takeo Hoshi, and Anil K. Kashyap, 2008, Zombie lending anddepressed restructuring in Japan, American Economic Review 98, 1943-1977.
Collins, Julie H., Douglas A. Shackelford, and James M. Wahlen, 1995, Bank differencesin the coordination of regulatory capital, earnings, and taxes, Journal of Accounting Research 33(2), 263-291.
39

8/7/2019 acc discretion of bank during fin crisis
http://slidepdf.com/reader/full/acc-discretion-of-bank-during-fin-crisis 41/59
Dell’Ariccia, Giovanni, Deniz Igan, and Luc Laeven, 2008, Credit booms and lendingstandards: Evidence from the subprime mortgage market, mimeo, International MonetaryFund.
Demyanyk, Yuliya, and Otto Van Hemert, 2008, Understanding the subprime mortgagecrisis, Review of Financial Studies, forthcoming.
DeYoung, Robert and Chiwon Yom, 2008, On the independence of assets and liabilities:Evidence from U.S. commercial banks, 1990-2005, Journal of Financial Stability 4, 275-303.
Docking, Diane Scott, Mark Hirschey and Elaine Jones, 1997, Information and contagioneffects of bank loan-loss reserve announcements, Journal of Financial Economics 43,219-239.
Dunn, Kenneth B. and Kenneth J. Singleton, 1983, An empirical analysis of the pricing of mortgage-backed securities, Journal of Finance 38, 613-623.
Eccher, Elizabeth A., K. Ramesh and S. Ramu Thiagarajan, 1996, Fair value disclosuresby bank holding companies, Journal of Accounting and Economics 22, 79-117.
Financial Stability Forum, 2008, Report on Enhancing Market and Institutional Resilience, April 2008. Available at: http://www.financialstabilityboard.org/
Freixas, Xavier and Dimitrios Tsomocos, 2004, Book vs. fair value accounting inbanking, and intertemporal smoothing, Oxford Financial Research Centre working paper.
Fudenberg, Drew and Jean Tirole, 1995, A theory of income and dividend smoothingbased on incumbency rents, Journal of Political Economy 103, 75-93.
Goh, Beng Wee, Jeffrey Ng, and Kevin Ow Yong, 2009, Market pricing of banks’ fair value assets reported under SFAS 157 during the 2008 economic crisis, Mimeo, MIT.
Heaton, Johan, Deborah Lucas, and Robert McDonald, 2009, Is mark-to-markingaccounting destabilizing? An analysis and implications for policy, mimeo, University of Chicago.
Holthausen, Robert W. and Ross L. Watts, 2001, The relevance of the value-relevanceliterature for financial accounting standard setting, Journal of Accounting and Economics 2001, 3-75.
Hutton, Amy P. , Alan J. Marcus, and Hassan Tehranian, 2008, Opaque financial reports,R2, and the distribution of crash risks, Journal of Financial Economics, forthcoming.
40

8/7/2019 acc discretion of bank during fin crisis
http://slidepdf.com/reader/full/acc-discretion-of-bank-during-fin-crisis 42/59
International Monetary Fund, 2008, Global financial stability report. Chapter 3: Fair value accounting and procyclicality. October 2008.
Kane, Edward J., 2003, Continuing dangers of disinformation in corporate accountingreports, Review of Financial Economics 13, 149-164.
Kane, Edward J., 1989, The S&L Insurance Mess: How Did It Happen? Washington, DC:Urban Institute.
Karpoff, Jonathan M., D. Scott Lee, and Gerald S. Martin, 2008, The cost to firms of cooking the books, Journal of Financial and Quantitative Analysis 43, 581–612.
Kashyap, Anil and Jeremy Stein, 2004, Cyclical implications of the Basel II capitalstandards, Federal Reserve Bank of Chicago Economics Perspectivesm 1st quarter, 18-31.
Keys, Benjamin, Tanmoy Mukherjee, Amit Seru, and Vikrant Vig, 2008, Securitization
and screening: evidence from subprime mortgage backed securities, Quarterly Journal of Economics, forthcoming.
Knaup, Martin and Wolf Wagner, 2009, A market-based measure of credit quality andbanks’ performance during the subprime crisis, mimeo, Tilburg University.
Kolev, Kalin, 2009, Do investors perceive marking-to-model as marking-to-myth?Early evidence from FAS 157 disclosure, mimeo, NYU Stern School of Business.
Kroszner, Randall S., and Philip E. Strahan. 1996. Regulatory incentives and the thriftcrisis: dividends, mutual-to-stock conversions, and financial distress. Journal of Finance 51, 1285–1319.
Laeven, Luc and Giovanni Majnoni, 2003, Loan loss provisioning and economicslowdowns: too much, too late, Journal of Financial Intermediation 12, 178-197.
Laeven, Luc and Ross Levine, 2007, Is there a diversification discount in financialconglomerates?, Journal of Financial Economics 85, 331-367.
Landsman, Wayne, 2006, Fair value accounting for financial instruments: someimplications for bank regulation, BIS Working Papers No 209.
Lang, Larry and Rene M. Stulz, 1994, Tobin’s q, Corporate diversification, and firmperformance, Journal of Political Economy 102, 1248-1280.
Laux, Christian and Christian Leuz, 2009, The crisis of fair value accounting: makingsense of the recent debate, mimeo, Goethe University Frankfurt.
Leuz, Christian, D.J. Nanda and Peter Wysocki, 2003, Investor protection and earningsmanagement: an international comparison, Journal of Financial Economics 69, 505-527.
41

8/7/2019 acc discretion of bank during fin crisis
http://slidepdf.com/reader/full/acc-discretion-of-bank-during-fin-crisis 43/59
Leuz, Christian and Peter Wysocki, 2008, Economic consequences of financial reportingand disclosure regulation: a review and suggestions for future research, mimeo, ChicagoUniversity and MIT.
Loutskina, Elena and Philip Strahan, 2009, Securitization and the declining impact of bank finance on loan supply: evidence from mortgage originations, Journal of Finance 64, 861-889.
Mian, Atif, and Amir Sufi, 2008, The consequences of mortgage credit expansion:evidence from the 2007 mortgage default crisis, Quarterly Journal of Economics,forthcoming.
Morgan, Donald P., 2002, Rating banks: risk and uncertainty in an opaque industry,American Economic Review 92, 874-888.
Moyer, Susan E., 1990, Capital adequacy and ratio regulations and accounting choices incommercial banks, Journal of Accounting and Economics 13, 123-154.
Plantin, Guillaume, Haresh Sapra and Hyun S. Shin, 2008, Marking-to-market: panaceaor Pandora’s box?, Journal of Accounting Research 46, 435-460.
Repullo, Rafael and Javier Suarez, 2008, The procyclical effects of Basel II, CEPR Discussion paper No. 6862, CEPR, London.
Sachs, Jeffrey and Harry Huizinga, 1987, U.S. commercial banks and the developingcountry debt crisis, Brookings Papers on Economic Activity 2, 555-606.
Sankar, Mandira R. and K. R. Subramanyam, 2000, Reporting discretion and privateinformation communication through earnings, Journal of Accounting Research 39, 365-386.
Schwartz, Eduardo S. and Walter N. Torous, 1989, Prepayment and the valuation of mortgage-backed securities, Journal of Finance 44, 375-392.
Shackelford, Douglas A., Joel B. Slemrod and James M. Sallee, 2008, A unifying modelof how the tax system and generally accepted accounting principles affect corporatebehavior, mimeo, University of North Carolina at Chapel Hill.
Song, Chang Joon, Wayne Thomas, and Han Yi, 2009, Value relevance of FAS 157 fair value hierarchy information and the impact of corporate governance mechanisms, mimeo,University of Oklahoma.
Trueman, Brett and Sheridan D. Titman, 1988, An explanation for accounting incomesmoothing, Journal of Accounting Research 26, 127-39.
42
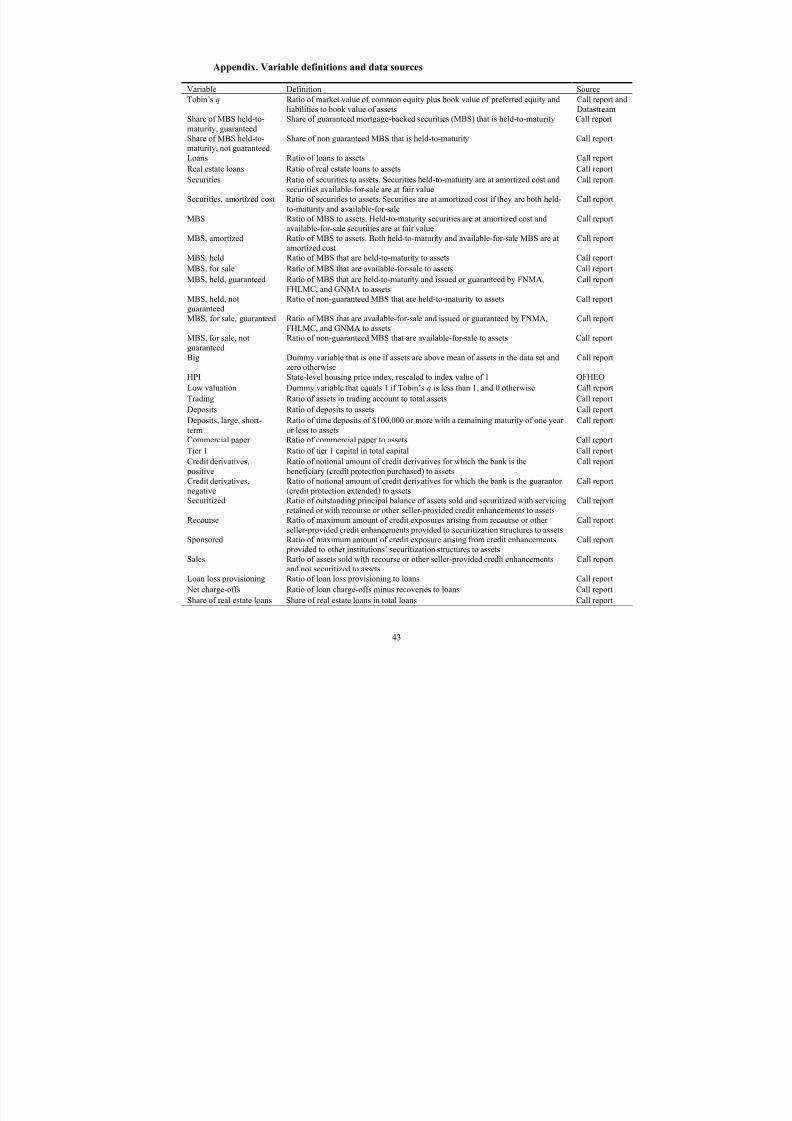
8/7/2019 acc discretion of bank during fin crisis
http://slidepdf.com/reader/full/acc-discretion-of-bank-during-fin-crisis 44/59
Appendix. Variable definitions and data sources
Variable Definition Source
Tobin’s q Ratio of market value of common equity plus book value of preferred equity andliabilities to book value of assets
Call report anDatastream
Share of MBS held-to-
maturity, guaranteed
Share of guaranteed mortgage-backed securities (MBS) that is held-to-maturity Call report
Share of MBS held-to-maturity, not guaranteed
Share of non guaranteed MBS that is held-to-maturity Call report
Loans Ratio of loans to assets Call report
Real estate loans Ratio of real estate loans to assets Call report
Securities Ratio of securities to assets. Securities held-to-maturity are at amortized cost andsecurities available-for-sale are at fair value
Call report
Securities, amortized cost Ratio of securities to assets. Securities are at amortized cost if they are both held-to-maturity and available-for-sale
Call report
MBS Ratio of MBS to assets. Held-to-maturity securities are at amortized cost andavailable-for-sale securities are at fair value
Call report
MBS, amortized Ratio of MBS to assets. Both held-to-maturity and available-for-sale MBS are atamortized cost
Call report
MBS, held Ratio of MBS that are held-to-maturity to assets Call reportMBS, for sale Ratio of MBS that are available-for-sale to assets Call report
MBS, held, guaranteed Ratio of MBS that are held-to-maturity and issued or guaranteed by FNMA,FHLMC, and GNMA to assets
Call report
MBS, held, notguaranteed
Ratio of non-guaranteed MBS that are held-to-maturity to assets Call report
MBS, for sale, guaranteed Ratio of MBS that are available-for-sale and issued or guaranteed by FNMA,FHLMC, and GNMA to assets
Call report
MBS, for sale, notguaranteed
Ratio of non-guaranteed MBS that are available-for-sale to assets Call report
Big Dummy variable that is one if assets are above mean of assets in the data set andzero otherwise
Call report
HPI State-level housing price index, rescaled to index value of 1 OFHEO
Low valuation Dummy variable that equals 1 if Tobin’s q is less than 1, and 0 otherwise Call reportTrading Ratio of assets in trading account to total assets Call report
Deposits Ratio of deposits to assets Call report
Deposits, large, short-term
Ratio of time deposits of $100,000 or more with a remaining maturity of one year or less to assets
Call report
Commercial paper Ratio of commercial paper to assets Call report
Tier 1 Ratio of tier 1 capital in total capital Call report
Credit derivatives,positive
Ratio of notional amount of credit derivatives for which the bank is thebeneficiary (credit protection purchased) to assets
Call report
Credit derivatives,negative
Ratio of notional amount of credit derivatives for which the bank is the guarantor (credit protection extended) to assets
Call report
Securitized Ratio of outstanding principal balance of assets sold and securitized with servicingretained or with recourse or other seller-provided credit enhancements to assets
Call report
Recourse Ratio of maximum amount of credit exposures arising from recourse or other seller-provided credit enhancements provided to securitization structures to assets
Call report
Sponsored Ratio of maximum amount of credit exposure arising from credit enhancementsprovided to other institutions’ securitization structures to assets
Call report
Sales Ratio of assets sold with recourse or other seller-provided credit enhancementsand not securitized to assets
Call report
Loan loss provisioning Ratio of loan loss provisioning to loans Call report
Net charge-offs Ratio of loan charge-offs minus recoveries to loans Call report
Share of real estate loans Share of real estate loans in total loans Call report
43
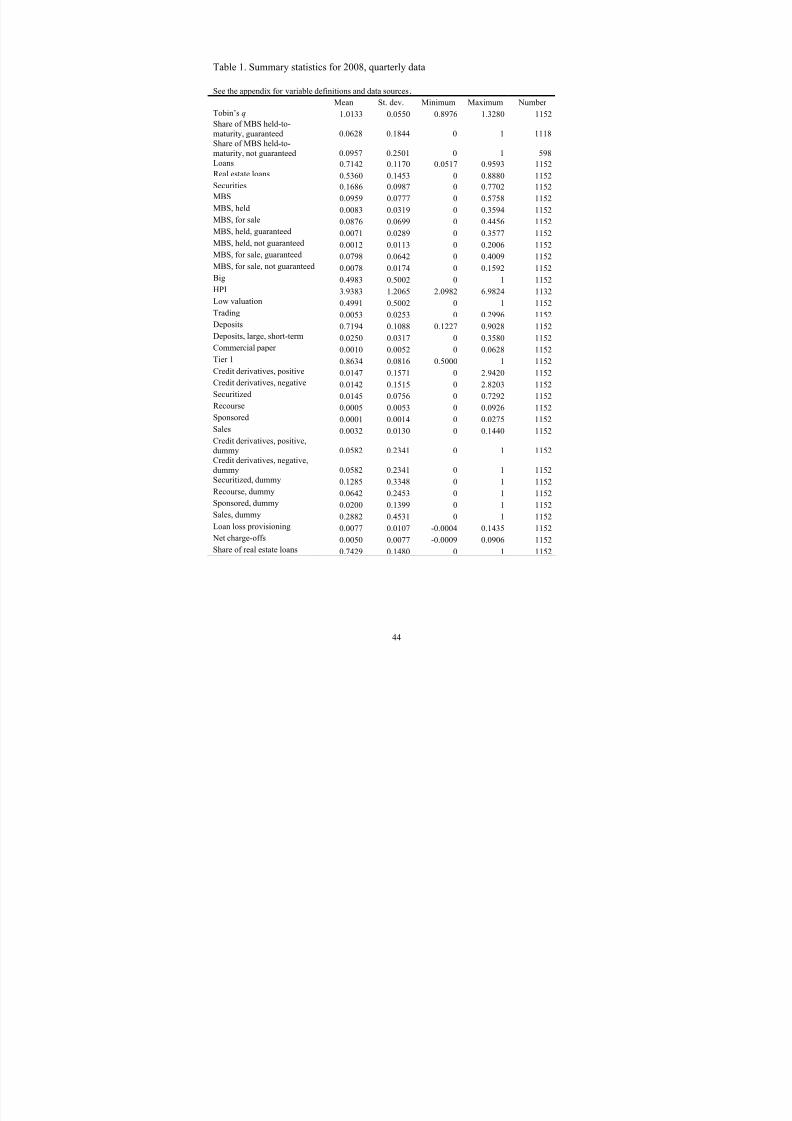
8/7/2019 acc discretion of bank during fin crisis
http://slidepdf.com/reader/full/acc-discretion-of-bank-during-fin-crisis 45/59
44
Table 1. Summary statistics for 2008, quarterly data
See the appendix for variable definitions and data sources.Mean St. dev. Minimum Maximum Number
Tobin’s q 1.0133 0.0550 0.8976 1.3280 1152Share of MBS held-to-maturity, guaranteed 0.0628 0.1844 0 1 1118Share of MBS held-to-maturity, not guaranteed 0.0957 0.2501 0 1 598Loans 0.7142 0.1170 0.0517 0.9593 1152Real estate loans 0.5360 0.1453 0 0.8880 1152Securities 0.1686 0.0987 0 0.7702 1152MBS 0.0959 0.0777 0 0.5758 1152MBS, held 0.0083 0.0319 0 0.3594 1152MBS, for sale 0.0876 0.0699 0 0.4456 1152MBS, held, guaranteed 0.0071 0.0289 0 0.3577 1152MBS, held, not guaranteed 0.0012 0.0113 0 0.2006 1152MBS, for sale, guaranteed
0.0798 0.0642 0 0.4009 1152MBS, for sale, not guaranteed 0.0078 0.0174 0 0.1592 1152Big 0.4983 0.5002 0 1 1152HPI 3.9383 1.2065 2.0982 6.9824 1132Low valuation 0.4991 0.5002 0 1 1152Trading 0.0053 0.0253 0 0.2996 1152Deposits 0.7194 0.1088 0.1227 0.9028 1152Deposits, large, short-term 0.0250 0.0317 0 0.3580 1152Commercial paper 0.0010 0.0052 0 0.0628 1152Tier 1 0.8634 0.0816 0.5000 1 1152Credit derivatives, positive 0.0147 0.1571 0 2.9420 1152Credit derivatives, negative
0.0142 0.1515 0 2.8203 1152Securitized 0.0145 0.0756 0 0.7292 1152Recourse 0.0005 0.0053 0 0.0926 1152Sponsored 0.0001 0.0014 0 0.0275 1152Sales 0.0032 0.0130 0 0.1440 1152Credit derivatives, positive,dummy 0.0582 0.2341 0 1 1152Credit derivatives, negative,dummy 0.0582 0.2341 0 1 1152Securitized, dummy 0.1285 0.3348 0 1 1152Recourse, dummy 0.0642 0.2453 0 1 1152Sponsored, dummy 0.0200 0.1399 0 1 1152
Sales, dummy 0.2882 0.4531 0 1 1152Loan loss provisioning 0.0077 0.0107 -0.0004 0.1435 1152Net charge-offs 0.0050 0.0077 -0.0009 0.0906 1152Share of real estate loans 0.7429 0.1480 0 1 1152
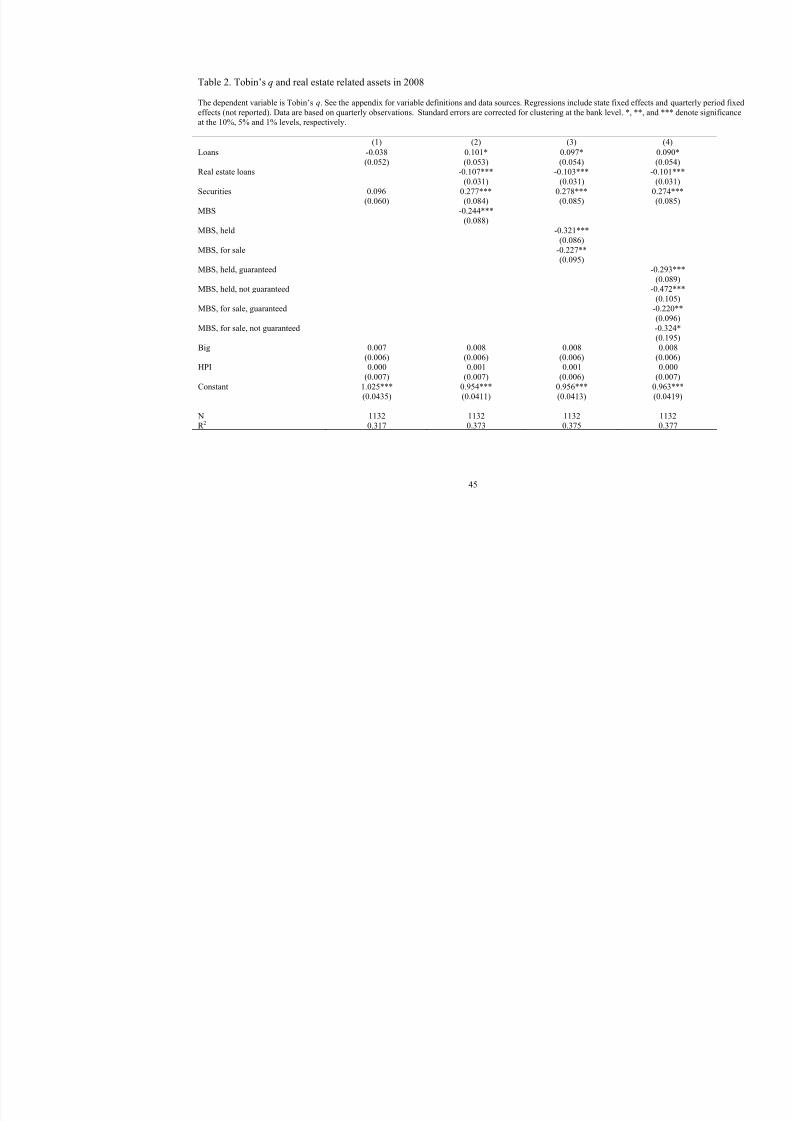
8/7/2019 acc discretion of bank during fin crisis
http://slidepdf.com/reader/full/acc-discretion-of-bank-during-fin-crisis 46/59
Table 2. Tobin’s q and real estate related assets in 2008
The dependent variable is Tobin’s q. See the appendix for variable definitions and data sources. Regressions include state fixeeffects (not reported). Data are based on quarterly observations. Standard errors are corrected for clustering at the bank levelat the 10%, 5% and 1% levels, respectively.
(1) (2) (3)
Loans -0.038 0.101* 0.097* (0.052) (0.053) (0.054)
Real estate loans -0.107*** -0.103*** (0.031) (0.031)
Securities 0.096 0.277*** 0.278*** (0.060) (0.084) (0.085)
MBS -0.244***(0.088)
MBS, held -0.321***(0.086)
MBS, for sale -0.227**
(0.095)MBS, held, guaranteed
MBS, held, not guaranteed
MBS, for sale, guaranteed
MBS, for sale, not guaranteed
Big 0.007 0.008 0.008 (0.006) (0.006) (0.006)
HPI 0.000 0.001 0.001 (0.007) (0.007) (0.006)
Constant 1.025*** 0.954*** 0.956*** (0.0435) (0.0411) (0.0413)
N 1132 1132 1132 R 2 0.317 0.373 0.375
45
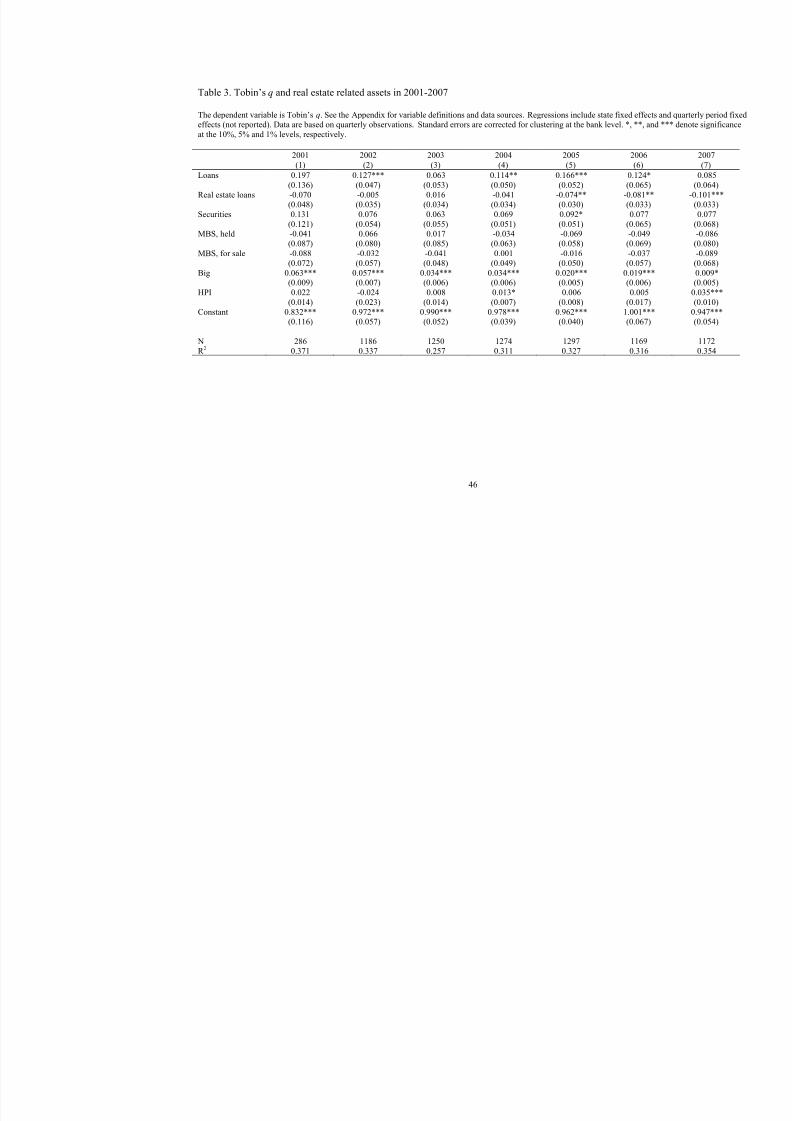
8/7/2019 acc discretion of bank during fin crisis
http://slidepdf.com/reader/full/acc-discretion-of-bank-during-fin-crisis 47/59
Table 3. Tobin’s q and real estate related assets in 2001-2007
The dependent variable is Tobin’s q. See the Appendix for variable definitions and data sources. Regressions include state fixeffects (not reported). Data are based on quarterly observations. Standard errors are corrected for clustering at the bank levelat the 10%, 5% and 1% levels, respectively.
2001 2002 2003 2004 2005 (1) (2) (3) (4) (5)
Loans 0.197 0.127*** 0.063 0.114** 0.166*** (0.136) (0.047) (0.053) (0.050) (0.052)
Real estate loans -0.070 -0.005 0.016 -0.041 -0.074** (0.048) (0.035) (0.034) (0.034) (0.030)
Securities 0.131 0.076 0.063 0.069 0.092* (0.121) (0.054) (0.055) (0.051) (0.051)
MBS, held -0.041 0.066 0.017 -0.034 -0.069 (0.087) (0.080) (0.085) (0.063) (0.058)
MBS, for sale -0.088 -0.032 -0.041 0.001 -0.016 (0.072) (0.057) (0.048) (0.049) (0.050)
Big 0.063*** 0.057*** 0.034*** 0.034*** 0.020*** (0.009) (0.007) (0.006) (0.006) (0.005)
HPI 0.022 -0.024 0.008 0.013* 0.006 (0.014) (0.023) (0.014) (0.007) (0.008)
Constant 0.832*** 0.972*** 0.990*** 0.978*** 0.962*** (0.116) (0.057) (0.052) (0.039) (0.040)
N 286 1186 1250 1274 1297R 2 0.371 0.337 0.257 0.311 0.327
46
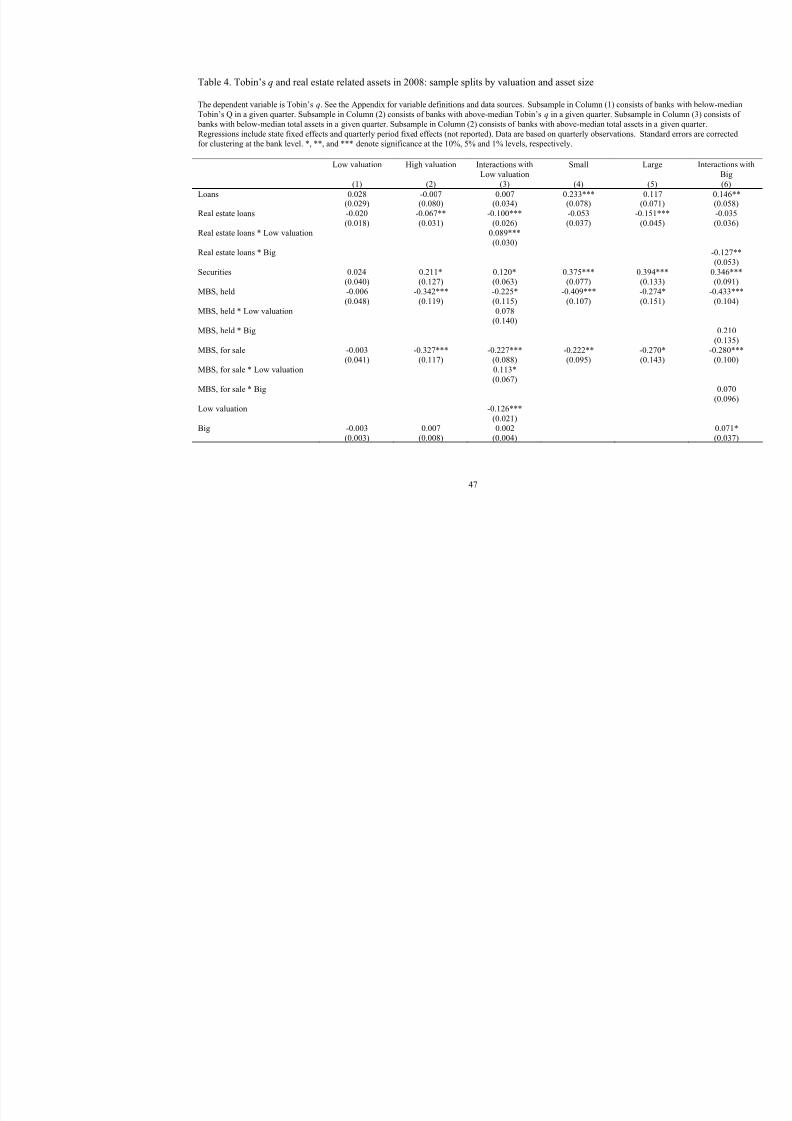
8/7/2019 acc discretion of bank during fin crisis
http://slidepdf.com/reader/full/acc-discretion-of-bank-during-fin-crisis 48/59
Table 4. Tobin’s q and real estate related assets in 2008: sample splits by valuation and asset size
The dependent variable is Tobin’s q. See the Appendix for variable definitions and data sources. Subsample in Column (1) coTobin’s Q in a given quarter. Subsample in Column (2) consists of banks with above-median Tobin’s q in a given quarter. Subanks with below-median total assets in a given quarter. Subsample in Column (2) consists of banks with above-median totalRegressions include state fixed effects and quarterly period fixed effects (not reported). Data are based on quarterly observatifor clustering at the bank level. *, **, and *** denote significance at the 10%, 5% and 1% levels, respectively.
Low valuation High valuation Interactions withLow valuation
Small
(1) (2) (3) (4)
Loans 0.028 -0.007 0.007 0.233*** (0.029) (0.080) (0.034) (0.078)
Real estate loans -0.020 -0.067** -0.100*** -0.053 (0.018) (0.031) (0.026) (0.037)
Real estate loans * Low valuation 0.089***(0.030)
Real estate loans * Big
Securities 0.024 0.211* 0.120* 0.375*** (0.040) (0.127) (0.063) (0.077)
MBS, held -0.006 -0.342*** -0.225* -0.409*** (0.048) (0.119) (0.115) (0.107)
MBS, held * Low valuation 0.078(0.140)
MBS, held * Big
MBS, for sale -0.003 -0.327*** -0.227*** -0.222** (0.041) (0.117) (0.088) (0.095)
MBS, for sale * Low valuation 0.113*(0.067)
MBS, for sale * Big
Low valuation -0.126***(0.021)
Big -0.003 0.007 0.002 (0.003) (0.008) (0.004)
47

8/7/2019 acc discretion of bank during fin crisis
http://slidepdf.com/reader/full/acc-discretion-of-bank-during-fin-crisis 49/59
HPI -0.000 0.003 0.001 -0.001 (0.006) (0.012) (0.006) (0.010)
Constant 0.996*** 1.035*** 1.100*** 0.832*** (0.028) (0.060) (0.033) (0.060)
N 562 570 1132 578 R 2 0.322 0.416 0.658 0.408
48
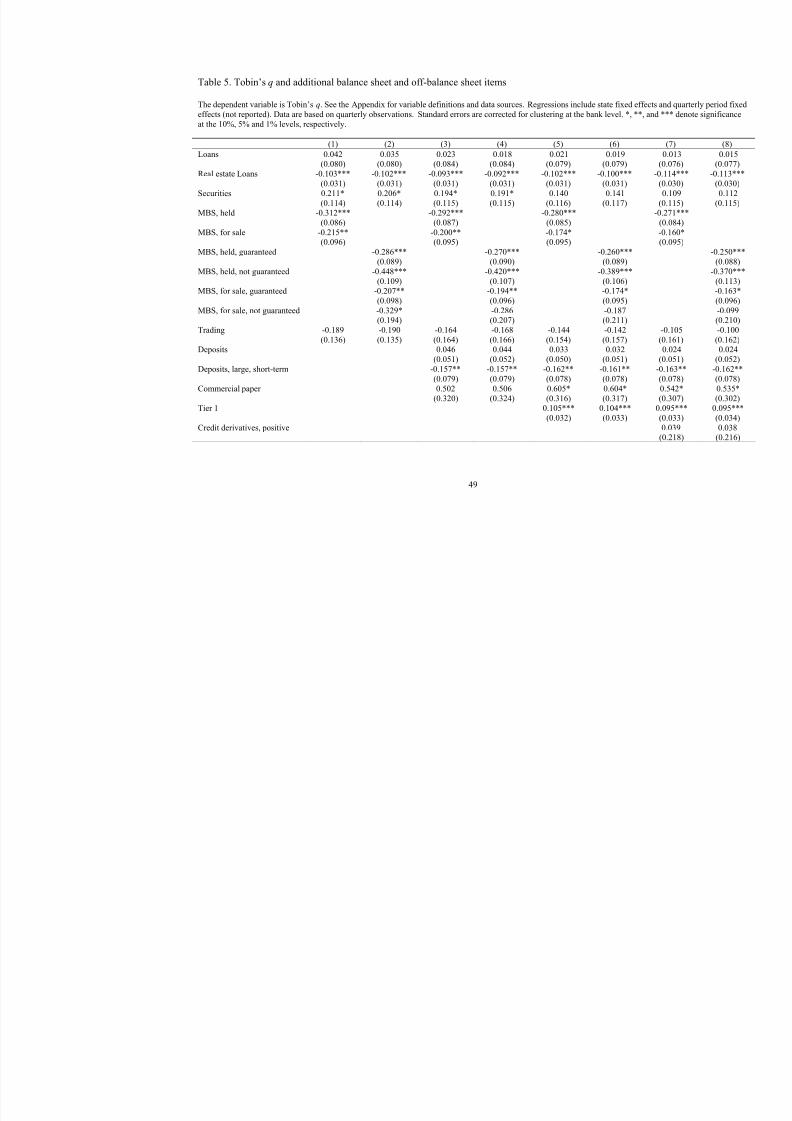
8/7/2019 acc discretion of bank during fin crisis
http://slidepdf.com/reader/full/acc-discretion-of-bank-during-fin-crisis 50/59
Table 5. Tobin’s q and additional balance sheet and off-balance sheet items
The dependent variable is Tobin’s q. See the Appendix for variable definitions and data sources. Regressions include state fixeffects (not reported). Data are based on quarterly observations. Standard errors are corrected for clustering at the bank levelat the 10%, 5% and 1% levels, respectively.
(1) (2) (3) (4) (5) (6)
Loans 0.042 0.035 0.023 0.018 0.021 0.019(0.080) (0.080) (0.084) (0.084) (0.079) (0.079
Real estate Loans -0.103*** -0.102*** -0.093*** -0.092*** -0.102*** -0.100*(0.031) (0.031) (0.031) (0.031) (0.031) (0.031
Securities 0.211* 0.206* 0.194* 0.191* 0.140 0.141(0.114) (0.114) (0.115) (0.115) (0.116) (0.117
MBS, held -0.312*** -0.292*** -0.280*** (0.086) (0.087) (0.085)
MBS, for sale -0.215** -0.200** -0.174* (0.096) (0.095) (0.095)
MBS, held, guaranteed -0.286*** -0.270*** -0.260*(0.089) (0.090) (0.089
MBS, held, not guaranteed -0.448*** -0.420*** -0.389*(0.109) (0.107) (0.106
MBS, for sale, guaranteed -0.207** -0.194** -0.174(0.098) (0.096) (0.095
MBS, for sale, not guaranteed -0.329* -0.286 -0.187(0.194) (0.207) (0.211
Trading -0.189 -0.190 -0.164 -0.168 -0.144 -0.142(0.136) (0.135) (0.164) (0.166) (0.154) (0.157
Deposits 0.046 0.044 0.033 0.032(0.051) (0.052) (0.050) (0.051
Deposits, large, short-term -0.157** -0.157** -0.162** -0.161*(0.079) (0.079) (0.078) (0.078
Commercial paper 0.502 0.506 0.605* 0.604(0.320) (0.324) (0.316) (0.317
Tier 1 0.105*** 0.104*(0.032) (0.033
Credit derivatives, positive
49

8/7/2019 acc discretion of bank during fin crisis
http://slidepdf.com/reader/full/acc-discretion-of-bank-during-fin-crisis 51/59
Credit derivatives, negative
Securitized
Resource
Sponsored
Sales
Big 0.008 0.008 0.009 0.009 0.012* 0.012(0.006) (0.006) (0.007) (0.007) (0.006) (0.006
HPI 0.002 0.001 0.003 0.003 0.004 0.003(0.007) (0.007) (0.006) (0.007) (0.007) (0.007
Constant 1.001*** 1.008*** 0.969*** 0.976*** 0.894*** 0.898*(0.064) (0.064) (0.082) (0.084) (0.073) (0.077
N 1132 1132 1132 1132 1132 1132
R 2
0.379 0.380 0.388 0.389 0.401 0.401
50

8/7/2019 acc discretion of bank during fin crisis
http://slidepdf.com/reader/full/acc-discretion-of-bank-during-fin-crisis 52/59
Table 6. Event study of new FASB rules on fair value accounting for illiquid assets (FAS 157), announc
This table reports average cumulative abnormal returns for different subsamples of firms. Cumulative abnormal returns are baestimation window of [t-250, t-30], where t denotes October 10, 2008, and time is counted in trading days. Panel A reports ret+2], where t denotes October 10, 2008, and time is counted in trading days, while Panel B reports results using an event wind
firms with more than 100 zero returns over the estimation window or a zero return on the event date are excluded from the sawith total assets above (below) the quarterly sample median. High (Low) q denotes firms with Tobin’s q above (below) the qushare of MBS denotes firms with mortgage-backed securities as a fraction of total assets above (below) the quarterly sample maverage cumulative abnormal returns are reported in parentheses. ***,**, and * denote significance at the 1%, 5%, and 10% l
Panel A: Event window is October 8, 2008 until October 12, 2008
(1) (2) (3) (4) (5) (6) (7)All firms Large Small Low q High q Low share of
MBSHigh share of
MBS
CAR 0.0128* 0.0260*** -0.000523 0.00528 0.0203*** 0.0116 0.0140(0.00703) (0.00924) (0.0105) (0.0123) (0.00700) (0.0111) (0.00874)
Observations 270 136 134 134 136 134 136
Panel B: Event window is October 10, 2008(1) (2) (3) (4) (5) (6) (7)
All firms Large Small Low q High q Low share of MBS
High share of MBS
CAR 0.0761*** 0.129*** 0.0225** 0.0371*** 0.114*** 0.0616*** 0.0903***(0.00735) (0.00786) (0.0107) (0.0113) (0.00817) (0.0113) (0.00937)
Observations 270 136 134 134 136 134 136
51

8/7/2019 acc discretion of bank during fin crisis
http://slidepdf.com/reader/full/acc-discretion-of-bank-during-fin-crisis 53/59
Table 7. Event study of FASB amendments to fair value accounting of hard-to-value assets, announced o
This table reports average cumulative abnormal returns for different subsamples of firms. Cumulative abnormal returns are baestimation window of [t-250, t-30], where t denotes October 10, 2008, and time is counted in trading days. Panel A reports ret+2], where t denotes April 9, 2009, and time is counted in trading days, while Panel B reports results using an event window
with more than 100 zero returns over the estimation window or a zero return on the event date are excluded from the sample. total assets above (below) the quarterly sample median. High (Low) q denotes firms with Tobin’s q above (below) the quartershare of MBS denotes firms with mortgage-backed securities as a fraction of total assets above (below) the quarterly sample maverage cumulative abnormal returns are reported in parentheses. ***,**, and * denote significance at the 1%, 5%, and 10% l
Panel A: Event window is April 7, 2009 until April 11, 2009
(1) (2) (3) (4) (5) (6) (7)All firms Large Small Low q High q Low share of
MBSHigh share of
MBS
CAR 0.0643*** 0.0899*** 0.0390*** 0.0768*** 0.0519*** 0.0632*** 0.0654***(0.00660) (0.00920) (0.00895) (0.0115) (0.00635) (0.00944) (0.00927)
Observations 255 127 128 127 128 127 128
Panel B: Event window is April 9, 2009(1) (2) (3) (4) (5) (6) (7)
All firms Large Small Low q High q Low share of MBS
High share of MBS
CAR 0.0499*** 0.0662*** 0.0337*** 0.0529*** 0.0469*** 0.0497*** 0.0501***(0.00425) (0.00540) (0.00627) (0.00739) (0.00428) (0.00668) (0.00531)
Observations 255 127 128 127 128 127 128
52

8/7/2019 acc discretion of bank during fin crisis
http://slidepdf.com/reader/full/acc-discretion-of-bank-during-fin-crisis 54/59
Table 8. Loan loss provisions and net loan charge-offs in 2008
The dependent variable is the ratio of loan loss provisioning to loans in Columns (1)-(3) and the ratio of loan charge-offs min
(4)-(6). See the Appendix for variable definitions and data sources. Subsample in Columns (2) and (5) consists of banks with quarter. Subsample in Columns (3) and (6) consists of banks with above-median Tobin’s Q in a given quarter. Regressions inquarterly period fixed effects (not reported). Data are based on quarterly observations. Standard errors are corrected for clust*** denote significance at the 10%, 5% and 1% levels, respectively.
Loan loss provisioning Net loAll banks Low valuation High valuation All banks Lo
(1) (2) (3) (4)
Share of real estate loans 0.004 0.000 0.000 0.003 (0.005) (0.008) (0.002) (0.003)
MBS -0.015** -0.024* -0.002 -0.008 (0.007) (0.013) (0.005) (0.005)
Big 0.004*** 0.008*** 0.001* 0.003*** (0.001) (0.002) (0.001) (0.001)
HPI -0.005** -0.001 -0.009*** -0.005** (0.002) (0.003) (0.003) (0.002)
Constant 0.013* 0.000 0.030*** 0.012* (0.008) (0.012) (0.007) (0.006)
N 1132 562 570 1132 R 2 0.344 0.440 0.413 0.310
53

8/7/2019 acc discretion of bank during fin crisis
http://slidepdf.com/reader/full/acc-discretion-of-bank-during-fin-crisis 55/59
Table 9. Share of mortgage-backed securities that is held-to-maturity in 2008
The dependent variable is the share of mortgage-backed securities that is held-to-maturity. Low valuation is a dummy variablbank has a Tobin’s q less than one, and zero otherwise. See the Appendix for variable definitions and data sources. Regressioquarterly period fixed effects (not reported). Data are based on quarterly observations. Standard errors are corrected for clust*** denote significance at the 10%, 5% and 1% levels, respectively.
Guaranteed Not guaranteed Guaranteed Not guaranteed (1) (2) (3) (4)
Loans 0.030 -0.913*** 0.068 -0.855*** (0.268) (0.284) (0.274) (0.269)
Real estate loans 0.031 0.731*** 0.015 0.701*** (0.208) (0.229) (0.207) (0.215)
Real estate loans * Low valuation
Securities, amortized cost 0.148 -0.219 0.210 -0.139 (0.244) (0.493) (0.253) (0.488)
MBS, amortized cost 0.354 1.048 0.332 1.036 (0.280) (0.685) (0.275) (0.680)
MBS, amortized cost * Low valuation
Low valuation 0.029 0.028 (0.019) (0.029)
Big -0.019 0.060 -0.016 0.063 (0.027) (0.041) (0.026) (0.040)
HPI 0.017 0.022 0.017 0.021 (0.016) (0.034) (0.016) (0.034)
Constant -0.101 -0.028 -0.148 -0.069 (0.132) (0.296) (0.145) (0.297)
N 1098 582 1098 582
R 2 0.237 0.434 0.241 0.436
54
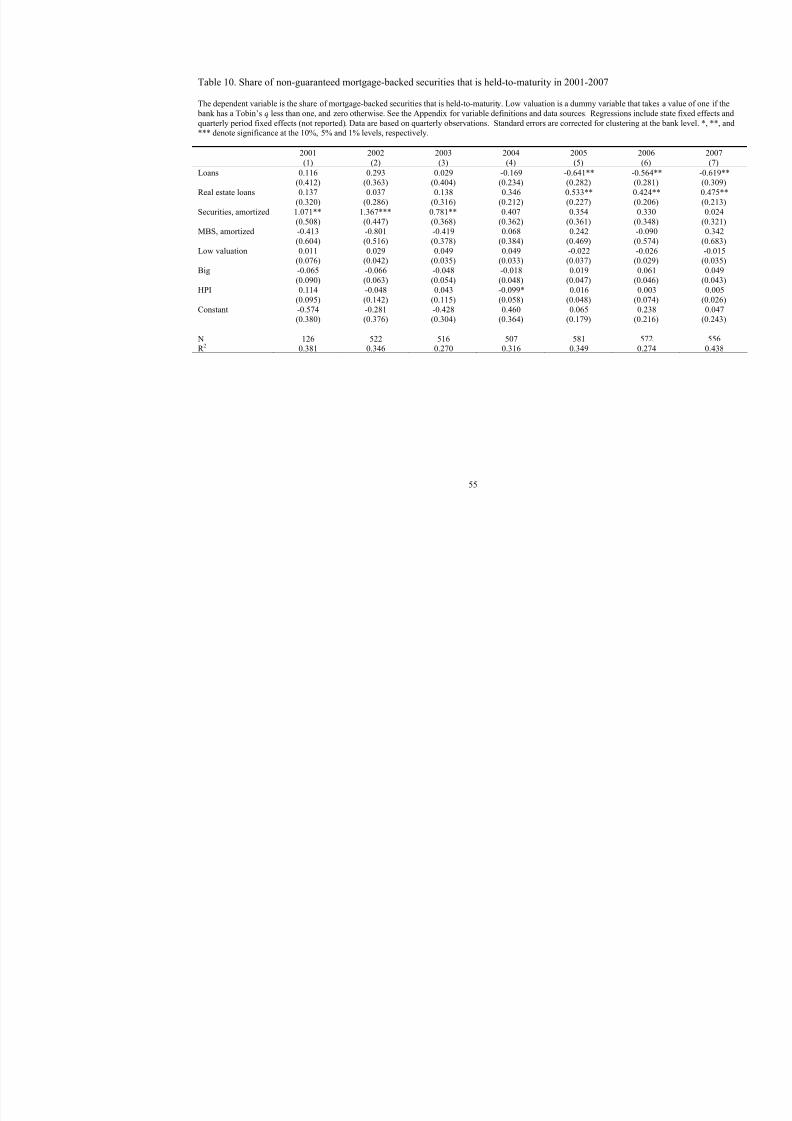
8/7/2019 acc discretion of bank during fin crisis
http://slidepdf.com/reader/full/acc-discretion-of-bank-during-fin-crisis 56/59
55
Table 10. Share of non-guaranteed mortgage-backed securities that is held-to-maturity in 2001-2007
The dependent variable is the share of mortgage-backed securities that is held-to-maturity. Low valuation is a dummy variablbank has a Tobin’s q less than one, and zero otherwise. See the Appendix for variable definitions and data sources. Regressioquarterly period fixed effects (not reported). Data are based on quarterly observations. Standard errors are corrected for clust*** denote significance at the 10%, 5% and 1% levels, respectively.
2001 2002 2003 2004 2005 (1) (2) (3) (4) (5)
Loans 0.116 0.293 0.029 -0.169 -0.641** (0.412) (0.363) (0.404) (0.234) (0.282)
Real estate loans 0.137 0.037 0.138 0.346 0.533** (0.320) (0.286) (0.316) (0.212) (0.227)
Securities, amortized 1.071** 1.367*** 0.781** 0.407 0.354 (0.508) (0.447) (0.368) (0.362) (0.361)
MBS, amortized -0.413 -0.801 -0.419 0.068 0.242 (0.604) (0.516) (0.378) (0.384) (0.469)
Low valuation 0.011 0.029 0.049 0.049 -0.022
(0.076) (0.042) (0.035) (0.033) (0.037) Big -0.065 -0.066 -0.048 -0.018 0.019
(0.090) (0.063) (0.054) (0.048) (0.047) HPI 0.114 -0.048 0.043 -0.099* 0.016
(0.095) (0.142) (0.115) (0.058) (0.048) Constant -0.574 -0.281 -0.428 0.460 0.065
(0.380) (0.376) (0.304) (0.364) (0.179)
N 126 522 516 507 581R 2 0.381 0.346 0.270 0.316 0.349
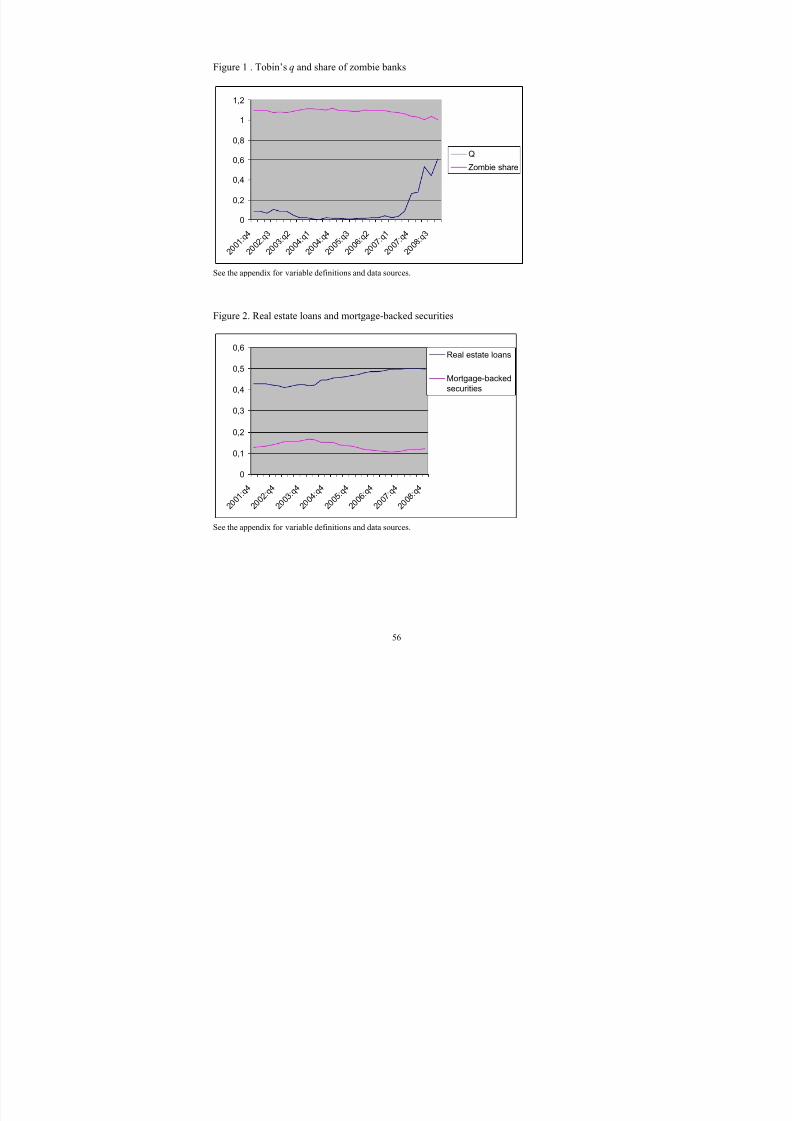
8/7/2019 acc discretion of bank during fin crisis
http://slidepdf.com/reader/full/acc-discretion-of-bank-during-fin-crisis 57/59
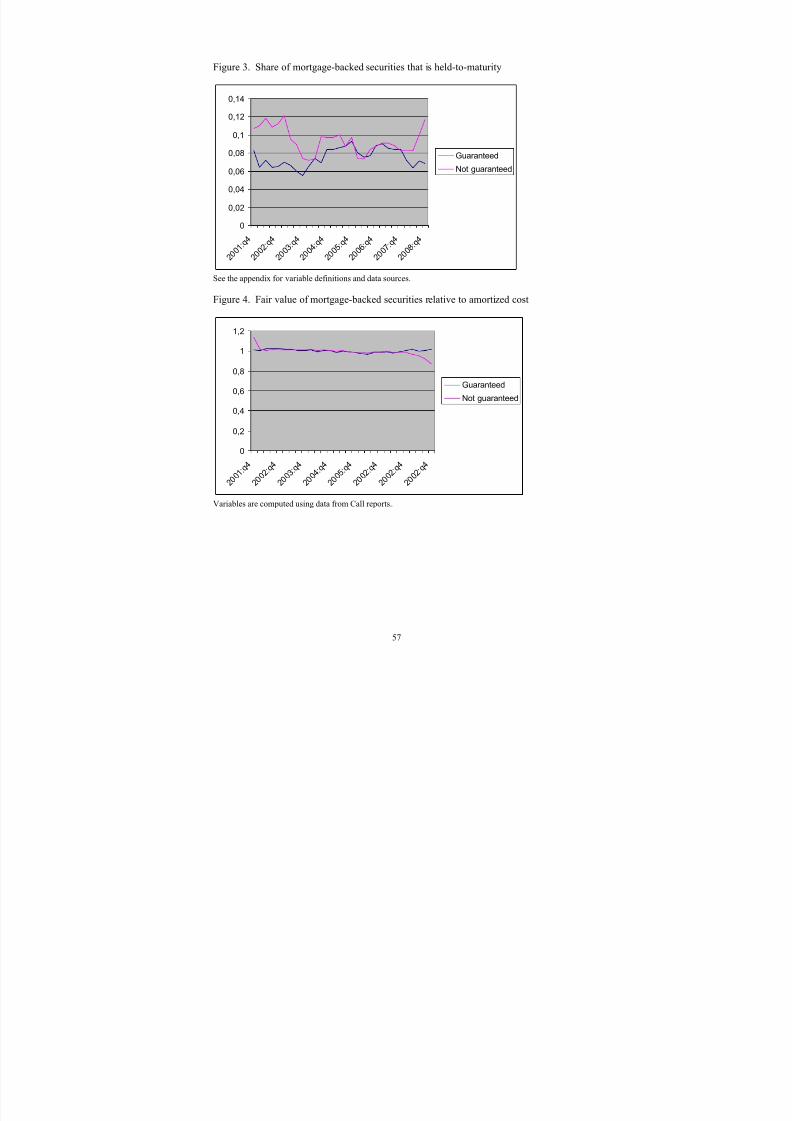
8/7/2019 acc discretion of bank during fin crisis
http://slidepdf.com/reader/full/acc-discretion-of-bank-during-fin-crisis 58/59

8/7/2019 acc discretion of bank during fin crisis
http://slidepdf.com/reader/full/acc-discretion-of-bank-during-fin-crisis 59/59