Embed Size (px)
Citation preview

Accelerated decline in the Arctic sea ice cover
Josefino C. Comiso,1 Claire L. Parkinson,1 Robert Gersten,1,2,3 and Larry Stock1,4
Received 8 September 2007; revised 30 October 2007; accepted 26 November 2007; published 3 January 2008.
[1] Satellite data reveal unusually low Arctic sea icecoverage during the summer of 2007, caused in part byanomalously high temperatures and southerly winds. Theextent and area of the ice cover reached minima on14 September 2007 at 4.1 � 106 km2 and 3.6 � 106 km2,respectively. These are 24% and 27% lower than theprevious record lows, both reached on 21 September 2005,and 37% and 38% less than the climatological averages.Acceleration in the decline is evident as the extent and areatrends of the entire ice cover (seasonal and perennial ice) haveshifted from about �2.2 and �3.0% per decade in 1979–1996 to about �10.1 and �10.7% per decade in the last 10years. The latter trends are now comparable to the highnegative trends of �10.2 and �11.4% per decade for theperennial ice extent and area, 1979–2007. Citation: Comiso,
J. C., C. L. Parkinson, R. Gersten, and L. Stock (2008),
Accelerated decline in the Arctic sea ice cover, Geophys. Res.
Lett., 35, L01703, doi:10.1029/2007GL031972.
1. Introduction
[2] The Arctic region has been a central focus of manyclimate change studies in recent years, both because of thelarge amount of change seen in the Arctic [e.g., Comiso andParkinson, 2004; Arctic Climate Impact Assessment (ACIA),2005] and because of the expectations of an amplifiedclimate signal in the Arctic due to the ice-albedo andsnow-albedo feedback effects associated with the highreflectivity of ice and snow [Holland and Bitz, 2003].Among the changes in the Arctic are increasing melt areasover the Greenland ice sheet, retreating glaciers, reduced seaice coverage, permafrost thawing, and rising surface tem-peratures [ACIA, 2005]. All the changes incorporate inter-annual variability but also a consistent trend toward warmer,less-icy conditions.[3] Among the best quantified of the changes occurring
in the Arctic since the late 1970s are the changes associatedwith the Arctic sea ice cover. This is because of theeffectiveness of satellite passive-microwave imagery inmonitoring the ice and the existence of satellite passive-microwave data for almost the entire period since lateOctober 1978, when the Scanning Multichannel MicrowaveRadiometer (SMMR) was launched, followed by a sequenceof Special Sensor Microwave Imagers (SSMI) starting in1987. The SMMR/SSMI record has been used extensivelyfor Arctic sea ice studies, and is the record used here for the
time series analyses. Also used here are data from theJapanese Advanced Microwave Scanning Radiometer forthe Earth Observing System (AMSR-E), launched in 2002.Although short, the AMSR-E record provides the highest-resolution satellite passive-microwave imagery available.For the years of data overlap, the SSMI and AMSR-Erecords provide consistent sea ice results.[4] One of the most remarkable of the quantified changes
in the Arctic is the 9–10% decline per decade in the perennialsea ice cover during the SMMR/SSMI era [Comiso, 2002;Stroeve et al., 2007]. Perennial ice is the ice cover thatremains during minimum ice extent and consists mainlyof thick multiyear ice floes. These ice floes are the mainstayof the Arctic Ocean sea ice cover. The Arctic perennial ice isaccompanied through much of the year by considerableadditional but much younger sea ice termed seasonal icebecause of not lasting through the entire year. Together, theperennial and seasonal ice constitute the full Arctic sea icecover. The full ice cover has also been decreasing, but untilrecently this has been at the more modest rate of about 3%per decade [e.g., Bjorgo et al., 1997; Parkinson et al., 1999;Parkinson and Cavalieri, 2002]. We report here both thatthe perennial ice is showing enhanced signs of its rapiddemise and that the decrease in the full ice cover has nowspeeded up to the point that it is experiencing the muchhigher retreat rates earlier reported for the perennial icealone.
2. Summer Ice Cover in 2007
[5] The 2007 Arctic ice cover was comparable to the2005 and 2006 ice covers through mid-June but then begana more precipitous decline (Figure 1). Five-year averagesfrom 1980 through 2004 show a general decrease in theNorthern Hemisphere sea ice extents and areas throughoutthe seasonal cycle, with this pattern being especially strongin the late summer/early fall (Figure 1). Each of the yearsafter 2004 shows less ice throughout the year than any ofthe five-year averages going back to 1980–1984. The year2005 had the lowest winter values, but as of July 2007, the2007 values were well below earlier July values, placing2007 on track for reaching a new record minimum iceextent for the years of the satellite record (Figure 1). By14 September 2007, the ice extent and area both reachednew record minima, representing a decline from the 2005minima that is comparable in magnitude to that between1980 and 2005. It is also apparent, however, that the iceis rebounding with a rapid early autumn growth. The rateof growth from ice minima to 23 October 2007 is 69.6 �103 km2/day compared to 67.6 � 103 km2/day for theclimatological average (Figure 1).[6] The unusually low 2007 ice cover at the end of the
summer melt is illustrated by the color-coded daily iceconcentration map for 14 September 2007 (Figure 2). For
GEOPHYSICAL RESEARCH LETTERS, VOL. 35, L01703, doi:10.1029/2007GL031972, 2008ClickHere
for
FullArticle
1Cryospheric Sciences Branch, NASA Goddard Space Flight Center,Greenbelt, Maryland, USA.
2ADNET Systems, Inc., Lanham, Maryland, USA.3RS Information Systems, McLean, Virginia, USA.4Stinger Ghaffarian Technologies, Inc., Greenbelt, Maryland, USA.
This paper is not subject to U.S. copyright.Published in 2008 by the American Geophysical Union.
L01703 1 of 6

comparison, the map also includes the contour of the 2005minimum ice edge (red contour) and the ice edge for theminimum conditions averaged over 1979–2006 (gold con-tour). It is apparent that much of the 2007 decline versusearlier years occurred in the extended region of the BeaufortSea, Chukchi Sea, East Siberian Sea, Laptev Sea and KaraSea. The contour of the ice edge during minimum extent in2005, the year with the previous record minimum icecoverage, is considerably further south than the 2007 iceedge (dark blue in the ice concentration map) in the stretchfrom the Beaufort Sea to the Laptev Sea, although some-what inside of the 2007 edge from the Greenland Sea to theKara Sea. Overall, the 2007 summer ice exhibits a muchlarger anomaly than the 2005 ice (Figure 2).[7] To gain insight into what might have triggered the
accelerated sea ice decline in late June and July of 2007, wepresent images of monthly ice concentrations from Marchto August of 2007, 2005, and the 1979–2007 averages(Figure 3). These images show the temporal progression inthe decay of sea ice from near peak values in March to mid-summer values in August. Through May, the images for2007 and 2005 show comparable seasonal decay. In June,distinct differences appear, specifically with a large polynya(open-water region in the midst of the ice cover) immedi-ately north of northwestern Canada in 2005 and with abroad region of reduced ice concentrations north of Alaska
and eastern Siberia (in the Beaufort, Chukchi, and EastSiberian Seas) in 2007. In July, the latter of these differencesexpands, and by August, the expanded region of reduced iceconcentrations in 2007 results in a substantial further retreatof the 2007 ice edge. The climatological averages show icefeatures similar to those of 2005 from March to June butwith the ice edge generally somewhat further south andmore diffused (on account of the averaging). In July andAugust, the 1979–2007 average ice cover is considerablymore extensive and further south than in either 2005 or2007.[8] Numerical values of the 2005, 2007 and the 1979–
2007 climatological monthly average ice extents, ice areas,and ice concentrations are presented in Table 1. From Marchto May, the monthly extents and areas in 2005 and 2007 arewithin 2.3% of each other, while the differences fromclimatology are substantially higher. In June, the 2007 iceextent is actually higher than the 2005 value by 0.17%, butthe lower ice concentrations (Figure 2, Table 1) more thancompensate, so that the ice areas remain lower in 2007(Figure 1, Table 1). In July, August and September the iceextents in 2007 are lower than those of 2005 by 9%, 16%and 25%, respectively, and lower that climatology by 18%,29% and 37%. To put the magnitude of the anomaly in alarger perspective, on 13 August 2007, the ice extentreached a new minimum of 5.43 � 106 km2, falling belowthe previous 27-year record minimum of 5.44 � 106 km2,even though on 13 August the 2007 ice cover still had overa month remaining before the normal end of the meltseason. Moreover, by 8 August 2007 the ice area was alsoalready lower, at 4.81 � 106 km2, than the 4.90 � 106 km2
record minimum reached on 21 September 2005. After 13August, the ice cover continued decreasing, reaching an iceextent of 4.12 � 106 km2 and an ice area of 3.65 � 106 km2
by 14 September.[9] Anomaly maps of ice concentration for 2007 versus
the 1979–2007 average are presented in the fourth columnof Figure 3. The images show that during March–May,much of the deviation in ice extent and area from the long-term average was due to reduced ice cover (in red andpurples) in the eastern Barents Sea and the Okhotsk Sea. ByJune, well into the melt season around the ice edge, thenegative anomalies are apparent around almost the entire iceedge; and in July 2007, the negative anomalies are prom-inent through almost the entire ice region south of 80�N. InAugust, the negative anomalies have broken through northof 80�N, although smaller areas of positive anomalies arealso apparent, in the Greenland Sea and off the TaymyrPeninsula (Figure 3).[10] Among the factors that can cause anomalously low
ice is high surface temperature. High temperatures in wintercan inhibit ice growth, and high temperatures in spring andsummer can accelerate melt. Using satellite infrared datafrom 1981 to 2007 as described by Comiso [2006a], the lastcolumn of Figure 3 shows anomaly maps of surface temper-atures in February–July 2007 versus the 1982–2007monthly averages. We include February because of itsrelevance due to possible lag effects. Anomalously hightemperatures in the central Arctic are apparent especially inFebruary and April. During all months except May, thepositive anomalies dominate in the central Arctic. Visually,the correlation is good between the temperature and sea ice
Figure 1. Daily ice extents and ice areas for 2005, 2006,2007, and averaged over the 5-year periods 1980–1984through 2000–2004. Values are derived from satellitepassive-microwave data from NASA’s Scanning Multi-channel Microwave Radiometer (SMMR) and the Depart-ment of Defense’s Special Sensor Microwave Imager(SSMI).
L01703 COMISO ET AL.: ACCELERATED DECLINE IN ARCTIC SEA ICE COVER L01703
2 of 6

anomalies (Figure 3). Another important factor in icedistributions is wind. The southerly direction of the windin the Beaufort and Chukchi seas region in June and July(Figure 3, column 4) suggests a forcing that may havecontributed to the retreat of sea ice to the north. Further-more, the cyclonic wind pattern centered at about (140�E,78�N) in August could foretell further sea ice retreat.
3. Accelerated Decline
[11] A topic of interest over the past several years hasbeen the issue of why the maximum extent and area of thefull Arctic ice cover have not been declining as fast as thoseof the perennial ice. As reported previously, the situationmay be changing, since 2005 and 2006 had anomalouslylow winter ice cover [Comiso, 2006b], and 2007 does also(Figure 3). Updates of monthly anomalies of the hemispher-ical ice cover through September 2007 (Figure 4) showlinear trends of �3.7 ± 0.2% per decade and �4.3 ± 0.2%per decade for ice extent and ice area, respectively. How-ever, the rate of change in the last 10 years (blue lines) isnoticeably more negative than in the first 18 years (greenlines). Trends for 1996–2007 through September 2007 are�10.1 ± 0.7%/decade and �10.7 ± 0.8%/decade for iceextent and ice area, respectively, the 1996–2007 valuesbeing comparable to the rates since 1979 in the perennial ice
cover which when updated to 2007 are now �10.2 ± 1.7and �11.4 ± 1.6%/decade.[12] In Figure 4, the last three data points, for July,
August and September 2007, are so anomalously low thatit became essential for us to check these points with anindependent measurement, which we did by using data fromthe AMSR-E instrument. Both the SSM/I and the AMSR-Eprovided approximately the same ice extents and areas,confirming that the plummeting of the Arctic ice cover inthose two months was not a function of instrumentalanomaly.
4. Discussion and Conclusions
[13] The Arctic sea ice cover is influenced by a variety offactors, temperatures, winds, waves, and currents beingprimary among them. Warming Arctic temperatures providea powerful forcing toward lessened sea ice coverage, butatmospheric forcing also implies that oscillations within theatmosphere are likely to be reflected in the ice cover as well.Indeed, several studies have indicated possible connectionsbetween changes occurring in the ice and such oscillatoryphenomena as the Arctic Oscillation (AO) [e.g., Thompsonand Wallace, 1998; Wang and Ikeda, 2000; Rigor andWallace, 2004], the North Atlantic Oscillation (NAO)[e.g., Kwok, 2000; Parkinson, 2000], and periodic changes
Figure 2. Daily Arctic ice concentrations from AMSR-E for 14 September 2007, when the ice cover reached its minimumextent. The gold contour represents the ice edge inferred from the average of the ice concentration maps during iceminimum extent over the period 1979–2006, while the red contour represents the ice edge during ice minimum in 2005,which was the previous record low.
L01703 COMISO ET AL.: ACCELERATED DECLINE IN ARCTIC SEA ICE COVER L01703
3 of 6
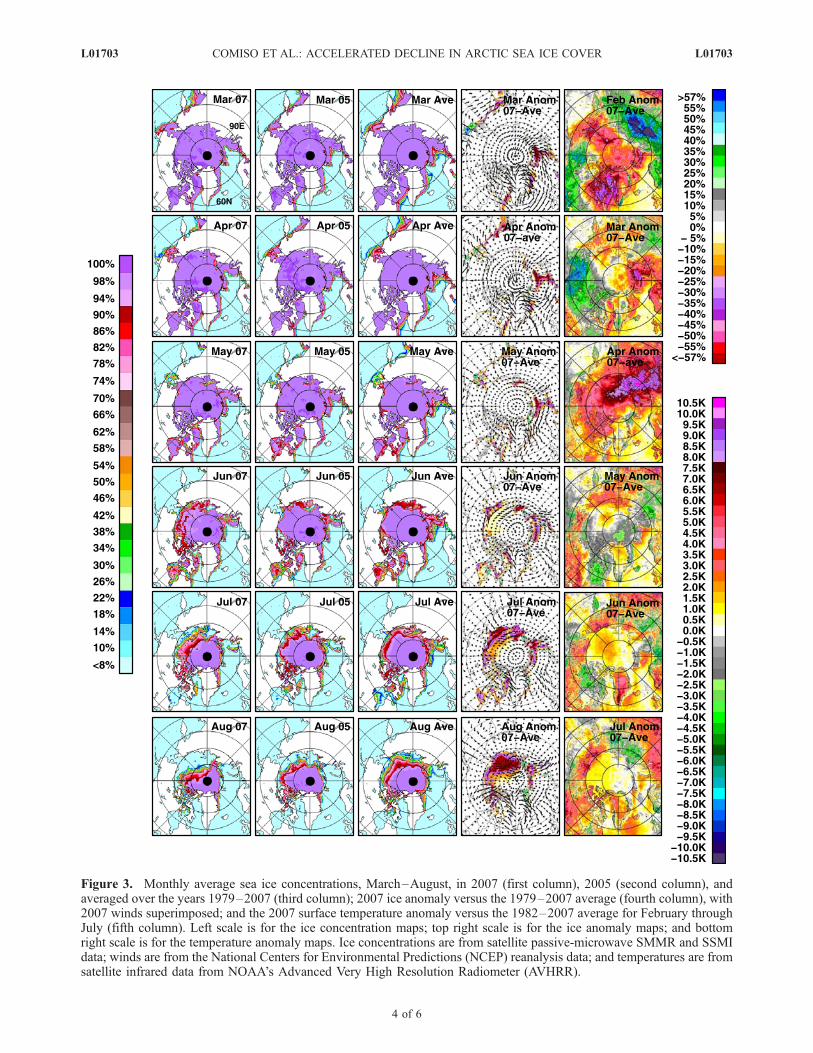
Figure 3. Monthly average sea ice concentrations, March–August, in 2007 (first column), 2005 (second column), andaveraged over the years 1979–2007 (third column); 2007 ice anomaly versus the 1979–2007 average (fourth column), with2007 winds superimposed; and the 2007 surface temperature anomaly versus the 1982–2007 average for February throughJuly (fifth column). Left scale is for the ice concentration maps; top right scale is for the ice anomaly maps; and bottomright scale is for the temperature anomaly maps. Ice concentrations are from satellite passive-microwave SMMR and SSMIdata; winds are from the National Centers for Environmental Predictions (NCEP) reanalysis data; and temperatures are fromsatellite infrared data from NOAA’s Advanced Very High Resolution Radiometer (AVHRR).
L01703 COMISO ET AL.: ACCELERATED DECLINE IN ARCTIC SEA ICE COVER L01703
4 of 6

Table 1. Monthly Ice Extents, Ice Areas, and Ice Concentrations for March–September of 2005, 2007, and the 1979 to 2007
Climatologya
March April May June July Aug Sep
Ice ExtentClimatology 15.19 14.47 13.11 11.78 9.70 7.50 6.832005 14.42 13.87 12.73 11.11 8.73 6.37 5.682007 14.35 13.73 12.65 11.13 7.94 5.36 4.27%Diff (07-Cl) �5.53 �5.11 �3.53 �5.51 �18.13 �28.51 �37.48% Diff (07-05) �0.49 �1.02 �0.67 0.17 �9.08 �15.82 �24.79
Ice AreaClimatology 14.36 13.64 12.26 10.57 8.45 6.46 6.112005 13.59 13.11 11.82 9.77 7.48 5.39 5.032007 13.51 12.82 11.73 9.59 6.66 4.37 3.77%Diff (07-Cl) �5.93 �5.99 �4.36 �9.32 �21.22 �32.39 �38.31% Diff(07-05) �0.62 �2.21 �0.83 �1.87 �11.01 �18.87 �25.04
Ice ConcentrationClimatology 94.1 93.9 93.2 89.4 86.7 85.9 89.22005 93.8 94.2 92.5 87.5 85.3 84.4 88.42007 93.7 93.0 92.4 85.7 83.4 81.3 88.2Diff (07-Cl) �0.4 �0.9 �0.9 �3.7 �3.3 �4.6 �1.0Diff (07-05) �0.1 �1.2 �0.2 �1.8 �1.9 �3.1 �0.2aMonthly ice extents, 106 km2; Ice areas, 106 km2; ice concentrations, %; climatology, Cl.
Figure 4. Monthly ice extent and ice area anomalies from November 1978 to September 2007 (green and blue), with the12-month running average (red) and linear trend lines for the full record (black) and for 1978–1996 (green) and 1996–2007 (blue).
L01703 COMISO ET AL.: ACCELERATED DECLINE IN ARCTIC SEA ICE COVER L01703
5 of 6

in wind patterns [Proshutinsky and Johnson, 1997]. How-ever, the fact that over the past few years, sea ice coveragehas continued, overall, to decline despite changes in themodes of the AO and NAO and in the predominant windpatterns suggests that at this point the warming conditionsmay be overriding the oscillations. The persistently low iceextents and areas in recent years have led to suggestions of acontinuing decline and a departure from expected effects ofthe AO [Overland and Wang, 2005].[14] Since 2002, the perennial sea ice extent and area
have been consistently low, with the lowest ice coverage ofthe satellite era until this year occurring in 2005. Theslightly higher extent and area of the perennial ice coverin 2006 versus 2005 illustrate the interannual variabilitywithin the overall downward Arctic sea ice trend. Becausethe perennial ice cover takes time to grow and it is usuallythe older floes (>2 years) that are thick enough to survivethe summer melt, it would presumably require at least a fewyears of abnormally cold temperatures in the region for theperennial ice cover to recover to its early 1980s extent andarea.[15] Overall, our results show that a very large anomaly
in the sea ice cover occurred in the Arctic during thesummer of 2007. At ice minimum on 14 September 2007,the extent and area of the ice cover were 4.1 � 106 km2 and3.6 � 106 km2, respectively, which are 24% and 27% lessthan the previous record lows of 5.4 � 106 km2 and 4.9 �106 km2, both reached on 21 September 2005 and also 37%and 38% less than the climatological averages. Satellitesurface temperature data indicate that the growth of sea icewas likely hindered and the retreat likely enhanced byanomalously high temperatures in previous months, espe-cially in February and April 2007. Southerly winds, whichadvect warm air from lower latitudes, were prevalent duringthe summer, and this is also likely to have enhanced the iceretreat, through northward transport of the ice, lessened icegrowth and increased melt.[16] It is likely that the rapid sea ice decrease in 2007 is in
part the result of pre-conditioning of the Arctic Oceanthrough abnormally low perennial ice coverage in recentyears [Serreze et al., 2007; Lindsay and Zhang, 2005]. Theregion of rapid retreat is approximately the same regionwhere open water area has been abnormally high in the lastdecade. The satellite data show that in the Arctic basin northof 65�N, between 50�E and 290�E, the open water area hasbeen increasing at the rate of 23% per decade while at thesame time sea surface temperature has been increasing at0.7�C per decade. It is thus a region where ice-albedofeedback has created pre-conditioning in the form of in-creased absorption of solar radiation.[17] The trend for the entire ice cover (seasonal as well as
perennial ice) has shifted from about �2.2 and �3.0% perdecade in 1979–1996 for ice extent and area, respectively,to about �10.1 and �10.7% per decade in the last 10 years,another major shift to complement the remarkable decrease
in ice coverage in 2007. The latter values are now compa-rable with those of perennial ice, which retreated at the rateof �10.2 and �11.4%/decade for ice extent and ice area,respectively, from 1979 to September 2007. Still, althoughthe decreasing ice coverage might lead to an ice-free Arcticin summer sometime within the upcoming decades, in theforeseeable future the Arctic will continue to have winter icecoverage, as the Arctic surface temperatures in wintercontinue to remain well below freezing. Continued loss ofice in the peripheral seas, where primary productivity isknown to be very high, could, however, have major con-sequences on the Arctic and sub-Arctic ecosystems.
ReferencesArctic Climate Impact Assessment (ACIA) (2005), Arctic Climate ImpactAssessment, 1042 pp., Cambridge Univ. Press, Cambridge, U. K.
Bjorgo, E., O. M. Johannessen, and M. W. Miles (1997), Analysis ofmerged SSMR/SSMI time series of Arctic and Antarctic sea ice para-meters 1978–1995, Geophys. Res. Lett., 24, 413–416.
Comiso, J. C. (2002), A rapidly declining perennial sea ice cover in theArctic, Geophys. Res. Lett., 29(20), 1956, doi:10.1029/2002GL015650.
Comiso, J. C. (2006a), Arctic warming signals from satellite observations,Weather, 61(3), 70–76.
Comiso, J. C. (2006b), Abrupt decline in the Arctic winter sea ice cover,Geophys. Res. Lett., 33, L18504, doi:10.1029/2006GL027341.
Comiso, J. C., and C. L. Parkinson (2004), Satellite observed changes in theArctic, Phys. Today, 57(8), 38–44.
Holland, M. M., and C. M. Bitz (2003), Polar amplification of climatechange in coupled models, Clim. Dyn., 21, 221–232.
Kwok, R. (2000), Recent changes in Arctic Ocean sea ice motion associatedwith the North Atlantic Oscillation, Geophys. Res. Lett., 27(6), 775–778.
Lindsay, R. W., and J. Zhang (2005), The thinning of Arctic sea ice, 1988–2003: Have we reached the tipping point?, J. Clim., 18, 4879–4894.
Overland, J. E., and M. Wang (2005), The Arctic climate paradox: Therecent decrease of the Arctic Oscillation, Geophys. Res. Lett., 32,L06701, doi:10.1029/2004GL021752.
Parkinson, C. L. (2000), Recent trend reversals in Arctic sea ice extents:Possible connections to the North Atlantic Oscillation, Polar Geogr.,24(1), 1–12.
Parkinson, C. L., D. J. Cavalieri, P. Gloersen, H. J. Zwally, and J. C.Comiso (1999), Arctic sea ice extents, areas, and trends, 1978–1996,J. Geophys. Res., 104, 20,837–20,856.
Parkinson, C. L., and D. J. Cavalieri (2002), A 21 year record of Arctic sea-ice extents and their regional, seasonal and monthly variability andtrends, Ann. Glaciol., 34, 441–446.
Proshutinsky, A., and M. Johnson (1997), Two circulation regimes of thewind-driven Arctic Ocean, J. Geophys. Res., 102, 12,493–12,514.
Rigor, I. G., and J. M. Wallace (2004), Variations in the age of Arctic sea-ice and summer sea-ice extent, Geophys. Res. Lett., 31, L09401,doi:10.1029/2004GL019492.
Serreze, M. C., M. M. Holland, and J. Stroeve (2007), Perspective on theArctic’s shrinking sea-ice cover, Science, 315, 1533–1536.
Stroeve, J., M. M. Holland, W. Meier, T. Scambos, and M. C. Serreze(2007), Arctic sea ice decline: Faster than forecast, Geophys. Res. Lett.,34, L09501, doi:10.1029/2007GL029703.
Thompson, D. W., and J. M. Wallace (1998), The Arctic Oscillation sig-nature in the winter-time geopotential height and temperature fields,Geophys. Res. Lett., 25, 1297–1300.
Wang, J., and M. Ikeda (2000), Arctic Oscillation and Arctic Sea-IceOscillation, Geophys. Res. Lett., 27(9), 1287–1290.
�����������������������J. C. Comiso, R. Gersten, C. L. Parkinson, and L. Stock, Cryospheric
Sciences Branch, NASA Goddard Space Flight Center, Code 614.1,Greenbelt, MD 20771, USA. ([email protected])
L01703 COMISO ET AL.: ACCELERATED DECLINE IN ARCTIC SEA ICE COVER L01703
6 of 6