Embed Size (px)
Citation preview
Acceleration and rotation in a pendulum ride,measured using an iPhone 4.
Ann-Marie Pendrill1,2 and Johan Rohlen1
1) Department of Physics, University of Gothenburg, SE 412 96 Goteborg, Sweden2) National Resource Centre for Physics Education, Lund University, Box 118, SE221 00 LUND, Sweden
E-mail: [email protected]
Abstract. Many modern cell phones have built-in sensors that may be used as aresource for physics education. Amusement rides o!er examples of many di!erent typesof motion, where the acceleration leads to forces experienced throughout the body.A comoving 3D-accelerometer gives an electronic measurement of the varying forcesacting on the rider, but a complete description of a motion, also requires measurementof the rotation around the three axes, as provided e.g. by the iPhone 4. Here wepresent and interpret accelerometer and gyroscope data that were collected on a rotarypendulum ride.
PACS numbers: 01.50H 06.30Gv 01.40gb
Submitted to: Physics Education
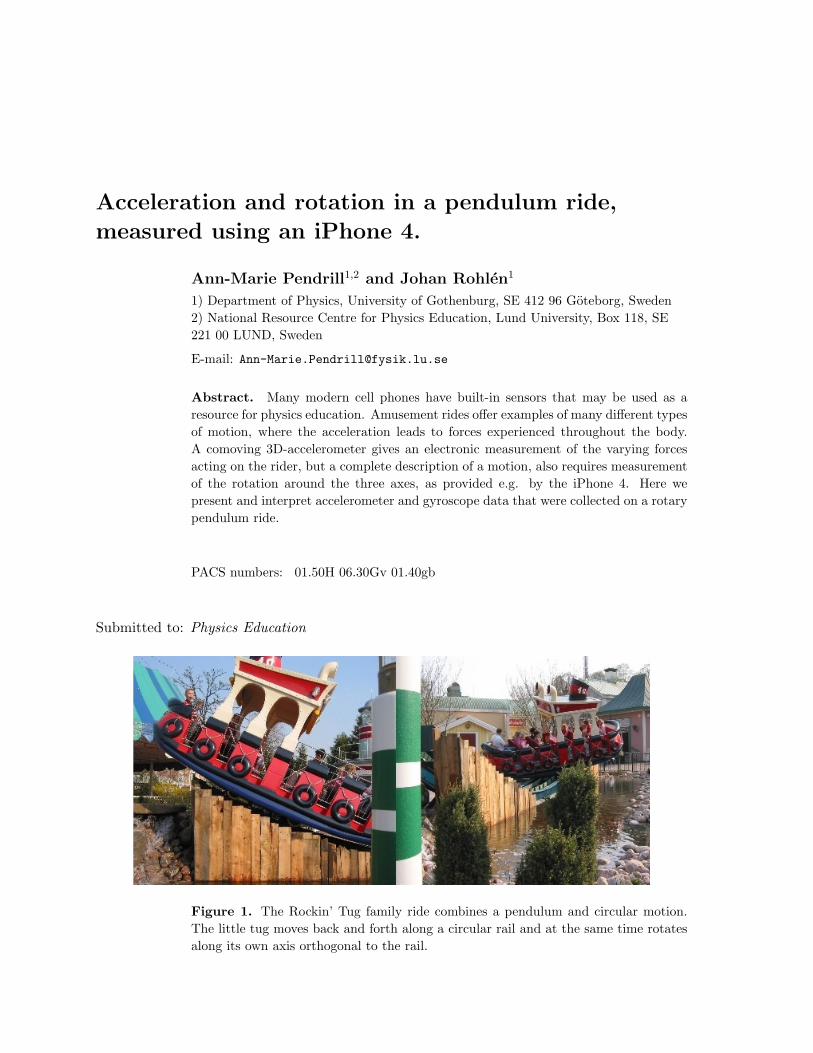
Figure 1. The Rockin’ Tug family ride combines a pendulum and circular motion.The little tug moves back and forth along a circular rail and at the same time rotatesalong its own axis orthogonal to the rail.
Acceleration and rotation in a pendulum ride 2
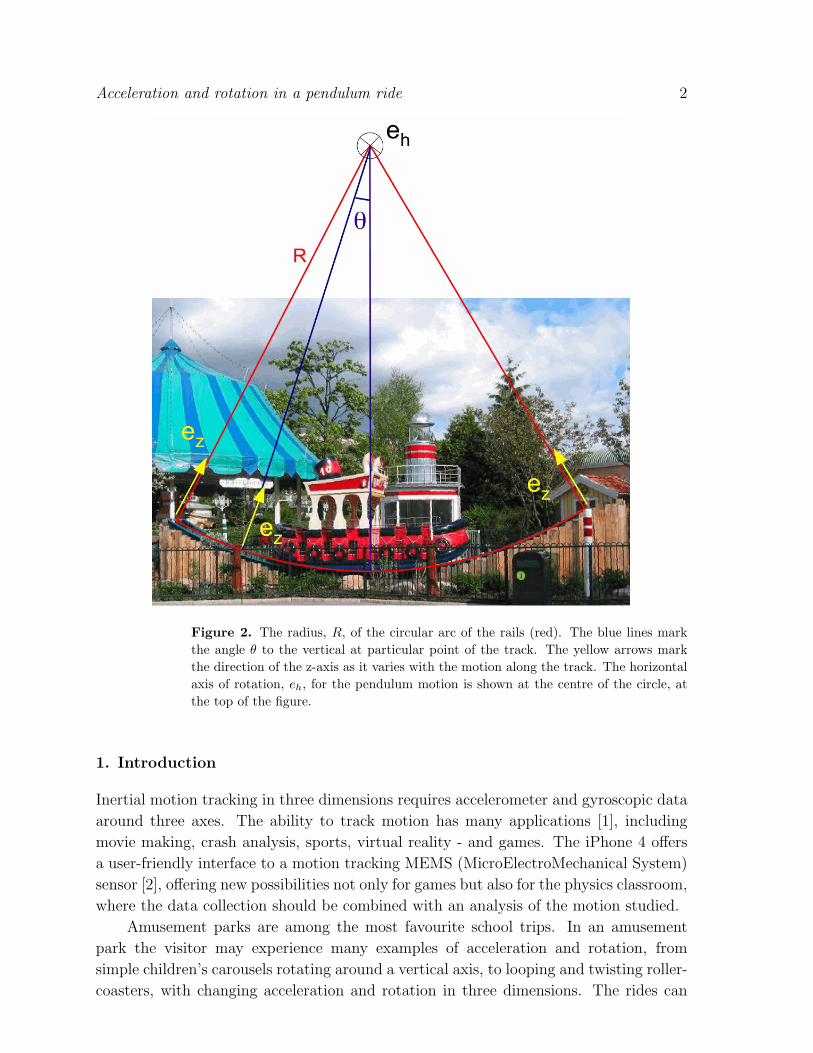
Figure 2. The radius, R, of the circular arc of the rails (red). The blue lines markthe angle ! to the vertical at particular point of the track. The yellow arrows markthe direction of the z-axis as it varies with the motion along the track. The horizontalaxis of rotation, eh, for the pendulum motion is shown at the centre of the circle, atthe top of the figure.
1. Introduction
Inertial motion tracking in three dimensions requires accelerometer and gyroscopic data
around three axes. The ability to track motion has many applications [1], including
movie making, crash analysis, sports, virtual reality - and games. The iPhone 4 o!ers
a user-friendly interface to a motion tracking MEMS (MicroElectroMechanical System)
sensor [2], o!ering new possibilities not only for games but also for the physics classroom,
where the data collection should be combined with an analysis of the motion studied.
Amusement parks are among the most favourite school trips. In an amusement
park the visitor may experience many examples of acceleration and rotation, from
simple children’s carousels rotating around a vertical axis, to looping and twisting roller-
coasters, with changing acceleration and rotation in three dimensions. The rides can
Acceleration and rotation in a pendulum ride 3
be studied at many di!erent levels of di"culty and involvement, from observation of
motion and the interplay between kinetic and potential energies in pendulum rides and
roller coasters, to electronic data collection and detailed analysis of the motion in the
rides.
The pendulum is a classic textbook example, which can be studied using ordinary
playground swings [3] and also in many amusement rides. In this paper we focus on a
pendulum ride, with an added rotation: the ”Rockin’ Tug” family ride from Zamperla
et al [4]. As seen from figures 1-2 the pendulum string is replaced by a rail, which is
known to have a radius of curvature of R=11.5m. The boat moves along the circular
rail and can also rotate around its own axis with a rotation speed 11 turns per minute
according to specifications. How do the pendulum and rotation motions combine? What
are the resulting forces on the rider - and how can we understand the data from the
iPhone, collected using the free app SensorLog? The motion is relatively simple and can
be described mathematically. Still, the combination of pendulum motion and rotation
around an additional axis leads to non-zero results for all axes, both for the accelerometer
and gyroscopic sensors, as discussed in this work.
2. The pendulum motion
During the ride the Iphone was held in place on the seat of the ride, inside a closed
pocket. The resulting accelerometer data are shown in figure 3. Since the the sensors
move along with the rider, the directions of the axes change all the time, with the z
axis pointing up from the seat. Figure 2 shows the ride and the radius of the circular
arc of the rail, which takes the place of the string in a pendulum. If maximum angle
of the pendulum is !0, the time dependence of the angle in the pendulum motion can
be written as !(t) = !0 cos pt with p2 = g/R (using the standard approximation valid
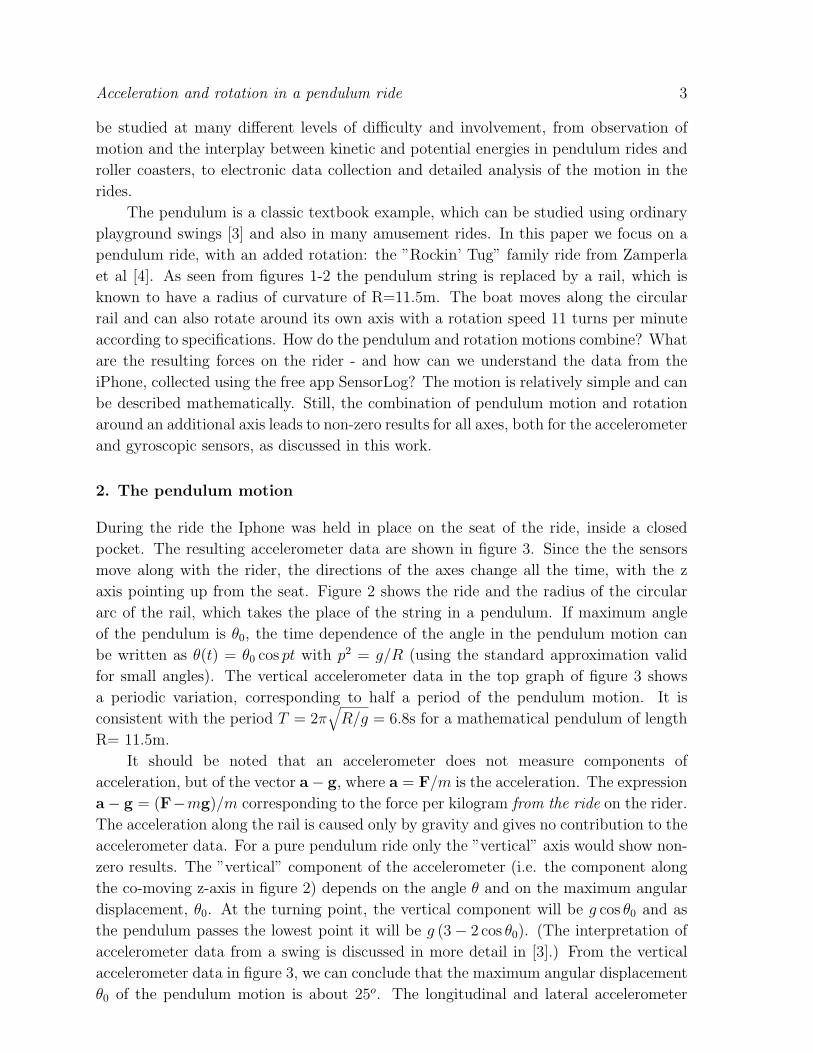
for small angles). The vertical accelerometer data in the top graph of figure 3 shows
a periodic variation, corresponding to half a period of the pendulum motion. It is
consistent with the period T = 2"!
R/g = 6.8s for a mathematical pendulum of length
R= 11.5m.
It should be noted that an accelerometer does not measure components of
acceleration, but of the vector a! g, where a = F/m is the acceleration. The expression
a! g = (F!mg)/m corresponding to the force per kilogram from the ride on the rider.
The acceleration along the rail is caused only by gravity and gives no contribution to the
accelerometer data. For a pure pendulum ride only the ”vertical” axis would show non-
zero results. The ”vertical” component of the accelerometer (i.e. the component along
the co-moving z-axis in figure 2) depends on the angle ! and on the maximum angular
displacement, !0. At the turning point, the vertical component will be g cos !0 and as
the pendulum passes the lowest point it will be g (3! 2 cos !0). (The interpretation of
accelerometer data from a swing is discussed in more detail in [3].) From the vertical
accelerometer data in figure 3, we can conclude that the maximum angular displacement
!0 of the pendulum motion is about 25o. The longitudinal and lateral accelerometer
Acceleration and rotation in a pendulum ride 4
Figure 3. Accelerometer data from the iPhone4, which was held in place on the seatof the ride. The ”vertical” z-axis points up from the seat. The sensor was placed withthe ”longitudinal” x-axis pointing to the back of the rider and the ”lateral” y axispointing to the right.
components in Figure 3 arise from the rotation around the ”vertical” axis, discussed in
section 3.
3. The rotation of the boat
After a few oscillations, the little tug starts to rotate as shown in figure 1. The rotation
of the boat leads to a centripetal acceleration of the rider towards the centre of the
boat, depending on the distance to the centre of rotation and on the angular velocity,
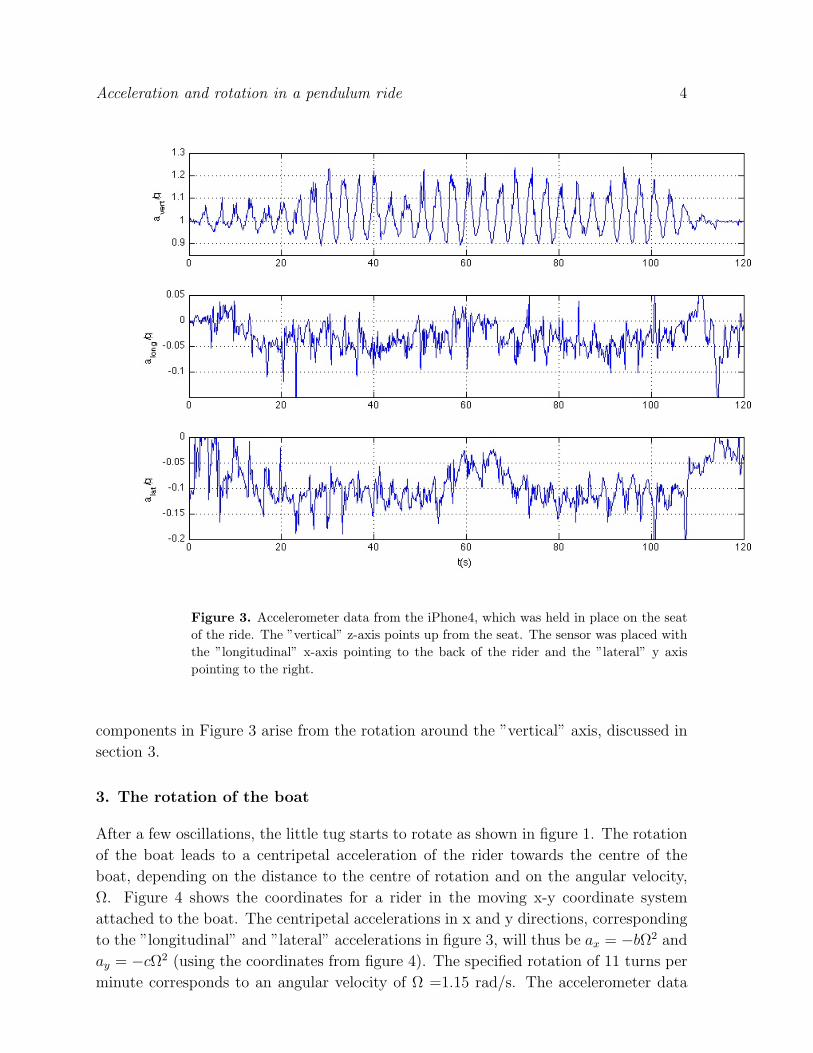
#. Figure 4 shows the coordinates for a rider in the moving x-y coordinate system
attached to the boat. The centripetal accelerations in x and y directions, corresponding
to the ”longitudinal” and ”lateral” accelerations in figure 3, will thus be ax = !b#2 and
ay = !c#2 (using the coordinates from figure 4). The specified rotation of 11 turns per
minute corresponds to an angular velocity of # =1.15 rad/s. The accelerometer data
Acceleration and rotation in a pendulum ride 5
Figure 4. Coordinate system used to describe the motion of the rider relative to thecentre of the boat, as seen from above, looking in the negative z direction. The fixedaxis of rotation for the pendulum motion, seen also in figure 2, can be expressed aseh = sin" ex + cos " ey. The angle " changes as the tug rotates around the z axis.
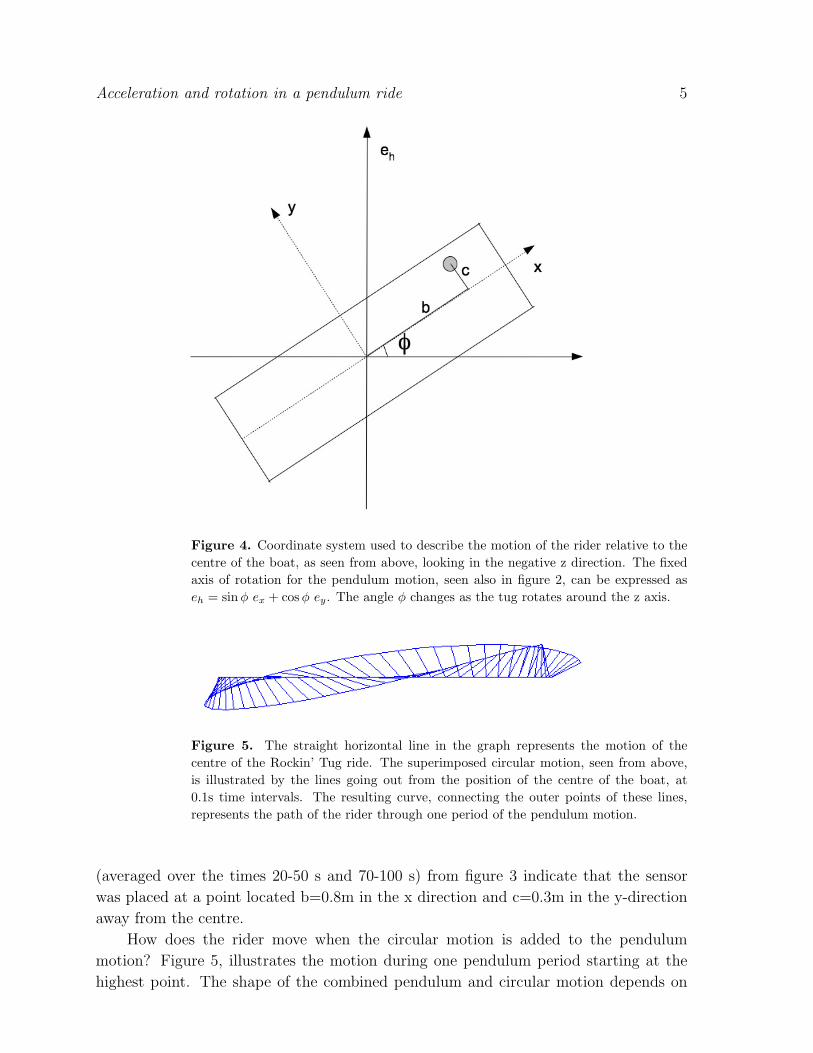
Figure 5. The straight horizontal line in the graph represents the motion of thecentre of the Rockin’ Tug ride. The superimposed circular motion, seen from above,is illustrated by the lines going out from the position of the centre of the boat, at0.1s time intervals. The resulting curve, connecting the outer points of these lines,represents the path of the rider through one period of the pendulum motion.
(averaged over the times 20-50 s and 70-100 s) from figure 3 indicate that the sensor
was placed at a point located b=0.8m in the x direction and c=0.3m in the y-direction
away from the centre.
How does the rider move when the circular motion is added to the pendulum
motion? Figure 5, illustrates the motion during one pendulum period starting at the
highest point. The shape of the combined pendulum and circular motion depends on
Acceleration and rotation in a pendulum ride 6,
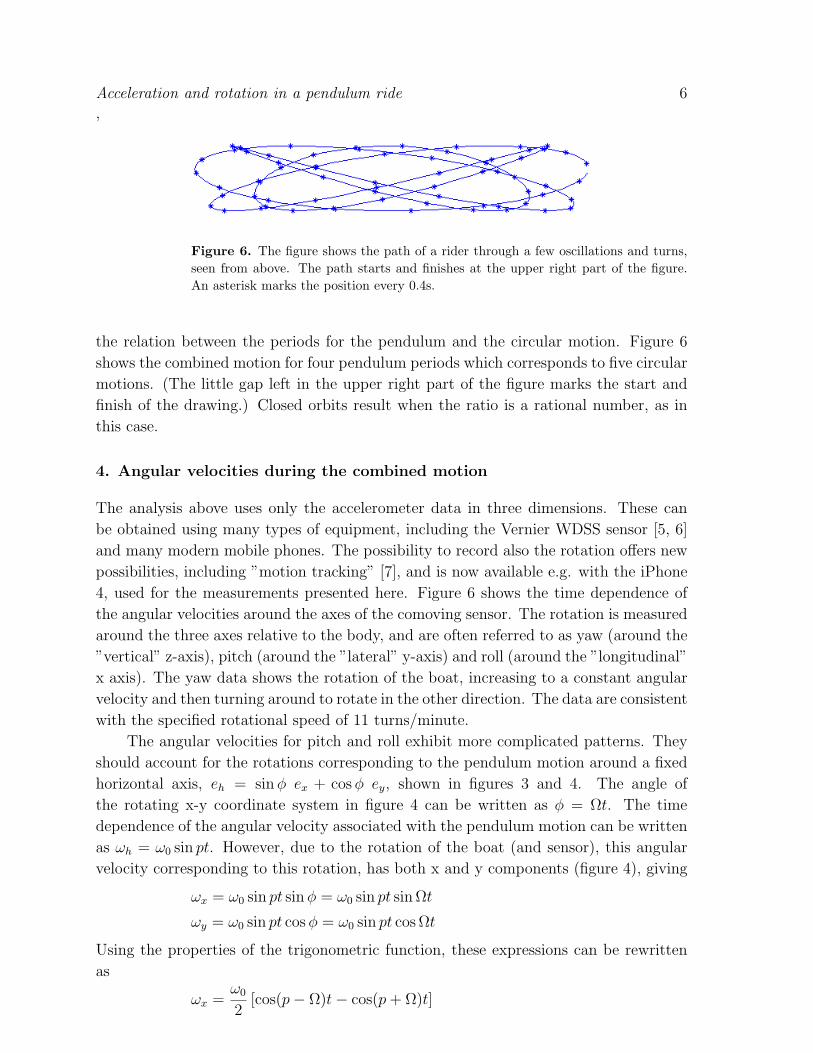
Figure 6. The figure shows the path of a rider through a few oscillations and turns,seen from above. The path starts and finishes at the upper right part of the figure.An asterisk marks the position every 0.4s.
the relation between the periods for the pendulum and the circular motion. Figure 6
shows the combined motion for four pendulum periods which corresponds to five circular
motions. (The little gap left in the upper right part of the figure marks the start and
finish of the drawing.) Closed orbits result when the ratio is a rational number, as in
this case.
4. Angular velocities during the combined motion
The analysis above uses only the accelerometer data in three dimensions. These can
be obtained using many types of equipment, including the Vernier WDSS sensor [5, 6]
and many modern mobile phones. The possibility to record also the rotation o!ers new
possibilities, including ”motion tracking” [7], and is now available e.g. with the iPhone
4, used for the measurements presented here. Figure 6 shows the time dependence of
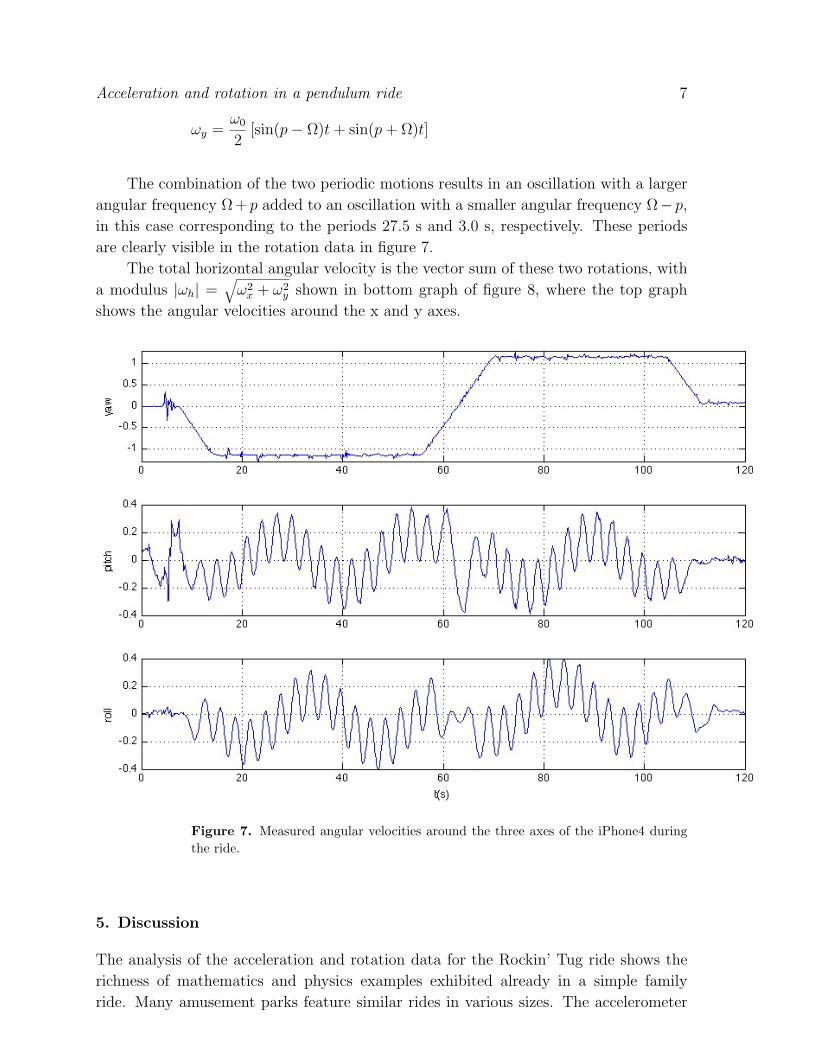
the angular velocities around the axes of the comoving sensor. The rotation is measured
around the three axes relative to the body, and are often referred to as yaw (around the
”vertical” z-axis), pitch (around the ”lateral” y-axis) and roll (around the ”longitudinal”
x axis). The yaw data shows the rotation of the boat, increasing to a constant angular
velocity and then turning around to rotate in the other direction. The data are consistent
with the specified rotational speed of 11 turns/minute.
The angular velocities for pitch and roll exhibit more complicated patterns. They
should account for the rotations corresponding to the pendulum motion around a fixed
horizontal axis, eh = sin # ex + cos # ey, shown in figures 3 and 4. The angle of
the rotating x-y coordinate system in figure 4 can be written as # = #t. The time
dependence of the angular velocity associated with the pendulum motion can be written
as $h = $0 sin pt. However, due to the rotation of the boat (and sensor), this angular
velocity corresponding to this rotation, has both x and y components (figure 4), giving
$x = $0 sin pt sin # = $0 sin pt sin #t
$y = $0 sin pt cos # = $0 sin pt cos #t
Using the properties of the trigonometric function, these expressions can be rewritten
as
$x =$0
2[cos(p! #)t! cos(p + #)t]
Acceleration and rotation in a pendulum ride 7
$y =$0
2[sin(p! #)t + sin(p + #)t]
The combination of the two periodic motions results in an oscillation with a larger
angular frequency #+ p added to an oscillation with a smaller angular frequency #! p,
in this case corresponding to the periods 27.5 s and 3.0 s, respectively. These periods
are clearly visible in the rotation data in figure 7.
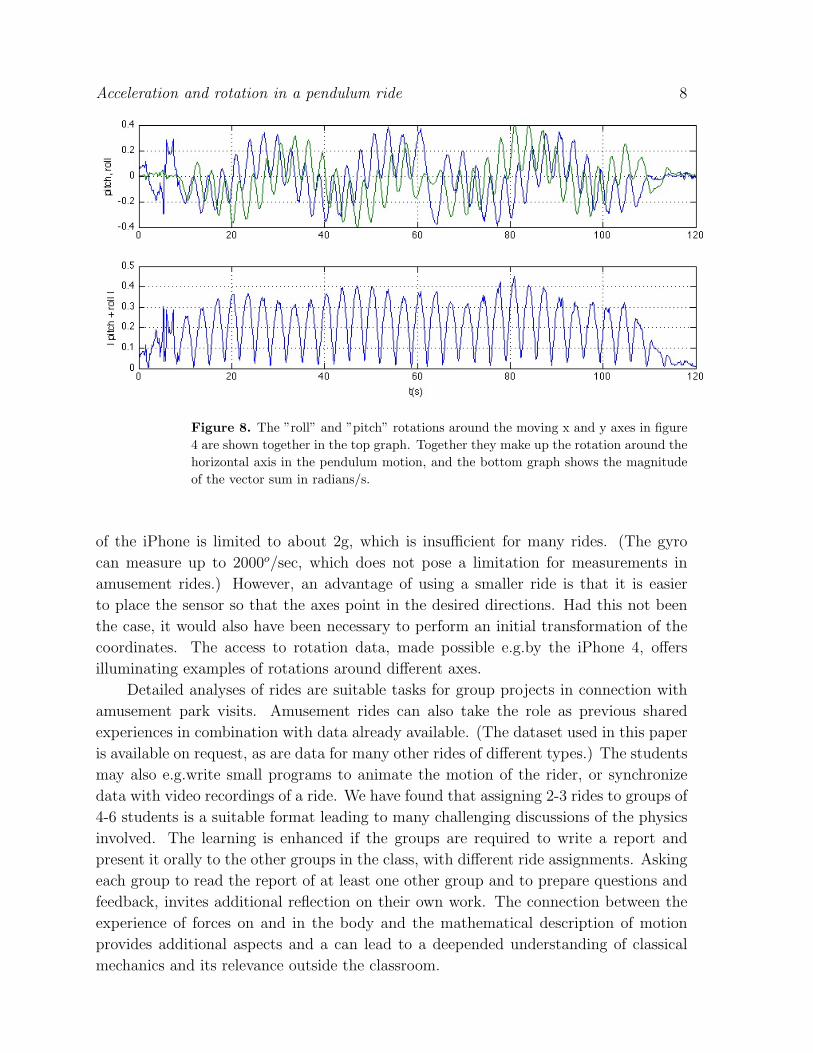
The total horizontal angular velocity is the vector sum of these two rotations, with
a modulus |$h| =!
$2x + $2
y shown in bottom graph of figure 8, where the top graph
shows the angular velocities around the x and y axes.
Figure 7. Measured angular velocities around the three axes of the iPhone4 duringthe ride.
5. Discussion
The analysis of the acceleration and rotation data for the Rockin’ Tug ride shows the
richness of mathematics and physics examples exhibited already in a simple family
ride. Many amusement parks feature similar rides in various sizes. The accelerometer
Acceleration and rotation in a pendulum ride 8
Figure 8. The ”roll” and ”pitch” rotations around the moving x and y axes in figure4 are shown together in the top graph. Together they make up the rotation around thehorizontal axis in the pendulum motion, and the bottom graph shows the magnitudeof the vector sum in radians/s.
of the iPhone is limited to about 2g, which is insu"cient for many rides. (The gyro
can measure up to 2000o/sec, which does not pose a limitation for measurements in
amusement rides.) However, an advantage of using a smaller ride is that it is easier
to place the sensor so that the axes point in the desired directions. Had this not been
the case, it would also have been necessary to perform an initial transformation of the
coordinates. The access to rotation data, made possible e.g.by the iPhone 4, o!ers
illuminating examples of rotations around di!erent axes.
Detailed analyses of rides are suitable tasks for group projects in connection with
amusement park visits. Amusement rides can also take the role as previous shared
experiences in combination with data already available. (The dataset used in this paper
is available on request, as are data for many other rides of di!erent types.) The students
may also e.g.write small programs to animate the motion of the rider, or synchronize
data with video recordings of a ride. We have found that assigning 2-3 rides to groups of
4-6 students is a suitable format leading to many challenging discussions of the physics
involved. The learning is enhanced if the groups are required to write a report and
present it orally to the other groups in the class, with di!erent ride assignments. Asking
each group to read the report of at least one other group and to prepare questions and
feedback, invites additional reflection on their own work. The connection between the
experience of forces on and in the body and the mathematical description of motion
provides additional aspects and a can lead to a deepended understanding of classical
mechanics and its relevance outside the classroom.
Acceleration and rotation in a pendulum ride 9
Acknowledgements
We gratefully acknowledge the support by Liseberg, including ride tickets for the
students in our amusement park projects.
References
[1] O’Reilly R and Weinberg H 2010 The Five Motion Senses: MEMS Inertial Sensing to Trans-form Applications Sensors, http://www.sensorsmag.com/sensors/acceleration-vibration/the-five-motion-senses-mems-inertial-sensing-transform-appli-6533
[2] Chipworks 2010 Teardown of the Apple iPhone 4 Smart Phone,http://www.chipworks.com/en/technical-competitive-analysis/resources/recent-teardowns/2010/06/silicon-teardown-of-the-apple-iphone-4-smart-phone/. The sensor spec-ifications can be found at http://www.st.com/internet/analog/product/218132.jsp andhttp://www.st.com/internet/analog/product/250373.jsp, respectively, for the accelerometerand rotation sensors,
[3] Pendrill A-M and Williams G 2005 Swings and Slides, Physics Education 40 527[4] Zamperla A, Zambelli G and Comand A 2004 Amusement Apparatus, Patent WO2004030781, See
also Zamperla.it who also have short movie of the ride in action.[5] Vernier Wireless Dynamic Sensor System, www.vernier.com/labequipment/wdss.html[6] Pendrill A-M 2008 Acceleration in 1, 2, and 3 dimensions in launched roller coasters, Physics
Education 43 483-491[7] Pendrill A-M and Rodjegard H 2005 A roller coaster viewed through motion tracker data, Physics
Education 40 522-526