Embed Size (px)
Citation preview

1
Grant Agreement N°: FP7-232527 ISSUE CERTIFICATE
SEVENTH FRAMEWORK PROGRAMME EURATOM
Project acronym: CDT
Project full title: Establishment of a Central Design Team (CDT) for a FAst-Spectrum
Transmutation Experimental Facility (FASTEF)
Workpackage No: WP2 Task No: 2.4
CDT Identification: Deliverable D2.4 Revision: 0
ACCELERATOR DESIGN RELATED ISSUES
Authors:
J-L. Biarrotte, L. Perrot, H. Saugnac (CNRS)
A. Ferrari (HZDR) D. Vandeplassche (SCK•CEN)
Type of document: Deliverable
Title: Accelerator design related issues
Dissemination level : CO
Issued by: CNRS
Internal reference by editing partner: -
Status: FINAL
03 February 2012
DATE AUTHOR
J-L. Biarrotte et al. CNRS
TASK LEADER J-L. Biarrotte
CNRS
WP LEADER L. Mansani
ANS
COORDINATOR P. Baeten SCK•CEN

2
TABLE OF CONTENTS
1. INTRODUCTION .................................................................................................................. 3 2. HIGH-ENERGY BEAM LINES REFERENCE LAYOUT ............................................................... 4
2.1 Functions of the beam lines & beam specifications .................................................... 4 2.2 Preliminary conceptual designs ................................................................................... 4 2.3 Reference layout of the FASTEF beam lines ................................................................ 5
3. BEAM DYNAMICS STUDIES ................................................................................................. 8
3.1 Beam line to reactor: nominal beam optics & optical concepts ................................. 8 3.2 Beam line to reactor: tuning method & sensitivity to errors .................................... 13 3.3 Beam line to dump .................................................................................................... 18
4. MAGNETS ......................................................................................................................... 20
4.1 Quadrupoles .............................................................................................................. 20 4.2 Dipoles ....................................................................................................................... 21 4.3 Steering and scanning magnets ................................................................................. 23
5. BEAM INSTRUMENTATON ................................................................................................ 24
5.1 Beam diagnostics overview ....................................................................................... 24 5.2 Beam position monitors and beam profilers ............................................................. 25 5.3 Beam energy and beam current monitors ................................................................ 27 5.4 Beam monitoring on target ....................................................................................... 29 5.5 Halo & beam loss monitors ....................................................................................... 31
6. BEAM LINE DETAILED MECHANICAL DESIGN ................................................................... 34
6.1 Beam line outside the reactor hall (parts 1, 2 & 3) ................................................... 35 6.2 Last magnet zone (part 4) .......................................................................................... 37 6.3 Beam line inside the reactor hall (part 5) .................................................................. 38 6.4 Beam dump casemate (part 6) .................................................................................. 41
7. SHIELDING AND RADIOPROTECTION ASPECTS ................................................................ 43
7.1 Shielding issues around the accelerator .................................................................... 43 7.2 Activation aspects ...................................................................................................... 45 7.3 Optimisation of the beam dump zone ...................................................................... 53
8. ADDITIONAL ISSUES .......................................................................................................... 57
8.1 Adaptation to the final layout ................................................................................... 57 8.2 Safety issues at the accelerator/reactor interface .................................................... 58
9. CONCLUSION .................................................................................................................... 63 ACKNOWLEDGEMENTS ............................................................................................................ 64 REFERENCES ............................................................................................................................. 64
3
1. INTRODUCTION The general goal of the CDT project [1] is to design a FAst Spectrum Transmutation Experimental Facility (FASTEF) able to demonstrate efficient transmutation and associated technology through a system working in subcritical and/or critical mode. This project can be considered as the next logical step after the FP6 IP-EUROTRANS project in the view of the construction of the MYRRHA facility at SCK●CEN Mol (Belgium) that could start in 2015 [2]. Within the CDT project, FASTEF/MYRRHA is being designed with the following objectives: • be operated as a flexible, multi-purpose and high-flux fast spectrum irradiation facility
(Φ>0.75MeV = 1015 n.cm-2.s-1); • be an experimental device to serve as a test-bed for transmutation by demonstrating the
ADS technology and the efficient transmutation of high level waste; • contribute to the demonstration of the Lead Fast Reactor technology, as underlined in the
EURATOM SNE-TP roadmap [3], without jeopardizing the two above objectives. The purpose of CDT Task 2.4 and of this document (Deliverable 2.4) is to specifically focus on the design of the final beam line which aims to transport the 600 MeV, 4 mA proton beam produced by the linear accelerator up to the spallation target located inside the reactor core. This work is based on the conceptual design of the MYRRHA accelerator and associated high-energy line produced within the FP6 EUROTRANS project [4] and being pursued especially through the FP7 MAX project [5,6]. An advanced design of this FASTEF/MYRRHA high-energy beam line is proposed hereafter, including advanced beam optics simulations, description of the main magnets and required beam instrumentation, integration aspects inside the reactor building, detailed mechanical design of the final beam line entry in the reactor hall, vacuum aspects, radioprotection and shielding aspects, and a conceptual design of the 2.4 MW beam dump located at the end of the accelerator tunnel.

4
2. HIGH-ENERGY BEAM LINES REFERENCE LAYOUT
2.1 Functions of the beam lines & beam specifications The high-energy beam lines of the MYRRHA/FASTEF facility have to provide the following functions: • connect the accelerator to the spallation target located inside the reactor core; • guarantee the shape, position, intensity and energy of the beam spot on target; • connect the accelerator to a full-power beam dump; • guarantee reliable and safe operation / maintainability. The proton beam general specifications are the following [4]: • beam energy: 600 MeV; • beam pulse current: 4 mA maximum; • average beam power: 2.4 MW maximum; • beam energy stability: better than ±1%; • beam current stability: better than ±2%; • vertical beam injection from above the spallation target; • beam footprint on the spallation target window: 85mm diameter, “donut-shape”; • beam footprint stability: better than ±10%; • beam reliability: less than 10 beam interruptions longer than 3 seconds during a 3-month
operation period.
2.2 Preliminary conceptual designs A preliminary conceptual scheme of this beam line had been already produced within the EUROTRANS project [7], illustrated in Figure 1. This scheme was especially based on the use of two up and down achromatic beam lines to ensure the beam spot stability on target while avoiding an unaffordable target and reactor core depth.
Figure 1: Conceptual scheme of the ADS final beam line to reactor

5
From this scheme, two conceptual layouts, compatible with the preliminary FASTEF building drawings, have been considered as a starting point for the CDT study (Figure 2). The first conceptual layout consists in keeping both 45° double-deviations, while the second one consists in replacing the final double-deviation by a single 90° magnet, while trying to keep the achromaticity of the whole beam line.
Figure 2: Conceptual layouts of the MYRRHA/FASTEF final beam line to reactor: (up) using four 45° deviations, (down) using two 45° deviations and one final 90° deviation
Preliminary studies have shown that both solutions should be able to ensure correct beam specifications on the spallation target, even if in case N°1, the beam is slightly simpler to tune. On the one hand, the first layout has the advantage to avoid using a very heavy final dipole magnet, and ease the maintenance and decommissioning aspects of such a huge irradiated element. On the other hand, the second layout has the advantage of saving on the number of components, but also on the total height of the reactor building (at least 5 metres, more probably around 10 metres) and on the volume of concrete needed [8]. From this comparison, it was finally decided to take the conceptual layout N°2 as a reference [9].
2.3 Reference layout of the FASTEF beam lines A detailed reference layout of the beam line path through the accelerator tunnel and reactor roof has been defined, including a final 90° deviation on top of the reactor hall. This work has been done in collaboration with the CDT WP3 group (“Plant Requirements”). The beam
N°1
N°2

6
line design described in the following is therefore fully compatible with the drawings of the FASTEF/MYRRHA reactor building1 produced in June 2010 by Empresarios Agrupados [10]. The reference layout of the MYRRHA/FASTEF beam lines to reactor and dump is described on Figure 3. The main characteristics are described here after. More details are given in the following chapters, especially in Section 6 as far as mechanical aspects are concerned.
Figure 3: Layout of the MYRRHA/FASTEF beam lines to reactor and dump.
• Connection is performed with the 600 MeV linac high-energy end at about 38 m from the end of the 300 metres long linac tunnel. The size of this tunnel is supposed to be 3.5 m height by 5 m large, and its floor located at minus 4 metres below ground level. The beam axis is at minus 2.5 meters.
• A set of quadrupoles () is located at the entrance of the line. These 3 focusing
magnets2 will be used to tune the beam on the “object point” (point O) and therefore on the spallation target window (see Section 3 for more details).
• The main line to the reactor is composed of 3 bending magnets in the vertical direction, with bending angles of - 45° (), 45° () and 90°(), 3.2 metres curvature radius, and edges of respectively 22.5°, 22.5° (45° dipoles w/ parallel edges) and 26.565° (doubly focusing 90° dipole). The last 90° bending magnet is located 26.5 m from the target window.
1 This 2010 reactor building design has been very recently modified (end 2011); the beam line reference configuration presented here after, which fits with the “old” 2010 version, will therefore need to be slightly adapted during the future engineering phase. This point is briefly discussed in the last section of the document. 2 3 or 4, tbd during the linac detailed design, to be performed during the FP7 MAX project.
O Couple of H & V steerers

7
• Three quadrupoles triplets are inserted in between () for focusing purposes. All these elements will have a fixed tuning, whatever the desired size of the beam spot on the target or on the beam dump.
• A couple of scanning AC magnets () is located in the upper part of the line, close to
the last magnet, in order to paint the window target with the desired beam footprint. • An additional 20° bending magnet () is used to bend the beam towards the beam
dump. Two associated quadrupoles () are used to strongly defocus the beam and match its size to the dump entrance.
• The beam tube aperture has been set to 100mm diameter, except for the dipole
vacuum chambers (95mm). Several beam diagnostics boxes are present along the beam line (the absolutely mandatory ones are illustrated in green) in order to insert instrumentation devices to tune and monitor the beam behaviour (cf. Section 5). 18 DC dipole steering magnets (in blue) are also available along the path for beam orbit corrections purpose.
• The MYRRHA/FASTEF accelerator is expected to be a beam loss limited machine. In
total, uncontrolled beam losses3 should be (much) lower than 1 nA/m during normal beam operation in the 600 MeV high-energy line. Such values are used for all high power proton accelerators like in SNS [11], because it gives reasonable cool-down times as far as components activation is concerned (see Section 7.2), and thus can allow efficient and safe maintenance.
• As far as vacuum is concerned, pressure level better than 10-7 mbar should be
ensured in the line as much as possible, especially near the superconducting linac region. The main reason is to keep superconducting accelerating cavities under clean vacuum for successful RF operation. Near the target window, this specification can be easily relaxed down to values as low as 10-4 mbar: beam losses due to proton interactions with the residual gas4 are becoming very low at these energies (cross sections for nuclear scattering in the order of 4.10-29 m² and 4.10-30 m² on CO and H2 respectively [12]). The induced beam losses due scattering effects at 10-4 mbar is estimated in the order of about 0.05 nA/m for FASTEF (extrapolated from [13]).
• Finally, in case of accidental conditions (beam hitting the vacuum chamber for
example), the beam should be stopped quickly and reliability enough through the Machine Protection System in order to avoid any machine degradation. The required reaction time will be typically in the order of at least 50 µs [14,15].
3 Beam loss should be mainly due to possible errors and dynamic fluctuations of all the magnetic & electric fields, of the element positions and of the possible beam mismatches, that may induce interception of the beam halo by the vacuum chamber. 4 Mainly Coulomb scattering, other contributions like proton neutralization by charge exchange are negligible.
8
3. BEAM DYNAMICS STUDIES
3.1 Beam line to reactor: nominal beam optics & optical concepts The beam line to reactor has been designed to ensure the following characteristics.
• The beam line provides achromatic properties at first order in position and angle in the bending vertical plane. This ensures that the beam spot position and size at the target are independent from any possible energy jitter and spread.
• Telescopic properties are ensured between the first beam waist (object point O), located before the first bending magnet, and the target (image point) in order to ease the beam spot tuning and increase the robustness of optics.
• The “donut-shape” beam footprint on the window target is achieved using AC scanning magnets that make the beam spot paint the target by a circular movement at frequencies in the order of a few tens of Hz.
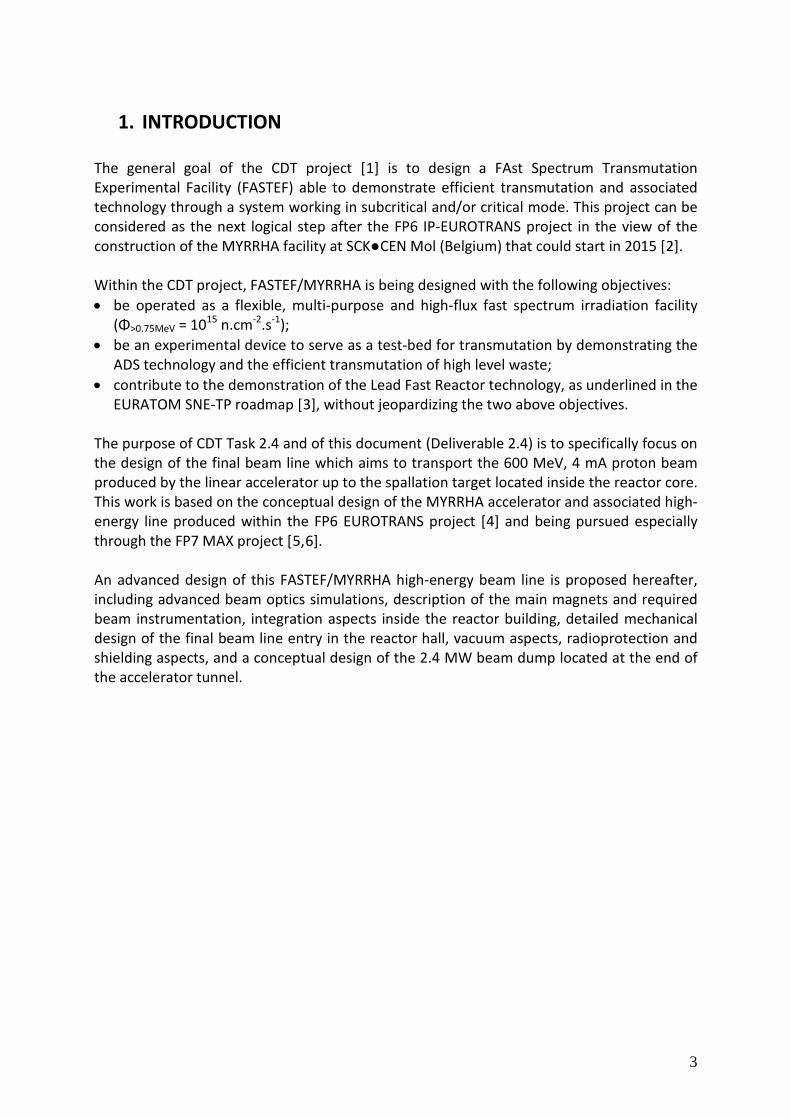
Nominal beam envelopes in the horizontal and vertical planes at a given time (i.e. at given AC scanning magnets fields) are shown on Figure 4. These beam envelopes come from multi-particle simulations (105 particles) and include 99% of the beam particles. Figure 5 and Figure 6 show respectively the input beam distribution (linac 600 MeV output from [4]) and the corresponding beam distribution on target. Negligible emittance growth is observed in the transverse planes, and no beam loss is detected all along the line, as illustrated in Figure 7, except in the last 5 metres where about 13 kW is lost on the vacuum chambers located mainly inside the reactor core5. These simulations are performed using the TraceWin code package developed by CEA [16].
Figure 4: Nominal beam envelopes through the beam line (99% envelopes @3σ)
5 These losses are maximum near the window target location (loss power density of about 2W/cm² on the first 10cm of the tube) and are decreasing exponentially with distance going away from the window.
Object point O

9
Figure 5: Input beam distributions at the line entrance; emittances (norm. RMS): εx = 0.242 π.mm.mrad, εY = 0.234 π.mm.mrad, εz = 0.291 π.mm.mrad.
Figure 6: Output beam distributions on target; emittances (norm. RMS): εx = 0.247 π.mm.mrad, εY = 0.239 π.mm.mrad, εz = 0.378 π.mm.mrad.
Target window zone

10
Figure 7: Beam particle density along the beam line:
13 kW (over 2.4 MW) is lost mainly on the beam tubes located below the reactor cover. Along the final drift length located inside the reactor hall and vessel, about 25 metres long, neither focusing element nor classical instrumentation device can be placed (highly irradiated zone). Due to this very long “naked” drift length, the position of the beam spot on target is therefore very sensitive to any field or input beam variation, as shown in Section 3.2. It is therefore mandatory to ensure that the line is fully achromatic at first order to minimize any beam spot movement due to beam energy jitter, which is expected to be in the order of ±1 MeV6 (i.e. far below the ±1% specification). The achromaticity of the beam line is ensured by design, cancelling the dispersive terms of the vertical transport matrix along the final drift length (T36 = T46 = 0). Figure 8 shows the behavior of the dispersion function along the line, showing no dispersion at the target position. Dispersion is also minimized at the dipole locations so as to minimize as much as possible the beam path extension inside the magnets. On the other hand, dispersion is maximum between the bending magnets: in this region appropriate safety collimators (see Section 5) are used to check every abnormal energy variation, and trigger a safety beam shutdown if the beam energy jitter exceeds for example ±0.5%, i.e. ±3 MeV, as illustrated on Figure 9.
Figure 8: Vertical dispersion function along the beam line.
6 This value comes from a preliminary error study performed on the present MYRRHA linac layout; this ±1 MeV jitter is due to dynamic variations of accelerating fields and phases of respectively ±0.5% and ±0.5° (total).
13 kW

11
Figure 9: Nominal 99% envelopes for a beam energy offset of +0.5% (+3 MeV): the beam is stable on target,
and can be intercepted by collimators to trigger a safety feedback system. The beam line tuning has to provide a beam spot radius on target of about 9 mm rms. Due to the very poor beam instrumentation in the final part of the line, it is very interesting to be able to provide this beam spot size by design, so as to ease the tuning process and increase the robustness of the optics. Therefore, telescopic properties have been included in the line design: in both planes, an object/image optical system is ensured (T12 = T34 = 0) between the first beam waist of the line (point O) and the target point, with an enlargement factor of 9 (T11 = T33 = 9). These properties ensure by construction that the size at the target is always nine times7 the beam size at point O (see Figure 10).
Figure 10: RMS beam envelopes for different tunings of the very first quadrupoles to provide a beam waist at point O of 0.66 mm RMS (left), 1mm RMS (center, nominal case), and 1.5 mm RMS (right); all other magnets
tuning remain identical.
7 Valid at first order and considering negligible space charge effects, which is actually not fully the case for FASTEF (additional slight tuning adjustements are needed). Also note that the enlargement factor of 9 can be quite easily modified if necessary by an adequate retuning of the quadrupoles of the line.
Safety collimators
Safety collimators

12
With such a solution, once the commissioning achieved, the tuning of the beam spot on target is therefore simply achieved by tuning the first quadrupoles of the line to obtain a 9 times smaller beam size at point O, i.e. ±1mm RMS in the nominal case. This solution also generally brings a lot of simplicity and flexibility in the beam spot tuning range, as illustrated in Figure 10. Natural defocusing is thus used in the last straight line to get the desired beam spot size of 9 mm radius RMS, and from this, the required “donut-shape” footprint is then obtained by raster scanning, using a (possibly redundant) set of fast steering magnets operated at frequencies of several tens of Hz (frequency still to be defined), and acting in the two transverse directions. These AC magnets are located between the two last quadrupoles of the line and fed with a sinusoidal signal at constant frequency. They continuously deviate the central trajectory of the beam so that the ±9 mm RMS beam spot on target is moved around the window centre in a circular pattern of radius 20 mm. The obtained beam power density at the window surface is therefore quasi-uniform in the rotation direction, and keeps the natural beam gaussian profile in the radial direction, leading to the required “donut-shape” mean beam footprint (see Figure 11).
Figure 11: (left) Beam spot movement on target; (right) Mean beam power density before impinging the window surface (for a 2.4 MW beam)
Such a solution is very simple and reliable. Similar developments have been for example successfully applied at GSI in Germany for cancer therapy with ion beams [17] and through the R&D programs undertaken in the U.S. for the APT and ATW projects [18]. Alternative solutions have been also investigated, especially trying to use an octupole-based expander system. Such a system is able to provide a circular confined homogeneous beam density distribution [19] that could in principle be acceptable for the FASTEF target window. Such a system would avoid the use of AC magnets, but is extremely sensitive to any beam misalignment or size variation. Moreover, it usually produces a lot of beam halo and therefore needs to be located very near the target, which is impossible in our case because
Target window zone
Beam spot movement

13
of the constraints related to the reactor hall. A first tentative study quickly confirmed that such a solution can’t be reasonably envisaged for the MYRRHA/FASTEF [20].
3.2 Beam line to reactor: tuning method & sensitivity to errors A tuning scheme has been studied in order to be able to match the beam in the transport line in all cases, especially taking into account the possible field errors or misalignments. This has been done using the Tracewin code, which is able to simulate “close to real” beam tuning procedures by modelling virtual beam diagnostics along the line. The basic tuning method is the following:
• Step #1: set the magnets to their theoretical value (from simulation code) & send a very low duty cycle beam (typically 10-4).
• Step #2: adjust the beam centre trajectory by tuning the different DC steerer magnets along the line in both planes; this orbit correction system is performed step by step, two couples of steerers (H&V) being tuned to align the beam centroid at the two following Beam Position Monitors (BPM).
• Step #3: readjust the gradients of the first quadrupoles triplet – if needed – to tune a
beam waist at the object point O, with the desired size (1mm rms in the reference case); this is performed using three beam profilers (one at point O and two others located at about 4 metres on both sides).
• Step #4: readjust the gradients of the 2 quadrupoles triplets located in the dispersive
region to optimize the achromaticity of the line; this is performed by varying the fields of all the magnets located in the double-deviation (or by varying the beam rigidity) up to typically 0.5%, and check that the beam is still aligned at the exit, i.e. after the last dipole magnet (using a BPM) and on target (using mainly an optical diagnostic system, plus possibly some beam halo monitors).
• Step #5: readjust the gradients of the second quadrupoles triplet located in front of
the first dipole magnet to fine tune the telescopic properties of the line and therefore the desired beam size on target (9mm rms in the reference case); this is performed using the same near-target optical system as in Step #4.
• Step #6: switch on and tune the AC steerer magnets to create the desired beam footprint on target; here again, this is done using the near-target optical system8.
8 We want to stress that this near-target diagnostic system, described in Section 5, has a crucial role in both the tuning of the line and the monitoring of the beam footprint on target. In the present design, the presence of this element is mandatory in order to be able to send some beam on the spallation target.

14
• Step #7: finally, the beam duty cycle is increased step by step up to the 100% nominal value by using the pulsing elements (a priori a chopper) located in the low energy beam transport line of the accelerator; rising up the mean power, the monitoring of the beam then exclusively rely on non-interceptive diagnostics (BPM, current monitors), on halo monitors and on the near-target optical device.
In order to estimate the sensitivity of this tuning scheme to errors, the influence of random perturbations on the beam losses and on the beam properties on target has been assessed by the means of Monte Carlo computations , following the method described in [21]. Two kinds of errors are considered: the “corrected errors” and the “uncorrected errors”. The “corrected errors” are static errors that are randomly applied to the different elements before simulating the tuning of the line. They are therefore detected during the beam tuning procedure and minimized up to the accuracy of the involved diagnostic elements. Once the line is tuned, additional “uncorrected errors” are then applied randomly. These errors, that are therefore totally uncompensated, typically correspond to dynamic fluctuations of the magnetic fields or to mechanical vibrations, and are hopefully usually one order of magnitude lower than static errors. Each batch of such random errors thus corresponds to the simulation a given beam line configuration. Several iterations – a few hundred typically – are then needed to get good statistics. In the first step of the study, the statistical influence of each error is studied separately and amplified until an unacceptable threshold is reached. The different types of errors considered are displacements (which induce static or dynamic misalignments or tilts), field or gradient errors for magnets, and input beam errors. This first step allows quantifying how much each error influences the beam quality. In a second step, all the errors are then combined with an adequate weighting, taking into account the relative sensitivities and the capacity to respect the induced tolerances. From this analysis, the maximum amplitudes considered for each error and the accuracy taken into account for diagnostic measurements are summarized in Table 1 and Table 2.
Table 1: Amplitude of errors for the magnets and the input beam
Magnets errors Static Dynamic Dipole field ± 0.1 % ± 2.10-5 Dipole displacement ± 0.3 mm ± 10 µm Quad. gradient ± 1 % ± 0.1 % Quad. displacement ± 0.3 mm ± 10 µm Input beam errors Static Dynamic Position ± 2.0 mm ± 0.1 mm Divergence ± 0.2 mrad ± 0.01 mrad Energy - ± 1.0 MeV Emittance ± 10% ± 1% Mismatch factor ± 10% ± 1% Intensity ± 50 µA ± 50 µA

15
Table 2: Accuracy of beam diagnostics
Measurement Accuracy Beam position (BPM, near-target device) ± 0.5 mm Beam rms size (profilers, near-target device) ± 0.5 mm
The statistical error study has been performed simulating 100 different line configurations, each one with a tracking involving 105 macro-particles. This is quite insufficient to get to definitive conclusions9 (there are about 108 protons per bunch in the MYRRHA beam), but gives already good orders of magnitude for the required tolerances and a good feeling of the general situation. Figure 12 shows the obtained mean beam orbit along the line and its RMS deviation, from the 100 simulated random cases. No systematic deviation is observed, except of course the final deviation due to the AC steerers painting the target (simulated at maximum deviation in the horizontal direction in this case). The RMS deviation of the orbit is globally well contained in the horizontal plane, but can get rather high in the dispersive vertical plane, mainly due to beam energy fluctuations and jitters (± 1 MeV). Besides this main contribution, the other relevant errors impacting the orbit excursion through the line are (sorted by hazard level): BPM measurement accuracy (± 0.5 mm), magnets alignment (± 0.3 mm), dipoles field fluctuations (± 2.10-5).
Figure 12: (Up) Mean proton beam orbit in both planes (from 100 cases);
(Down) Proton beam orbit RMS deviation in both planes (from 100 cases).
9 We are anyway not presently able to produce definitive conclusions on this “error study” topic since the upstream accelerator is not yet included in the simulations; this “start-to-end” work should be performed within the MAX project in 2012 and 2013.

16
At the target location, the RMS deviation doesn’t exceed 2mm in both planes, which is considered as acceptable, given the general specifications on the global beam footprint size (± 10%). It is nevertheless important to underline that due to the very long final naked drift, the beam spot position is extremely sensitive to almost all dynamic fluctuations, leading to very severe specifications, especially on the input beam jitters (and therefore on the upstream linac beam stability) and on the dipoles field stability (especially the last one). The main errors impacting the beam position on target are (sorted by hazard level): input beam divergence jitter (± 0.01 mrad), input beam position jitter (± 0.1 mm), dipoles field fluctuations (± 2.10-5), quadrupoles mechanical vibrations (± 10 µm), input beam energy jitter (± 1 MeV), dipoles mechanical vibrations in Y (± 10 µm). As far as beam sizes are concerned, the situation is satisfactory without requiring very severe specifications. The targeted RMS beam size is reached (9mm) and the RMS deviation doesn’t exceed 1 mm RMS, as shown in Figure 13. The main errors impacting the beam spot size on target have been found to be: quadrupoles gradient fluctuations (± 10-3), input beam energy jitter (± 1 MeV), profile measurement accuracy (± 0.5 mm).
Figure 13: Distribution of the obtained beam RMS sizes on target (from 100 cases).
Figure 14 represents the obtained beam particle density probability in the case of errors. No dramatic beam loss is noticed along the line. In only one case (over 100), some beam loss are experienced on the first collimator of the dispersive section (Pmax = 29 kW, leading to Pmean= 0.3 kW & PRMS = 3kW). We are quite confident that this singularity is not alarming, but this will have to be validated in the future by a final start-to-end error study with more statistics.
Figure 14: Beam particle density probability in the case of errors (from 107 particles in total):
- some beam can be lost a collimator (PRMS=3kW); - systematic losses happen inside the reactor cover (PRMS=14kW).
14 kW rms 3 kW rms

17
On the other hand, systematic beam losses are experienced, as expected, in the final metres of the line and especially inside the reactor vessel itself. The power deposited in this region varies from roughly 1 to 100 kW, the mean value being 15 kW and the RMS one 14 kW. These values are very similar to the nominal ones shown in Figure 7, giving good confidence that this deposited power will be in 99% of the cases lower than 50 kW (about 3 times the RMS value)10. These values still correspond to the case of a 2.4 MW beam. Figure 15 represents the beam spot mean footprint obtained from the 100 different random simulations with errors, compared to the nominal one. The 99% spot size is only increased by less than 3%, giving very good confidence that the specification on the beam footprint stability (±10%) will be reached.
Figure 15: Beam footprint in front of the window target for the nominal case (left) and with errors (right), in
exponential (up) and linear (down) representation. The 99% beam spot size (thin dark circle) is respectively 605mm2 (left) and 618mm2 (right).
The thick dark circle represents the tube size at the window location. 10 If these losses appear to be problematic (for thermal reasons on the tubes or for proton current stability reasons in the core), they can be minimized by lowering the fields of the AC steering magnets so as to reduce the whole beam footprint on target. This will of course slightly increase the power densities on the window.

18
3.3 Beam line to dump The goal of the line to the full power beam dump is to perform the tuning of the accelerator without sending the beam in the reactor. This line will be used in the early commissioning phase, in all tuning and power ramping up phases, and more generally to “practice” as often as possible the 2.4 MW beam to get some feedback for reliability improvements. The beam line to dump shares the first part of the line to reactor up to the first 45° bending magnet, which is switched off in this case. From here a dedicated 20° dipole magnet is used to both bend the beam towards the dump casemate and intercept the backward neutrons coming from the dump itself (see section 7.3). Two quadrupoles are then used to strongly defocus the beam and match its size to the dump aperture (210 mm diameter). The length from the entrance of the 45° dipole to the dump entrance is about 15 metres, the last 6 metres being located inside the dump casemate and requiring a larger tube aperture (240mm diameter instead of 100mm). The beam dump itself (see section 6.4) is inspired from the PSI 1 MW copper one [22]; it is supposed to be about 3 metres long. The tuning of the shared part of the line (i.e. the two first quadrupole triplets and the associated DC steerers) remains strictly identical than in the case of a beam transport to reactor. Behind it, the 45° dipole is switched off, the 20° dipole is switched on, and the gradients of the last quadrupoles doublet is adjusted to get the desired beam size at the dump entrance. This is made using a beam profiler located before the casemate entrance, and a set of halo monitors located in front of the beam dump and possibly inside, in between its different sections. Two correction steerers, located before and after the first quadrupole, are also used to adjust the beam centroid on target using the same beam diagnostics together with a BPM. The 99% nominal beam envelopes are shown on Figure 16. Figure 17 shows the profile of the beam losses inside the casemate and especially inside the beam dump itself. The obtained values roughly correspond to a maximum beam power density at the beam dump surface of about 2 to 3 kW/cm2. From these preliminary results, a complete design including 3D thermal analysis will have to be carried out, given that the range of 600 MeV protons in copper is about 25 cm.
Figure 16: Nominal beam envelopes trough the beam line to dump (99% envelopes @3σ).

19
Figure 17: Beam losses profile inside the casemate at the dump surface.

20
4. MAGNETS
4.1 Quadrupoles The main role of the 14 (or 1511) quadrupole electromagnets is to properly focus the beam along the line. All these magnets are identical (named “Q-50” in Table 3), except the two quadrupoles located inside the line to dump (named “Q-100”) which require higher focusing power. Very conservative gradients are assumed along the main line so as to increase the reliability of operation. These magnets are therefore comfortably long compared to their aperture diameter, that should minimize the end effects due to fringe fields if properly designed.
Table 3: Preliminary specifications & characteristics for the quadrupole magnets. Q-50 Q-100 Number 12 or 13 2 Length 50 cm 100 cm Pole aperture diameter 110 mm 110 mm Max. gradient 3 T/m 10 T/m Max. field on pole 0.165 T 0.550 T Max. excitation per coil 3615 A.tr 12040 A.tr Estimated weight about 0.4 t about 0.8 t Good field region ± 30 mm ± 30 mm Gradient homogeneity & stability < ± 10-3 tbd Alignment tolerances ± 0.3 mm tbd Position dynamic stability < ± 10 µm tbd Such magnets are very conventional. The magnet core typically consists of four hyperbolic steel poles around which coils are inserted together with power and water connections. For reliability aspects, it is recommended to try to favour in the coils moderate current densities (typically between 2 and 10 A/mm2) and reasonable pressure levels for the demineralised water cooling system (less than 10 bars if acceptable). Each magnet will be fed by its own power supply, which should include the necessary redundancies to improve reliability. Finally, it is also recommended to select radiation-hard materials for both the magnet core (e.g. low carbon steel) and the coils, especially for the quadrupoles located in the dump line. From these preliminary elements, a detailed magnetic and engineering design of these magnets should be performed before construction. The MYRRHA/FASTEF quadrupoles could be rather similar to the ones used in the SNS ring and high-energy lines (cf. Figure 18).
11 14 or 15, depending of the final choice for the first triplet/quadruplet.

21
Figure 18: Quadrupole magnet used in the SNS ring and high-energy beam lines (21 cm aperture diameter, 50 cm long, max. gradient 4.7 T/m, copper coils).
4.2 Dipoles The main role of the 4 dipole bending electromagnets is to properly guide the beam towards the reference trajectory. Given the 600 MeV proton beam rigidity (about 4 T.m), a rather large bending radius (3.2 metres) has been chosen to ensure conservative magnetic field levels and increase the overall reliability. Three different magnet types are needed: the 20° dipole for the beam line to dump (named “D-20” in Table 4), the 45° ones (named “D-45”) with parallel edges, and the last 90° double-focusing dipole (named “D-90”) that is probably the most challenging one.
Table 4: Preliminary specifications & characteristics for the dipole magnets. D-20 D-45 D-90
Number 1 2 1 Plane of deviation H V V Bend angle 20° 45° 90° Bending radius 3.2 m 3.2 m 3.2 m Nominal magnetic field 1.27 T 1.27 T 1.27 T Gap 100 mm 100 mm 100 mm Edge angles 0° 22.5° 26.565° Nominal excitation per coil 50530 A.tr 50530 A.tr 50530 A.tr Estimated weight about 10 t about 20 t about 40 t Good field region ± 20 mm ± 20 mm ± 25 mm Field homogeneity & stability tbd < ± 2.10-5 < ± 2.10-5 Alignment tolerances tbd ± 0.3 mm ± 0.3 mm Position dynamic stability tbd < ± 10 µm < ± 10 µm
22
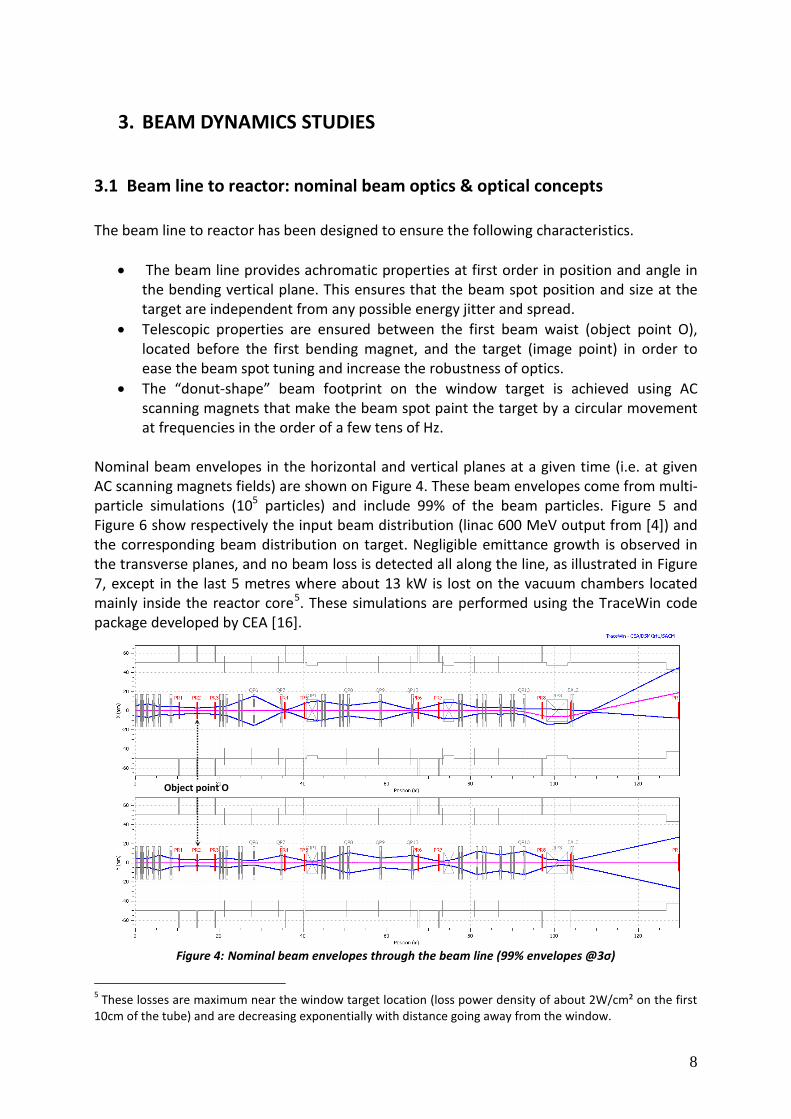
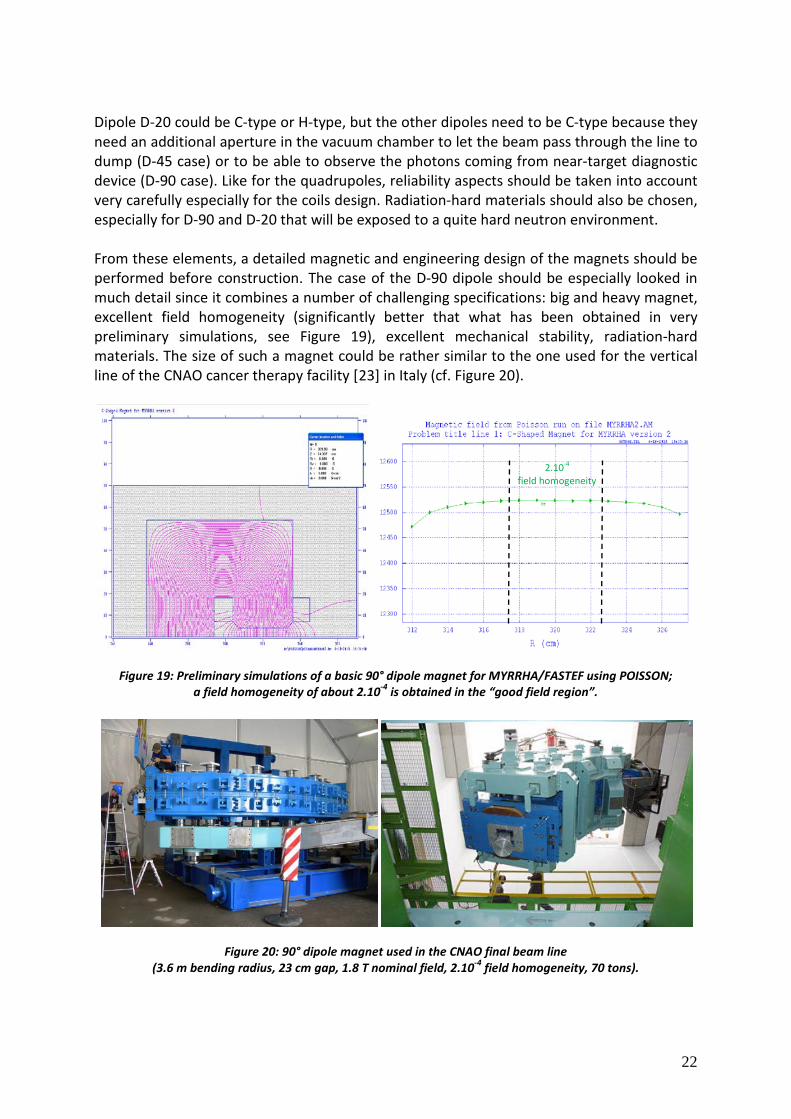
Dipole D-20 could be C-type or H-type, but the other dipoles need to be C-type because they need an additional aperture in the vacuum chamber to let the beam pass through the line to dump (D-45 case) or to be able to observe the photons coming from near-target diagnostic device (D-90 case). Like for the quadrupoles, reliability aspects should be taken into account very carefully especially for the coils design. Radiation-hard materials should also be chosen, especially for D-90 and D-20 that will be exposed to a quite hard neutron environment. From these elements, a detailed magnetic and engineering design of the magnets should be performed before construction. The case of the D-90 dipole should be especially looked in much detail since it combines a number of challenging specifications: big and heavy magnet, excellent field homogeneity (significantly better that what has been obtained in very preliminary simulations, see Figure 19), excellent mechanical stability, radiation-hard materials. The size of such a magnet could be rather similar to the one used for the vertical line of the CNAO cancer therapy facility [23] in Italy (cf. Figure 20).
Figure 19: Preliminary simulations of a basic 90° dipole magnet for MYRRHA/FASTEF using POISSON; a field homogeneity of about 2.10-4 is obtained in the “good field region”.
Figure 20: 90° dipole magnet used in the CNAO final beam line (3.6 m bending radius, 23 cm gap, 1.8 T nominal field, 2.10-4 field homogeneity, 70 tons).
2.10-4 field homogeneity
23
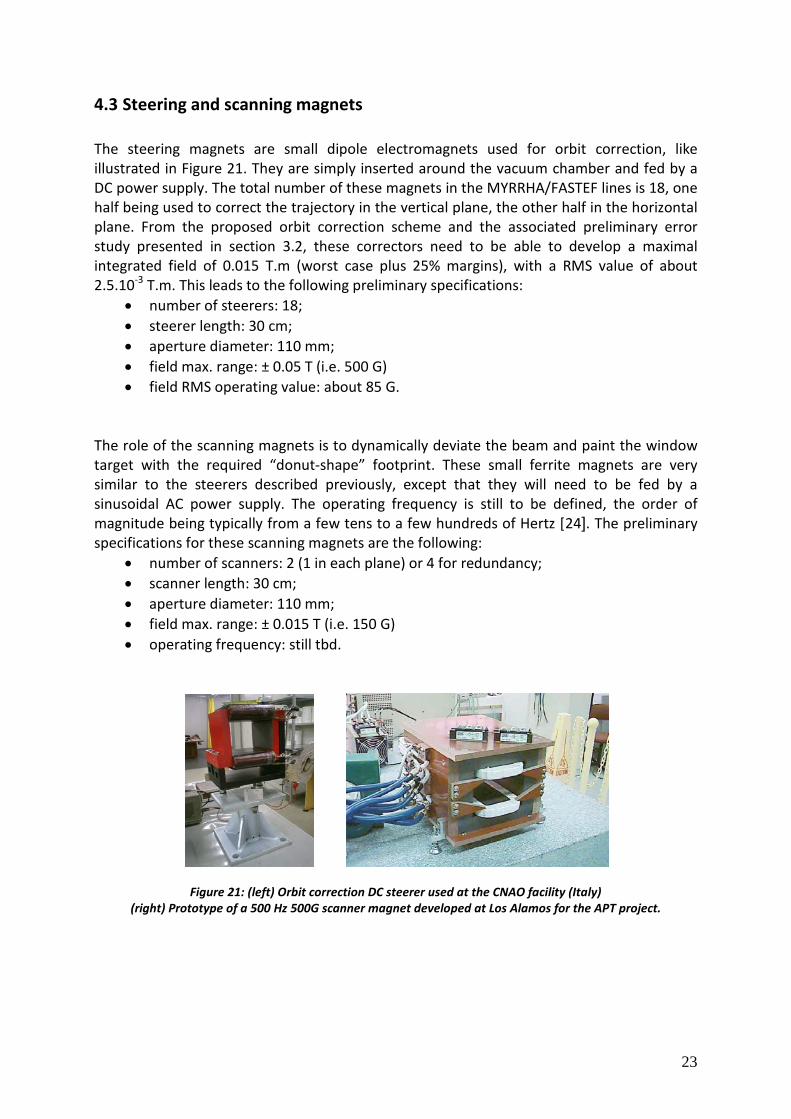
4.3 Steering and scanning magnets The steering magnets are small dipole electromagnets used for orbit correction, like illustrated in Figure 21. They are simply inserted around the vacuum chamber and fed by a DC power supply. The total number of these magnets in the MYRRHA/FASTEF lines is 18, one half being used to correct the trajectory in the vertical plane, the other half in the horizontal plane. From the proposed orbit correction scheme and the associated preliminary error study presented in section 3.2, these correctors need to be able to develop a maximal integrated field of 0.015 T.m (worst case plus 25% margins), with a RMS value of about 2.5.10-3 T.m. This leads to the following preliminary specifications:
• number of steerers: 18; • steerer length: 30 cm; • aperture diameter: 110 mm; • field max. range: ± 0.05 T (i.e. 500 G) • field RMS operating value: about 85 G.
The role of the scanning magnets is to dynamically deviate the beam and paint the window target with the required “donut-shape” footprint. These small ferrite magnets are very similar to the steerers described previously, except that they will need to be fed by a sinusoidal AC power supply. The operating frequency is still to be defined, the order of magnitude being typically from a few tens to a few hundreds of Hertz [24]. The preliminary specifications for these scanning magnets are the following:
• number of scanners: 2 (1 in each plane) or 4 for redundancy; • scanner length: 30 cm; • aperture diameter: 110 mm; • field max. range: ± 0.015 T (i.e. 150 G) • operating frequency: still tbd.
Figure 21: (left) Orbit correction DC steerer used at the CNAO facility (Italy) (right) Prototype of a 500 Hz 500G scanner magnet developed at Los Alamos for the APT project.

24
5. BEAM INSTRUMENTATON
5.1 Beam diagnostics overview Beam diagnostics and control systems will be deployed all along the final beam transport line in order to tune the beam, maintain normal operation according to specifications, and protect the beam line equipments in case of malfunctioning. On-line measurement of the beam intensity will be performed with beam current monitors that should be able to provide a better than 1% accuracy, and beam loss monitors will be used to trigger interlocks that should switch off the accelerator beam in much less than a millisecond. In order to monitor and survey the beam footprint on target, an optical system similar to the VIMOS monitoring system developed at PSI [25] is necessary and will need dedicated R&D to be adapted to the MYRRHA case; in addition, a couple of halo scrappers and wire profilers should also be used if possible (this will probably not be the case) in the last straight section for redundancy. Right after the last bending magnet (but still outside the reactor hall), halo monitors should be placed to check that the beam is correctly centered, and that its size is roughly correct. Finally, various standard beam diagnostics (position and size) need to be installed along the line to check the first tunings in the commissioning phase, or after a maintenance restart. Instrumentation diagnostics role and associated number along the beam line can be summarized in Figure 22 and Table 5.
Figure 22: Main beam diagnostic devices along the MYRRHA/FASTEF beam lines.
BPM + profiler
Near-target profiler
ToF electrodes
Current monitors
Halo monitors

25
Table 5: Diagnostics type and usage for the MYRRHA/FASTEF beam transfert line.
Diagnostic name Quantity Setup / Tuning
Beam adjust Machine protection
Wire profile 12 to 15 XBPM 12 to 15 X X tbdCurrent monitor 2 to 6 X X XHalo monitor about 13 X XIonisation chamber at least 6 X XTime of flight monitor 1 X tbdNear target profiler 1 X X x
Role
5.2 Beam position monitors and beam profilers Between 12 and 15 beam position monitors (BPM) are needed, as illustrated in Figure 22 (the non-mandatory ones are illustrated with dashed arrows). They are mainly used during the beam line tuning phase in order to monitor the beam position and adjust the beam centroïd orbit, but they also can serve during operation to detect abnormal beam positions and trigger the machine protection system. BPM can be done using capacitive pick-ups or magnetic loops symmetrically arranged in the pipe wall, that detect the electric or magnetic field induced by the beam. Compared to electric BPM, the magnetic system has the advantage to be insensitive to secondary emission. The system is robust and the achieved position resolution can be as low as 0.1 mm for beam intensities down to 5 µA; the measurement can therefore be very precise for high intensities. The collected BPM signal then needs to be processed and sent to a software analysis programme able to calculate and modify the currents applied to the steering magnets of the beam line. Figure 23 shows the example of a magnetic BPM used at PSI.
Figure 23: Picture of the magnetic beam position monitor used at the PSI facility. The picture shows the system mounted in the diagnostics box.

26
Beam profile monitors are especially needed during the tuning phase in order to monitor the beam size and adjust the quadrupole magnets to be in agreement with the theoretical beam line calculations. These are generally interceptive devices that therefore need to be operated only at very low duty cycle beam. Two types of profilers could typically be used in the MYRRHA/FASTEF case. • The first solution is the electron secondary emission profile detector. It is composed with
an horizontal and a vertical grid of thin metallic wires, that intercept the beam and emit electrons. The generated current is then measured on each wire to be able to reconstruct the beam profile in each plane. Figure 24 shows the detector used along the beam transfer line at the SPIRAL2 facility [26]. With this type of detector, the beam interception is relatively low. It can work with a large beam range, and its bandwidth can be higher than GHz. The beam size precision is more or less limited to 0.2-0.5 mm.
• Another solution can be the wire scanner (see also Figure 24). Conventional wire scanners with thin solid wires (conventional compared with new techniques using, for example, lasers) are widely used for beam size measurements in particle accelerators. This solution allows having very precise beam size measurements. The principle of the system is the following: a wire passes through the beam transversally and the induced current in the wire gives the beam profile. The wire speed is around 0.2-1.0 m/s. Wire material depends on beam energy and intensity (typically a few tens microns of carbon or molybdenum).
Figure 24 : (left) The SPIRAL-2 secondary emission profiler (150 µm tungstem wires) with its propiler.
(right) A wire scanner with its mechanical system.

27
It is proposed to perform the measurements of the beam positions and profiles in both transverse directions at the (almost) same location using a dedicated diagnostics box. This approach is relatively classical.
5.3 Beam energy and beam current monitors The beam energy can be provided using the time of flight (ToF) technique, using a classical arrangement of three pick-up capacitive electrodes (see Figure 25). The pick-up electrodes don’t have any effect on the beam. They only measure the electric field associated to the beam and are therefore also able to give information on the beam phase. The distance between electrodes depends mostly on the beam speed, the repetition rate and the precision needed. The length 𝐿 between the two main electrodes must be sufficiently high to get the desired energy accuracy (𝜕𝐸/𝐸). This condition can be easily derived as:
𝐿 >(𝛽𝛾)3
𝛾 − 1�𝜕𝐿𝛽
+𝑐𝛿𝜑2𝜋𝑓
�1
(𝜕𝐸 𝐸⁄ )
𝜕𝐿 is the length uncertainty, 𝜕𝜑 the phase measurement accuracy, 𝑓 the beam frequency and 𝛽 and 𝛾 the beam reduced velocity and energy. In the FASTEF/MYRRHA case (𝛾 = 1.64, 𝛽 = 0.7925, 𝑓 = 176 𝑀𝐻𝑧), and considering 𝜕𝐿 = 0.5 𝑚𝑚 and 𝜕𝜑 = 1°, a length of about 20 metres is needed to obtain (𝜕𝐸/𝐸)<10-3. Note that this distance is usually constrained by the accuracy of the phase measurement. The third pick-up electrode must be located near the first one (less than 1 meter in our case) to allow determining the number of bunches between two main pick-ups.
Figure 25: ToF pick-up system for the SPIRAL2 linac (diameter: 80 mm, length: 30 mm) [27] The beam energy can be monitored continuously using this technique. Complementary beam energy stability measurements can also be derived using a BPM located at horizontal waist location inside the dispersive section. We have access in this case to the momentum variation according the stability of the dipole.

28
The monitoring of the beam current is fundamental, both for the reactor point of view and for accelerator operation aspects. From this measure, it is possible to derive the beam power at various beam line position and also the beam transmission. This knowledge can also be linked to the beam losses level and to the machine protection system. At least two beam current monitors are required for the MYRRHA/FASTEF lines, but it is recommended to have some more (up to 6) for redundancy and safety aspects. This type of measurement can be provided using for example (see Figure 26) a TM01-mode coaxial resonator like at the PSI facility [28]. The magnetic field in the resonator thus provides a direct measurement of the beam current. The monitor is made of aluminum, with a 10μm coating layer of silver to improve the electrical conductivity.
Figure 26: Drawing and photo of the current monitor used at PSI facility. At the SPIRAL-2 facility, the beam current is provided by two type of analyses [29]: the AC and the DC current transformers (DCCT and the ACCT techniques), able to measure the average beam current and the bunch current respectively. Bergoz Instrumentation proposes a full system named New Parametric Current Transformer (NPCT). It works on the principle of the zero-flux DC current transformer. The DC component of the current flowing through the toroïd sensor is detected by a magnetic modulator also called fluxgate or second harmonic detector. The AC component is detected by an AC Hereward transformer. The two circuits are cascaded in a common feedback loop to generate a magnetic flux which always cancels the primary current flux. The NPCT output is the voltage developed by the feedback current passing through a precision resistor. The two measurements give different information. DCCT are [30]: • used in most particle accelerators to measure the average beam current, • truly calibrated beam instruments for machine tuning and commissioning, • used as a reference to calibrate other beam diagnostics for precision measurements. ACCT are typically used for: • single bunch monitoring, • efficiency measurement between transfer lines and storage rings, • timing calibrations (kicker, first bunch).

29
Figure 27: Integrated DCCT-ACCT system chosen for the SPIRAL2 driver.
5.4 Beam monitoring on target On-line measurements of the beam characteristics (size and position) as close as possible of the target are a major issue. Like in all high power installations, these measurements are mandatory to be able to tune the first beams and then to safely inject into the reactor in nominal conditions. In the latter case, the beam foot print has to be continuously monitored and any deviation from tight reference values must invariably lead to the prompt interruption of the irradiation. Moreover, such a system can also provide potential capability to track the peak power density on target during production. The beam footprint can be determined using different (but quite closed) methods. We give here two examples: the VIMOS system at the PSI facility in Villigen [31] and the target imaging system (TIS) at the Spallation Neutron Source (SNS) facility in Oak Ridge [32]. Both devices are based on optical techniques. These optical techniques can be based on different physical effects to derive beam conditions: • thermal incandescence, • CR:Al2O3 fluorescence, • optical transition radiation (OTR), • He fluorescence (from fill gas in beam line). VIMOS (Visual Monitoring System) at SINQ uses the emitted infra red (IR) and visible light of a tungsten glowing mesh located in the vacuum pipe 40 cm before the spallation target window (see Figure 28). Tungsten wires are 0.1 mm thick in one plane and 0.3mm in the other plane. The proton beam heats the wires up to 1000°C, the power losses in the glowing mesh being around 1 kW. The light emitted by the tungsten goes up in the beam vacuum pipe up to a AlMgSi1 parabolic mirror (size ~20 cm) downstream the last deviation dipole. The distance between the mesh and the mirror is around 10 metres. The mirror reflects the light with an angle of 25° up to a window. After this window, 5m optic fibers transmit the light on a CCD camera. Finally, a thermo graphic analysis is provided in order to determine the beam profile. The residual gas contribution on light is negligible. With VIMOS, besides

30
the beam footprint profile, a 2% modulation in beam intensity at 12Hz can be resolved, but this is close to the limit for such small changes. The time resolution is therefore 40 ms and the size resolution is approximately ±1mm.
Figure 28: VIMOS at SINQ facility, PSI At the SNS facility, the proton beam, hitting a luminescent coating on the target window nose, produces light that is transferred using a radiation-tolerant optical system to an image acquisition system. The proton beam power is one megawatt (60 Hz, 1 GeV protons, pulse length less than 1µs) and the spallation target is mercury. The target nose is coated with a layer of Cr:Al2O3. Distance from the layer up to first parabolic mirror is 2.2m. Other mirrors and a fiber bundle are used in order to bring the light out to the camera in a non-radiation environment (see Figure 29 and Figure 30). The camera’s acquisition is triggered 4 µs after the beam hits the target within which time the gas scintillation has died down but the coating is still fluorescing. The system has a demonstrated lifetime of over 2000 MW-Hrs and the current rate of degradation is minimal. In the case of MYRRHA, a dedicated system will have to be designed from these developments, taken into account the beam line configuration, which is quite longer, and the accuracy on position and size measurements, which should be about ±0.5 mm.

31
Figure 29: View of optical path with shielding for the SNS device.
Figure 30: The configuration of the Target Imaging System at the SNS.
5.5 Halo & beam loss monitors The beam halo monitors can help during the beam tuning phase, but they are mainly used for safety reason, i.e. to trigger the machine protection system. They will be designed and tuned to measure a very small beam current level in normal condition. If beam strong mismatching or misalignment occurs, they will therefore measure some current variation. If the current measured by halo monitors (one or more that one) is outside the permit range, it therefore means that beam conditions are not safe and the beam will be automatically stopped at the injector level. In a second step, interventions on the beam tuning will have to be done to fix the problem, keeping in mind that it is not very safe for an accelerator to permit too much automatic tuning with high beam intensity.

32
A simple system that can be proposed for the 13 halo monitors of the MYRRHA beam line is the ring loss monitor (see Figure 31 and Figure 32). Beam particle interactions on the ring induce currents which are transmitted to the control machine system. The internal size of the ring is adapted to the beam size and the current level which has to be measured. Material can be copper, nickel, molybdenum or carbon. According to the acceptable beam power loss level, rings may need some cooling. The ring can be also divided in 4 sub-sections in order to measure the beam variations top-bottom and left-right. Additional foils at a bias of +300V can be placed adjacent to one or both sides of the ring in order to remove the secondary electrons.
Figure 31: 3D scheme of the ring loss monitor used for the High Energy Beam Transport line for the
SPIRAL2 facility. The system shows the ring with its integrated mechanical system.
Figure 32: Halo monitor used at the PSI PROSCAN beam line [33].
As already mentioned the halo monitors are also used for beam tuning and the signal changes together with those of the loss monitors can provide useful information for the beam setup and tuning. If beam halo monitors are segmented in 4 parts, on-line information of the relative beam position can also be determined (but with less precision compared to BPM).
Figure 33: PSI Ionisation chamber (bias +300V, volume 2 liter, separation of sheets 1 cm, 1 nA signal corresponds to a dose rate of ~1.3 Gy/d). Ring-shaped chambers for placement around the beam tube and
cylindrical chambers for introduction into concrete shielding are also used.

33
Finally, at least 6 beam loss monitors (BLM) are required all along the beam line, especially to ensure that the 1nA/m loss level is respected (see section 7). BLM are one of the most crucial elements of the safety systems, for both machine protection and radioprotection issues linked to material activation. Therefore, the measurement reliability is fundamental. In the case of 600 MeV protons, such beam loss monitors can be simple ionization chambers, formed by two interleaved stacks of metal sheets for high voltage and signal, filled with ambient air (see Figure 33 [34]). The setup can be placed next to the beam pipe.

34
6. BEAM LINE DETAILED MECHANICAL DESIGN
The aim of the mechanical study is to give a first conceptual design of the whole high energy part of the line and its integration inside the reactor building. This study was performed in relation with the design of the reactor and mainly the definition of the building. Several rough designs of the line have been made and have served as input for the iterative definition of the reactor building. As described in section 2.2, the preliminary line scheme, defined in the framework of the EUROTRANS project, had to be modified mainly because of the technological risk (never done before) to make a building with foundations depth of around 30 metres. It was therefore necessary to define a new feasible scheme able to fulfill new costs, dimensions and safety requirements. This new reference design is described below in terms of mechanical and vacuum aspects. The obtained reference beam line layout, already described as a whole in section 2.3, can be separated in different parts (cf. Figure 34), due to the various security constraints. These safety requirements have an important impact on the building design, the accessibility and the mounting/dismounting procedures and hence on the conceptual design of the line. The 6 different parts of the line are described in the following sections.
Figure 34: High-energy line building layout

35
6.1 Beam line outside the reactor hall (parts 1, 2 & 3) This section of the line (parts 1, 2 & 3 on Figure 34) is in a controlled area as for a classical accelerator. Human can access the building when the beam is off, given that the activation level of components has sufficiently decreased. No remote handling is thus required for the handling of the different parts. Part 1 This part (see Figure 35) is the prolongation of the superconducting LINAC. It is installed inside the common tunnel which is supposed to be 3.5 metres height and 5 metres large, the soil being situated 3.5 meters under the ground level. The tunnel additional length needed to host this part of the line is about 38 metres. The beam line axis is situated at 1.5 meters from the soil to allow a good accessibility for mounting and dismounting the various components.
Figure 35: Part 1 of the high-energy line.
So far the superconducting cryomodules of the rest of the LINAC and the cryogenic tubing and feeding cold boxes are not yet designed. It will constrain the tunnel dimensions and the lateral position of the line inside the tunnel. On the drawing shown on Figure 35, the line is off axis, which gives sufficient access of roughly 3 m for the circulation of the cryomodules and other components. On the other side a space of 90 cm is foreseen for the cryogenic lines and cryogenic valves boxes. A change in the position of the line inside the accelerator tunnel has not for the moment any impact on the definition of the reactor building since the accelerator building is still not defined in details. For the handling of the components inside the tunnel no crane is foreseen, thus handling tools dedicated for each component are to be designed. Every component will be installed on supporting frames with adjustable rails. The rails will be aligned during installation of the accelerator and the frames fixed to the ground. The components axis will be independently adjusted, outside the accelerator tunnel, on an intermediate part. Thus positioning the components and its intermediate part on the frame rails will insure a good alignment and reduce operation time inside the tunnel when replacing components for maintenance

36
purposes. The alignment measurement inside the tunnel is to be done with “Laser Tracker” means which will require the integration of specific optical targets on the frames and the components as well as on the tunnel itself. Part 2 This part (see Figure 36), corresponding to the 45° inclined line, is 30 meters long, this length being directly imposed by the vertical position (depth) of the target and reactor. In the present design, it is installed in a hall of 30 metres high, 9.5 metres large and 25 metres long.
Figure 36: Part 2 of the high-energy line.
A part of the beam dump casemate (described below in part 6) is located inside this hall. The beam dump is located as close as possible to the first 45° magnet (around 15 metres) for building cost purposes. A 20° deviation has been foreseen to bend the beam towards the dump. This reduces the consequences of the neutrons backscattering from the beam dump, relaxing the radioprotection issues, and gives a better access for the handling of the beam dump elements using the crane (no need to dismount the 45° slope of the line). A crane of 50 tons capacity will be installed to handle the different elements of the line, and especially the 45° dipoles (about 20 tons each), the beam dump sections and associated shielding components for which the design will have to limit the weight under 50 tons.
Components on the slope will be supported by specific frames. Anyway modal simulations have to be performed due to the stringent specifications on mechanical vibrations (±10µm). We consider here that the main frame is a part of the building and is made from concrete. Alignment measurements will be done using Laser Tracker methods.

37
Part 3 The following part of the line (Figure 37) is installed in a tunnel of 22 metres long, 6.5 metres large and 10 metres height. Components are placed on frames allowing position adjustments and the components will be surveyed using ‘Laser Tracker’ methods as for parts 1 & 2. A common crane with part 2, of around 50 tons capability is foreseen for the handling of the components.
Figure 37: Part 3 of the high-energy line. In parts 1, 2 & 3, all the vacuum components and fittings will be ConFlat® type and a turbo-molecular pumping group with 200 l/s capacity will be placed at around every 3 metres. This should be sufficient for a 100 mm beam line diameter to ensure the 10-7 mbar vacuum specification. All the magnets, dipoles and quadrupoles, will be equipped with two closing valves for maintenance purposes but additional valves can be easily added along the line if necessary. Each component subjected to alignment adjustments (magnets, diagnostic boxes, collimators…) has to be installed using bellows allowing enough longitudinal and lateral displacement.
6.2 Last magnet zone (part 4) Because of the neutron backscattering coming from the reactor, the last 90° magnet will be probably installed in a hot cell (Figure 38). The neutron backscattering effect is presently under evaluation [36] but activation of the components is expected and will require remote handling and nuclear waste handling capabilities. Nevertheless it will be the less activated part on the vertical line. Consequently all the active components and diagnostics will be installed in this hot cell. The pumping system of the vertical line, composed of a 200 l/s turbo-molecular pump and a 16 m3/h primary pump, will be shielded with concrete.

38
Figure 38: Part 4 of the high-energy line. The magnet will be protected with two standard UHV valves. A 50 tons crane will be necessary to handle the magnet. A vertical port on the magnet will be used to integrate the VIMOS type diagnostic and eventually in case of a high neutron rate to implement a neutron dump.
6.3 Beam line inside the reactor hall (part 5) The reactor hall (Figure 39) is a highly activated area and contains large amount of polonium. It has to be totally isolated and all the interventions have to be made by remote handling. To avoid as much as possible the openings of the hall and to reduce the reactor hall eight, the line has be installed and handled laterally and not vertically as it was done for Guinevere. Due to a possible high neutron backscattering rate coming from the interaction between the beam and the target, the part of the line inside the reactor hall should be equipped, for reliability purpose, with as less active components as possible. Due to the important risks of failure of the target window, the line may be polluted by lead bismuth and is therefore considered as a throwable component. The presence of the beam line makes impossible the access to the reactor plate vertically using a standard crane. The line must be dismounted for every handling operation on the reactor.

39
Figure 39: Part 5 of the high-energy line. Line assembly The line is composed of three parts. A top part of around 2 metres fixed on the hall roof, a movable part of around 12 metres supported by articulated arms and a fixed part of 2.5 metres fixed on the reactor cover. The movable part will be fixed on a special square frame of dimensions around 300 mm x 300 mm and around 6 metres long (Figure 40). This frame will have to ensure an adjustment of the different tubes constituting the line. Tubes will be equipped with Conflat flanges and connected each other by mean of a bellow able to handle the displacements required for the alignment adjustment.
Figure 40: The final drift line.

40
The alignment of the tubes on the frame are performed outside the reactor hall. The number of tubes is to be defined according to the tube manufacturing tolerances. Due to the length of the line, the main frame is composed of two parts. These two parts will have to be connected by remote handling, inside the reactor hall. Once connected the main frame will be held by a moving arm (Figure 8). As the top flange of the line is above the crane, this arm will have to provide a vertical displacement for the connection to the top part. At every intervention on the reactor plate the top and bottom flanges will be disconnected by remote handling and the supporting arm moved to allow accessibility for the crane at the centre of the reactor plate.
Figure 41: Assembly of the final drift line.
The path of the supporting arm has to be defined taking into account the implementation of the various components inside the reactor hall and the remote handling capabilities. The alignment of the line is a major concern. The vertical axis will be measured once the reactor will be installed in the hall. Then the line frame will be adjusted and shimmed on its supporting arm with human intervention mainly for survey purpose. It is assumed that the adjustment will not be loosed when the arm is moved. An on-line survey control, using photographic mean will be implemented. In case of loss of alignment coming from the supporting arm it will be possible to adjust differently the line tubes on the line frame (operation outside the reactor hall) to recover the alignment. The building design being still in progress (see section 8.1) and may lead to modifications on the reactor hall dimensions. This could require changes in the line dimensions especially on the fixed parts, on the roof of the hall and on the reactor plate but the overall principle on the line handling remains the same. Vacuum and protection In this part of the line the pressure specification is higher than on the other part of the line and fixed to 10-4 mbar as evaluated in section 2.3. Thus to minimize active components and to reduce overcrowding, no pumping system will be inserted inside the reactor hall. The line will be evacuated using the pumping system installed in the last magnet hot cell, as underlined previously.

41
For the same reasons the line will not be equipped with closing valves. It means that for every disconnection the line will be vented and evacuated. As the reactor hall is composed of dry nitrogen the pumping time will be reduced (no water), below 24 hours to reach 10-4 mbar. It has to be noted that during the pumping of the line the gas must be evacuated in a controlled volume, ideally inside the reactor hall. The vacuum protection of the line from the reactor is an issue. The target window is supposed to be a breakable component. In case of failure of the window the lead bismuth level will rise inside the line. Despite the very low vapour pressure of the lead bismuth, around 10-10 mbar at 200°C, we assume that the pressure inside the line will increase. A loop inside the reactor at the pressure of 6 bars may break and cause the failure of the target window, thus the pressure of 6 bars has been taken into account to specify the maximal pressure increase inside the line in case of accident. To this respect, two protection fast valves are placed on the line, one at the top of the reactor hall and one inside the last magnet hot cell (see Figure 39). A standard valve (VAT serial 75) has a very fast closing time, 15 ms for 100 mm diameter. The tightness is below 1.10-9 mbar l/s for a pressure difference of 2 bars, and it is specified for radiation levels of up to 104 Gy. This fast valve can therefore be taken as a basis for the definition of the line protection valves. It remains to evaluate the radiation rate due to neutron backscattering arriving on the valves and compare it with the VAT specifications. A study on the effect of 6 bars instead of 2 is also to be made and may require modifications on the valve design. It is to be noted that it is also necessary to protect the reactor from gases coming from the accelerator. Risks of over pressure, above 1 bar, inside the line may only come from cryogenic accidents. A fast valve can be installed on the warm part of the line after the superconducting LINAC for this purpose. Finally, a preliminary feasibility study has been performed on the possibility to insert inside the line a cold window as second vacuum protection, as described in section 8.2. The conclusion of this study is that such a window should be avoided if allowed by the safety authorities.
6.4 Beam dump casemate (part 6) Beam dump conceptual design A 2.4 MW, full power beam dump, based on the 1.2 MW PSI proton beam dump, is foreseen to allow the commissioning of the MYRRHA accelerator independently from the reactor. The PSI beam dump, manufactured for a proton beam of 1.2 MW at 590 MeV [22], has characteristics close to the MYRRHA requirements. It is composed of 4 copper blocks, cooled with water, placed in a parallelipedic vacuum chamber (Figure 42). Halo monitors are also interposed between the blocks so as to optimise the beam tuning. The cooling system made of stainless steel tubes is able to evacuate a maximum power density of 350 W/cm3.

42
Figure 42: PSI 1.2 MW beam dump. An upgrade of the PSI beam dump has been evaluated to fit the MYRRHA requirements. Very preliminary studies on the beam power deposition (see Figure 17, page 19) show that it would be composed from 6 copper blocks instead of 4, and its overall length would be longer (about 3 metres). The choice of the material to be used for this dump needs to be optimized considering the foreseen extremely high level of activation. For example, a solution using a high-density carbon fibre core dump with stainless steel around could lower the average neutron fluence inside the dump casemate by a factor of 100 in comparison to a full copper solution (see details in section 7.3). In any case, detailed thermal and mechanical studies will be needed in the future to assess the feasibility of these two proposed solutions. Beam dump handling Parts of the dump will be highly irradiated and considered as nuclear waste. Therefore the beam dump will be placed inside a hot cell whose dimensions, set from preliminary irradiation simulations, are 23 metres long, 18 metres high, 15 metres deep with a concrete wall thickness of about 5 meters. The cell will be equipped with a 20 tons crane and remote handling capabilities.
Figure 43: Part 6 of the high-energy line: the beam dump casemate.

43
7. SHIELDING AND RADIOPROTECTION ASPECTS
7.1 Shielding issues around the accelerator The goal of the shielding design is to guarantee that, under normal operational conditions, the added integrated dose to anybody working around the FASTEF/MYRRHA accelerator is extremely small, i.e. comparable or smaller than the natural background. To reach this goal one must rely on:
• the use of conservative beam loss assumptions; • the use of a conservative shielding model; • the assumption of an occupancy factor = 1, that means 2000 hours/year occupancy
close to the outer shielding wall (at the maximum dose rates). For the shielding calculations, a design dose rate of 0.5 μSv/h can be assumed, which corresponds to the ICRP-60 annual limit of 1 mSv for the public and non-exposed workers. The natural background being of the order of 1 to a few mSv/y, the conservatism built into the shielding calculations should therefore guarantee that the effective dose for any person resulting from the operation of the FASTEF accelerator is smaller than the natural background. Shielding issues in the LINAC tunnel Burying the MYRRHA/FASTEF accelerator tunnel below ground level is a straightforward solution to decrease construction costs and ease radioprotection aspects (cf. examples of SNS, LINAC4 at CERN, etc.). As a matter of fact, shielding is therefore provided by both the concrete tunnel walls and the earth/sand covering the tunnel. First evaluations have been performed during the PDS-XADS project [35], considering a continuous 1 nA/m proton loss at 600 MeV. This is equivalent to a mean beam loss level of about 0.6 W/m, higher than what is currently observed at the SNS facility [11]. The conclusions of this study showed that a 600 mm thick concrete tunnel wall combined with a sand shield of at least 6 m thickness should be enough to ensure a dose rate of less than 0.5 μSv/h on the upper yard. Figure 44 [35] shows the combined concrete/earth thickness required at the maximum proton energy of 600 MeV for a distance between the beam axis and the inner shield wall of 200 cm, for three different values of the LINAC beam power losses (1, 2 and 5 nA/m). During the EUROTRANS project, these orders of magnitude have been confirmed through MCNPX simulations [7]. Nevertheless, it was underlined that care will have to be taken into account for the final shielding assessments concerning the composition of soil, very locally dependent, which has been shown in the literature to have a wide variety of components and densities, and concerning the material/thickness of the beam pipe, which are known to have a significant impact on the quantity and spectrum of the produced neutrons.

44
Figure 44: Required concrete/earth combined thickness at 600 MeV to reach the 0.5 μSv/h dose rate level.
A possible conservative layout for the LINAC tunnel layout has been established by the CDT WP3 group from these results. It is illustrated in Figure 45 [10].
Figure 45: Linac tunnel section at 600 MeV, including the klystron gallery (right) and a chicane access (left).
Finally, note that the shielding efficiency has been assessed for the worst case accident scenario. Results from reference [35] show that a full beam loss during 50 ms (i.e. about 1000 times the time needed to stop the beam within the machine protection system) should be perfectly well shielded by the shielding designed for normal operation losses. Shielding issues in the reactor building Inside the reactor building, the situation is drastically different since no earth is present above the building for shielding. Concrete walls and roofs up to 5 metres thick would therefore be needed to reach the 0.5 μSv/h dose rate outside the facility. In this part of the building shielding calculations must take into account also the neutron radiation coming from the reactor. These shielding calculations, with a special attention to the radiation arriving on the last 90° magnet also under the point of view of the induced activity, are extensively described in [36] and [37].
050
100150
200250300350400450500550
600650700750
0 50 100 150 200 250 300 350 400 450 500 550
cm concrete
cm e
arth 1 nA/m
2 nA/m5 nA/m
45
Shielding issues around the beam dump The beam dump is meant to be used for beam commissioning. It should therefore be able to sustain the maximum beam power (2.4 MW) in continuous mode, both on the thermal and mechanical point of view. Since the dump design must not only satisfy the shielding requirements, but also minimize the backscattered neutron radiation and maintain the induced activation of the dump itself at a satisfactory level, a dedicated section (7.3) is reserved to the optimization of this element of the line, after general considerations about the activation problems.
7.2 Activation aspects In such a high energy and high power accelerator, besides the shielding aspects, the minimization of the induced activity in the materials of the machine that are hit by the beam is a key issue. Two main problems have to be analyzed: the activation of the elements devoted to the beam absorption (beam dump), as well as the activation of the materials, along the beam-line, where beam losses occur. To address these problems, an extensive simulation analysis with the FLUKA Monte Carlo code [38, 39] has been performed, as shown in the next two sections. A precious advantage in using the FLUKA code is the possibility to evaluate, in the same simulation, not only the particle fluences and the ambient dose equivalent (H*(10)) due to all the components of the radiation field, but also the time evolution of the activation products and the transport of their emitted radiation: given an irradiation pattern, the build-up and decay of the produced radionuclides are analytically evaluated runtime and the transport of the residual radiation (limited to γ, β+, β-, X-rays and conversion electron emissions) is performed via Monte Carlo.
7.2.1 Double differential neutron yields, dose rates and specific activities from irradiated thick materials
As first step a systematic study has been finalized to estimate the neutron production and the induced radioactivity in five typical materials, used in the accelerator structures: carbon (a candidate material for the core structure of the dump), stainless steel (pipe, magnets and eventually a part of the dump structure), copper (alternative material for the dump, but also used in magnet coils, cavities), aluminum (possible solution, instead of stainless steel, in some points of the beam-line) and iron.
Table 6: Dimensions and densities of the sample targets.
Sample height (cm)
Sample radius (cm)
Material density (g/cm3)
Carbon 105 52.5 2.0 Copper 30.5 15.25 8.98
AISI-316L 35 17.5 8.0 Aluminum 87.5 4.375 2.70
Iron 35 17.5 7.87

46
This study is intended to provide a simple database, useful to drive the choice of some materials and to assess an approximate estimate of the radiological risk to be expected when interventions on the accelerator components are needed. Double differential neutron yields Since we want first to evaluate the neutron yield during the operation and the residual dose in the points where the beam can be completely absorbed (also with the goal to study suitable materials for the beam dump optimization), the geometry structure of the irradiated materials has been considered as a thick target: for each sample a cylindrical structure has been chosen, with the height slightly exceeding the corresponding proton range (by a factor 1.2), the diameter equal to its height and the center of the coordinate system located at the center of the upstream face (in table 6 the values are reported). A 600 MeV proton pencil beam, with a 4 mA current (2.497 1016 p/s) has been simulated, hitting the center of the cylinder and directed along the z axis.
Figure 46: Neutron double differential yields from the carbon target (left) and neutron fluence (n/cm2 per beam proton) in and around the target (right).
.
Figure 47: Neutron double differential yields from the stainless steel (left) and the copper target (right).

47
The double differential yields of neutrons escaping from the target have been calculated in six angular bins respect to the axis of the impinging proton beam: 0°-15°, 15°-45°, 45°-75°, 75°-105°, 105°-135° and 135°-180°. Figure 46 and Figure 47 show the neutron spectra for carbon, AISI-316L and copper, together with a picture with the neutron fluence in and around the target in the case of carbon. The high energy spallation peak, which decreases at large angles and is strongly suppressed in the backward direction, is well visible in all cases. The evaporation peak at around 1 MeV is important (in terms of neutron yield) in the high-Z materials and in the neutron distributions of stainless steel is also clearly visible the resonance structure, mainly due to the iron component. The neutron distributions from the carbon target show the typical moderation peak. In Table 7 the total neutron yields and the yields for the very forward (0°-15°) and backward (135°-180°) components of the radiation are summarized. They give a first quantitative indication about the advantage in using soft materials (carbon) as part of the structures that are directly hit by the proton beam.
Table 7: Neutron yields computed for the sample targets. The values in the region of the neutron energy spectrum > 100 keV are also reported.
Neutron yield (n/p)
Forward direction (0°-15°)
Backward direction (135°-180°) Total
Full energy spectrum En>100 keV Full energy
spectrum En>100 keV Full energy spectrum En>100 keV
Copper 0.067 0.062 0.747 0.684 3.989 3.625 Carbon 0.036 0.029 0.190 0.068 1.195 0.554
AISI-316L 0.055 0.052 0.619 0.569 3.308 3.021 Iron 0.059 0.056 0.663 0.585 3.478 3.215
Aluminum 0.048 0.038 0.376 0.261 2.161 1.439
Residual dose rates The analysis of the dose rates due to the residual radiation and of the activation products has been performed on the same samples by studying two irradiation patterns. A short term irradiation has been simulated in the most conservative beam conditions during the commissioning: 24 hours continuous operation at the maximum beam energy and intensity. Cooling times have been analyzed between the end of irradiation (EOI) and the following 24 hours. Moreover, a long term irradiation has been simulated, by considering 2 years of commissioning plus 5 years of normal operation and adopting the scheme of 1 months of operation at 6 hours/day followed by 3 months stop, considered as a continuous time interval. Cooling times have been analyzed, in this case, until one year after the EOI. The ambient dose equivalent rates due to the residual radiation around the samples are shown in Figure 48 and Figure 49 for copper and carbon in the case of short term irradiations. We observe that for the copper, as well as for the AISI-316L sample, the residual dose rates are very high (at the level of some tens of Sv/h) already after short irradiations and considering a reasonable cooling time of 24 hours. In Figure 50 the evolution of the H*(10) at 50 cm from the front side of the target is reported as a function of the cooling time, for both the irradiation patterns and for the samples in copper, carbon and stainless

48
steel. We can observe that the high-Z materials exhibit very high dose rates also after long cooling times: in particular the activated radionuclides in copper still give around 20 Sv/h after 5 years from the end of the long-term irradiation. This analysis suggests the use of innovative, combined solutions, with soft (low-Z) materials inserted, where possible, in the parts of the accelerator that are directly hit by the full beam, as is the case of the beam dump.
Figure 48: H*(10) residual dose rate around the copper target, at different cooling times after a 24 h
irradiation.
Figure 49: H*(10) residual dose rate around the carbon target, at different cooling times after a 24 h
irradiation.
Figure 50: H*(10) residual dose rate evaluated at 50 cm from the front of the target samples as a function of
the cooling time, for short (left) and long-term (right) irradiations.

49
Specific activities As last step the specific activity of the irradiated samples has been evaluated, putting in evidence the contribution of the single radionuclides. In all of the Monte Carlo calculations the statistical error has been kept at the level of few percent. In Figure 51 and Figure 52 the radionuclide composition of the activated samples is shown in the copper and in the carbon case, for short and long-term-irradiations. In the copper case a total specific activity of 2.27 1011 Bq/cm3 is evaluated after 24 hours irradiation and 8 hours cooling, the main contributors (also under the point of view of radiological importance) being the cobalt products as 56Co, 57Co, 58Co and 60Co. After a long-term irradiation and 10 years cooling the copper sample still exhibits a total specific activity of 1.2 1010 Bq/cm3, mainly due to long-life radionuclides like 60Co (t1/2=5.27 years), which is the dominant isotope, 63Ni (t1/2=100.1 years) and 55Fe (t1/2=2.737 years). The graphite sample shows a specific activity of 4.0 107 Bq/cm3 after 24 hours irradiation and 8 hours cooling, mainly due to the 7Be and tritium contributors. After a long-term irradiation and 10 years cooling the carbon total specific activity is at the level of 4.1 108 Bq/cm3 and is completely dominated by tritium. The results for the stainless steel sample in the case of a long-term irradiation is shown in Figure 53, where the behaviour of all contributors is shown for cooling times up to 5 years: the total specific activity is around 8 1010 Bq/cm3 and is dominated by 55Fe. It must be stressed, however, that the sample of AISI-316L has been simulated in the present calculation without cobalt impurities: these impurities have to be foreseen and, since they could represent a very important contribution to the activity (see for example the analysis of activated stainless steel samples in [36]), they must be maintained at the lowest reasonable level12.
Figure 51: Specific activity (in Bq/cm3) of the copper and carbon samples in the case of short-term irradiation, after 8 hours cooling. It is represented in the Z-A plane to show the contribution of the single radionuclides.
12 A reference value can be a fraction of 5 10-4 in volume (AISI-316L used at CERN in the LHC structures).

50
Figure 52: Specific activity (in Bq/cm3) of the residual radionuclides evaluated in the samples of copper and
carbon in the case of a long-term irradiation, after 10 year cooling.
Figure 53: Specific activity (in Bq/g) of the stainless steel sample in the case of the long-term irradiation, for
different cooling times up to 5 years. The main radionuclides that contribute to the activity are also reported.
7.2.2 Dose rates due to beam losses along the beam-line Beam losses along the beam-line have to be minimized to keep activation at an acceptable level for hands-on maintenance and to protect equipment. Operational results from the SNS show that an uncontrolled beam loss level of about 1 W/m is fully consistent with a hands-on maintenance philosophy [11]. To check the validity of this assumption in our case, an additional Monte Carlo study with the FLUKA code has been performed. The last 100 m of the LINAC horizontal tunnel have been simulated, including the pipe of the beam-line in stainless steel and 10 halo monitors in copper, one every 10 m. The concrete walls along the tunnel have been also included and described with the first 30 cm of their thickness, in order to take into account the backscattered component of the neutron radiation. A continuous beam loss of 1 nA/m has
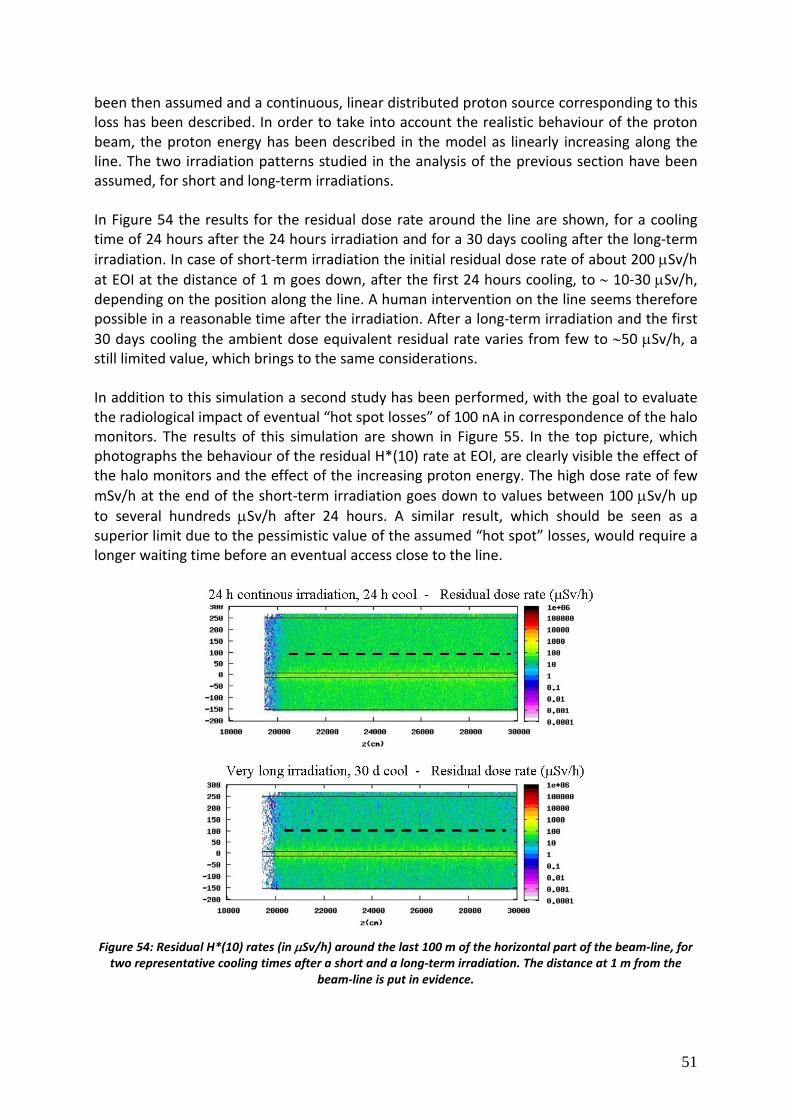
51
been then assumed and a continuous, linear distributed proton source corresponding to this loss has been described. In order to take into account the realistic behaviour of the proton beam, the proton energy has been described in the model as linearly increasing along the line. The two irradiation patterns studied in the analysis of the previous section have been assumed, for short and long-term irradiations. In Figure 54 the results for the residual dose rate around the line are shown, for a cooling time of 24 hours after the 24 hours irradiation and for a 30 days cooling after the long-term irradiation. In case of short-term irradiation the initial residual dose rate of about 200 µSv/h at EOI at the distance of 1 m goes down, after the first 24 hours cooling, to ∼ 10-30 µSv/h, depending on the position along the line. A human intervention on the line seems therefore possible in a reasonable time after the irradiation. After a long-term irradiation and the first 30 days cooling the ambient dose equivalent residual rate varies from few to ∼50 µSv/h, a still limited value, which brings to the same considerations. In addition to this simulation a second study has been performed, with the goal to evaluate the radiological impact of eventual “hot spot losses” of 100 nA in correspondence of the halo monitors. The results of this simulation are shown in Figure 55. In the top picture, which photographs the behaviour of the residual H*(10) rate at EOI, are clearly visible the effect of the halo monitors and the effect of the increasing proton energy. The high dose rate of few mSv/h at the end of the short-term irradiation goes down to values between 100 µSv/h up to several hundreds µSv/h after 24 hours. A similar result, which should be seen as a superior limit due to the pessimistic value of the assumed “hot spot” losses, would require a longer waiting time before an eventual access close to the line.
Figure 54: Residual H*(10) rates (in µSv/h) around the last 100 m of the horizontal part of the beam-line, for
two representative cooling times after a short and a long-term irradiation. The distance at 1 m from the beam-line is put in evidence.

52
Figure 55: Residual H*(10) rates (in µSv/h) as in the case of Figure 54, in the hypothesis of hot spot losses of
100 nA in correspondence of the halo monitors.
7.2.3 Air activation Air activation is due to the secondary radiation that is produced in the points where beam losses occur and then interacts with the nuclei in the air. The experience at high energy proton accelerators shows that in the beamline areas are produced mainly short-live radionuclides, as 11C, 13N, 15O, via spallation reactions on oxygen and nitrogen (see for example [40]). Moreover, thermal neutrons have a role in the production of the 41Ar isotope, due to the high cross section (660 mb) of the process 40Ar(nth,γ)41Ar at the most probable thermal neutron energy (0.025 eV) at the ambient temperature . The half-lives of these radionuclides, together with their main decay mode, are summarized in Table 8. Even if an accurate estimate of the foreseen air activation during the LINAC operation will be very useful in a more advanced phase of the project, the small values of the half-lives of the main interested radionuclides, together with the eventual presence of a ventilation system even with a very low rate of air exchanges (typically a fraction of the entire air volume per hour), allow us to conclude that the air activation due to the losses along the beamline can be always managed in a satisfactory way, in order to ensure to the personnel a safe access to the accelerator areas.
Table 8: Main radionuclides foreseen in the activated air.
t1/2 Production process Decay mode 11C 20.4 min Spallation on N, O, Ar β+ 13N 9.96 min Spallation on N, O, Ar
(γ, n) on N β+
15O 2.03 min Spallation on O, Ar (γ, n) on O β+
41Ar 1.8 h (n,γ) β-, γ

53
7.3 Optimisation of the beam dump zone The beam dump will absorb completely the beam during the period of the accelerator commissioning, and for accelerator tuning purposes during the operation time. It will be, therefore, the “hottest” part of the accelerator beam-line. The solution thought for the beam dump – a dump in copper designed on the model of the PSI dump for the high current (I = 2mA) 590 MeV proton beam – has been illustrated in the previous chapters. This solution, which presents the advantage of a consolidated know-how, does not exhibit, however, the best performances under the point of view of the radiation protection. As we can argue from the studies presented in section 7.2.1, with this solution we have to expect a quite high yield of secondary neutrons and serious activation problems. For this reason we decided to follow two approaches: to quantify and possibly to limit the main problems in the copper dump design and, on the other hand, to propose and to explore an alternative solution. This one has been identified in a bi-material structure for the dump, with a suitable soft material as dump core, surrounded by a high-Z shielding structure (see for example Figure 56, right). Advantages of this concept are a smaller neutron yield, an energy deposition over a wider range and, as consequence, much less activation problems, especially in terms of residual ambient dose equivalent rate. A key point in the choice of a soft material core is that the build-up region of the secondary radiation moves from the front part toward the central part of the dump, with a very effective autoshielding effect: the “hottest” part of the dump is not anymore close to the dump surface but is deeper inside the material, minimizing the H*(10) rate outside the dump.
Figure 56: Neutron fluence (n/cm2 per primary proton) in the dump concrete cage in the case of the dump in
copper (left) and of the bi-material dump in carbon and stainless steel (right). A bi-material solution in carbon (graphite for shielding, with a density of ∼ 2.0 g/cm3) and stainless steel (AISI-316L) has been studied. The model implemented in FLUKA, which includes also the whole concrete cage and the last part of the proton beam-line, is showed in Figure 56, together with a parallel simulation of a complete model of the beam dump in copper, which includes the 5 copper elements and their extensions in stainless steel. The

54
dimensions assumed for the carbon core are 50 cm in radius and 180 cm in length, while for the high-Z part a radius of 140 cm and a length of 330 cm have been set. Figure 56 shows a comparison between the two models in terms of neutron fluence. First of all, it has to be stressed that the casemate in concrete contains the radiation in a very satisfactory way in both cases. The average neutron fluence inside the concrete cage is in the bi-material case, however, lower of a factor ∼ 10-2. Moreover, if we study the neutron secondary radiation emitted in the backward direction (see Figure 57), we observe that the bi-material solution minimizes the part of the spectrum from the epithermal up to the fast and the high energy neutrons. This result is also more interesting if in this sample we select the neutrons (in red in Figure 57) that pass through the pipe channel and exit from the shielding wall: the spectra of Figure 57 show that the backscattered neutron radiation reaching the beamline is bigger in the copper case and is in any case never negligible. For this reason, with the aim to protect the instrumentation close to the dipole at 45° and the beam tube before, the part of the proton line between this dipole and the dump has been rotated of 20°, as illustrated in chapter 6.
Figure 57: Spectra of the neutrons (neutrons sr-1 per primary proton) exiting from the dump in the backward direction, for the two studied models of the beam dump. In blue all the backward neutrons from the copper structure (left) and from the graphite/stainless steel structure (right) are computed. In red are reported the
neutrons that, going in the backward direction, cross the shielding walls along the beam-line tunnel and reach the accelerator hall.
Residual dose rates and specific activities A special study has been dedicated to the evaluation of the residual dose rates expected inside the concrete cage and on the roof, for the two models of the beam dump. For this work has been used the special capability of the FLUKA code, to perform a simulation in a condition of variable geometry: the geometry of the problem can vary from the radiation transport during the irradiation with the primary beam to the transport of the residual radiation during the cooling. In this case the concrete blocks that in the roof of the dump casemate are removable have been removed also in the simulation during the cooling time, and replaced with air. In Figure 58 the FLUKA model used in the case of the copper beam dump is shown. The two usual irradiation patterns have been studied, for short and long-term irradiations. In Figure 59 and Figure 60 are reported the results for the two beam dump models.

55
Figure 58: FLUKA model of the copper beam dump. The concrete cage around the beam dump is described,
with the last meters of the beam-line and, on the roof, the concrete blocks that are removable when the accelerator is not in operation.
Figure 59: Residual H*(10) rate (in mSv/h) in the concrete cage and over the cage roof in the case of the dump in copper, for two typical cooling times after a short and a long-term irradiation.
Figure 60: Residual H*(10) rate (in mSv/h) in the concrete cage and over the cage roof in the case of the bi-
material dump, 24 hours after a 24 hours irradiation and 30 days after a long-term irradiation.

56
In the case of the beam dump in copper the H*(10) rate due to the residual radiation over the roof is at the level of 1 Sv/h after the 24 hours cooling that follow a 24 hours irradiation. This very high value definitely requires a better protection against the dose from activation, if we want to make the area over the roof accessible for the maintenance, even with the opportune restrictions. This better protection could come, for example, from additional local shielding – for example with concrete slabs – around the copper structure in the dump casemate. In the case of the bi-material dump the H*(10) over the roof due to the activated materials in the dump is at the level of 10 mSv/h after the 24 hours cooling that follow the short-term irradiation. This value, which is already two orders of magnitude lower with respect to the previous case, can be still lowered by using a proper shielding against the radiation coming from the activation: experience at the high energy accelerators shows, for example, that quite narrow slabs of marble around the dumps are highly effective13. The picture of the residual H*(10) rate 30 days after the long-term irradiation, moreover, shows how well, with this beam dump choice, the residual radiation is fully contained in the inner part of the dump, allowing the access to the roof. As last step a study of the residual specific activity in the dump materials has been done. In Figure 61 the residual specific activities in the carbon core and in the “hottest” part of the stainless steel are reported for the bi-material dump, after a long-term irradiation and for a cooling time of 30 days. The total specific activity for the stainless steel is at the level of 109 Bq/cm3, while we have around 103 Bq/cm3 in the carbon core. In the case of the copper dump the results for the “hot” part of the dump are those of the left sides of Figure 51 and Figure 52: it can be observed that a value of 1.2 1010 Bq/cm3 is still present at the end of the 10 years of cooling that follow the long-term irradiation.
Figure 61: Specific residual activity of the carbon core and the stainless steel “hottest” part in the case of the
bi-material dump, after a long-term irradiation and a cooling time of 30 days. In the Z-A plane the main radionuclides that contribute to the activity are shown.
13 A. Fasso’ (SLAC), private communication.

57
8. ADDITIONAL ISSUES
8.1 Adaptation to the final layout This beam line design study has been performed taking into account the building layout described in [10], which corresponds to a preliminary definition of the facility. The building detailed definition is still in progress, and will probably keep moving slightly until the start of the MYRRHA construction. It is therefore important to ensure that the beam line layout will be able to adapt to these changes as much as possible without major consequences. In the case of a displacement of the reactor at constant height, no impact at all is foreseen on the design of the beam line. The only consequence is a global displacement of the whole accelerator (linac + beam line + tunnel) in the direction of displacement of the reactor itself. In the case of a height variation of the reactor, the situation is different. If the reactor height is increased by ℎ metres, which is actually the case in the very last version of the buildings (ℎ = 7𝑚) [41], the beam line therefore needs to be modified. Three solutions could be implemented without severe impacts on the optical principles of the line (Figure 62).
- 1. Lengthen the 45° beam line by √2ℎ metres to recover the connection with the end of the main linac, which therefore needs to be moved back by ℎ metres. In this case, the 25 metres long hall, housing the 45° beam line and the dump casemate, needs to be longer and higher by ℎ metres. The beam line to dump is also lengthened by about ℎ metres.
- 2. Transform the 45° beam line into a beam line with higher slope (about 52° for ℎ = 7𝑚) and slightly longer. In this case, the bending magnets are therefore heavier and the 25 metres long hall must be higher by ℎ metres, but not longer. The main linac tunnel is unchanged.
- 3. Increase the height of the whole linac tunnel by ℎ metres. In this case, the beam line itself is not changed but the whole linac buildings are deeply modified.
Figure 62: Possible beam line adaptations in the case of a reactor height increase. In any case, once the final building layout frozen, the detailed beam line design will have to be reworked from the present reference design, including beam dynamics aspects. The conceptual layout n°1 with 4 45° magnets (see section 2.2) could even be reconsidered. This might be performed in 2012 and 2013 within the MAX project if the adequate frozen data are available.
1. 2. 3.

58
8.2 Safety issues at the accelerator/reactor interface Safety at the accelerator/reactor interface is presently based only on active means, both for vacuum protection and beam damage protection. Additional passive means are investigated in the following paragraphs. Feasibility study of a radiatively cooled cold window As already mentioned in section 6.3, the vacuum protection of the final beam line in case of a target window failure is ensured by a couple of radiation-hard fast valves located right after the last bending magnet, able to close in less than 100 ms and to easily sustain a 2 bars pressure – and a priori up to 6 bars. Even if such a system should a priori be compatible with safety requirements, it has been decided to look at the possibility of inserting somewhere inside the beam line an additional vacuum window (“cold window”) as a third passive protection [42]. A simple and efficient solution for such a vacuum cold window is to use a thin metallic foil able to sustain high temperature gradients without perturbing too much the beam optics. In existing (low-power) accelerators, titanium foils of a few hundreds of µm are typically used. This solution has been assessed in the MYRRHA case, using a 100 mm diameter 400 µm thick Ti window as a preliminary choice. The beam energy loss through the Ti window, calculated with LISE++ [43] is about 0.33 MeV, corresponding to a total deposited power of 1.3 kW. First order radiative thermal calculations have been performed considering uniform beam distributions of different sizes (see Figure 63). They show that, due to the very high beam power density, such a configuration clearly leads to the fusion of the window centre for beam radius larger than 12 mm RMS, i.e. 6 times larger than the MYRRHA natural beam in the HEBT. To be able to envisage the use of such a window, it is estimated that the beam radius size should be enlarged up to about 35 mm RMS so as to decrease sufficiently the mean temperature in the window volume (below typically 800°C). This would correspond to a beam total size of about 30 cm diameter including halo, already much larger than the 10 cm diameter beam tube, showing that such a solution is clearly not reasonable.
Figure 63: Temperature at a 400µm Ti window as a function of beam RMS radius size (ε=0.7).

59
To improve the situation, one could try to decrease the power deposited in the window, and therefore its temperature, by decreasing the window thickness. A rough estimation shows that decreasing the window thickness down to about 100 µm would be enough to sustain a 80 mm diameter beam size (MYRRHA maximal beam size, at target), given that it remains mechanically feasible. But preliminary mechanical simulations on the resistance of the window to pressure loads clearly show that such a solution can’t be envisaged. Using Roark analytical formulas and a pressure load of 6 bars, a maximal deformation of 2.5 mm is already obtained for a 400 µm thick window, with a maximal stress in the centre of around 700 N/mm2 (100 mm diameter plate window, young modulus of 200 kN/mm2, ν = 0.3). Other preliminary finite element calculations with elasto-plastic analysis and bombed/spherical shapes models for the window confirm this very critical situation. Moreover, these simulations are done at room temperature and don’t take into account the thermal effects which will reduce the mechanical resistance of the window. Embrittlement due to irradiation and high dpa is neither taken into account. In conclusion, the use of radiative cooled simple beam window seems to be quite unrealistic in the MYRRHA case, even if located at the only place where such a window may have a chance to survive, i.e. very close to the target where the beam is the largest (8 cm diameter). This is due to the combination of the very high beam power density and the huge 6 bars pressure load to be sustained. Possible improvements using alternative materials like Beryllium, Molybdenum or Tungsten should be investigated, but it is clear that specifications would need to be relaxed in any case beforehand. Going down to a 1 bar pressure could for example make the situation more encouraging, as illustrated in [44]. Investigations on a water cooled cold window Given the previous analysis, the only possible solution is therefore to use a cooled window. Such windows are used in SNS [45,46] and J-PARC [47,48] to ensure insulation between the accelerator vacuum and the He atmosphere (at typically 3 bars) surrounding the spallation target. These windows are made with two curved plates of Inconel 718 (1.5 to 2 mm thickness) separated by a 1.6 to 3 mm gap in which water flows (at typically 10 bars) for cooling. The ESS project is also being designing such a window, investigating a slightly different concept made with Al tubes cooled either by water or by Helium at 40 bars [49].
Figure 64: (left) Scheme of the existing J-PARC water-cooled window; (righ) ESS window protoype.

60
Considering a window made with two 2mm thick Inconel walls and a 2mm gap for cooling water, the beam energy loss passing the window is evaluated to about 6.7 MeV (3.1 MeV in each wall and 0.5 MeV in the water)14. This corresponds to about 27 kW dissipated power to be cooled at least (we here only count thermal effects from proton interactions, this value could significantly rise in a hard neutron environment, i.e. near the target). This window needs to be located quite near to the final target for two main reasons. The first reason is that the beam emittance growth induced by the window crossing is very large: preliminary simulations done with LISE++ show that the beam emittance is multiplied by a factor of 10, the RMS divergence increasing at the output of the window from 0.4 mrad to about 4 mrad in both planes. Figure 65 show the effect of such a window, located 25 metres away from the target (reactor hall roof), on the beam transport in the MYRRHA nominal configuration & tuning. Such a divergence increase can clearly not be managed by any kind of upstream retuning over such a long distance.
Figure 65: Impact of a water-cooled window on the MYRRHA final beam envelopes (left) compared to the
nominal case (left) for the same machine tuning (99% envelopes). The second reason to locate the window near the target is that on the thermal point of view, these windows are usually designed to withstand heat depositions up to 1 kW/cm3. This implies in the MYRRHA case to locate this window in a region where the full beam is larger than roughly 60 cm2, that is already about the size of the MYRRHA target surface. An additional argument is the fact that such a window will have to be considered as an another highly activated zone to manage. The induced impact will be certainly minimised if located near the target zone. Figure 66 shows the layout of the near-target zones in the J-PARC and SNS facilities for illustration.
14 Note that in case of a window break the beam on target would therefore instantaneously experience a 1% energy and power increase.
Beam tube
Beam tube
Beam tube
Beam tube
Window location
Window location

61
Figure 66: (left) Spallation target configuration at J-PARC; (right) new un-irradiated window plug being
installed at the SNS target. In conclusion, a water-cooled (or maybe helium-cooled) window can be envisaged to provide a passive vacuum protection in case of a target window break. This window would need to be located very near the target itself (a couple of metres maximum, like in SNS and J-PARC), i.e. inside the reactor vessel. Further studies need to be started to evaluate the feasibility of such an option. Note that in this case, the visual monitoring of the target as foreseen in section 5.4 would become impossible from the top of the last dipole. An alternative solution would then be to use a mirror located directly on the cold beam window, like in SNS (see Figure 67).
Figure 67: (left) Target imaging system at SNS;
(right) View of the SNS proton beam window, that is replaced annually
Investigations on passive safety collimators In the present design, the protection of the final vacuum tube, up to the target window, is supposed to be ensured by the accelerator protection system that is triggered if thresholds are reached on the beam line halo monitors or on the near-target imaging system. An additional passive protection system could be envisaged, adding a couple of collimators along the final 25 metres beam line to physically define the beam footprint and prohibit any interaction between the beam and the tubes, especially inside the reactor. These collimators

62
would typically consist in 2 or 3 metres long water-cooled copper blocks with very narrow adjusted apertures. These 2 devices would be rather similar to the main beam dump, with relaxed thermal specifications. They could be for example located on the top and on the bottom of the reactor hall. Note that only one collimator would be sufficient if located sufficiently near from the target, like in the ESS design (see Figure 68). Here again, if such collimators are used, an alternative solution with a mirror will have to be foreseen for the near-target imaging system.
Figure 68: ESS target preliminary layout

63
9. CONCLUSION The goal of the MYRRHA/FASTEF final high-energy beam line is to safely inject the proton beam onto the spallation target located inside the reactor. A quite detailed design of this line is proposed in the present document. It is mainly composed of two 45° bending magnets going up from the linac tunnel, and of a last 90° dipole bending the beam down through the reactor hall to the sub-critical core. The proposed beam line has achromatic and telescopic optics in order to guarantee the beam stability on target and to ease the tuning, and it houses AC magnets to scan the beam on target with the specified “donut shape”. A preliminary statistical error optical study has been performed to assess the robustness of the design. It shows that the very long “naked” final drift length (27 m) located between the last dipole magnet and the target makes the line very sensitive to dynamic errors, inducing severe specifications on tolerances, especially for the last dipole field stability, the mechanical vibrations of all magnets and the input beam fluctuations. This last point, that could become an issue, will be evaluated by dedicated “start-to-end” error studies (i.e. including the upstream LINAC) to be performed in 2012 and 2013 within the MAX project. The situation is otherwise very satisfactory since no dramatic beam loss is noticed except a few tens of kW inside the reactor vessel itself (these losses could be minimized if needed). The beam footprint on target also appears to be very stable. As far as beam diagnostics are concerned, a near-target optical device appears to be mandatory to be able to correctly tune and monitor the beam shape on target. Such a system needs to be specifically developed for the MYRRHA configuration, from the already existing VIMOS system developed at PSI. Other beam diagnostics (BPM, profilers, halo monitors…) are more classical systems that should be designed from existing devices. A first detailed mechanical design is described for each part of the line, including preliminary handling and vacuum aspects, especially for the final straight line inside the reactor hall that needs to be remotely assembled. Shielding and activation calculations have been also performed. They especially show that the foreseen full copper 2.4 MW beam dump leads to very high activation level. This situation could be improved using for example a bi-material dump (graphite + stainless steel), given that such a solution remains suitable on the thermo-mechanical point of view. Finally, additional assessments have been performed on possible additional passive safety systems at the reactor interface (cold vacuum window, safety collimators). Such devices appear to be feasible at the two following conditions: they need to be cooled (probably by water) and located very near the target (even possibly inside the reactor vessel). Such options could have non negligible impacts on the reactor design itself, and should therefore be considered with great caution.
64
ACKNOWLEDGEMENTS Thanks to P. Duchesne, F. Launay, B. Launé, A. Tkatchenko (CNRS) and L. Medeiros Romao (SCK•CEN) for their punctual contributions.
REFERENCES [1] Central Design Team (CDT) for a Fast-spectrum Transmutation Experimental Facility – “Annex 1:
Description of work” of Grant Agreement N°232527, 2009.
[2] See http://myrrha.sckcen.be/
[3] Sustainable Nuclear Energy Technology Platform – “Strategic Research Agenda”, May 2009.
[4] J-L. Biarrotte et al. – “Accelerator design, performances, costs & associated road-map”, Deliverable (D1.74) of the EUROTRANS project, March 2010.
[5] D. Vandeplassche et al. – “The MYRRHA linear accelerator”, Proc. of the IPAC’2011 conference, San Sebastian, Spain.
[6] See http://ipnweb.in2p3.fr/MAX/
[7] L. Mansani et al. – “Design of the final beam line for the XT-ADS”, Deliverable (D1.61) of the EUROTRANS project, April 2008.
[8] M. Perezagua – Minutes of the CDT WP3 meeting, Mol, 2-3 June 2010.
[9] L. Mansini – Minutes of the CDT WP2 3rd technical meeting, Mol, 14-15 November 2010.
[10] Drawings package N° 092-204 by Empresarios Agrupados.
[11] J. Galambos – “Operational experience with high power beams at the SNS superconducting linac”, Proc. of the LINAC’2008 conference, Victoria, Canada.
[12] H.C. Hseuh et al. – “Design of the SNS accumulator ring vacuum systems”, Proc. of the PAC’1999 conference, New York, USA.
[13] N. Pichoff – “Etude théorique et expérimentale du halo d'un faisceau intense de particules chargées dans un accélérateur", Thèse de doctorat de l'Université Paris-Sud, December 1997.
[14] C. Sibley et al. – “Implementation and integration of the SNS timing and machine protection systems”, Proc. of ICALEPS’2003 conference, Gyeongju, Korea.
[15] H. Nakagawa et al. – “The accelerator protection system based on embedded EPICS for J-PARC”, Proc. of the ICALEPS’2009 conference, Kobe, Japan.
[16] See http://irfu.cea.fr/Sacm/logiciels/index3.php
[17] Th. Haberer, W. Becher, D. Schardt & G. Kraft, “Magnetic scanning system for heavy ion therapy”, Nucl. Inst. & Meth., A330, 1993.
[18] M .E. Schuze et al., “Testing of a raster magnet system foe expanding the APT proton beam”, Proc. of the PAC’2001 conference, Chicago, USA.
[19] R.W. Garnett et al., “Circular confined distribution for charges particle beams”, U.S. Patent n° 5 468 965, November 1995.
[20] L. Mansini – Minutes of the CDT WP2 4th technical meeting, Brussels, 19-21 January 2011.
[21] R. Duperrier & D. Uriot, “Application of the extreme value theory to beam loss estimates in the SPIRAL2 linac based on large scale Monte Carlo computations”, Phys. Rev. ST – Accelerators and Beams 9, 044202 (2006).

65
[22] See http://aea.web.psi.ch/Urs_Rohrer/MyWeb/pkanal.htm
[23] W. Beeckman et al, “Magnetic design improvement and construction of the large 90° bending magnet of the vertical beam delivery line of CNAO”, Proc. Of the EPAC 2008 conference, Genoa, Italy.
[24] M.E. Schuze et al., “Testing of a Raster Magnet System for Expanding the APT Proton Beam”, Proc. of the PAC’99 conference, New York, USA.
[25] K. Thomsen, “VIMOS beam monitoring for SINQ”, Proc. of the DIPAC’2009 workshop, Basel, Switzerland.
[26] J-L. Vignet et al., “The beam profile monitors for SPIRAL 2”, Proc. of the DIPAC’2009 workshop, Basel, Switzerland.
[27] C. Jamet et al., “Phase and amplitude measurement for the SPIRAL2 accelerator”, Proc. of the DIPAC’2009 workshop, Basel, Switzerland.
[28] P.A. Duperrex et al., “Recent Diagnostic Improvements for the PSI Accelerator”, Proc. of the DIPAC’2005 workshop, Lyon, France.
[29] P. Ausset for the SPIRAL2 Diagnostics Team, “Beam Diagnostics for the SPIRAL2 Accelerator”, Proc. Spiral2 Week, Caen, France, January 2011.
[30] See http://www.bergoz.com/
[31] K. Thomsen, “Advanced on-target beam monitoring for spallation sources”, Nuclear Instruments and Methods in Physics Research A 600 (2009) 38–40.
[32] W. Blokland, “SNS target imaging system software and analysis”, Proc. of the BIW’2010 workshop, Santa Fe, USA.
[33] R. Dölling, “Ionisation Chambers and Secondary Emission Monitors at the PROSCAN Beam Lines”, Proc. of the BIW’2006 workshop, Batavia, USA.
[34] R. Dölling, “Beam diagnostics at the high power proton beam lines and targets at PSI”, Proc. of the DIPAC’2005 conference, Lyon, France.
[35] J-L. Biarrotte et al., “Radiation safety and maintenance”, Deliverable 48 of the FP5 PDS-XADS project, February 2004.
[36] A. Ferrari, “Shielding and activation calculations around the MYRRHA-FASTEF core in the subcritical operation mode”, HZDR report, 2012, in preparation.
[37] M.Sarotto et al., “FASTEF design changes to operate in critical mode”, Deliverable 2.2 of the CDT FP7 project, 2012, in preparation.
[38] A. Ferrari, P. Sala, A. Fassò, J.Ranft, “FLUKA: A multi-particle transport code”, CERN-2005-10 (2005), INFN/TC_05/11, SLAC-R-773.
[39] G. Battistoni et al., “The FLUKA code: description and benchmarking”, Proc. of the Hadronic Shower Simulation Workshop 2006, Batavia, USA.
[40] J.D. Cossairt, “Radiation physics for personnel and environmental protection”, Fermilab Report TM 1834, 1999.
[41] Minutes of the 2nd full meeting of the FP7 MAX project, Brussels, Belgiume, October 2011.
[42] Minutes of the 5th PCC meeting of the FP7 CDT project, Brussels, Belgium, November 2011.
[43] O.B. Tarasov, D. Bazin, “LISE++: Radioactive beam production with in-flight separators”, NIM B 266 (2008) 4657–4664.
[44] C.F. Mallary, “A Radiatively Cooled ADS Beam Window”, WPI student e-project, Worcester, USA, 2007.
[45] F.C. Difilippo, “Design and effects of the proton window of the Spallation Neutron Source”, Proc. of the MonteCarlo’2000 conference, Lisbon, Portugal.

66
[46] T. J. McManamy, “SNS target systems operational experience and upgrade plans”, Proc. of the
AccApp’2009 conference, Batavia, USA.
[47] See http://j-parc.jp/MatLife/en/facilities/pbw.html
[48] T. Teraoku et al., “Structural design study of a proton beam window for a 1 MW spallation neutron source”, JAERI-Tech 2003-026, 2003.
[49] M. Butzek et al., “Proton beam window for high power target application”, Proc. of the 4th high power targetry workshop, Malmo, Sweden, 2011.