Embed Size (px)
Citation preview

ACCENT-plus Symposium, Urbino 2013ACCENT-plus Symposium, Urbino 2013
The effect of climate and climate change on ammonia emissions in
EuropeCamilla Geels1 and Carsten Ambelas Skjøth 2
1Department of Environmental Science, Aarhus University, Denmark.2 National Pollen and Aerobiology Research Unit, University of
Worcester, UK.
With contributions from Ole Hertel, Jesper H. Christensen, Steen Gyldenkærne, Thomas Ellermann,
Helle Vibeke Andersen, Jørgen BrandtDepartment of Environmental Science, Aarhus University, Denmark.

ACCENT-plus Symposium, Urbino 2013
Link between the trends in human population and NH3 use throughout the twentieth century:
From: How a century of ammonia synthesis changed the worldErisman et al., Nature Geoscience 1, 636 - 639 (2008).
The Haber-Bosch process “the most important invention of the 20th century” made it possible to produce ammonia (NH3) from hydrogen and nitrogen
Converts nitrogen into a bioavailable form!

ACCENT-plus Symposium, Urbino 2013
NH3 mission changes globally and in Europe:
European Environment Agency (EEA).

ACCENT-plus Symposium, Urbino 2013
BUT: NH3 emissions from agricultural production are very sensitive to climatic drivers (temperature, water availability).
A central question in the ECLAIRE project is:“Will climate warming increase NH3 emissions and to what extend will this hinder NH3 mitigation efforts?”
A different approach is needed.
Current regional CTM studies of NH3:
0
0.4
0.8
1.2
1.6
1 2 3 4 5 6 7 8 9 10 11 12
Fact
or
Month
Seasonal factor for snap 10 (source: EURODELTA)
Annual emission inventoriesBased on national emissions factors.
Standard temporal profiles.

ACCENT-plus Symposium, Urbino 2013
Was originally developed for Denmark[1,2] – now extended to part of Europe[3].
Based on:
1.) 16 different functions describing the temporal variation in NH3 emissions from various activities.
2.) information on number and type of animals, type of crop, sale of manure/fertilizer etc. So this is required on as high spatial resolution as possible.
The Danish Dynamic NH3 emission model
Function Description
Fkt 1 Animal houses with forced ventilation
Fkt 2 Open animal houses (non-forced ventilation)
Fkt 3 Manure storages
Fkt 4 Winter crops (no emission simulated in this study)
Fkt 5 Spring crops (no emission simulated in this study)
Fkt 6 Late spring crops (no emission simulated in this study)
Fkt 7 Grass
Fkt 8 Spring application of manure on bare soil
Fkt 9 Application of manure on crops
Fkt 10 Summer application of manure
Fkt 11 Autumn application of manure
Fkt 12 Spring application of fertilizer (90% of all fertilizer)
Fkt 13 Summer application of fertilizer (10% of all fertilizer)
Fkt 14 Emission related to grassing cattle
Fkt 15 Emissions related to ammonia treated straw
Fkt 16 Emissions related to personal vehicles with catalytic converters
1
[1] Skjøth et al,(2004) Implementing a dynamical ammonia emission parameterization in the large-scale air pollution model ACDEP109, D06306, doi:10.1029/2003JD003895.[2] Gyldenkærne et al (2005) A dynamical ammonia emission parameterization for use in air pollution models, JGR, 110, D07108, doi:10.1029/2004JD005459.[3] Skjøth et al (2011). Spatial and temporal variations in ammonia emissions - a freely accessible model code for Europe: Atmos. Chem. Phys., 11, 5221-5236.

ACCENT-plus Symposium, Urbino 2013
Backbone of the dynamic ammonia model [1]
• Point sources: emission from stables and manure storages depends on outdoor/indoor temperature and ventilation[2]
– Pigs/chicken requires a high minimum temperature – Cattle manages relatively low temperaturesThe farmers use heating/ventilation to keep the animals happy …
• Area sources: emissions from agricultural fields depends on e.g. crop growth/application of manure described by Gauss functions[2] – also a function of T.
• Local temperature provided by meteorological data used in the CTM model. • Usually scaled to official annual emissions, so only intra-annual
(seasonal/diurnal) emission variation used….
8 9.0TE
[1] Skjøth et al,(2004) Implementing a dynamical ammonia emission parameterization in the large-scale air pollution model ACDEP109, D06306, doi:10.1029/2003JD003895.[2] Gyldenkærne et al (2005) A dynamical ammonia emission parameterization for use in air pollution models, JGR, 110, D07108, doi:10.1029/2004JD005459.

ACCENT-plus Symposium, Urbino 2013
1989
0
2
4
6
8
10
12
1 31 61 91 121 151 181 211 241 271 301 331 361
Day
Em
iss
ion
[k
g N
/km
²]
2000
0
2
4
6
8
10
12
1 31 61 91 121 151 181 211 241 271 301 331 361
Day
Em
iss
ion
[k
g N
/km
²]
0
2
4
6
8
10
12
1 31 61 91 121 151 181 211 241 271 301 331 361
Buildings Crops Grazing Other Art. Fertilizer Manure
Example from Denmark – change in seasonal profile due to development in agricultural sector (1985-2003) [4]
Main activities 1985[kTon N]
1990[kTon N]
1995[kTon N]
2000[kTon N]
2003[kTon N]
Pig houses 19.787 18.674 17.979 18.578 18.578
Cattle barns 10.926 10.614 9.104 9.598 9.598
Storage 13.936 12.298 11.125 10.176 9.136
Crops 13.174 13.010 11.125 11453 11.476
Manure early spring 6.722 6.042 6.120 5.941 4.330
Manure in crops 5.491 6.680 11.296 14.183 14.129
Manure summer 8.106 7.396 3.207 1.834 512
Manure autumn 6.232 4.826 1.806 1.114 640
Manure late autumn 13.256 10.306 4.156 1.429 640
Mineral fertilizer 7.870 8.662 7.606 5.582 4.437
Grassing animals 2.591 2.413 2.500 2.370 2.257
Ammonia treatment 6.551 10.210 6.647 2.471 661
Traffic 0.053 0.106 0.993 1.828 1.989
Total 114.695 111.236 94.196 86.556 80.391
[4] Skjøth et al (2008), JAWMA, Footprints on ammonia concentrations from Environmental regulations, JAWMA, 58: 1158-1165.
Change in Danish regulation
Fig 1. Fig 2. Fig 3.

ACCENT-plus Symposium, Urbino 2013
Application of the Danish Ammonia Modelling System: DAMOS[5,6,7] -regional to local scales.
150 km x 150 km
50 km x 50 km
~ 17 km x 17 km
~ 6 km x 6 km
400 m x 400 m
DEHM[6]
OML-DEP[7]
[5] Geels et al, (2012) Improved modelling of atmospheric ammonia over Denmark using the coupled modelling system DAMOS: Biogeosciences, 9, 2625-2647.[6] Brandt et al (2012). An integrated model study for Europe and North America using the Danish Eulerian Hemispheric Model with focus on intercontinental transport of air pollution: Atmos. Environ., Atmos. Environ., 53, 156-176. [7] Sommer et al (2009) Validation of model calculation of ammonia deposition in the neighbourhood of a poultry farm using measured NH3 concentrations and N deposition: Atmos. Environ., 43, 915-920.
Covered by existing emission model

ACCENT-plus Symposium, Urbino 2013
Weekly NH3 concentration at Lindet.[5]
2005 200920072006 2008
•Strong seasonal cycle captured by both DAMOS and DEHM[5]
•Overestimating some spring peaks[5]
•Week-to-week variability also captured[5]
•DAMOS closer to measured level[5]
DAMOS:Corr=0.72Bias=0.11
DEHMCorr=0.67Bias=0.64
[5] Geels et al, (2012) Improved modelling of atmospheric ammonia over Denmark using the coupled modelling system DAMOS: Biogeosciences, 9, 2625-2647.

ACCENT-plus Symposium, Urbino 2013
The new sensitivity study carried out in ECLAIRE (WP6):
Analysing the effect of temperature variations:-From location to location-Due to climate change
The dynamic NH3 emissions model forced with hourly bias corrected climate data (based on a data fusion of ENSEMBLES climate data and reanalyses meteorology).
New paper in ACP:The effect of climate and climate change on ammonia emissions in Europe
by Skjøth and Geels
Atmos. Chem. Phys., 13, 117–128, 2013

ACCENT-plus Symposium, Urbino 2013ACCENT-plus Symposium, Urbino 2013
Test case:A storage related to a pig stable facility with 1000 animals - with the same production methods as in Denmark.
Placed throughout the domain – so forced with different temperatures.

ACCENT-plus Symposium, Urbino 2013
Area DK
Emission [kg NH3/year] 506
Difference [%] 5
Area UK
Emission [kg NH3/year] 579
Difference [%] 21
Area FR
Emission [kg NH3/year] 577
Difference [%] 20
Area GE
Emission [kg NH3/year] 374
Difference [%] -22
Area GE
Emission [kg NH3/year] 541
Difference [%] 13
Area IT
Emission [kg NH3/year] 626
Difference [%] 30
Spatial variations in NH3 emission (standard Danish storage moved to other locations).
Note the diff. within GE
2007
Relative to mean 2006-2010 at Tange in Dk.
mountainous regions

ACCENT-plus Symposium, Urbino 2013
Annual emission from storage in a pig production facility with 1000 animals using average Danish production methods and exposed to different European climatic conditions in the
years 2007 and 2010 – important for emission ceilings …
ACCENT-plus Symposium, Urbino 2013
The climate ”penalty” on NH3 emissions(standard Danish storage moved to other locations).
2087 relative to 2007 2087 relative to 2010

ACCENT-plus Symposium, Urbino 2013
Conclusions and outlook (1):• Today – often one national emission factor is used (for several year).
This[6] study shows: • Emissions can vary with 20% by changing geographical location within a country due to overall variations
in climate. Largest uncertainties are seen for large countries like UK, Germany and France.
• Warmer years give higher NH3 emissions than colder years. Annual variations in overall climate can at specific locations cause uncertainties in the range of 20%.
• Climate change will in general increase the emissions with 0-40%, in central to northern Europe – so yes the increase in emissions might hinder mitigations effects….
• The “climate penalty” has political implications for international regulation both now and in the future – how should we define and evaluate emissions ceilings and should “warmer” countries be allowed to emit more …?
[6]The effect of climate and climate change on ammonia emissions in Europe Skjøth and Geels (2013)
Atmos. Chem. Phys., 13, 117–128.
ACCENT-plus Symposium, Urbino 2013
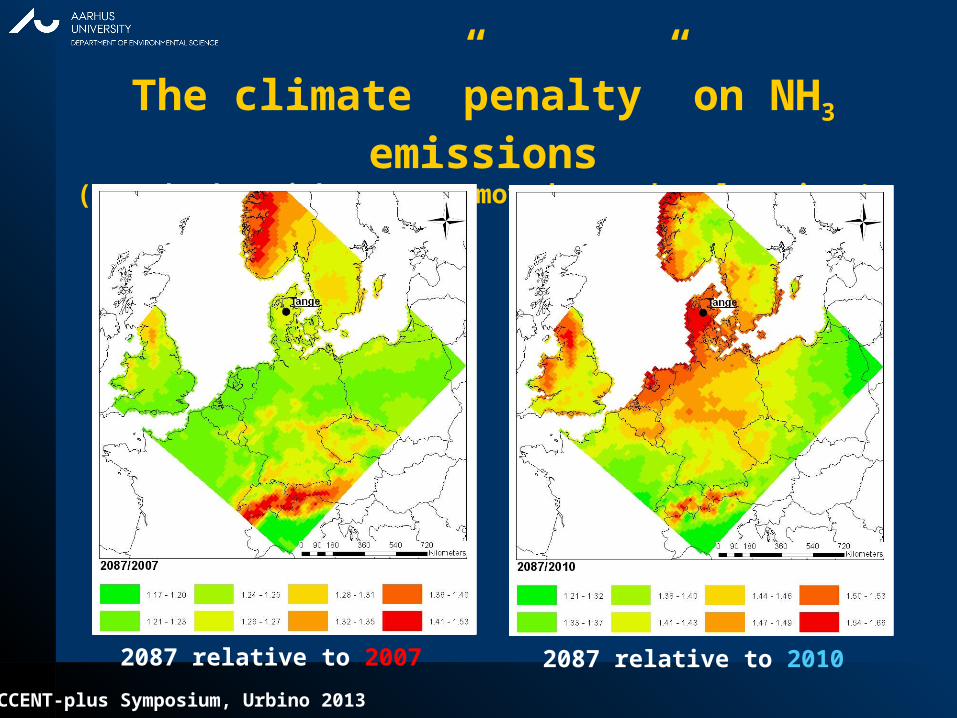
Possible way to include this in models: include dynamical calculations of the ammonia emissions.
The dynamic NH3 model will be part of a proposed architecture for handling the climate-dependence of NH3 fluxes in models.
On-going work in the ECLAIRE project.
Described in the paper: Towards a climate-dependent paradigm of ammonia emission
and deposition,By Sutton et al.,
Phil. Trans. Royal Society B vol. 368 no. 1621, 2013.
Conclusions and outlook (2):

ACCENT-plus Symposium, Urbino 2013
Thank you for your attention!- and contact us if you would like to get the code.
Acknowledgements:ECLAIRE (FP7), ECOCLIM (Dan. Res. Council) and VKR-foundation
Contacts: Carsten Ambelas Skjøth ([email protected]) & Camilla Geels ([email protected])