Embed Size (px)
Citation preview
The Role of Decomposition Kinetics in Pyrolysis Modeling – Application to a Fire Retardant Polyester Composite
CHRIS LAUTENBERGER1, ESTHER KIM2, NICHOLAS DEMBSEY2, and CARLOS FERNANDEZ-PELLO1 1University of California, Berkeley 2Worcester Polytechnic Institute Department of Mechanical Engineering Department of Fire Protection Engineering Berkeley, CA 94720 100 Institute Road Worcester, MA 01609
ABSTRACT
This work assesses the effect of decomposition kinetics on overall pyrolysis behavior using experimental data from thermogravimetric analysis (TGA) and Fire Propagation Apparatus (FPA) experiments. TGA data are presented for an unsaturated brominated polyester resin (reinforcement free), and the FPA is used to investigate the pyrolysis behavior of a fiber reinforced polymer (FRP) composite slab with matrix comprised of the same resin tested via TGA. Three different kinetic models are fit to the TGA data: single-step nth order, 3-step nth order, and 3-step nth order with one autocatalytic step. These kinetics models are then used to simulate the pyrolysis of a composite slab in the FPA, with thermophysical properties estimated by genetic algorithm optimization. It is shown that the two 3-step mechanisms provide nearly identical calculations of total mass loss rate (MLR) in the FPA, while the single-step mechanism provides similar, but quantitatively different, MLR predictions. Although no broad conclusions regarding the importance of multi-step thermal decomposition kinetics can be drawn on the basis of a single study, detailed reaction mechanisms may be superfluous unless TGA curves show multiple distinct reaction peaks and/or all thermophysical properties/model input parameters are precisely known.
KEYWORDS: modeling, heat transfer, pyrolysis, composites
NOMENCLATURE LISTING
c specific heat capacity (J/kg-K) β heating rate (K/min) E activation energy (J/mole) γ radiant conductivity length (m) h specific enthalpy (J/kg) δ thickness (m) hc convective heat transfer coefficient (W/m2-K) ε emissivity (-) ΔH change in enthalpy (J/kg) κ radiant absorption coefficient (m-1) k thermal conductivity (W/m-K) ρ density (kg/m3) K # of condensed phase reactions σ Stefan–Boltzmann constant (W/m2–K4) m mass (kg), autocatalytic exponent (-) φ generic variable m ′′ mass per unit area (kg/m2) ψ porosity m ′′ mass flux (kg/m2s) ω ′′′ volumetric reaction rate (kg/m3–s) M # of condensed phase species Subscriptsn reaction order (-), property exponent (-) d destruction N # of gas phase species f formation q ′′ heat flux (W/m2) g gaseous Q ′′′ volumetric heat release rate (W/m3) i condensed phase species i t time (s) j gas phase species j T temperature (K) k reaction k X volume fraction (-) r reference or radiative Y mass fraction (-) s solid z distance (m) vol volatilization Z pre-exponential factor (s-1) 0 at t = 0 or z = 0 Greek ∞ ambient, or at the end of an experiment α conversion δ At z = δ
Accepted for publication in Fire Safety Science - Proceedings of the 9th International Symposium
INTRODUCTION
Bench-scale flammability tests such as the Cone Calorimeter and Fire Propagation Apparatus (FPA) provide a mechanism to assess a material’s reaction to fire. From these laboratory tests, a material’s overall flammability can be evaluated on the basis of measured quantities such as heat release rate or mass loss rate (MLR) history, species yields, smoke production rate, heat of combustion, etc. Furthermore, by conducting experiments at multiple heat flux levels, apparent material fire properties such as thermal inertia, ignition temperature, and heat of gasification can be determined. These quantities are useful for establishing relative rankings of material flammability or as input to semi-empirical fire growth models.
In recent years, detailed physics-based pyrolysis models have seen increased usage in the fire community. For example, Fire Dynamics Simulator Version 5 (FDS5) contains a comprehensive pyrolysis model capable of simulating the thermal decomposition of both charring and noncharring solids. This pyrolysis model can accommodate multi-step decomposition kinetics, layered composition, and in-depth absorption of radiation. However, inclusion of these physical phenomena comes at a price: a large number of adjustable parameters (“material properties”) must be specified to characterize a particular material. These properties include pyrolysis kinetics (pre-exponential factor, activation energy, reaction order), thermal properties (specific heat capacity, thermal conductivity), and radiative characteristics (surface emissivity, in-depth radiation absorption coefficient). For many of these material properties, there are no standardized and widely accepted techniques to determine these properties from laboratory tests. The number of adjustable parameters becomes onerous when multi-step reactions with multiple condensed phase species having temperature-dependent thermal properties are considered.
An optimal pyrolysis modeling strategy balances complexity with minimizing the number of adjustable input parameters. This can be accomplished by including only essential physics or reactions in a simulation, and omitting all extraneous physics and reactions. However, it is not always obvious what constitutes “essential” or “extraneous” physics and reactions. This multifaceted and complex issue cannot be completely resolved in a single paper, so here we focus on one particular aspect: decomposition kinetics. Using a fire retardant polyester composite as an example, we investigate whether a multi-step kinetic mechanism extracted from thermogravimetric analysis (TGA) provides a more “accurate” description of solid fuel slab pyrolysis (e.g. in an FPA experiment) than a single-step global nth order Arrhenius reaction (the conventional pyrolysis modeling paradigm in the fire community). This fiber reinforced polymer (FRP) composite is considered a representative “practical” heterogeneous material.
Below, a methodology is presented that can be used to assess the minimum number of reaction steps that must be included in a decomposition mechanism to capture the major features of differential thermogravimetric (DTG) curves. First, two different three-step decomposition mechanisms and a single-step global mechanism are fit to DTG curves obtained at four heating rates between 5 K/min and 50 K/min under nitrogen. Next, holding these kinetic parameters fixed, an FPA experiment of a 1 cm thick FRP composite (with matrix comprised of the same resin tested via TGA) irradiated at 50 kW/m2 under nitrogen is simulated with the three different decomposition mechanisms.
CONDENSED PHASE PYROLYSIS MODEL
The calculations reported here are conducted with a generalized pyrolysis model [1], similar to that used in FDS5, that can be applied to a wide variety of condensed phase fuels. This model can be applied to both 0D and 1D systems and is therefore capable simulating both “lumped” (thermogravimetric) and “slab” (Cone Calorimeter/FPA) experiments. Extensive details are given in Ref. [1] so only a brief overview is given here. Assumptions inherent in the model, as applied in this paper, include:
• Each condensed phase species has well-defined “properties”: bulk density, specific heat capacity, effective thermal conductivity, and porosity. An overbar denotes a weighted or averaged quantity, i.e.
∑= iikXk .
• Specific heat capacity and effective thermal conductivity vary by as ( ) ( ) φφφ nrTTT 0= where Tr is a
reference temperature, φ0 is the value of k or c at Tr, and nφ specifies the temperature dependency of φ
Accepted for publication in Fire Safety Science - Proceedings of the 9th International Symposium
• Radiation heat transfer across pores is accounted for by adding a contribution to the effective thermal conductivity that varies as γT 3, where γ is a fitting parameter
• Averaged properties in conservation equations are calculated by appropriate mass or volume fraction weighting
• All gases escape to the exterior ambient with no resistance to heat or mass transfer
• Negligible heat transfer between the gas phase and the condensed phase inside the decomposing solid
• There is no net shrinkage (volume change) due to reactions or bulk density changes
The one-dimensional (slab) transient conservation equations are given as Eqs. 1-4:
Condensed phase mass conservation:
fgtω
ρ ′′′−=∂∂ (1)
Gas phase mass conservation:
( )fg
g
zm
tω
ψρ′′′=
∂′′∂
+∂
∂ (2)
Condensed phase species conservation:
( )difi
i
tY
ωωρ ′′′−′′′=∂
∂ (3)
Condensed phase energy conservation:
( ) ( )∑∑==
′′′−′′′+′′′+⎟⎠⎞
⎜⎝⎛
∂∂
∂∂
=∂
∂ M
iidifi
K
kks hQ
zTk
zth
11, ωωρ (4)
The gaseous mass flux at any point in the decomposing solid is calculated by integrating Eq. 2 from the back face to the front face:
( ) ( )∫ ⎟⎟
⎠
⎞⎜⎜⎝
⎛∂
∂−′′′+′′=′′
z gfg t
mzm
δδ
ψρω (5)
where, since the back face is assumed impermeable, 0=′′δm . When discretized, the above equations yield a system of coupled algebraic equations that are solved numerically. The recommendations of Patankar [2] are followed closely. Due to the nonlinearity introduced by the source terms and temperature-dependent thermophysical properties, a fully-implicit formulation is adopted for solution of all equations. The condensed phase energy conservation equation is solved using a computationally efficient tridiagonal matrix algorithm (TDMA). The condensed phase mass and condensed phase species conservation equations are solved with a customized fully implicit solver that uses overrelaxation to prevent divergence. Source terms are split into positive and negative components to ensure physically realistic results and prevent negative mass fractions or densities from occurring [2]. Newton iteration is used to extract the temperature from the weighted enthalpy and the condensed phase species mass fractions [1].
The initial conditions describe the state of the solid (density, species mass fractions) at t=0. The “front-face” boundary condition (where radiation from the FPA heaters is incident) is a convective-radiative balance. Following de Ris and Khan [3], the back-face of the FRP composite loses heat to the underlying sample holder (3 mm Cotronics ceramic paper thermal insulation) proportional to an inverse contact resistance. The sample holder is treated in the model as a separate layer, with its temperature-dependent thermal properties estimated from de Ris and Khan [3].
The above governing equations can also be used to simulate thermogravimetric experiments. Since this involves only a single 0D lumped particle (Bi << 1), the preceding coupled partial differential equations
Accepted for publication in Fire Safety Science - Proceedings of the 9th International Symposium
become coupled (transient) ordinary differential equations, i.e. only a single control volume (representing a thermogravimetric sample) is considered. Since the particle temperature is assumed equal to the atmosphere temperature (which increases linearly with time) the condensed phase energy conservation (Eq. 4) is replaced with the following relation:
tTT β+= 0 (6)
The condensed phase mass and species conservation equations (Eqs. 1 and 3) remain unchanged, with the exception that the partial time derivative becomes a total time derivative since there is no spatial variation in mass or species (homogeneous particle). Differential thermogravimetric curves are calculated from the formation rate of gases normalized by the initial particle bulk density:
00dd
=
′′′−=⎟⎟
⎠
⎞⎜⎜⎝
⎛′′′′
t
fg
mm
t ρω
(7)
Thermogravimetric curves are then calculated by integrating Eq. 7:
( ) ( ) ( )∫ ′′′−=′′′′
=−=
tfg
t
tmmt
0 00
d111 ττωρ
α (8)
The governing equations presented earlier contain several source terms attributed to chemical reactions ( fgω ′′′ , fiω ′′′ , diω ′′′ , and ksQ ,′′′ ) that must be quantified. Heterogeneous reaction stoichiometry can be written in general form as:
jBjAN
jkjkkB
N
jkjk gas kg kg gas kg kg 1
1,,
1, ∑∑
==
′′+→′+ ννν where k
k
A
BkB ρ
ρν =, (9)
Each reaction k converts a condensed phase species having index Ak to a condensed phase species having index Bk. Gases may be consumed or produced in the process, but it is assumed here for simplicity that
0, =′ kjν and N = 1. The destruction rate of condensed phase species Ak by reaction k is calculated as:
⎟⎠⎞
⎜⎝⎛−⎟
⎟⎠
⎞⎜⎜⎝
⎛=′′′
==
RTEZ
Yf k
ktt
AdA
kk
exp00
ρρρ
ω (10)
The term ( )0=tAkYf ρρ on the RHS of Eq. 10 is the kinetic model, described in greater detail below. The
formation rate of condensed phase species Bk by reaction k is related to bulk density ratios:
kk
kkk dA
A
BdAkBfB ω
ρρ
ωνω ′′′=′′′=′′′ , (11)
The formation rate of all gases (conversion rate of condensed phase mass to gas phase mass) by reaction k is:
( )k
k
kkk dA
A
BdAkBfg ω
ρρ
ωνω ′′′⎟⎟⎠
⎞⎜⎜⎝
⎛−=′′′−=′′′ 11 , (12)
Associated with each reaction k is a heat of reaction ΔHvol,k and the source term appearing in Eq. 4 is calculated as the volumetric formation rate of gases multiplied by ΔHvol,k:
kvolfgks HQk ,, Δ′′′−=′′′ ω (13)
The total source terms appearing in the conservation equations are obtained by summing over all reactions:
Accepted for publication in Fire Safety Science - Proceedings of the 9th International Symposium
∑=
′′′=′′′K
kdAAidi kk
1, ωδω
⎩⎨⎧
≠
==
k
kAi Ai
Aik if0
if1,δ (14)
∑=
′′′=′′′K
kfBBifi kk
1, ωδω
⎩⎨⎧
≠
==
k
kBi Bi
Bik if0
if1,δ (15)
∑=
′′′=′′′K
kfgfg k
1ωω (16)
DESCRIPTION OF RESIN AND COMPOSITE SLAB
The resin in this study is a commercially prepared brominated unsaturated polyester resin with 20% bromination by mass built in to the carbon back bone. Antimony trioxide is added to enhance flame retardancy. The resin was catalyzed with methyl ethyl ketone peroxide (MEKP). According to the product description, this resin is a low viscosity, thixed polyester resin formulated to be Class I per ASTM E84 (flame spread index < 25 and smoke developed < 450).
Composite panels (33% glass by mass and approximately 10 mm in thickness) were fabricated by hand lay-up using two different types of fiberglass mats that were fully wetted with resin. The two types of fiberglass (E-glass) used in the composite are a chopped strand mat and a glass roving with an area density of 25 g/m2 and 880 g/m2, respectively. The chopped strand mat is thinner and more porous than the roving. The laminate schedule (provided by the manufacturer) is chopped strand mat and roving alternating five times with another chopped strand mat layer at the end. Visual inspection of a polished cross-section of the composite slab is consistent with this laminate schedule, but with polymer resin layers between each fiberglass layer. The chopped strand mat layer is difficult to identify in the cross section, perhaps because more resin is soaked into this layer than the roving layer. The roving layer is observed as a prominent glass layer possibly because the resin is absorbed only at the fiberglass layer surfaces leaving the interior with primarily glass.
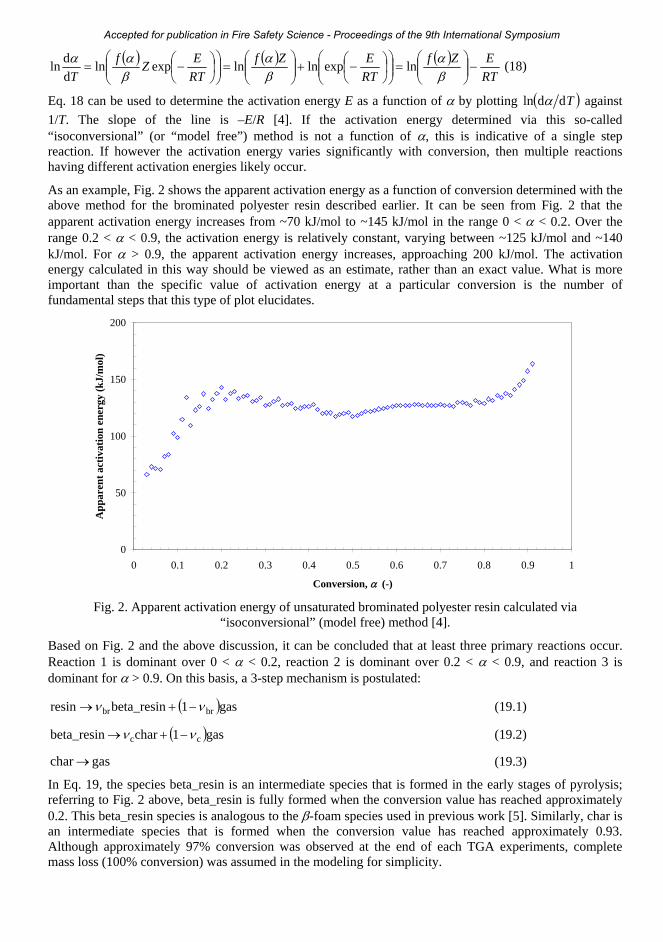
The layered microstructure is determined to a resolution of ~0.07 mm by inspecting a polished cross-section of the composite under a microscope. Based on visual observation and comparison to global density of the composite sample, approximations of three distinct layers are proposed: 100% resin, 100% glass, and 50% resin/50% glass. The microstructure is shown schematically in Fig. 1. The lightest “box” represents 100% resin, the medium darkness box represents 50% resin/50% glass, and the darkest box represents 100% glass. Each box has a thickness of ~0.07 mm.
Fig. 1. Approximation of three distinct layers in composite microstructure.
THERMAL DECOMPOSITION OF RESIN POLYMER
The resin’s thermal stability is investigated via TGA using a PerkinElmer Thermogravimetric Analysis 7 (TGA7) instrument. Experiments are conducted under nitrogen at heating rates of 5 K/min, 10 K/min, 30 K/min, and 50 K/min. The initial mass of each sample ranges from ~7.5 mg to ~10.5 mg.
Apparent number of reaction steps – isoconversional method
Thermogravimetric experiments are often analyzed using a kinetic model of the form:
( ) ⎟⎠⎞
⎜⎝⎛−=
RTEZf
texp
dd αα (17)
Eq. 17 can also be obtained after dividing Eq. 10 by 0=tρ , considering only a single condensed phase
species, and defining the conversion 01=
−= tρρα . Substituting the linear heating rate tT dd=β into Eq. 17 and taking the natural logarithm of both sides gives:
Accepted for publication in Fire Safety Science - Proceedings of the 9th International Symposium
( ) ( ) ( )RTEZf
RTEZf
RTEZf
T−⎟⎟
⎠
⎞⎜⎜⎝
⎛=⎟⎟
⎠
⎞⎜⎜⎝
⎛⎟⎠⎞
⎜⎝⎛−+⎟⎟
⎠
⎞⎜⎜⎝
⎛=⎟⎟
⎠
⎞⎜⎜⎝
⎛⎟⎠⎞
⎜⎝⎛−=
βα
βα
βαα lnexplnlnexpln
ddln (18)
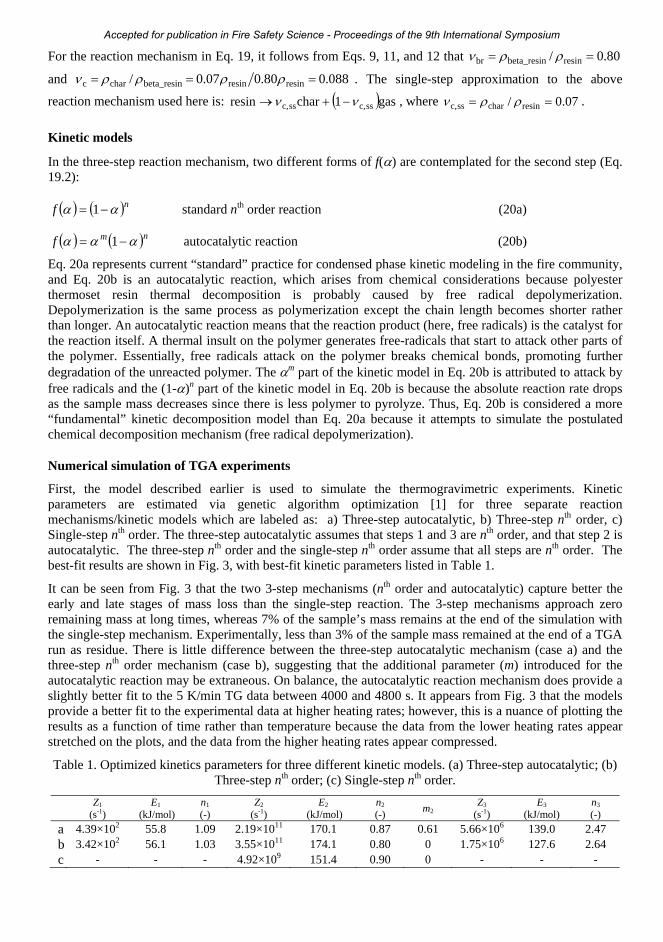
Eq. 18 can be used to determine the activation energy E as a function of α by plotting ( )Tddln α against 1/T. The slope of the line is –E/R [4]. If the activation energy determined via this so-called “isoconversional” (or “model free”) method is not a function of α, this is indicative of a single step reaction. If however the activation energy varies significantly with conversion, then multiple reactions having different activation energies likely occur.
As an example, Fig. 2 shows the apparent activation energy as a function of conversion determined with the above method for the brominated polyester resin described earlier. It can be seen from Fig. 2 that the apparent activation energy increases from ~70 kJ/mol to ~145 kJ/mol in the range 0 < α < 0.2. Over the range 0.2 < α < 0.9, the activation energy is relatively constant, varying between ~125 kJ/mol and ~140 kJ/mol. For α > 0.9, the apparent activation energy increases, approaching 200 kJ/mol. The activation energy calculated in this way should be viewed as an estimate, rather than an exact value. What is more important than the specific value of activation energy at a particular conversion is the number of fundamental steps that this type of plot elucidates.
0
50
100
150
200
0 0.1 0.2 0.3 0.4 0.5 0.6 0.7 0.8 0.9 1
Conversion, α (-)
App
aren
t act
ivat
ion
ener
gy (k
J/m
ol)
Fig. 2. Apparent activation energy of unsaturated brominated polyester resin calculated via
“isoconversional” (model free) method [4].
Based on Fig. 2 and the above discussion, it can be concluded that at least three primary reactions occur. Reaction 1 is dominant over 0 < α < 0.2, reaction 2 is dominant over 0.2 < α < 0.9, and reaction 3 is dominant for α > 0.9. On this basis, a 3-step mechanism is postulated:
( )gas1beta_resinresin brbr νν −+→ (19.1)
( )gas1charbeta_resin cc νν −+→ (19.2)
gaschar → (19.3)
In Eq. 19, the species beta_resin is an intermediate species that is formed in the early stages of pyrolysis; referring to Fig. 2 above, beta_resin is fully formed when the conversion value has reached approximately 0.2. This beta_resin species is analogous to the β-foam species used in previous work [5]. Similarly, char is an intermediate species that is formed when the conversion value has reached approximately 0.93. Although approximately 97% conversion was observed at the end of each TGA experiments, complete mass loss (100% conversion) was assumed in the modeling for simplicity.
Accepted for publication in Fire Safety Science - Proceedings of the 9th International Symposium
For the reaction mechanism in Eq. 19, it follows from Eqs. 9, 11, and 12 that 80.0/ resinbeta_resinbr == ρρν
and 088.080.007.0/ resinresinbeta_resincharc === ρρρρν . The single-step approximation to the above
reaction mechanism used here is: ( )gas1charresin ssc,ssc, νν −+→ , where 07.0/ resincharssc, == ρρν .
Kinetic models
In the three-step reaction mechanism, two different forms of f(α) are contemplated for the second step (Eq. 19.2):
( ) ( )nf αα −= 1 standard nth order reaction (20a)
( ) ( )nmf ααα −= 1 autocatalytic reaction (20b)
Eq. 20a represents current “standard” practice for condensed phase kinetic modeling in the fire community, and Eq. 20b is an autocatalytic reaction, which arises from chemical considerations because polyester thermoset resin thermal decomposition is probably caused by free radical depolymerization. Depolymerization is the same process as polymerization except the chain length becomes shorter rather than longer. An autocatalytic reaction means that the reaction product (here, free radicals) is the catalyst for the reaction itself. A thermal insult on the polymer generates free-radicals that start to attack other parts of the polymer. Essentially, free radicals attack on the polymer breaks chemical bonds, promoting further degradation of the unreacted polymer. The αm part of the kinetic model in Eq. 20b is attributed to attack by free radicals and the (1-α)n part of the kinetic model in Eq. 20b is because the absolute reaction rate drops as the sample mass decreases since there is less polymer to pyrolyze. Thus, Eq. 20b is considered a more “fundamental” kinetic decomposition model than Eq. 20a because it attempts to simulate the postulated chemical decomposition mechanism (free radical depolymerization).
Numerical simulation of TGA experiments
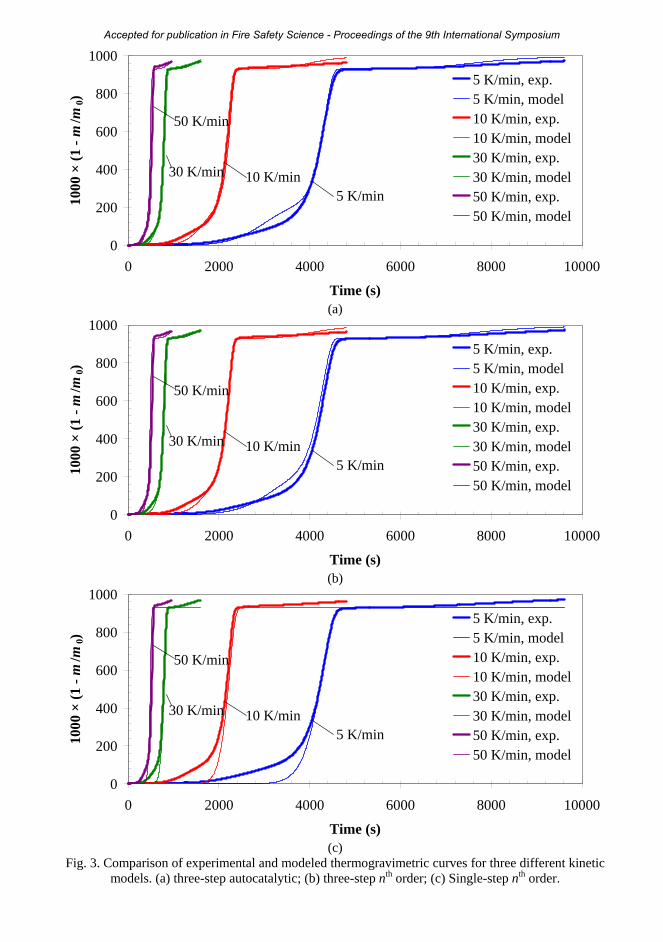
First, the model described earlier is used to simulate the thermogravimetric experiments. Kinetic parameters are estimated via genetic algorithm optimization [1] for three separate reaction mechanisms/kinetic models which are labeled as: a) Three-step autocatalytic, b) Three-step nth order, c) Single-step nth order. The three-step autocatalytic assumes that steps 1 and 3 are nth order, and that step 2 is autocatalytic. The three-step nth order and the single-step nth order assume that all steps are nth order. The best-fit results are shown in Fig. 3, with best-fit kinetic parameters listed in Table 1.
It can be seen from Fig. 3 that the two 3-step mechanisms (nth order and autocatalytic) capture better the early and late stages of mass loss than the single-step reaction. The 3-step mechanisms approach zero remaining mass at long times, whereas 7% of the sample’s mass remains at the end of the simulation with the single-step mechanism. Experimentally, less than 3% of the sample mass remained at the end of a TGA run as residue. There is little difference between the three-step autocatalytic mechanism (case a) and the three-step nth order mechanism (case b), suggesting that the additional parameter (m) introduced for the autocatalytic reaction may be extraneous. On balance, the autocatalytic reaction mechanism does provide a slightly better fit to the 5 K/min TG data between 4000 and 4800 s. It appears from Fig. 3 that the models provide a better fit to the experimental data at higher heating rates; however, this is a nuance of plotting the results as a function of time rather than temperature because the data from the lower heating rates appear stretched on the plots, and the data from the higher heating rates appear compressed.
Table 1. Optimized kinetics parameters for three different kinetic models. (a) Three-step autocatalytic; (b) Three-step nth order; (c) Single-step nth order.
Z1 (s-1)
E1 (kJ/mol)
n1 (-)
Z2 (s-1)
E2 (kJ/mol)
n2 (-) m2
Z3 (s-1)
E3 (kJ/mol)
n3 (-)
a 4.39×10² 55.8 1.09 2.19×10¹¹ 170.1 0.87 0.61 5.66×10⁶ 139.0 2.47 b 3.42×10² 56.1 1.03 3.55×10¹¹ 174.1 0.80 0 1.75×10⁶ 127.6 2.64 c - - - 4.92×10⁹ 151.4 0.90 0 - - -
Accepted for publication in Fire Safety Science - Proceedings of the 9th International Symposium
0
200
400
600
800
1000
0 2000 4000 6000 8000 10000
Time (s)
1000
× (1
- m
/m0)
5 K/min, exp.5 K/min, model10 K/min, exp.10 K/min, model30 K/min, exp.30 K/min, model50 K/min, exp.50 K/min, model
5 K/min10 K/min30 K/min
50 K/min
(a)
0
200
400
600
800
1000
0 2000 4000 6000 8000 10000
Time (s)
1000
× (1
- m
/m0)
5 K/min, exp.5 K/min, model10 K/min, exp.10 K/min, model30 K/min, exp.30 K/min, model50 K/min, exp.50 K/min, model
5 K/min10 K/min30 K/min
50 K/min
(b)
0
200
400
600
800
1000
0 2000 4000 6000 8000 10000
Time (s)
1000
× (1
- m
/m0)
5 K/min, exp.5 K/min, model10 K/min, exp.10 K/min, model30 K/min, exp.30 K/min, model50 K/min, exp.50 K/min, model
5 K/min10 K/min30 K/min
50 K/min
(c)
Fig. 3. Comparison of experimental and modeled thermogravimetric curves for three different kinetic models. (a) three-step autocatalytic; (b) three-step nth order; (c) Single-step nth order.
Accepted for publication in Fire Safety Science - Proceedings of the 9th International Symposium
SIMULATION OF FPA EXPERIMENTS
The preceding TGA experiments were conducted with polyester resin that contained no glass reinforcements. This same resin forms the matrix of the FRP composite slab (having woven glass reinforcements) that is tested in the FPA. It was shown in Fig. 1 that the composite slab is far from homogeneous, with distinct layers of 100% glass, 100% resin, and a 50%/50% mixture of resin and glass. However, as a first approximation and to focus on decomposition kinetics, the heterogeneous FRP composite slab is modeled here as an equivalent homogeneous slab having the same global glass content as the FRP composite (33% by mass). It is assumed here that the glass is inert and that only the resin reacts. We plan to address the effect of layered structure on slab pyrolysis behavior in future work.
The FPA experiments involve irradiating (under nitrogen) circular FRP composite samples with a radius of 9.7 cm (area of 74 cm2) at 50 kW/m2 and measuring the resultant mass loss. To facilitate temperature measurements, thermocouples are positioned at the sample surface, 1/3 and 2/3 of its thickness, and at its back face. The sample holder consists of 3 mm Cotronics ceramic paper thermal insulation [3]. To ensure that most of the incident radiation is absorbed at the irradiated surface, samples are coated with a thin layer of carbon black in accordance with ASTM E2058. The composite tested here (referred to as material “1a”) has a thickness of 10.2 mm and a glass content of 33% by mass.
In the numerical simulations of the FPA experiments, the kinetics coefficients extracted earlier from TGA are held fixed. Three separate cases (corresponding to each kinetic model) are considered: 3-step autocatalytic, 3-step nth order, and single step. First, the unknown model input parameters (thermophysical properties, reaction enthalpies, and surface emissivities) are estimated by genetic algorithm optimization [1] from the FPA data for the nth order case since it is the standard model in the fire community and was shown to provide a very good fit to the TGA data in Fig 3. Next, the 3-step autocatalytic mechanism is assessed by holding fixed all input parameters and swapping the 3-step nth order mechanism for the 3-step autocatalytic mechanism. The final simulation involves replacing the three-step reaction mechanism with the single-step reaction mechanism. The calculated MLR for each case is compared to the available experimental data to assess how the complexity of the reaction mechanism affects global decomposition behavior of a composite slab.
In the simulations, four condensed phase “pseudo” species are tracked: resin_glass (33% glass by mass bonded to 67% resin by mass), betaresin_glass (a mixture of beta resin and glass), char_glass (a mixture of char and glass), and porous_glass (the glass reinforcements that remain after all resin has pyrolyzed, leaving behind a porous glass structure consisting primarily of woven glass reinforcements).
As explained in Ref. [1], the bulk density of condensed phase species mixtures can be calculated as ( ) ∑∑ == −
iiii XY ρρρ 1 . Here, the bulk density of species resin_glass is calculated from the density of
the resin (1350 kg/m3) and the glass (2600 kg/m3) as ( ) 31sresin_glas kg/m 1605== ∑ −
iiY ρρ . Using the
relation glassglassresinresinsresin_glas ρρρρ XXX ii +== ∑ , the volume fraction of glass in species resin_glass is calculated to be 0.20. The bulk density of species betaresin_glass is calculated as:
3glassglassbeta_resinbeta_resinglassbetaresin_ kg/m 138426002.013508.08.0 =×+××=+== ∑ ρρρρ XXX ii
where use has been made of the relation 80.0/ resinbeta_resinbr == ρρν . Finally, the bulk densities of species
char_glass and porous_glass are 3char_glass kg/m 59626002.0135007.08.0 =×+××== ∑ iiX ρρ and
3ssporous_gla kg/m 52026002.0 =×=ρ .
The above bulk density calculations (and the governing equations presented earlier) assume that there is no net volume change in the unpyrolyzed vs. pyrolyzed sample. The kinetic mechanism from the TGA experiments (involving resin with no reinforcements) must be adapted to fit into the above framework. Specifically, Eq. 19 becomes:
Accepted for publication in Fire Safety Science - Proceedings of the 9th International Symposium
( )gas1glassbetaresin_sresin_glas brgbrg νν −+→ (21.1)
( )gas1char_glassglassbetaresin_ cgcg νν −+→ (21.2)
( )gas1ssporous_glachar_glass pgpg νν −+→ (21.3)
For the reaction mechanism in Eq. 21, it follows from Eqs. 9, 11, and 12:
86.0/ sresin_glasglassbetaresin_brg == ρρν , 43.0/ glassbetaresin_char_glasscg == ρρν , and
87.0/ char_glassssporous_glapg == ρρν .
The kinetics coefficients in Eq. 21 (resin/glass reaction mechanism) are the same as in Eq. 19 (reaction mechanism for 100% resin) except that the pre-exponential factors determined by thermogravimetric analysis are multiplied by the pyrolyzable volume fraction (0.8, as calculated above). An alternative is to multiply the pre-exponential factors by the pyrolyzable mass fraction, but this is not investigated here.
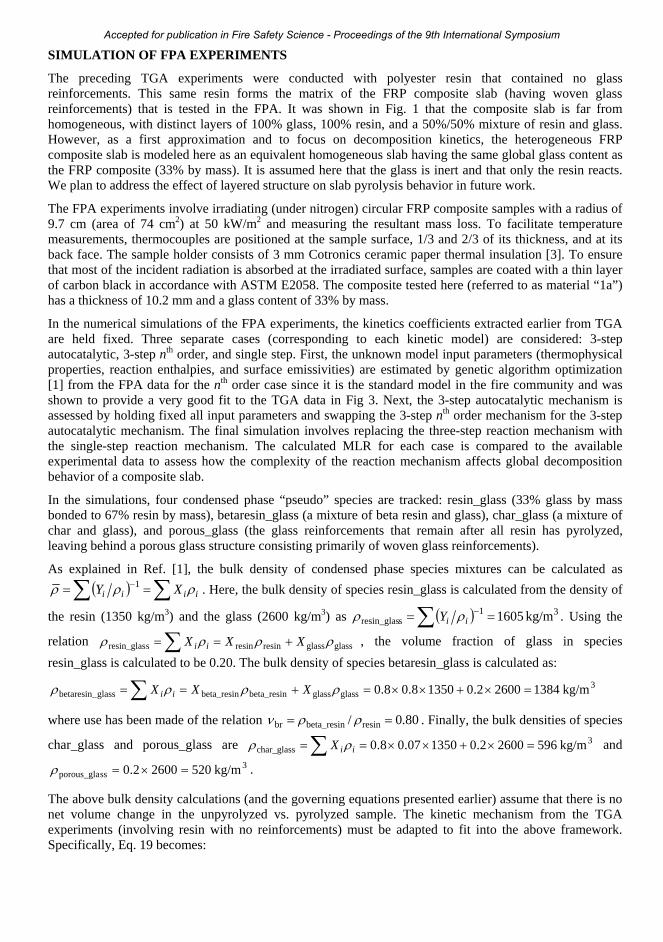
A comparison of the optimized model calculations and the experimental data is shown in Fig. 4 for the 3-step nth order mechanism. The thermophysical properties used in these calculations are listed in Table 2 (ΔHvol is 1.3 × 10⁵ J/kg, 2.3 × 10⁵ J/kg, and 1.4 × 10⁶ J/kg respectively for reactions 1, 2, and 3). Fig. 4a-4c compare the measured and modeled temperatures. The maximum deviation from the experimental data is ~60 K, approximately consistent with the global measurement uncertainty of 50 K [6] indicating that the calculated temperature traces match the experimental data. The measured and calculated MLR is shown in Fig. 4d. The model correctly captures the general “dual peak” shape of the MLR curve. However, the second peak is over-calculated compared to the experimental data.
The reason for the over-calculation of the second MLR peak may be due to different pyrolyzable mass fractions of resin (i.e., different resin conversions) in the TGA and FPA experiments. From the TGA kinetic modeling above, 93% of the resin’s mass pyrolyzes in the first two steps of the reaction mechanism to form “char”. Assuming that in the FPA experiments the resin reacts to form char, but that this char does not further react, the total mass loss per unit area is: 0.67 × 0.93 × 1605 kg/m3 × 10.2 mm = 10.2 kg/m2 (where 0.67 is the pyrolyzable mass fraction and the 0.93 factor assumes that the char does not further react, i.e. the final resin conversion is 0.93). The cumulative mass loss calculated by the model after 900 s is 10.5 kg/m2 (resin conversion of 0.96) because in the model some of the char has reacted, i.e. char_glass has started reacting to form porous_glass. In comparison, the experimental data show a cumulative mass loss of only 7.6 kg/m2 (resin conversion of 0.69) after 900 s. It appears that the resin conversion is different in the TGA and FPA experiments. Although this finding has practical ramifications, the main focus of this paper is relative changes in slab pyrolysis behavior caused by decomposition kinetics. The differences encountered here may be caused (indirectly) by experimental error in the temperature measurements. If the measured temperature is hotter than the actual temperature of the condensed phase, the optimized model would over-predict the MLR since its thermophysical properties are optimized to make the calculated temperatures match the experimental data. Another contributing effect may be the heterogeneous nature of the composite, which is approximated here as a homogeneous equivalent. The woven glass layers could act as a thermal barrier (thereby limiting resin pyrolysis) or a physical barrier (thereby preventing pyrolyzed resin from escaping). A model that explicitly considers the laminated microstructure would be required to capture this effect.
Table 2. Optimized thermophysical properties used in slab pyrolysis simulations.
Species ρ0 (kg/m3)
k0 (W/m-K)
nk (-)
c0 (J/kg-K)
nc (-)
ε (-)
γ (m)
resin_glass 1600 0.240 0.116 1465 0.180 0.98 0 betaresin_glass 1384 0.278 0.239 1331 0.184 0.98 0 char_glass 596 0.130 0.165 938 0.026 1.00 2.5×10⁻³ porous_glass 520 0.130 0.173 924 0.025 1.00 3.7×10⁻³ Cotronics 168 0.028 1.270 800 0.190 1.00 0
Accepted for publication in Fire Safety Science - Proceedings of the 9th International Symposium
0
100
200
300
400
500
600
700
0 300 600 900
Time (s)
Tem
pera
ture
(°C
)
ExperimentModel
Experiment
Model
0
100
200
300
400
500
600
700
0 300 600 900
Time (s)
Tem
pera
ture
(°C
)
ExperimentModel
Experiment
Model
(a) (b)
0
100
200
300
400
500
600
700
0 300 600 900
Time (s)
Tem
pera
ture
(°C
)
ExperimentModel
Experiment
Model
0
5
10
15
20
25
0 300 600 900
Time (s)
Mas
s los
s rat
e (g
/m2 -s
)
ExperimentModel
(c) (d) Fig. 4. Comparison of calculations (3-step nth order) and experimental data for pyrolysis of FRP polyester
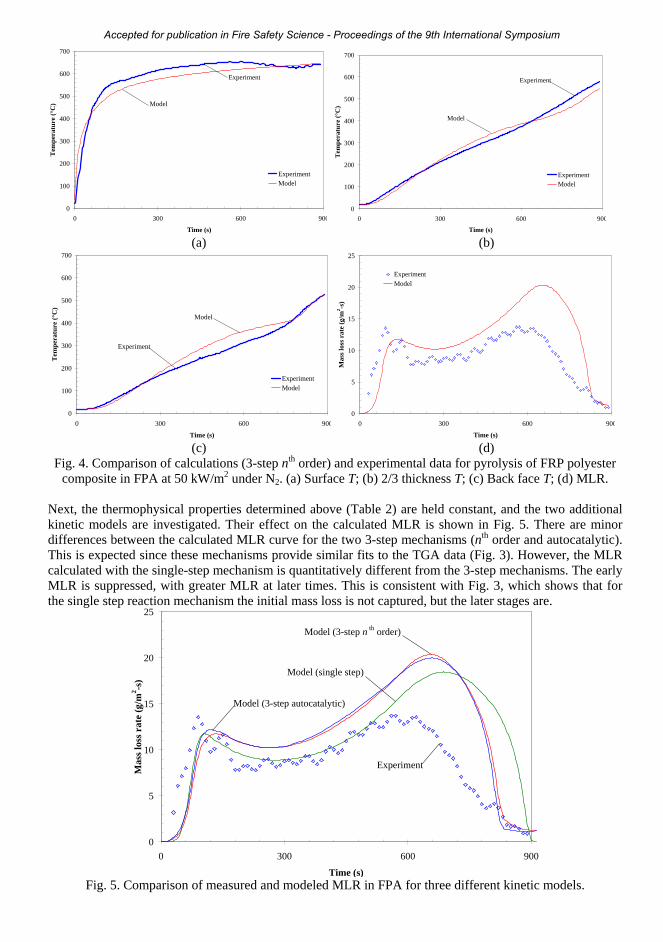
composite in FPA at 50 kW/m2 under N2. (a) Surface T; (b) 2/3 thickness T; (c) Back face T; (d) MLR. Next, the thermophysical properties determined above (Table 2) are held constant, and the two additional kinetic models are investigated. Their effect on the calculated MLR is shown in Fig. 5. There are minor differences between the calculated MLR curve for the two 3-step mechanisms (nth order and autocatalytic). This is expected since these mechanisms provide similar fits to the TGA data (Fig. 3). However, the MLR calculated with the single-step mechanism is quantitatively different from the 3-step mechanisms. The early MLR is suppressed, with greater MLR at later times. This is consistent with Fig. 3, which shows that for the single step reaction mechanism the initial mass loss is not captured, but the later stages are.
0
5
10
15
20
25
0 300 600 900
Time (s)
Mas
s los
s rat
e (g
/m2 -s
)
Experiment
Model (3-step autocatalytic)
Model (3-step n th order)
Model (single step)
Fig. 5. Comparison of measured and modeled MLR in FPA for three different kinetic models.
Accepted for publication in Fire Safety Science - Proceedings of the 9th International Symposium
CONCLUDING REMARKS
In the example presented in this paper, a 3-step nth order reaction mechanism and a 3-step reaction mechanism with a main autocatalytic step provided nearly identical calculations of thermogravimetric curves and slab pyrolysis in the Fire Propagation Apparatus (FPA) under nitrogen. Compared to the 3-step mechanisms, a single-step decomposition mechanism provides quantitatively different, but similar, MLR predictions of the FPA data. The 3-step nth order mechanism requires specification of 19 additional model input parameters (two values each of Z, E, n, and ΔHvol, two values each of k0, nk, c0, nc, ε, and one value of γ) over the single step reaction case. In view of the marginal difference between the single-step and the 3-step calculations shown in Fig. 5, it is apparent that for this particular case introducing additional complexity (and degrees of freedom) is superfluous. Essentially, uncertainties in microstructure/anisotropy, material properties, heats of reaction, boundary conditions, experimental measurements, and inter-batch/inter-manufacturer variations dwarf any uncertainty in the decomposition kinetics as determined from TGA.
Although it is difficult to justify use of a multi-step for the material modeled here, no broad conclusions regarding the importance of multi-step thermal decomposition kinetics can be drawn on the basis of a single study. Multi-step reaction mechanisms may be justified for materials with DTG curves that show multiple reaction peaks. If a material’s DTG curve can’t be fit using an nth order reaction, one of the more fundamental kinetic models (e.g., autocatalytic) may be appropriate. If a material shows endothermic behavior in inert environments but exothermic behavior in oxidative environments, a reaction mechanism that includes an endothermic pyrolysis step and an exothermic oxidative step may be warranted. Finally, the additional complexity introduced by multi-step reaction mechanisms may be justified if all other model input parameters (thermophysical properties, radiation characteristics) are accurately known.
ACKNOWLEDGEMENTS
The authors would like to thank Mr. Charles Dore for fabricating the FRP Composites used in this study. The UC Berkeley authors would like to thank the National Science Foundation for support under Award 0730556, “Tackling CFD Modeling of Flame Spread on Practical Solid Combustibles”.
REFERENCES
[1] Lautenberger, C., “A Generalized Pyrolysis Model for Combustible Solids”, Ph.D. Dissertation, Department of Mechanical Engineering, University of California, Berkeley, Fall 2007. See also http://code.google.com/p/gpyro.
[2] Patankar, S.V., Numerical Heat Transfer and Fluid Flow, Hemisphere Publishing Corporation, New York, 1980.
[3] de Ris, J.L. and Khan, M.M., (2000) A Sample Holder for Determining Material Properties, Fire and Materials 24: 219-226, http://dx.doi.org/10.1002/1099-1018(200009/10)24:5<219::AID-FAM741>3.0.CO;2-7
[4] Friedman, H.L., (1964) Kinetics of Thermal Degradation of Char Forming Plastics from Thermogravimetry: Application to a Phenolic Plastic, Journal of Polymer Sci Part C 6: 183-195, http://www3.interscience.wiley.com/journal/114174190/abstract
[5] Rein, G., Lautenberger, C., Fernandez-Pello, A.C., Torero, J.L., and Urban, D.L., (2006) Application of Genetic Algorithms and Thermogravimetry to Determine the Kinetics of Polyurethane Foam in Smoldering Combustion, Combustion and Flame 146: 95-108, http://dx.doi.org/10.1016/j.combustflame.2006.04.013
[6] Avila, M.B., Dembsey, N.A., and Dore, C., (2008) Effect of Resin Type and Glass Content on the Reaction to Fire Characteristics of Typical FRP Composites, Composites Part A Applied Science and Manufacturing, accepted for publication.
Accepted for publication in Fire Safety Science - Proceedings of the 9th International Symposium