Embed Size (px)
Citation preview

This is an Accepted Manuscript, which has been through the Royal Society of Chemistry peer review process and has been accepted for publication.
Accepted Manuscripts are published online shortly after acceptance, before technical editing, formatting and proof reading. Using this free service, authors can make their results available to the community, in citable form, before we publish the edited article. We will replace this Accepted Manuscript with the edited and formatted Advance Article as soon as it is available.
You can find more information about Accepted Manuscripts in the author guidelines.
Please note that technical editing may introduce minor changes to the text and/or graphics, which may alter content. The journal’s standard Terms & Conditions and the ethical guidelines, outlined in our author and reviewer resource centre, still apply. In no event shall the Royal Society of Chemistry be held responsible for any errors or omissions in this Accepted Manuscript or any consequences arising from the use of any information it contains.
Accepted Manuscript
rsc.li/catalysis
www.rsc.org/catalysis
ISSN 2044-4753
Catalysis Science & Technology
PAPERQingzhu Zhang et al.Catalytic mechanism of C–F bond cleavage: insights from QM/MM analysis of fluoroacetate dehalogenase
Volume 6 Number 1 7 January 2016 Pages 1–308
Catalysis Science & Technology
View Article OnlineView Journal
This article can be cited before page numbers have been issued, to do this please use: W. Zhang, G.
Innocenti, M. Ferbinteanu, E. V. Ramos Fernandez, A. Sepulveda-Escribano, H. Wu, F. Cavani, G.
Rothenberg and R. N. Shiju, Catal. Sci. Technol., 2018, DOI: 10.1039/C7CY02309J.

Journal Name
ARTICLE
This journal is © The Royal Society of Chemistry 20xx J. Name., 2013, 00, 1-3 | 1
Please do not adjust margins
Please do not adjust margins
Received 00th January 20xx,
Accepted 00th January 20xx
DOI: 10.1039/x0xx00000x
www.rsc.org/
Understanding the oxidative dehydrogenation of ethyl lactate to
ethyl pyruvate over vanadia/titania catalysts
Wei Zhang,a Giada Innocenti,
b Marilena Ferbinteanu,
c Enrique V. Ramos-Fernandez,
d Antonio
Sepulveda-Escribano,d Haihong Wu,
e Fabrizio Cavani,
b Gadi Rothenberg
a and N. Raveendran
Shiju*a
We study the vapour-phase oxidative dehydrogenation (ODH) of ethyl lactate with air to give ethyl pyruvate over
V2O5/TiO2 catalysts in a fixed-bed reactor. The nature of the vanadia species is changed by varying the vanadium surface
density, and the corresponding structure of the VOx species were determined by XRD, UV-Vis, XPS and H2-TPR. Monomeric
and isolated vanadia species dominate at lower vanadium surface densities. As the surface density increases, two-
dimensional polyvanadates and bulk-like vanadia crystallites become predominant. The activity per vanadium decreases
with increasing vanadium surface density, indicating that the monomeric VOx species is better for pyruvate production and
that the V–O–Ti bonds play an important role in the ODH of ethyl lactate. This is also confirmed by the superior catalytic
performance of V2O5/TiO2 compared to vanadium supported on MgO, Al2O3, ZrO2 and CeO2. In situ DRIFT spectroscopy
coupled with a mass analysis shows that the reaction can involve three possible adsorption modes of ethyl lactate on the
V2O5/TiO2 surface. Under anaerobic conditions, 2–hydroxypropionate forms, giving ethyl acetate as the major product.
Conversely, under aerobic conditions, oxygen that is chemisorbed on V2O5/TiO2 is active and easily replenished from the
gas phase, converting the ethyl–propionate–2–oxide intermediate to ethyl pyruvate.
Introduction
Lignocellulosic biomass is one of the few sources of truly
renewable carbon.1-2 But there’s a lot of it: even today, the
world biomass production could meet the entire carbon
demand of the chemical industry (excluding transportation
fuels). Typically, biomass is first converted to simple
derivatives, or ‘platform molecules’, that are then reacted
further to industrial chemicals. Lactic acid (LA) and lactic esters
are important platform molecules. They can be converted to a
variety of bulk chemicals, including acrylic acid, propionic acid,
pyruvic acid and acetaldehyde.3-4
The oxidative dehydrogenation (ODH) of lactic acid to pyruvic
acid is especially interesting due to the high demand for
pyruvates in the pharmaceutical and agrochemical sectors.5
Today, pyruvates are still made via the classic dehydrative
decarboxylation of tartaric acid in the presence of an excess of
KHSO4.6-7However, the extra reagent and the high temperature
(300 °C) make this process unsustainable. Therefore, attention
has focused on oxidative dehydrogenation of lactate as a
‘greener’ alternative.8 Several catalysts including Pd/Pt, 9 iron
phosphates, 10 metal oxides (Mo, Ti, Zr, W and Sn), 11 and
binary oxides (TeO2–MoO3, SnO2–MoO3)12-13 were reported for
this reaction in both gas phase and liquid phase. Yet most of
these also catalyse C–C
Scheme 1. Lactic acid can be converted to a variety of important bulk chemicals.
Page 1 of 12 Catalysis Science & Technology
Cat
alys
isS
cien
ce&
Tech
nolo
gyA
ccep
ted
Man
uscr
ipt
Publ
ishe
d on
19
Febr
uary
201
8. D
ownl
oade
d by
Uni
vers
idad
de
Alic
ante
on
23/0
5/20
18 0
7:29
:18.
View Article OnlineDOI: 10.1039/C7CY02309J
ARTICLE Journal Name
2 | J. Name., 2012, 00, 1-3 This journal is © The Royal Society of Chemistry 20xx
Please do not adjust margins
Please do not adjust margins
scission, especially in the gas phase, giving acetaldehyde, CO
and CO2.5 The catalytic challenge, therefore, is running a
selective ODH reaction at a lower temperature, thus avoiding
C–C bond scission.Supported/bulk vanadium oxides are used in
a variety of ODH reactions at relatively low temperatures.14-15
The performance of supported vanadium catalysts depends on
the type of support and the structure of the surface vanadium
species.16 Compared with other oxide supports, titania
interacts strongly with vanadia. The anatase phase in
particular gives a stable VOx monolayer with a catalytic
oxidation performance superior to that of rutile.17-18 We
recently showed that TiO2 itself can also catalyse the ODH of
ethyl lactate to ethyl pyruvate in the liquid phase, due to its
high affinity to ethyl lactate and oxygen.19 Elsewhere, Li et al.
reported that MoVNbOx supported on TiO2 was more active
than unsupported components for vapour phase ethyl lactate
conversion.20 Cavani and co–workers elucidated the role of the
components in MoV(Nb)TeO catalysts, showing that vanadium
is crucial for achieving high ODH performance.21 Our
preliminary tests showed that commercial V2O5 gave higher
yields of pyruvate compared with other oxides (MoO3, V2O5,
TeO2 and MoVOx) at low temperatures (Fig. S1). Thus, we
hypothesised that VOx/TiO2 would be both active and selective
in the ODH of lactates.
Here, we studied structure-activity relationships in ethyl
lactate ODH over V2O5/TiO2 catalysts. We prepared a series of
vanadium oxides supported on anatase TiO2, varying the
vanadium loading via incipient wetness impregnation. Catalyst
characterisation showed that different types of VOx species
(monomeric, polymeric, and crystalline domains) formed on
TiO2 surface. We then examined the correlation between VOx
structure and catalytic activity in the ODH of ethyl lactate with
air in a fixed-bed reactor, comparing the catalytic properties of
V2O5 impregnated on TiO2, MgO, Al2O3, ZrO2 and CeO2. Across
this series, V2O5/TiO2 showed a superior ODH activity, which
we attribute to the cooperative effects between vanadia and
titania. In situ DRIFT spectroscopy showed that three
adsorption modes of ethyl lactate are possible on the
V2O5/TiO2 surface. Under anaerobic conditions, 2–
hydroxypropionate forms, giving ethyl acetate as the major
product. Under aerobic conditions, oxygen chemisorbed on
V2O5/TiO2 is active and easily replenished from the gas phase,
converting the ethyl–propionate–2–oxide intermediate to
ethyl pyruvate.
Results and discussion
Synthesis and characterization of VOx/TiO2 catalysts
First, we prepared five supported vanadium oxide catalysts by
incipient wetness impregnation using aqueous solutions of
ammonium metavanadate (NH4VO3) and oxalic acid, which
were subsequently dried and calcined at 550 °C. The samples
are denoted as n–V2O5/TiO2, where n represents the wt. % of
V2O5 on TiO2 (n=1%, 3%, 5%, 10%, 20%; see the experimental
section for details).
Fig. 1 X-ray diffraction patterns of VOx/TiO2 catalysts with different loadings of V2O5, (a)
pristine TiO2, (b) 1–V2O5/TiO2, (c) 3–V2O5/TiO2, (d) 5–V2O5/TiO2, (e) 10– V2O5/TiO2 and
(f) 20–V2O5/TiO2.
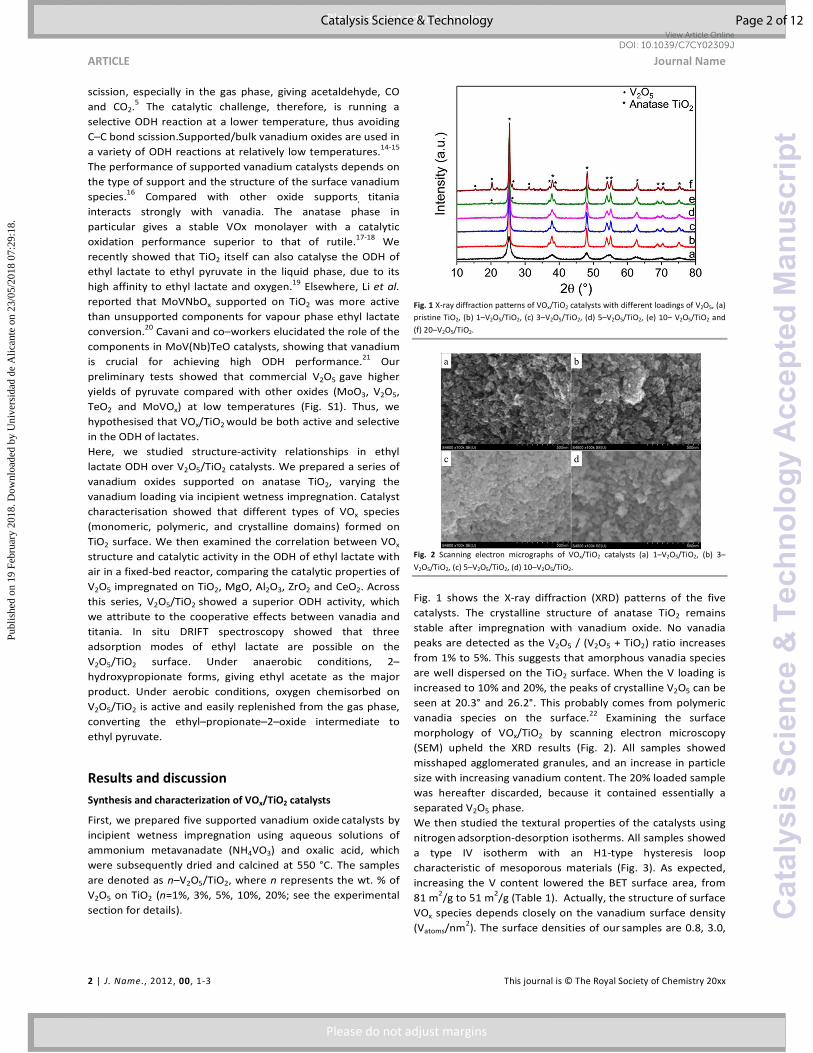
Fig. 2 Scanning electron micrographs of VOx/TiO2 catalysts (a) 1–V2O5/TiO2, (b) 3–
V2O5/TiO2, (c) 5–V2O5/TiO2, (d) 10–V2O5/TiO2.
Fig. 1 shows the X-ray diffraction (XRD) patterns of the five
catalysts. The crystalline structure of anatase TiO2 remains
stable after impregnation with vanadium oxide. No vanadia
peaks are detected as the V2O5 / (V2O5 + TiO2) ratio increases
from 1% to 5%. This suggests that amorphous vanadia species
are well dispersed on the TiO2 surface. When the V loading is
increased to 10% and 20%, the peaks of crystalline V2O5 can be
seen at 20.3° and 26.2°. This probably comes from polymeric
vanadia species on the surface.22 Examining the surface
morphology of VOx/TiO2 by scanning electron microscopy
(SEM) upheld the XRD results (Fig. 2). All samples showed
misshaped agglomerated granules, and an increase in particle
size with increasing vanadium content. The 20% loaded sample
was hereafter discarded, because it contained essentially a
separated V2O5 phase.
We then studied the textural properties of the catalysts using
nitrogen adsorption-desorption isotherms. All samples showed
a type IV isotherm with an H1-type hysteresis loop
characteristic of mesoporous materials (Fig. 3). As expected,
increasing the V content lowered the BET surface area, from
81 m2/g to 51 m2/g (Table 1). Actually, the structure of surface
VOx species depends closely on the vanadium surface density
(Vatoms/nm2). The surface densities of our samples are 0.8, 3.0,
Page 2 of 12Catalysis Science & Technology
Cat
alys
isS
cien
ce&
Tech
nolo
gyA
ccep
ted
Man
uscr
ipt
Publ
ishe
d on
19
Febr
uary
201
8. D
ownl
oade
d by
Uni
vers
idad
de
Alic
ante
on
23/0
5/20
18 0
7:29
:18.
View Article OnlineDOI: 10.1039/C7CY02309J

Journal Name ARTICLE
This journal is © The Royal Society of Chemistry 20xx J. Name., 2013, 00, 1-3 | 3
Please do not adjust margins
Please do not adjust margins
4.8 and 12.8 Vatoms/nm2, corresponding to V2O5 content of 1, 3,
5 and 10 wt%, respectively. The theoretical surface density
value for monovanadate is 2~3 Vatoms/nm2. 15 Thus, the
vanadia species of 1–V2O5/TiO2 and 3–V2O5/TiO2 are probably
isolated VO4 species, while 5–V2O5/TiO2 and 10–V2O5/TiO2 are
predominantly polymeric VO4 species and V2O5 crystallites.23-24
b
Fig. 3 The Nitrogen adsorption–desorption isotherms of VOx/TiO2 catalysts. (a) pristine
TiO2, (b) 1–V2O5/TiO2, (c) 3–V2O5/TiO2, (d) 5–V2O5/TiO2, (e) 10–V2O5/TiO2. The isotherms
in the figure are shifted up for the sake of clarity.
Table 1 Textural properties of VOx/TiO2 catalysts
Sample
V content a (ICP, wt.
%)
V surface
density
(VOx/nm2)
SBET b
(m2 g-1)
VP b
(cm3 g-1)
pure TiO2 – – 81.3 0.50
1–V2O5/TiO2 0.58 0.8 81.2 0.52
3–V2O5/TiO2 1.80 3.0 70.9 0.51
5–V2O5/TiO2 2.70 4.8 66.3 0.49
10–V2O5/TiO2 5.64 12.8 51.8 0.43
a Determined by ICP analysis. b Calculated based on N2 sorption at 77 K.
To confirm the coordination environment of the vanadium
species, we used UV−visible diffuse reflectance spectroscopy
(UV−vis DRS, see Fig. 4A). The absorption intensity in the
visible region is enhanced after depositing vanadium oxide on
the titania support. The 1–V2O5/TiO2 showed charge-transfer
bands centred around 280–350 nm, assigned to isolated
tetrahedral V5+ species.25 As V2O5 loading increased, the
absorption bands shifted to higher wavelengths, reflecting the
lower-energy transitions of the charge transfer between
oxygen and V atoms.26 This indicates the formation of highly
coordinated polymeric vanadium species from isolated
tetrahedral monomeric species (cf. the similar structures
observed for molybdenum 27). Increasing the vanadia content
to 10 wt% showed crystalline V2O5 species (absorption at 490
nm 28-29). Defining the position of isolated and polymerized
VO4 units using UV−vis DRS is difficult, as their absorption
bands can overlap with the strong absorption of the titania
support.30 However, the absorption edge energy (Eg) can give
quantitative information of coordination number and the local
structure of VOx species. The Eg is determined by finding the
intercept on the X-axis of the tangent line in the low-energy
rise of the plot of [F(R∞)hν]2 vs. hν, where F(R∞) is the Kubelka-
Munk function and hν is the incident photon energy.31 The
corresponding Eg values for V2O5/TiO2 are shown in Fig. 4B,
wherein the value of pure TiO2 is about 3.27 eV. For the
V2O5/TiO2 catalysts, the Eg value gradually decreases with
increasing surface vanadia content, from 3.19 to 2.1 eV. A
similar trend was observed by Danilevitch et al.32 The high Eg
value at low vanadium surface density corresponds to isolated
surface VO4 species. When the vanadium content is 1%,
Eg≈3.19 eV, which is close to the value of 3.21 eV for Na3VO4
(where vanadium exists as an isolated tetrahedral VO4
species).33 Bulk NaVO3 was reported to have a polymeric
tetrahedral VO4 structure with an Eg value of 2.41 eV.34 Thus,
we assume that the 3% V2O5 on TiO2 (with Eg=2.84 eV) contains
also polymerized VO4 units in addition to isolated VO4 species.
Increasing the V2O5 content to 5% yielded an Eg value of 2.38
eV, indicating the presence of a higher amount of
polyvanadate species. Note that the Eg value of 10% V2O5/TiO2
(2.10 eV) is close to that of bulk V2O5 (2.05 eV),15 suggesting
that the polymerized VO4 species is aggregated to crystalline
V2O5, in agreement with the XRD results.
Fig. 4 (A) UV–Vis absorption spectra of TiO2, V2O5 and V2O5/TiO2 catalysts, (B) [F(Rα)hν]1/2 plotted against the energy of the incident photon for the determination of edge energy
for V2O5/TiO2 catalysts; the inset shows the corresponding Eg values. The edge energies are determined from the intercept on the X-axis of a straight line fitted through the rise of
the function [F (Rα)hν] (C) Schematic structures of V2O5/TiO2 catalysts showing different type of vanadia species.
Page 3 of 12 Catalysis Science & Technology
Cat
alys
isS
cien
ce&
Tech
nolo
gyA
ccep
ted
Man
uscr
ipt
Publ
ishe
d on
19
Febr
uary
201
8. D
ownl
oade
d by
Uni
vers
idad
de
Alic
ante
on
23/0
5/20
18 0
7:29
:18.
View Article OnlineDOI: 10.1039/C7CY02309J
ARTICLE Journal Name
4 | J. Name., 2012, 00, 1-3 This journal is © The Royal Society of Chemistry 20xx
Please do not adjust margins
Please do not adjust margins
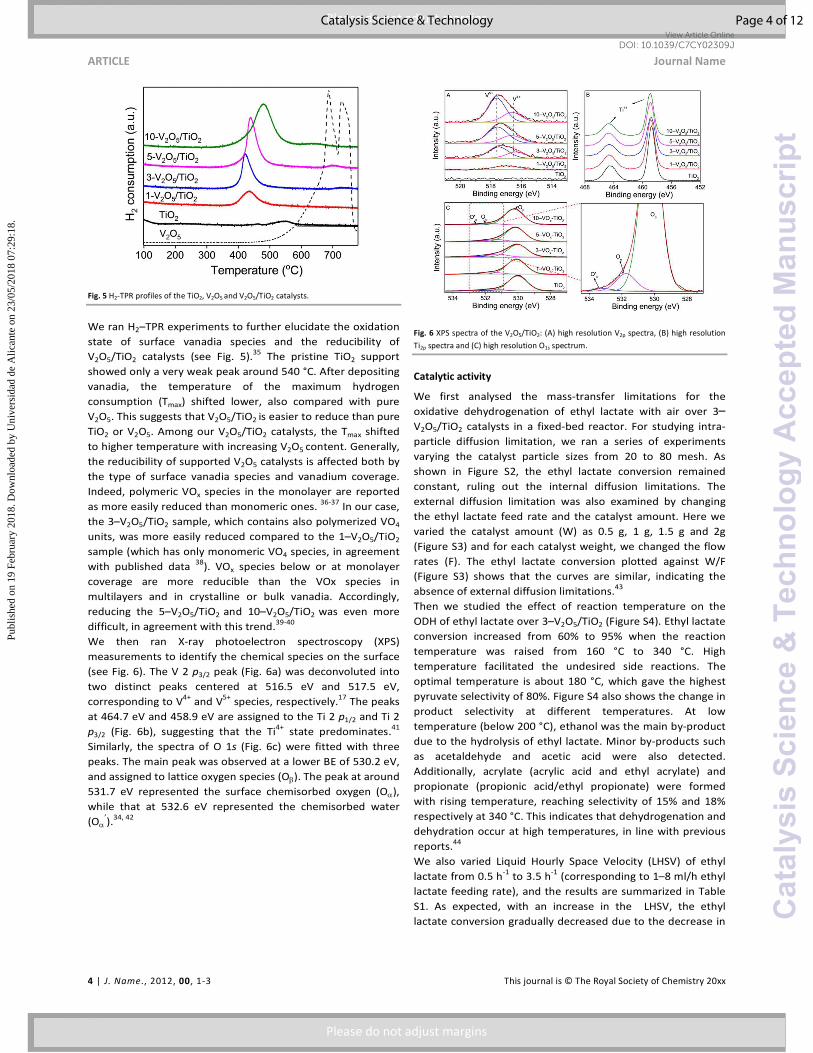
Fig. 5 H2-TPR profiles of the TiO2, V2O5 and V2O5/TiO2 catalysts.
We ran H2–TPR experiments to further elucidate the oxidation
state of surface vanadia species and the reducibility of
V2O5/TiO2 catalysts (see Fig. 5).35 The pristine TiO2 support
showed only a very weak peak around 540 °C. After depositing
vanadia, the temperature of the maximum hydrogen
consumption (Tmax) shifted lower, also compared with pure
V2O5. This suggests that V2O5/TiO2 is easier to reduce than pure
TiO2 or V2O5. Among our V2O5/TiO2 catalysts, the Tmax shifted
to higher temperature with increasing V2O5 content. Generally,
the reducibility of supported V2O5 catalysts is affected both by
the type of surface vanadia species and vanadium coverage.
Indeed, polymeric VOx species in the monolayer are reported
as more easily reduced than monomeric ones. 36-37 In our case,
the 3–V2O5/TiO2 sample, which contains also polymerized VO4
units, was more easily reduced compared to the 1–V2O5/TiO2
sample (which has only monomeric VO4 species, in agreement
with published data 38). VOx species below or at monolayer
coverage are more reducible than the VOx species in
multilayers and in crystalline or bulk vanadia. Accordingly,
reducing the 5–V2O5/TiO2 and 10–V2O5/TiO2 was even more
difficult, in agreement with this trend.39-40
We then ran X-ray photoelectron spectroscopy (XPS)
measurements to identify the chemical species on the surface
(see Fig. 6). The V 2 p3/2 peak (Fig. 6a) was deconvoluted into
two distinct peaks centered at 516.5 eV and 517.5 eV,
corresponding to V4+ and V5+ species, respectively.17 The peaks
at 464.7 eV and 458.9 eV are assigned to the Ti 2 p1/2 and Ti 2
p3/2 (Fig. 6b), suggesting that the Ti4+ state predominates.41
Similarly, the spectra of O 1s (Fig. 6c) were fitted with three
peaks. The main peak was observed at a lower BE of 530.2 eV,
and assigned to lattice oxygen species (Oβ). The peak at around
531.7 eV represented the surface chemisorbed oxygen (Oα),
while that at 532.6 eV represented the chemisorbed water
(Oα’).34, 42
Fig. 6 XPS spectra of the V2O5/TiO2: (A) high resolution V2p spectra, (B) high resolution
Ti2p spectra and (C) high resolution O1s spectrum.
Catalytic activity
We first analysed the mass-transfer limitations for the
oxidative dehydrogenation of ethyl lactate with air over 3–V2O5/TiO2 catalysts in a fixed-bed reactor. For studying intra-
particle diffusion limitation, we ran a series of experiments
varying the catalyst particle sizes from 20 to 80 mesh. As
shown in Figure S2, the ethyl lactate conversion remained
constant, ruling out the internal diffusion limitations. The
external diffusion limitation was also examined by changing
the ethyl lactate feed rate and the catalyst amount. Here we
varied the catalyst amount (W) as 0.5 g, 1 g, 1.5 g and 2g
(Figure S3) and for each catalyst weight, we changed the flow
rates (F). The ethyl lactate conversion plotted against W/F
(Figure S3) shows that the curves are similar, indicating the
absence of external diffusion limitations.43
Then we studied the effect of reaction temperature on the
ODH of ethyl lactate over 3–V2O5/TiO2 (Figure S4). Ethyl lactate
conversion increased from 60% to 95% when the reaction
temperature was raised from 160 °C to 340 °C. High
temperature facilitated the undesired side reactions. The
optimal temperature is about 180 °C, which gave the highest
pyruvate selectivity of 80%. Figure S4 also shows the change in
product selectivity at different temperatures. At low
temperature (below 200 °C), ethanol was the main by-product
due to the hydrolysis of ethyl lactate. Minor by-products such
as acetaldehyde and acetic acid were also detected.
Additionally, acrylate (acrylic acid and ethyl acrylate) and
propionate (propionic acid/ethyl propionate) were formed
with rising temperature, reaching selectivity of 15% and 18%
respectively at 340 °C. This indicates that dehydrogenation and
dehydration occur at high temperatures, in line with previous
reports.44
We also varied Liquid Hourly Space Velocity (LHSV) of ethyl
lactate from 0.5 h-1 to 3.5 h-1 (corresponding to 1–8 ml/h ethyl
lactate feeding rate), and the results are summarized in Table
S1. As expected, with an increase in the LHSV, the ethyl
lactate conversion gradually decreased due to the decrease in
Page 4 of 12Catalysis Science & Technology
Cat
alys
isS
cien
ce&
Tech
nolo
gyA
ccep
ted
Man
uscr
ipt
Publ
ishe
d on
19
Febr
uary
201
8. D
ownl
oade
d by
Uni
vers
idad
de
Alic
ante
on
23/0
5/20
18 0
7:29
:18.
View Article OnlineDOI: 10.1039/C7CY02309J

Journal Name ARTICLE
This journal is © The Royal Society of Chemistry 20xx J. Name., 2013, 00, 1-3 | 5
Please do not adjust margins
Please do not adjust margins
contact time. The ethyl pyruvate selectivity increased from
20% to 80% with the change in LHSV from 0.5 to 2.5 h-1.
However, further increase in LHSV did not favor pyruvate. This
is probably due to the coverage of the active sites of the
catalyst by reactant leading to coke formation.
Then, the activities of V2O5/TiO2 catalysts for the ODH reaction
of ethyl lactate to ethyl pyruvate were investigated. Pure
anatase TiO2 support gave only low yield. Similarly, control
experiments with commercial bulk V2O5 gave <30% of
pyruvate. Interestingly, even 1–V2O5/TiO2 gave higher
selectivity and yield than bulk V2O5 (Figure 7). Note that the
specific surface area of 1–V2O5/TiO2 is 81 m2/g, much higher
than that of V2O5 (5 m2/g). This suggests that highly dispersed
vanadia is responsible for the catalytic activity. When the
vanadium loading increased to 3%, the selectivity to pyruvate
reached a maximum of 78% at 62% conversion. Increasing the
V loading further did not improve the catalytic performance.
To differentiate better the influence of surface vanadia species
on catalytic performance, control experiments were
performed by increasing LHSV and decreasing air flow at low
reaction temperature (160 °C, 180 °C vs. 200 °C). Figure 8
shows that all V2O5/TiO2 catalysts show higher ethyl lactate
conversion than pure TiO2 and V2O5. Sub-monolayer 1–
V2O5/TiO2 catalyst gave 10% ethyl lactate conversion at 160 °C.
Increasing vanadia loading to 3% (near monolayer coverage)
gave an ethyl lactate conversion of 28%. With vanadia content
over 3%, the conversion almost levelled-up. We therefore
attribute the reactivity enhancement to non-polymeric
vanadium species close to TiO2.45
Fig. 7. The effect of V2O5 loading on ethyl lactate conversion and ethyl pyruvate
selectivity over V2O5/TiO2 catalysts. Reaction conditions: 5 ml/h Ethyl lactate,
2.25 L/h air flow (molar ratio of ethyl lactate/O2=2.3), 1.0 g catalyst, 200 °C.
Fig. 8 The effect of V2O5 loading on ethyl lactate conversion and ethyl pyruvate
selectivity over V2O5/TiO2 catalysts. Reaction conditions: 8 ml/h Ethyl lactate, 1
L/h air flow (molar ratio of ethyl lactate/O2=5), 1.0 g catalyst, Reaction
temperature: 160 °C 180 °C and 200 °C.
Fig. 9 Relationship between TOF of ethyl lactate oxidation, absorption edge energy (Eg)
and VOx surface density of VOx/TiO2 catalysts. Reaction conditions: 10 ml/h Ethyl
lactate, 1 L/h air flow (molar ratio of ethyl lactate/O2=5), 1.0 g catalyst, 160 °C.
To further evaluate the catalytic performance of V2O5/TiO2, we
calculated the turnover frequency (TOF) under relatively low
conversion of ethyl lactate and shown in Fig. 9. The TOF of
V2O5/TiO2 was inversely proportional to the vanadium surface
density, in close correlation with the absorption edge energy
(Eg, see the right axis in Fig. 9). The low V surface density with
high Eg, where the vanadium is present as monomeric species,
gave the highest TOF. As VOx surface density increases,
isolated VO4 species agglomerate with their nearest
neighbours, resulting in a lower ratio of V–O–Ti bonds and an
increase in V–O–V and V=O bonds. Meanwhile, the V–O–Ti
bonds within multilayer are less accessible than those in the
surface monolayer,46 which may explain the lower selectivity
at higher vanadium loadings. Ji et al reported that the ratios of
V4+/(V4++V5+) reflected the ratio [(vanadium stronglyinteracting
with the support)/(total vanadium)],24 in our case, the V
loading increased from 1% to 10%, the ratios of V4+/(V4++V5+)
decreased from 0.5 to 0.29 (Table S2). This result confirms the
decrease in V–O–Ti bonds. Earlier Wachs et al. showed that
Page 5 of 12 Catalysis Science & Technology
Cat
alys
isS
cien
ce&
Tech
nolo
gyA
ccep
ted
Man
uscr
ipt
Publ
ishe
d on
19
Febr
uary
201
8. D
ownl
oade
d by
Uni
vers
idad
de
Alic
ante
on
23/0
5/20
18 0
7:29
:18.
View Article OnlineDOI: 10.1039/C7CY02309J

ARTICLE Journal Name
6 | J. Name., 2012, 00, 1-3 This journal is © The Royal Society of Chemistry 20xx
Please do not adjust margins
Please do not adjust margins
the reactivity of VOx species is unrelated to the terminal V=O
bonds in partial oxidation of methanol.47 Oxygen labelling
experiments also demonstrated that the V=O bond is stable
during butane oxidation.48-49 In our system, the terminal V=O
bonds do not favour the TOF of ethyl lactate conversion, this
will be proved by our latter DRIFTS Study. The fact that the 1–
V2O5/TiO2 catalyst, which has negligible V–O–V bonds, gave
comparable catalytic activity, confirms that the bridging V–O–
V bond does not play a role in our reaction.47 For comparison,
we prepared a mixture of V2O5 and TiO2 by mixing bulk V2O5
and TiO2 powder in a mortar. This physical mixture, which
contained 3 wt. % V2O5, gave only 5.6% yield of ethyl pyruvate,
compared to the 48.1% yield obtained over impregnated
V2O5/TiO2 (with the same vanadium loading and at otherwise
identical reaction conditions). Thus, we concluded that the
catalytic performance is determined by the structure of
surface vanadium species, and especially the V–O–Ti bonds
play a critical role in the oxidative dehydrogenation of ethyl
lactate.
Table 2 ODH of ethyl lactate to ethyl pyruvate over V2O5 on various supports.a
Entr
y Catalyst
SBET
(m2 g-1) b
Con.
(%) c
Sel.
(%)
Yield
(%) c
Surface
PH d
1 1–V2O5
/CeO2 50 1 32.2 trace 6.75
2 1–V2O5 /
MgO 198 15.9 0.5 trace 11
3 1–V2O5
/ZrO2 89 28.5 43.9 12.5 5.9-6.1
4 1–V2O5
/Al2O3 278 35.6 36.7 13.1 8.9
5 1–V2O5
/TiO2 81 58.7 63.7 37.4 6.0-6.4
a Reaction conditions: 5 ml/h Ethyl lactate, 2.25 L/h air flow (molar ratio of ethyl
lactate/O2=2.3), 1.0 g catalyst (1 wt. % of metal oxide on TiO2), 180 °C. b Calculated
based on N2 sorption at 77 K. c Determined by GC using biphenyl as an external
standard. d Based on ref. 50 and 51.
Three types of bonds can be present in supported vanadia
catalysts: V=O, V–O–V and V–O–M (where M is the support
metal cation). To understand the importance of the V–O–M
bonds, we studied vanadium oxide catalysts supported on four
different supports: MgO, Al2O3, ZrO2 and CeO2, varying the
support surface acidity.50 For a fair comparison of V=O and V–
O–V bonds, we prepared porous supports with high surface
area and subsequently impregnated 1 wt.% of vanadium oxide
on each support to form isolated VOx species (see the
experimental section for details). The acidity of oxide supports
is a key factor in many ODH systems.52 The relative acidity in
this series is Al2O3> TiO2> ZrO2> CeO2> MgO.53-54 In each case,
we first tested the support alone in our reaction at 180 °C.
Only MgO showed some conversion (13%), but no selectivity
(because ethyl lactate undergoes hydrolysis to ethanol and
lactic acid on the basic MgO surface). After introducing
vanadia, the catalytic activities of those supported vanadia
catalysts are summarized in Table 2. After impregnation, the
reactivity of V2O5/MgO was unchanged. Conversely, the
catalyst supported on acidic Al2O3 showed high conversion, but
with low selectivity, owing to a competing decarboxylation of
ethyl pyruvate to acetaldehyde.13 TiO2–supported vanadium
oxide showed the highest catalytic activity, while V2O5/ZrO2
and V2O5/CeO2 scarcely catalyze the reaction under identical
conditions. Fig. 10 shows the Arrhenius plots of ethyl lactate
consumption rates. For 1–V2O5 /TiO2 , the apparent activation
energy (Ea) of ethyl lactate conversion (48 kJ/mol) is lower
than that of 1–V2O5/Al2O3 (57 kJ/mol), 1–V2O5 /ZrO2 (75
kJ/mol) and 1–V2O5 /CeO2 (127 kJ/mol). These results
confirmed that the monomeric V–O–Ti species is more
catalytically active, confirming further the importance of the
vanadium–oxygen interactions.
Fig. 10 Arrhenius plots for steady-state ethyl lactate conversion over supported V2O5
catalysts. Reaction conditions: LHSV= 4 h-1, air flow= 1 L/h. Ethyl lactate consumption
rate: rethyl lactate = ���������������� ��������������������/��
����������������. The apparent activation
energy (Ea) was measured at a series of temperatures under 20 % ethyl lactate
conversion.
In situ DRIFTS Study. Further insight into the reaction can be
gained by in situ diffuse reflectance infrared Fourier transform
spectroscopy (DRIFTS). Fig. 11 shows the in situ DRIFTS of
temperature-programmed ethyl lactate desorption on 3–
V2O5/TiO2 in the absence of oxygen. The characteristic bands
of ethyl lactate adsorbed on V2O5/TiO2 were detected. The C–H
vibrations were observed at 2990 cm–1, 2940 cm–1, 2883 cm–1,
1454 cm–1, 1387 cm–1 and 1302 cm–1, and ascribed to νs (CH3), ν
(C–H), δas (CH3), δs (CH3) and δ (C–H), respectively.55-56 Those
bands decreased in intensity with rising temperature,
indicating the degradation of ethyl lactate.57 This process was
also reflected by the changes of the carbonyl and carboxyl on
the V2O5/TiO2 surface (four peaks at 1730 cm–1,1667 cm–1,
1566 cm–1 and 1420 cm–1, assigned to ν (C=O), ν (C=O···M+), νs
(COO) and νas (COO) vibrations, respectively).55, 58-59 Increasing
the temperature broadens those carbonyl and carboxyl peaks,
where the signals of νs (COO) and νas (COO) were blue shifted
to 1540 cm–1 and 1445 cm–1 over 250 °C. This is because of the
formation of adsorbed acetate species.60 Evidently, we
detected the ethyl acetate by monitoring the mass signals
during the temperature-programmed ethyl lactate desorption
(Fig. S6). The C=O stretching of ethyl lactate was weakened
(1730 cm–1 and 1667 cm–1), accompanying two new shoulder
peaks at 1780 cm–1 and 1651 cm–1. These bands were assigned
Page 6 of 12Catalysis Science & Technology
Cat
alys
isS
cien
ce&
Tech
nolo
gyA
ccep
ted
Man
uscr
ipt
Publ
ishe
d on
19
Febr
uary
201
8. D
ownl
oade
d by
Uni
vers
idad
de
Alic
ante
on
23/0
5/20
18 0
7:29
:18.
View Article OnlineDOI: 10.1039/C7CY02309J

Journal Name ARTICLE
This journal is © The Royal Society of Chemistry 20xx J. Name., 2013, 00, 1-3 | 7
Please do not adjust margins
Please do not adjust margins
to the carbonyl stretching of the α-keto group of the
pyruvate,57 supporting the experimental results (Fig. S5), the
surface chemisorbed oxygen of V2O5/TiO2 could participate in
the oxidation of lactate without molecular oxygen. the surface
chemisorbed oxygen of V2O5/TiO2 could participate in the
oxidation of lactate without molecular oxygen. The bands at
1224 cm–1 and 1141 cm–1 may reflect the alcohol OH related
C–O stretching vibrations of ethyl lactate.61
Analysing the DRIFT spectra shows several possible adsorption
modes of ethyl lactate on catalyst surface (Table 3). The main
features are the vibration differences of C–O, carbonyl (C=O)
and carboxyl(COO) groups. The three adsorption modes (a), (b)
and (c) were detected in line with published data,55 while
Fig. 11 In situ DRIFT spectra recorded during ethyl lactate temperature-programmed-
desorption over 3–V2O5/TiO2 with He flow (without O2).
Table 3. Ethyl lactate adsorption modes and their vibration wavenumber.
Molecules Vibrational mode
Wavenumber (cm
–1)[a]
Wavenumber (cm
–1)[b]
ν (C=O) 1725 1730
δAL(C–O) 1220 1224
νs (COO) 1569 1566
νas (COO) 1421 1420
ν (C=O) 1668 1667
δAL(C–O) 1220 1224
νs (COO) 1570 1566
νas (COO) 1450 1420
νAL(C–O) 1140 1141
δAL(OH) 1270 1271
ν (C–O) 1058 Not detected
ν (C–O) 1118 Not detected
ν (C=O) 1614 Not detected
AL = Alcoholic functionalities
[a] Based on ref. 55 and 56; [b] From our in situ DRIFTS.
mode (d) was not detected. The weak band at 1271 cm–1 can
be attributed to the O–H stretch of mode (c). Considering the
model (c) has no carbonyl stretching signals, model (a) and (b)
dominate at low temperature. The mass signals of both
ethanol and CO2 increased with temperature (Fig. S6), due to
the decomposition process. This agrees well with the changes
of in situ DRIFTS.
We also studied in situ DRIFTS experiments of ethyl lactate
adsorbed 3–V2O5/TiO2 with O2. As shown in Fig. 12, the
vibrational bands of ethyl lactate on catalyst were similar to
the spectra at low temperatures (cf. Fig. 11).
Fig. 12 In situ DRIFT spectra recorded during ethyl lactate temperature-programmed-
desorption over 3–V2O5/TiO2 with air flow (with O2).
Upon increasing temperature to 150 °C, we observed the
characteristic bands of α-keto in pyruvate (1795 cm–1 and 1651
cm–1), 57] together with a red-shifted COO stretch at 1597 cm-
1. 55, 62 The in situ DRIFTS were also reflected the adsorption
and dissociation of ethyl lactate on V2O5/TiO2 surface in the
presence of oxygen. Due to the formation of pyruvate species,
the position of carbonyl ν (C=O) were shifted to 1746 cm–1, 62
as compared to the ν (C=O) of ethyl lactate at 1730 cm–1; The
peaks at 1141 cm–1 (C–O belongs to model (a) and (b)) also
started to weakened at 150 °C, accompanying the
characteristic peaks of pyruvate; while the characteristic peaks
of model (c) were unchanged. This means that ethyl–
propionate–2–oxide (in mode a and b) is the key intermediate
to produce pyruvate (similar to the ethoxide species in ethanol
oxidation60-61). The decrease of the negative peak at 3662 cm–1
upheld this dehydration processes. Additionally, the intensity
of pyruvate bands decreased as the temperature increased
over 250 °C, indicating a decomposition process (Fig. S7). The
pyruvate peaks disappeared at 400 °C. Meanwhile, the new
bands at 1520 cm–1 and 1445 cm–1 were attributed to surface
Page 7 of 12 Catalysis Science & Technology
Cat
alys
isS
cien
ce&
Tech
nolo
gyA
ccep
ted
Man
uscr
ipt
Publ
ishe
d on
19
Febr
uary
201
8. D
ownl
oade
d by
Uni
vers
idad
de
Alic
ante
on
23/0
5/20
18 0
7:29
:18.
View Article OnlineDOI: 10.1039/C7CY02309J

ARTICLE Journal Name
8 | J. Name., 2012, 00, 1-3 This journal is © The Royal Society of Chemistry 20xx
Please do not adjust margins
Please do not adjust margins
carbonates νas (COO) and νs (COO),63 as pyruvate is easily over-
oxidised to form the carbonates as side products.64
The bands at 2040 cm–1 and 1380 cm–1 are attributed to the
V=O bond overtone band and the V–O bond combination band
(probably belonging to V–O–Ti), respectively (for a detailed
analysis of the pristine V2O5/TiO2 see Fig. S8).61 The presence
of negative bands means that VOx interacts with the adsorbed
species. Under anaerobic condition (Fig. 11), the V=O stretch
remained constant with temperature, while the V–O was blue
shifted (from 1360 cm–1 at 50 °C to 1380 cm–1 at 400 °C). In
presence of air, the V=O band is well preserved after the
formation of pyruvate band, then vanishes at 350 °C along
with pyruvate species; while the V–O band, diminished in
intensity, is still present at 400 °C in presence of carbonates.
These observations support the hypothesis that V=O bonds are
not involved in the ODH of ethyl lactate while V–O ones play a
key role in the reaction.
In Fig. 13, we propose a reaction network for the aerobic and
anaerobic conversion of ethyl lactate. Ethyl lactate first
absorbs and dissociates on the V2O5/TiO2 surface, with
adsorption modes (a), (b) and (c). Modes (a) and (b) dominate
at low temperature, while model (c) generates 2–
hydroxypropionate on the surface through a hydrolysis process
at higher temperatures. In absence of molecular oxygen,
increasing the temperature accelerates the formation of mode
(c), subsequently giving ethyl acetate as the major product.
Pyruvate species can also be produced, but are limited by the
surface chemisorbed oxygen. Under aerobic conditions,
however, molecular oxygen reoxidizes the catalyst,
replenishing the surface oxygen and promoting the oxidative
dehydrogenation of ethyl lactate to ethyl pyruvate.
Fig.13 Proposed reaction pathway for the aerobic and anaerobic conversion of ethyl
lactate over V2O5/TiO2 catalyst.
Conclusions
We studied the catalytic oxidative dehydrogenation of ethyl
lactate to ethyl lactate over V2O5/TiO2 catalysts. To explore the
structure-activity relationship for various vanadia species, a
series of V2O5/TiO2 with different surface densities were
prepared via incipient wetness impregnation. As their surface
density increases, the isolated VOx species agglomerated to
polymeric and crystalline VOx species, leading to a decrease in
TOF of ethyl lactate oxidation. The titania-supported vanadium
oxide was superior to vanadia catalysts supported on MgO,
Al2O3, ZrO2 and CeO2. This shows that V–O–Ti bonds play a key
role in the oxidative dehydrogenation of ethyl lactate to ethyl
pyruvate. In situ DRIFTS showed that the ethyl–propionate–2–
oxide species on catalyst surface are the key intermediates in
this reaction via dehydrogenation. Molecular oxygen can
replenish the surface oxygen, accelerating the oxidative
dehydrogenation of ethyl lactate to ethyl lactate. This work
allowed us to understand the chemical-physical features
needed for a vanadium-oxide based catalyst in order to be
active and selective in the ODH of ethyl lactate to ethyl
pyruvate, thus opening new perspectives in the valorisation of
bio-based platform molecules.
Experimental Section
Materials and instrumentation.
All chemicals were commercially available and used without
further purification: Anatase titania (Hombikat M311), (–)–
Ethyl L–lactate (Sigma–Aldrich, ≥98.0%, analytical standard),
Ammonium metavanadate (Acros organics, 99.5% analytical
standard), Oxalic acid (Sigma–Aldrich, ≥99.0%, analytical
standard), Vanadium(V) oxide(Alfa Aesar, 99.2%), Magnesium
oxide nanopower (Strem Chemicals, S.A.≥ 230 m2/g, >95%),
Aluminium oxide (Sasol, S.A.=181 m2/g, 97%), Zirconium(IV)
oxide nanopower (Sigma–Aldrich, S.A. ≥25 m2/g, 99.0%),
Cerium(IV) oxide(Alfa Aesar, S.A.=30–50 m2/g, 99.5%). X–ray
diffraction patterns were recorded on a Rigaku Mini Flex II
diffractometer instrument using Cu–Kα radiation (λ = 1.5406
Å) at 35 kV and 30 mA. Nitrogen adsorption–desorption
isotherms were measured on a Quantachrome Autosorb–3B
instrument after evacuating the samples at 523 K for 6 h. The
specific surface areas were evaluated using the Brunauer–
Emmett–Teller method. The vanadium loading was measured
by inductively coupled plasma (ICP) atom emission
spectroscopy (AES) on a Thermo IRIS Intrepid II XSP. UV−visible
diffuse reflectance spectra were collected on a Jasco V670
spectrophotometer with spectralon as standard in the range
200 – 1000 nm. Scanning electron micrographs were recorded
using a Hitachi S–4800 microscope. Temperature programmed
reduction (TPR) measurements were performed on a 1100
Series Thermo Electron TPDRO machine by using a stream of
5% H2/N2 and a heating rate of 5 °C min–1. XPS spectra were
collected using a Thermo Scientific K–ALPHA with Al–K
radiation (1486.6eV), monochromatized by a twin crystal
monochromator, yielding a focused X–ray spot with a diameter
of 400 µm, at 3 mA × 12 kV when charge compensation was
achieved with the system flood gun that provides low energy
O OC
C
OH
O O
C C
H3C
H
OCH2CH3H3C H
O C
C
CH3
O OCH2CH3
H
(a) (b) (c)
OH
O
O
O
O
O
-H -H -EtOH
O
O
+ EtOH
O
O
+ O(s) + O(s)
aerobic condition anaerobic condition
Page 8 of 12Catalysis Science & Technology
Cat
alys
isS
cien
ce&
Tech
nolo
gyA
ccep
ted
Man
uscr
ipt
Publ
ishe
d on
19
Febr
uary
201
8. D
ownl
oade
d by
Uni
vers
idad
de
Alic
ante
on
23/0
5/20
18 0
7:29
:18.
View Article OnlineDOI: 10.1039/C7CY02309J

Journal Name ARTICLE
This journal is © The Royal Society of Chemistry 20xx J. Name., 2013, 00, 1-3 | 9
Please do not adjust margins
Please do not adjust margins
electrons and low energy argon ions from a single source. The
alpha hemispherical analyzer was operated in the constant
energy mode with survey scan pass energies of 200 eV to
measure the whole energy band and 50 eV in a narrow scan to
selectively measure the particular elements. An estimation of
the intensities was done after a calculation of each peak
integral, S–shaped background subtraction and fitting the
experimental curve to a combination of a Lorentzian (30%) and
Gaussian (70%) lines. Binding energies (BE), referenced to the
C 1s line at 284.6 eV, have an accuracy of ± 0.1 eV. In situ
Diffusion reflectance infrared Fourier transform (DRIFT)
spectra was recorded using a Bruker Vertex 70 spectrometer
equipped with a Pike DiffusIR cell attachment. The cell window
was made of ZnSe. Spectra were recorded using a MCT
detector after 128 scans and 4 cm–1 resolution. The instrument
is online with a mass spectrometer EcoSys–P from European
Spectrometry Systems. In each experiment the sample was
pretreated at 450°C in He for 30 min in order to provide a
clean catalyst surface. After, the carrier gas was switched to air
in the test in presence of oxygen. This last passage was
omitted in the tests in absence of O2. Then the IR backgrounds
were collected every 50 degrees from 450 °C to 50 °C.
Afterwards, L–ethyl lactate (EL) pulse was done at 50°C. Then,
the catalyst was kept under the carrier gas flow for 30 min in
order to eliminate physisorbed molecules. Sample
temperature was then increased by 5°C/min and spectra were
collected every 50°C. During the overall IR analysis several
mass signals (m/z) were monitored continuously: 4, 14, 15, 17,
18, 27, 28, 29, 31, 42, 43, 44, 45, 46, 58, 60, 61, 70, 74, 103,
and 116. Conversion and selectivity were quantified on an
Agilent 7820A GC equipped with a flame ionization detector
(FID) and a dimethylpolysiloxane capillary column (VB–1, 30 m
× 0.32 mm × 3.00 μm).
Preparation of V2O5/TiO2
The supported vanadium oxide catalysts were prepared
following the procedure reported by Srinivas et al.64 In a
typical synthesis of V2O5/TiO2 catalyst, the TiO2 was
impregnated with the aqueous solutions of ammonium
metavanadate (NH4VO3) and oxalic acid, followed by drying
and calcining for 4 h at 550 °C. The resulting solid was denoted
as n–V2O5/TiO2, where n represents the weight percent of V2O5
on TiO2. (n =1%, 3%, 5%, 10%, 20%).
Preparation of porous MgO, ZrO2 and CeO2
Porous MgO was prepared according to a previous report.65
10 grams of magnesium hydroxide carbonate was calcined at
500 °C for 4 hours at a heating rate of 1 °C/min and then
cooled to room temperature.
Porous ZrO2 was prepared following the procedure reported
by Davshan et al.66 7.8 grams of cetyltrimethylammonium
bromide (CTMABr) was added to 50 ml water. Then the pH
value was adjusted to 2 by adding 2.0 M HCl solution. Next,
zirconium propoxide solution (70 wt. % in 1-propanol) was
added to the premixed solution under rigorous stirring for 1h.
After that, the mixture was transferred into an autoclave and
heated at 60 °C for 48 h. Then, the precipitate was filtered off
and calcined at 600 °C for 2h under air flow.
Porous CeO2 was synthesized according to the method
described by Li et al.67 Briefly, 5 grams of cerium nitrate
hexahydrate (Ce(NO3)3·6H2O) and 55 grams of NaOH were
dissolved in 25 ml H2O under vigorous stirring for 2h. Then, the
mixture was transferred into an autoclave and heated at 180
°C for 24 h. After that, the suspension was filtered, washed
with water and dried at 80 °C overnight.
Procedure for catalytic experiments
The oxidative dehydrogenation of ethyl lactate to ethyl
pyruvate was carried out in a fixed–bed quartz reactor with
internal diameter of 4 mm and length of 300 mm. The catalyst
(1g, 20–25 mesh) was placed in the middle of the reactor and
the upper part was filled with quartz sands for preheating the
ethyl lactate. Ethyl lactate was injected into the reactor at a
rate of 5ml/h by a syringe pump and using air as the carrier gas
and terminal oxidant. After each reaction period of 2 h, the
products were collected in a cold trap and add a calculated
amount of biphenyl was added as an external standard for GC
analysis.
Conflicts of interest
There are no conflicts to declare.
Acknowledgements
WZ thanks the China Scholarship Council for a PhD fellowship.
EVRF thanks Generalitat Valenciana (project
PROMETEOII/2014/004), and Ministerio de Economía y
Competitividad (Spain) for projects MAT2013-45008-P,
MAT2016-81732-ERC and RYC-2012-11427. This work is part of
the Research Priority Area Sustainable Chemistry of the UvA,
http://suschem.uva.nl.
References
1 A. Corma, S. Iborra and A. Velty, Chem. Rev., 2007, 107, 2411.
2 P. N. R. Vennestrøm, C. M. Osmundsen, C. H. Christensen and E. Taarning, Angew. Chem. Int.
Ed., 2011, 50, 10502. 3 M. Dusselier, P. Van Wouwe, A. Dewaele, E.
Makshina and B. F. Sels, Energy Environ. Sci., 2013, 6, 1415.
4 R. Beerthuis, G. Rothenberg and N. R. Shiju, Green Chem., 2015, 17, 1341.
5 P. Mäki-Arvela, I. L. Simakova, T. Salmi and D. Y. Murzin, Chem. Rev., 2014, 114, 1909.
6 E. Erlenmeyer, Ber. Dtsch. Chem. Ges., 1881, 14, 320.
7 F. Howard, Org. Syn. Coll., 1941, 1, 475. 8 F. A. Castillo Martinez, E. M. Balciunas, J. M.
Salgado, J. M. Domínguez González, A. Converti
Page 9 of 12 Catalysis Science & Technology
Cat
alys
isS
cien
ce&
Tech
nolo
gyA
ccep
ted
Man
uscr
ipt
Publ
ishe
d on
19
Febr
uary
201
8. D
ownl
oade
d by
Uni
vers
idad
de
Alic
ante
on
23/0
5/20
18 0
7:29
:18.
View Article OnlineDOI: 10.1039/C7CY02309J

ARTICLE Journal Name
10 | J. Name., 2012, 00, 1-3 This journal is © The Royal Society of Chemistry 20xx
Please do not adjust margins
Please do not adjust margins
and R. P. d. S. Oliveira, Trends Food
Sci.Technol., 2013, 30, 70. 9 S. Sugiyama, T. Kikumoto, H. Tanaka, K.
Nakagawa, K.-I. Sotowa, K. Maehara, Y. Himeno and W. Ninomiya, Catal. Lett., 2009, 131, 129.
10 M. Ai and K. Ohdan, J. Mol. Catal. A: Chem., 2000, 159, 19.
11 S. Sugiyama, N. Shigemoto, N. Masaoka, S. Suetoh, H. Kawami, K. Miyaura and H. Hayashi, Bull. Chem. Soc. Jpn., 1993, 66, 1542.
12 H. Hayashi, S. Sugiyama, N. Masaoka and N. Shigemoto, Ind. Eng. Chem. Res., 1995, 34, 135.
13 S. Lomate, T. Bonnotte, S. Paul, F. Dumeignil and B. Katryniok, J. Mol. Catal. A: Chem., 2013, 377, 123.
14 I. E. Wachs and B. M. Weckhuysen, Appl. Catal.
A, 1997, 157, 67. 15 A. Khodakov, B. Olthof, A. T. Bell and E. Iglesia,
J. Catal., 1999, 181, 205. 16 C. A. Carrero, R. Schloegl, I. E. Wachs and R.
Schomaecker, ACS Catal., 2014, 4, 3357. 17 Q. Shi, Y. Li, E. Zhan, N. Ta and W. Shen,
CrystEngComm, 2015, 17, 3376. 18 M. Inomata, K. Mori, A. Miyamoto, T. Ui and Y.
Murakami, J. Phys. Chem., 1983, 87, 754. 19 E. V. Ramos-Fernandez, N. J. Geels, N. R. Shiju
and G. Rothenberg, Green Chem., 2014, 16, 3358.
20 X. Zhao, C. Zhang, C. Xu, H. Li, H. Huang, L. Song and X. Li, Chem. Eng. J., 2016, 296, 217.
21 A. Chieregato, J. M. López Nieto and F. Cavani, Coord. Chem. Rev., 2015, 301–302, 3.
22 D. W. Kwon, S. M. Lee, J. M. Won and S. C. Hong, J. Chem. Eng. Jpn., 2015, 48, 463.
23 F. Cavani, E. Foresti, F. Trifiró and G. Busca, J.
Catal., 1987, 106, 251. 24 P. Ji, X. Gao, X. Du, C. Zheng, Z. Luo and K. Cen,
Catal. Sci.Technol., 2016, 6, 1187. 25 F. Blanco-Bonilla, S. Lopez-Pedrajas, D. Luna, J.
M. Marinas and F. M. Bautista, J. Mol. Catal. A:
Chem., 2016, 416, 105. 26 F. M. Bautista, J. M. Campelo, D. Luna, J. Luque
and J. M. Marinas, Appl. Catal. A, 2007, 325, 336.
27 C. Caro, K. Thirunavukkarasu, M. Anilkumar, N. R. Shiju and G. Rothenberg, Adv. Synth. Catal., 2012, 354, 1327.
28 K. V. Bineesh, D.-K. Kim, M.-I. L. Kim and D.-W. Park, Appl. Clay Sci., 2011, 53, 204.
29 D. Nitsche and C. Hess, J. Phys. Chem. C, 2016, 120, 1025.
30 H. Tian, E. I. Ross and I. E. Wachs, J. Phys.
Chem. B., 2006, 110, 9593. 31 X. Gao and I. E. Wachs, J. Phys. Chem. B, 2000,
104, 1261. 32 E. V. Danilevich, G. Y. Popova, T. V.
Andrushkevich, V. V. Kaichev, I. G. Danilova, Y. A. Chesalov, V. A. Rogov, V. I. Bukhtiyarov and V. N. Parmon, Appl. Catal. A, 2014, 475, 98.
33 D. Srinivas, W. F. Hölderich, S. Kujath, M. H. Valkenberg, T. Raja, L. Saikia, R. Hinze and V. Ramaswamy, J. Catal., 2008, 259, 165.
34 D. W. Kwon, K. H. Park and S. C. Hong, Appl.
Catal. A, 2015, 499, 1. 35 J. Beckers and G. Rothenberg, Dalton Trans.,
2008, 6573. 36 P. Concepción, M. T. Navarro, T. Blasco, J. M.
López Nieto, B. Panzacchi and F. Rey, Catal.
Today, 2004, 96, 179. 37 M. V. Martínez-Huerta, X. Gao, H. Tian, I. E.
Wachs, J. L. G. Fierro and M. A. Bañares, Catal.
Today, 2006, 118, 279. 38 Z. Li, K. Su, B. Cheng, D. Shen and Y. Zhou,
Catal. Lett., 2010, 135, 135. 39 B. Schimmoeller, H. Schulz, A. Ritter, A.
Reitzmann, B. Kraushaar-Czametzki, A. Baiker and S. E. Pratsinis, J. Catal., 2008, 256, 74.
40 D. W. Kwon, S. M. Lee and S. C. Hong, Appl.
Catal. A, 2015, 505, 557. 41 K. Sivaranjani, A. Verma and C. S. Gopinath,
Green Chem., 2012, 14, 461. 42 H. Zhao, S. Bennici, J. Shen and A. Auroux, Appl.
Catal. A, 2009, 356, 121. 43 A. P. Amrute, C. Mondelli, M. Moser, G. Novell-
Leruth, N. López, D. Rosenthal, R. Farra, M. E. Schuster, D. Teschner, T. Schmidt and J. Pérez-Ramírez, J. Catal., 2012, 286, 287.
44 J. Zhang, Y. Zhao, M. Pan, X. Feng, W. Ji and C.-T. Au, ACS Catalysis, 2010, 1, 32.
45 M. Gallastegi-Villa, A. Aranzabal, Z. Boukha, J. A. González-Marcos, J. R. González-Velasco, M. V. Martínez-Huerta and M. A. Bañares, Catal.
Today, 2015, 254, 2. 46 Q. Wang and R. J. Madix, Surf. Sci., 2002, 496,
51. 47 G. Deo and I. E. Wachs, J. Catal., 1994, 146,
323. 48 I. E. Wachs and B. M. Weckhuysen, Appl. Catal.
A, 1997, 157, 67. 49 I. E. Wachs, J.-M. Jehng, G. Deo, B. M.
Weckhuysen, V. V. Guliants and J. B. Benziger, Catal. Today, 1996, 32, 47.
Page 10 of 12Catalysis Science & Technology
Cat
alys
isS
cien
ce&
Tech
nolo
gyA
ccep
ted
Man
uscr
ipt
Publ
ishe
d on
19
Febr
uary
201
8. D
ownl
oade
d by
Uni
vers
idad
de
Alic
ante
on
23/0
5/20
18 0
7:29
:18.
View Article OnlineDOI: 10.1039/C7CY02309J

Journal Name ARTICLE
This journal is © The Royal Society of Chemistry 20xx J. Name., 2013, 00, 1-3 | 11
Please do not adjust margins
Please do not adjust margins
50 I. E. Wachs, Dalton Trans., 2013, 42, 11762. 51 T. Blasco and J. M. L. Nieto, Appl. Catal. A,
1997, 157, 117. 52 I. E. Wachs, J.-M. Jehng, G. Deo, B. M.
Weckhuysen, V. V. Guliants, J. B. Benziger and S. Sundaresan, J. Catal., 1997, 170, 75.
53 J. Datka, A. M. Turek, J. M. Jehng and I. E. Wachs, J. Catal., 1992, 135, 186.
54 S. Velu, M. P. Kapoor, S. Inagaki and K. Suzuki, Appl. Catal. A, 2003, 245, 317.
55 Y.-K. Chen, Y.-F. Lin, Z.-W. Peng and J.-L. Lin, J. Phys. Chem. C, 2010, 114, 17720.
56 G. Cassanas, M. Morssli, E. Fabrègue and L. Bardet, J. Raman Spectrosc., 1991, 22, 409.
57 B. Wen, Y. Li, C. Chen, W. Ma and J. Zhao, Chem. Eur. J., 2010, 16, 11859.
58 K. Krauß, A. Drochner, M. Fehlings, J. Kunert and H. Vogel, J. Mol. Catal. A: Chem., 2000, 162, 413.
59 A. Chieregato, C. Bandinelli, P. Concepción, M. D. Soriano, F. Puzzo, F. Basile, F. Cavani and J. M. L. Nieto, ChemSusChem, 2017, 10, 234.
60 V. V. Kaichev, Y. A. Chesalov, A. A. Saraev, A. Y. Klyushin, A. Knop-Gericke, T. V. Andrushkevich and V. I. Bukhtiyarov, J. Catal., 2016, 338, 82.
61 F. Folco, J. Velasquez Ochoa, F. Cavani, L. Ott and M. Janssen, Catal. Sci.Technol., 2017, 7, 200.
62 K. Hanai, A. Kuwae, K.-K. Kunimoto and S.-I. Kitoh, Eur. J. Chem., 2014, 5, 305.
63 O. Seiferth, K. Wolter, B. Dillmann, G. Klivenyi, H. J. Freund, D. Scarano and A. Zecchina, Surf.
Sci., 1999, 421, 176. 64 S. C. A. Sousa and A. C. Fernandes, Coord.
Chem. Rev., 2015, 284, 67. 65 Y.-D. Ding, G. Song, X. Zhu, R. Chen and Q. Liao,
RSC Adv., 2015, 5, 30929. 66 N. A. Davshan, A. L. Kustov, O. P. Tkachenko, L.
M. Kustov and C. H. Kim, ChemCatChem, 2014, 6, 1990.
67 J. Li, Z. Zhang, Z. Tian, X. Zhou, Z. Zheng, Y. Ma and Y. Qu, J. Mater. Chem. A, 2014, 2, 16459.
Page 11 of 12 Catalysis Science & Technology
Cat
alys
isS
cien
ce&
Tech
nolo
gyA
ccep
ted
Man
uscr
ipt
Publ
ishe
d on
19
Febr
uary
201
8. D
ownl
oade
d by
Uni
vers
idad
de
Alic
ante
on
23/0
5/20
18 0
7:29
:18.
View Article OnlineDOI: 10.1039/C7CY02309J

Page 12 of 12Catalysis Science & Technology
Cat
alys
isS
cien
ce&
Tech
nolo
gyA
ccep
ted
Man
uscr
ipt
Publ
ishe
d on
19
Febr
uary
201
8. D
ownl
oade
d by
Uni
vers
idad
de
Alic
ante
on
23/0
5/20
18 0
7:29
:18.
View Article OnlineDOI: 10.1039/C7CY02309J