Embed Size (px)
Citation preview
1
Effects of Temperature and Moisture Gradients on Slab Deformation for JPCPs
Rania E. Asbahan1 and Julie M. Vandenbossche, P.E. 2
Accepted Submittal: American Society of Civil Engineers Transportation Journal
Abstract: Slab curvature, which represents the response of concrete pavement slabs to
environmental loads, influences the location and magnitude of critical slab stresses and affects long-
term pavement performance. The purpose of this study was to measure the changes in temperature
and moisture profiles in a newly constructed concrete pavement and to determine both the overall
deformed shapes of the slabs as well as the relative contributions of built-in and transient
environmental effects over time. Data were collected from an instrumented jointed plain concrete
pavement (JPCP) over a two-year period. Slab curvatures were computed or predicted using
measurements of temperature and moisture conditions in the slab, static strain measurements, and
pavement surface profile measurements. It was found that the additional restraint provided by the
dowel and tie bars does not appear to significantly reduce slab curvature resulting from daily
temperature fluctuations or from reversible drying shrinkage. It does have a substantial effect on
reducing slab curvature due to long-term drying shrinkage. It was also found that he Mechanistic-
Empirical Pavement Design Guide default value is close to that measured in this study for the
restrained slab but does not appear to be appropriate for unrestrained (i.e., undoweled) slabs.
CE Database subject headings: Concrete Pavement, Curling, Warping, Slab Curvature,
Drying shrinkage.
1 Graduate Student, Dept. of Civil and Environmental Engineering, University of Pittsburgh, 1120 Benedum Hall, Pittsburgh, PA 15261. E-mail: [email protected] 2 Assistant Professor, Dept. of Civil and Environmental Engineering, University of Pittsburgh, 934 Benedum Hall, Pittsburgh, PA 15261. Tel.: 412.624.9879. E-mail: [email protected] (ASCE member)

2
1.0 Introduction
It is generally assumed that transverse slab cracking in jointed plain concrete pavements
(JPCP) initiates at the bottom of the slab near midpanel. There is now evidence that the
fatigue cracks can, and typically do, initiate at the top of the slab and propagate downward
(ARA 2004; Gutierrez 2008; McCracken et al. 2008). This is believed to be due to the
combined effects of environmental loading (i.e., temperature and moisture gradients that
cause slab deformation) and axle loading.
Jointed plain concrete pavements (JPCP) are usually subjected to a wide range of
temperature and moisture conditions throughout their service lives, resulting in a
correspondingly broad range of deformed slab shapes. Recognizing that the shape of the slab
at the time of traffic loading significantly affects the development of slab stresses, the
mechanistic-empirical pavement design guide (MEPDG) considers environmental effects in
the computation of the critical stresses for top-down and bottom-up cracking and determines
accumulated damage for each possible failure mode (i.e., top-down or bottom-up cracking)
individually (ARA, 2004). For this reason, the shape of the slab must be accurately
characterized for input to the MEPDG in order to produce the most accurate predictions of
cracking and JPCP service life.

3
Slab curvature, which varies primarily with transient slab temperature and moisture
conditions, is also influenced by several additional factors including: (1) temperature and
moisture conditions at the time of construction (i.e., “built-in gradients”, which affect the
long-term behavior of the slab); (2) concrete material properties, such as the coefficient of
thermal expansion, drying shrinkage, creep and elastic modulus of the concrete; (3) restraints
to slab deformation, such as slab self-weight, friction at the slab/subbase interface and
restraints to joint movement (e.g., dowel bars, tie bars and aggregate interlock) (ARA, 2004).
The first of these factors, built-in gradients, is the primary focus of this paper.
Temperature and moisture gradients at the time of set greatly affect slab curling and warping.
The effective built-in temperature gradient is defined as the effective gradient due to
combined effects of temperature and moisture gradients that are present in the slab when it
sets as well as the long-term irreversible drying shrinkage. The time of set is when the
concrete behavior changes from plastic to elastic, and is when the concrete can begin to carry
structural stresses and strains. The actual value of the effective built-in temperature gradient
is dependent on factors such as the coefficient of thermal expansion/contraction of the PCC
mix, temperature conditions at the time of paving, and curing practices and conditions. Prior
to the time the concrete sets, the slab remains flat because the concrete is in a plastic state.
After the concrete sets, the response of the slab is affected by the magnitude and direction of
the effective built-in temperature gradient. For example, when the slab temperature is
uniform (i.e., no temperature gradient exists), it may be curled rather than flat because it can
only be flat when the transient gradient equals the built-in gradient (after adjusting for any
creep or relaxation effects that have developed over time). The curling is upward if the built-

4
in gradient is positive and downward if it is negative. The built-in construction gradient has
proven to be an important factor in estimating stress in concrete pavements, especially when
using the MEPDG (Hansen et al., 2006; Wells et al., 2006; Yu et al., 1998; Yu and
Khazanovich, 2001; Ruiz et al., 2001; Rao and Roesler 2005; Eisenmann and Leykauf,
1990).
This paper examines three different approaches to determining the curvature of in-service
JPCP panels in the presence of measured temperature and moisture conditions: use of slab
temperature and moisture measurements, strain gage measurements and surface profile
measurements. These three methods are applied to data collected from an instrumented JPCP
and are used to evaluate the effects of built-in gradients (drying shrinkage) on slab curvature.
2.0 Project Description
This research effort was focused on characterizing the temperature and moisture conditions
to which an in-service pavement was subjected and on determining the resulting slab
behavior. A portion of State Route 22 near Murrysville, Pennsylvania (approximately 32 km
[20 miles] east of Pittsburgh) was instrumented during construction in August 2004. The
instrumented section consists of 14 JPCP slabs measuring 3.7 m (12 ft) wide and 4.6 m (15
ft) long. Two types of slabs were constructed: unrestrained and restrained. The restrained
slabs featured 16-mm diameter (No. 5) epoxy-coated tie bars placed every 0.8 meters (2.5 ft)
along the lane/shoulder and centerline joints, and 38-mm (1.5-in) diameter epoxy-coated
dowel bars placed every 305 mm (12 in) along the transverse joints. The unrestrained slabs
included no tie or dowel bars.

5
The pavement structure comprised a 305-mm (12-in) thick PCC slab constructed on a 102-
mm (4-in) asphalt treated permeable base (ATPB) layer and 127 mm (5 in) of densely graded
subbase. A 610-mm (24-in) gap-graded soil and aggregate mixture was placed on top of the
A-6 subgrade. Cores obtained after construction showed that the as-built thickness of the
concrete slab varies between 305 mm (12 in) and 355 mm (14 in).
Thermocouples, moisture sensors and vibrating wire (VW) static strain gages were placed at
various locations and depths in three restrained and three unrestrained slabs, as shown in
Figure 1. Additional details concerning the construction of the test section can be found in
the 2005 report by Wells et al.
3.0 Slab Curvature
As the slab is subjected to a given set of moisture and temperature gradients, slab strains vary
through the thickness of the concrete, causing the slab to curl/warp either upward or
downward, depending upon whether the net gradient is negative or positive. The difference
in strains at the top and bottom of the slab can be used to compute the slab curvature using
equation 1.
( )bt
bt
D εε
εερ
++
−−=
1 (Equation 1)
where: ρ = Slab curvature (positive values indicate upward curvature), in units of 1/m
ε t = Strain at the top of the slab at the time of interest
ε b = Strain at the bottom of the slab at the time of interest

6
D = Distance between the top and bottom of the slab where strain is calculated or
strain measurements are taken, m.
This equation was derived using the following assumptions (Mohamed and Hansen 1997):
(a) the slab is elastic, homogenous and isotropic, with temperature-independent material
properties; (b) plane sections remain plane after bending; (c) stresses and strains in the
vertical direction are zero; (d) the deflection of the slab is small compared to the slab
dimensions; and (e) temperature and shrinkage strains vary in the vertical direction only.
In this study, the curvatures of in-service pavement slabs were estimated or computed using
calculated strains due to measured temperature and moisture conditions, actual strain
measurements in the concrete slab, or pavement surface profile measurements. Each of these
approaches is described in the following sections.
3.1 Curvature Estimates Based on Temperature and Moisture Measurements
Type T thermocouple wire was used to measure temperatures in the concrete and underlying
layers. Sensirion SHT75 sensors were used to measure moisture and temperature variations
in the concrete with a manufacturer-reported accuracy of 1.8 percent in the measured
moisture content. Procedures developed by Grasley et al (2003) at the University of Illinois
at Urbana-Champaign for the use of these sensors in concrete applications were followed.
Equations 2 and 3 were used to estimate the thermal and moisture strains at the slab surface
as functions of the measured temperature and moisture distributions through the slab
thickness, the coefficient of thermal expansion and the ultimate shrinkage strain. The
required material properties were obtained through laboratory testing (Wells et al., 2005;
Asbahan et al., 2006; McCracken et al., 2008). For concrete used in this test section, the

7
coefficient of thermal expansion was 10.6 x 10⁻⁶ mm/mm/˚C (5.9 x 10⁻⁶ in/in/˚F) and the
ultimate shrinkage strain was 945 microstrain.
eqcTempGrad T∆= αε (Equation 2)
eq
MoistGrad
RH
−∆−= ∞
3
1001εε (Equation 3)
where: ε TempGrad = thermal strain due to a temperature gradient through the slab thickness,
ε MoistGrad = moisture strain due to a moisture gradient through the slab thickness,
α c = coefficient of thermal expansion of the concrete,
ε ∞ = ultimate shrinkage strain,
∆Teq = equivalent linear temperature difference, and
eq
RH
−∆
3
1001 = equivalent linear humidity difference coefficient.
The equivalent linear temperature difference coefficient and the equivalent linear humidity
difference coefficient represent the differences in temperature and moisture conditions
between the top and bottom portions of the slab, with respect to the bottom of the slab. The
coefficients are determined based on a regression analysis of temperature and moisture
profiles. A third-degree polynomial is assumed to accurately fit the temperature and
moisture profiles and the regression coefficients are used to calculate the equivalent linear
difference coefficients (Jeong and Zollinger, 2005). This approach is based on a similar
approach, suggested by Mohamed and Hansen (1997), to determining the linear temperature
8
and humidity differences through the slab based on the actual temperature and humidity
differences.
The calculated strain data were zeroed based on the temperature and moisture conditions that
were present at the time of set of the concrete. Early age data collected from static strain and
temperature sensors in the concrete and pressure sensors along the slab/base interface were
analyzed to determine the built-in gradients in the PCC slabs. The built-in temperature
gradient was determined to be 0.0067°C/mm (0.31˚F/in). Details concerning the
determination of the built-in temperature gradient have been documented by Wells et al
(2006). The moisture in the slab was monitored using relative humidity sensors embedded at
four different slab depths. These sensors indicated that the relative humidity in the concrete
remained constant at 100 percent throughout the slabs during first 24 hours after paving; this
indicates that the built-in gradient due to a moisture a moisture gradient present at the time of
set is not significant and can be neglected (Asbahan, 2009).
Slab curvatures computed based on the calculated thermal and moisture strains are presented
in Figure 2. It is important to note that these calculated curvatures do not consider the factors
that restrain slab deformation; therefore, it is likely that they overestimate the actual slab
curvature. Curvature due to the calculated thermal strain fluctuates between positive and
negative values throughout the two-year period, with a relatively small range of curvatures
during the winter and a larger range of curvatures during other seasons. This indicates that
daily fluctuations in the temperature gradient cause the slabs to curl upward and downward
during all seasons at this site, and that the range of movement is smallest during the winter.
The curvatures due to the calculated moisture-induced strains are mostly positive, indicating

9
that moisture gradients generally caused the slabs to curl upward throughout the two-year
period. This is consistent with the presence of a negative moisture-induced strain gradient
and an equivalent negative temperature gradient due to moisture in the slab. Soon after
construction, the magnitude of the moisture-induced curvatures becomes larger than the
magnitude of the thermal-induced curvatures. Therefore, the net effect is that the curvature
of the slabs is predominantly upward by the summer following construction. This condition
would contribute to top-down fatigue cracking (rather than the bottom-up fatigue cracking
that is traditionally assumed for JPCP).
3.2 Curvature Estimates Based on Strain Measurements
Another approach to defining the shape of the slab is through strain measurements. Geokon
Model 4200 Vibrating Wire (VW) concrete embedment strain gages were installed at
different locations and various depths in the concrete slabs (as shown in Figure 1) to measure
actual slab deformations caused by temperature changes, moisture changes and other factors
that might affect slab deformation.
Raw strain readings were first corrected for the effects of temperature on the steel wire in the
gage and were then converted into total strain (using Equation 4), which reflects the total
deformation measured in the slab (Wells et al. 2005).
( ) ( ) stttotal TTBRR αε 00 −+−= (Equation 4)
where: εtotal = Total strain in the concrete (corrected for temperature effects on VW)
R0 = Raw strain reading at time 0 (initial concrete set)

10
Rt = Raw strain reading at time t
T0 = Temperature at time 0 (initial concrete set)
Tt = Temperature at time t
αs = Thermal coefficient of expansion of steel in strain gage, 12.2 µε/°C (6.78 µε/°F)
B = Strain gage batch calibration factor (provided by the manufacturer)
Total measured strains calculated using equation 4 were then separated into components:
strain due to temperature effects and strain due to other remaining factors (including
moisture, creep, and slab restraining conditions). Strain due to uniform temperature change
is estimated using equation 5 and strain due to other components is estimated by subtracting
the thermal strain from the total strain, as shown in equation 6. Equation 5 does not take into
account the strain induced by temperature gradients, which can be computed using Equation
2, and does not take into account the effects of slab restraint.
( ) ctmTempUnifor TT αε 0−= (Equation 5)
( )TempGradmTempUnifortotalother εεεε +−= (Equation 6)
where: ε TempUniform = Strain in the concrete due to uniform temperature change
ε other = Strain in the concrete due to all factors that are not temperature-related
ε TempGrad = Strain in the concrete due to equivalent linear temperature gradients,
calculated in section 4.1
Slab curvatures were calculated using the strains measured along the diagonal by the static
strain sensors located at the tops and bottoms of the slab corners. A summary of the history
of slab curvatures computed using measured strains is presented in Figure 3. This figure

11
indicates that the average curvature trends were similar for the restrained and unrestrained
slabs during the first two years after construction: the ranges of curvature are relatively small
during the winters and larger during the summers. This is expected because the slabs are
subjected to smaller temperature gradients during the winter season (resulting in smaller
amounts of curvature) and larger temperature gradients during the summer (resulting in
larger amounts of curvature). Computed curvatures are predominantly (>99 percent of
values) positive or curled upward, which is a similar trend to that observed with the curvature
calculated based on temperature and moisture measurements. This supports the theory that
the slabs will be more susceptible to top-down than bottom-up cracking.
To isolate the effects of moisture, creep and slab restraint on the slabs, the curvatures
calculated based on measured temperatures were subtracted from the curvatures calculated
based on total strain measurements. These data are presented in
Figure 4 for both restrained and unrestrained slabs.
Figure 4 shows that the curvature influenced by moisture, creep and slab restraint generally
increases throughout the two-year period, particularly for the unrestrained slabs. Since the
slab restraining conditions do not change for each type of slab, the figure indicates that the
moisture causes an increase in slab curvature which is counteracted by the effect of creep on
the slabs. However, the overall combined effect of both factors causes an increase in the slab
curvature.
3.3 Curvature Estimates Based on Surface Profile Measurements
12
Surface profile measurements were performed to capture changes in the slab shape under
various temperature and moisture gradients. Profile measurements were accomplished using
a Dipstick™, a device that provides the elevations of successive points along any surface
through highly accurate measures of slope over the span of the device (FACE, 2004). Profile
measurements were performed on the restrained and unrestrained slabs in the longitudinal,
diagonal, and transverse directions under different temperature and moisture conditions
during each season over the two-year monitoring period. By using this device several times
on any given day, a dynamic representation of the surface profile variations with daily
temperature gradients could be obtained.
When plotting the surface profiles, the effects of surface irregularities, built-in temperature
gradients and any moisture gradients were removed from the measured profiles by
subtracting from any given profile measurement another profile measurement obtained along
the same profile line, on the same date, at a temperature gradient of about 0.0067 °C/mm
(0.31˚F/in), which is the magnitude of the built-in temperature gradient. The resulting profile
represents the curvature due solely to transient temperature gradient conditions.
A second-order polynomial was fitted to each zeroed and the second derivative of each
polynomial was obtained to provide an estimate of the radius of curvature for each profile.
The resulting data indicate that the slab surfaces are subjected to positive and negative
curvatures on a daily basis, as seen in Figure 5. During the early morning hours, when
temperature gradients are generally negative, the slabs tend to be curled upward; during the
afternoon hours, when temperature gradients are generally positive, the slabs tend to be
13
curled downward. Again, the transient temperature gradients and are not the actual slab
curvatures that include built-in temperature and moisture effects. Therefore, they cannot be
compared directly with curvatures shown in figures 2, 3 or 4.
4.0 Effect of Drying Shrinkage on Slab Curvature
A linear relationship between slab curvature and equivalent linear temperature gradient was
defined using the VW data and the surface profiles by combining the curvature data with the
equivalent linear temperature gradient derived from the midpanel thermocouples. Plots of
curvature versus equivalent linear temperature gradient for the diagonal, longitudinal and
transverse profiles of both unrestrained and restrained slabs were generated for data collected
during the first three years after paving (Asbahan et al., 2006; McCracken et al., 2008), as
shown in Figure 5. This represents curvature due to transient temperature gradients. This
plot shows that slab curvature generally decreases as the temperature gradient in the slab
increases (negative curvature values indicates downward slab curvature and positive
curvature values indicate upward curvature). Figure 5 also shows that the magnitude of
curvature was similar for the restrained and unrestrained slabs and ranged between 0.0003
1/m (0.0010 1/ft) and -0.0005 1/m (-0.0017 1/ft). These values are similar to the temperature
measurement-based curvatures computed in section 4.1.
Figure 6 presents a plot of curvature versus equivalent linear temperature gradient data using
the strain data from the restrained and unrestrained slabs for the month of April 2006 only (to
limit the number of points being plotted). The month of April was selected because this
month typically exhibits the widest range of temperature gradients and would, therefore,

14
encompass the majority of the gradients experienced throughout the year. These strains
represent both built-in and transient gradients. Note that the slopes of the trendlines for the
restrained and unrestrained slab data are similar, as they were in Figure 5. However, the data
points in Figure 65 (based on the surface profile measurements) are essentially collinear
because drying shrinkage effects have been removed, which is not the case for the data
presented in Figure 6.
Figure 6 suggests that the gradients present in the restrained and unrestrained slabs when the
slabs are flat (i.e., the slabs have zero curvature) are 0.0222 °C/mm (1.03˚F/in) and 0.0407
°C/mm (1.88 ˚F/in), respectively. This is equivalent to a zero-curvature temperature
difference (i.e., an effective built-in temperature difference) of 6.8 °C (12.4˚F) for a 305-mm
(12-in) thick restrained slab and a 12.4 °C (22.6˚F) temperature difference for a 305-mm (12-
in) unrestrained slab. The default value for effective built-in temperature difference currently
suggested in the MEPDG is 5.6 °C (10˚F), regardless of whether the slab is doweled or
undoweled. The MEPDG default value is close to that measured in this study for the
restrained slab but does not appear to be appropriate for unrestrained (i.e., undoweled) slabs.
The built-in temperature gradient was previously determined to be 0.0067 °C/mm
(0.31˚F/in). The differences between this value and the effective built-in temperature
gradients computed above (which include the effects of drying shrinkage and creep since
construction) are 0.0016 °C/mm (0.72˚F/in) for the restrained slabs and 0.034 °C/mm
(1.57˚F/in) for the unrestrained slabs. This restraint of free deformation results in
substantially higher levels of stress. The curvatures due only to long-term drying shrinkage

15
and the built-in gradient (i.e., the x-axis intercepts in Figure 6) are 0.0003 1/m (0.0010 1/ft)
for the restrained slabs and 0.0005 1/m (0.0017 1/ft) for the unrestrained slabs. The
curvature of the restrained slabs is more than 50 percent lower than that of the unrestrained
slabs.
It is somewhat surprising that the slopes of the trend lines for the restrained and unrestrained
slabs are so similar. These similar slopes indicate that the rates of change in curvature with
changes in the temperature gradient are similar for the restrained and unrestrained slabs. An
estimate of the maximum curvature caused strictly by the temperature gradient observed
throughout the month can be obtained by subtracting out the curvature due to the built-in
gradient and the drying shrinkage [0.0003 1/m (0.0010 1/ft) for the restrained slab and
0.0005 1/m (0.0017 1/ft) for the unrestrained slab]. In doing this, it was found that the
maximum and minimum curvatures corresponding to the minimum and maximum gradients
experienced throughout the month were 0.0003 1/m (0.0010 1/ft) and -0.0006 1/m (-0.0020
1/ft), for both the restrained and unrestrained slabs. Therefore, the additional restraint
provided by the dowel and tie bars does not significantly reduce slab deformations resulting
from daily temperature fluctuations. These trends were also observed for the curvature
values estimated from strain measurements in the longitudinal and transverse directions.
Similar observations can be made using data reported previously by Vandenbossche (2003).
Plots similar to Figure 6 were made for strain data collected at various times throughout the
first two years after paving. Linear regression analyses were performed so that the y-
intercept could be established for each data set. The y-intercept represents the curvature in
16
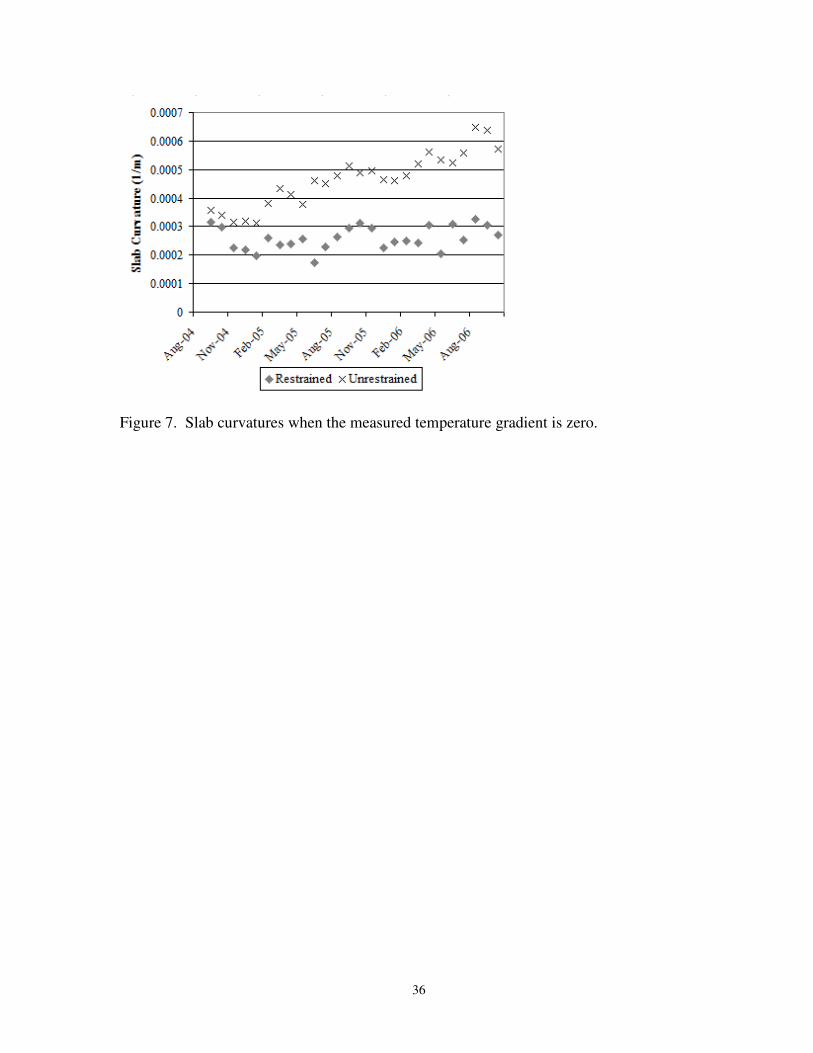
the slab when a transient temperature gradient is not present. For the purposes of this
discussion, this condition will be referred to as the “zero-gradient curvature.” The zero-
gradient curvature histories were determined for the restrained and unrestrained slabs for the
first two years after paving, as shown in Figure 7. These curvatures represent the effects of
built-in gradients as well as drying shrinkage. Some of this drying shrinkage is reversible, as
can be seen by the seasonal fluctuations. Rewetting during wet seasons (e.g., springtime)
reverses a portion of the drying shrinkage and reduces the observed curvatures. The
shrinkage (and, therefore, the curvature) is regained during the drier seasons. This yearly
fluctuation in curvatures is about 0.0001 1/m (0.0003 1/ft) for both the restrained and
unrestrained slabs.
The dowel and tie bars do not appear to have a significant effect on changes in slab curvature
attributed to the seasonal fluctuations in drying shrinkage. They do, however, have a
substantial effect on longer-term effects of shrinkage on observed slab curvature values.
Figure 7 shows that the overall trend of the zero-gradient curvatures for the restrained slabs is
relatively flat while there is an obvious increase in the zero-gradient curvature with time for
the unrestrained slabs. The longer-term reduction in slab curvature for restrained slabs helps
to insure the presence of more uniform support beneath the slabs and, therefore, reduces
vehicle load-related stresses. These reductions in vehicle load-related stresses are at least
partially offset by increases in critical slab stresses (particularly those at the top of the slab
near mid-panel) due to the restraint of curvature.
5.0 Comparisons

17
In previous sections of this paper, slab curvature was estimated based on the calculated
thermal and moisture strains, measured strains and surface profile measurements. In this
section, the slab curvatures estimated using these three approaches are compared and the
results are used to evaluate the effects of moisture on the drying shrinkage of the restrained
and unrestrained slabs.
First, the curvatures calculated based on the VW sensors and the Dipstick data are compared.
The curvatures provided in Figure 6 are estimated based on strain data collected from the
VW sensors in the corner of the slab adjacent to the lane/shoulder joint and in the
longitudinal, diagonal and transverse directions. The curvatures provided in Figure 5 are
based on surface profiles that begin in the slab corner adjacent to the lane/shoulder joint and
extend in the same three directions. The curvatures presented in Figures 5 and 6 follow the
same general daily trends, with smaller curvature values resulting from estimates that are
based on the measured strain data, in most cases. The trend line for the curvatures estimated
from the surface profiles is shifted downward with respect to the trend line for the curvatures
obtained from the strain gage data and has a flatter slope. The downward shift means that the
computed curvatures under/overestimate actual total curvatures because the process of
zeroing out the profile measurements removes the effects of everything except the transient
temperature gradient.
Figure 8 presents comparisons of slab curvatures calculated based on temperature and
moisture measurements with curvatures estimated based on strain measurements (diagonal
direction only) and curvatures based on surface profile measurements (diagonal direction

18
only); all data presented were collected during a single day in March 2005. This figure
shows that the curvatures derived from surface profile data closely fit the trend line for
curvatures based on temperature measurements. Curvature due to moisture-induced strains is
relatively constant throughout the test day. This confirms the previous conclusion statement
that the primary difference between the curvatures computed using strain data and curvatures
computed from surface profile data is due to the effects of moisture and creep.
It can also be concluded from Figure 8 that the addition of curvatures due to temperature and
moisture measurements results in computed total curvatures that are larger than the
curvatures estimated using strain measurements. This indicates that creep and slab restraint
(in both restrained and unrestrained slabs) cause reductions in slab curvature when compared
with the total curvature computed using calculated thermal and moisture gradients. For
example, for the test day in March of 2005 that was used in Figure 8, unrestrained slab
curvatures computed using the VW data are an average of 30 percent lower than curvatures
computed using strains estimated from temperature and moisture measurements. This
reduction can be attributed to the effects of slab self-weight and creep. For the restrained
slabs, the average reduction is 56 percent and can be attributed to the effects of dowel bars,
tie bars, slab self-weight and creep.
A comparison of the curvatures of the restrained and unrestrained slabs leads to the
conclusion that the presence of dowel bars and tie bars along the joints reduced the slab
curvatures by an average of 38 percent on this project. Reduced curvature affects the
development of slab stresses: joint restraint increases temperature- and moisture-related

19
stresses (until creep and stress relaxation reduce this effect), but can reduce load-induced
stresses by providing more uniform slab support. This reduction in curvature for restrained
slabs was observed for all three curvature measurement/estimation techniques.
The differences between curvatures estimated using strain data and those estimated using
surface profile measurements were calculated for every profile measured during every field
data collection outing. Figure 9 presents a summary of the differences in curvatures for the
restrained and unrestrained slabs for the two-year period following paving (using surface
profiles measurements obtained along the slab diagonal). The figure shows that the
calculated differences (VW-based curvature minus profile-based curvature) are positive at all
times more than a few months after construction. This is consistent with the fact that
curvatures based on surface profile measurements in this study represent departures from
zero-gradient deformations measured on the day of testing and do not, therefore, take into
account the effects of moisture-related deformations, which would otherwise increase
upward (positive) slab curvature. Figure 9 also shows that the difference in curvatures varies
over the two-year period, suggesting that the drying shrinkage at the slab surface is generally
increasing with time as the slabs dry, but that there are seasonal fluctuations as well. Similar
trends were observed for the slab curvatures measured in the longitudinal and transverse
directions. Figure 9 shows that the curvature differences are smaller for the restrained slabs,
confirming the previously stated finding that slab edge restraint reduces the curvature
produced by moisture gradients.

20
Figure 9 also shows that the rate of increase in the curvature differences over time is five
times larger (on average) for the unrestrained slabs than for the restrained slabs. This further
illustrates the effects of slab restraint due to dowel bars on slab curvature due to drying
shrinkage and supports the previously stated findings based on Figure 7.
There is significant scatter in the restrained slab curvature difference data for every test date.
This scatter is most likely due to differences in the restraining conditions along the slabs. For
example, it is possible that there is variability in dowel “looseness” (due to construction
factors) and other restraining factors between the instrumented slabs. In addition, joint
cracking patterns can affect the effective width of transverse joints (e.g., joints that crack
sooner after paving are often wider than joints that crack later), which can affect the stiffness
of doweled joints (i.e., reduced stiffness at wider doweled joints). This scatter in slab
curvature differences was not observed for the unrestrained slabs; the unrestrained slabs
exhibited a more repeatable pattern of behavior.
6.0 Summary and Conclusions
Temperature gradients in concrete slabs cause the slabs to curl upward and downward both
daily and seasonally, while moisture gradients generally cause slabs to curl upward. Based
on slab curvatures calculated from slab temperature and moisture measurements, it was
found that slabs are predominantly curled upward within a few months after paving and they
remain that way, resulting in increased potential for top-down fatigue cracking (rather than
the bottom-up fatigue cracking that has traditionally been assumed in concrete pavement
design). This finding was confirmed using curvatures computed from slab strain

21
measurements, which showed that the slabs on this project were curled upward about 99
percent of the time.
Overall curvatures in restrained slab averaged more than 60 percent lower than those of
unrestrained slabs. This restraint of temperature- and moisture-related deformation can result
in substantially higher levels of environmental slab stress, which decrease over time with
creep and stress relaxation and may also be partially offset by reduced load-related stresses
(due to more uniform support of restrained slabs).
Differences in slab curvatures estimated using static strain measurements those estimated
using surface profile data can be attributed primarily to the effects of concrete drying
shrinkage, which are not considered in the profile-based curvature values developed in this
study. Drying shrinkage at the slab surface was observed to increase with time during the
two-year period of this study, and the rate of increase in slab curvature due to drying
shrinkage is larger for the unrestrained slabs than for the restrained slabs. Some of this
drying shrinkage is reversible, as can be seen by the seasonal fluctuations in slab curvature,
with shrinkage and slab curvature decreasing during wet seasons and increasing again during
drier seasons.
The additional restraint provided by the dowel and tie bars does not appear to significantly
reduce slab curvature resulting from daily temperature fluctuations or from reversible drying
shrinkage. It does have a substantial effect on reducing slab curvature due to long-term
drying shrinkage. This reduction in curvature help to provide more uniform support beneath

22
restrained slabs and, therefore, reduces vehicle load-related stresses. The restrain of slab
deformation, however, does increase environmental (temperature- and moisture-related)
stresses.
The 305-mm (12-in) thick slabs considered in this study were found to have effective built-in
temperature differences of 6.8 °C (12.4˚F) for the restrained slabs and 12.4 °C (22.6˚F) for
the unrestrained slabs. The default value for effective built-in temperature difference
currently suggested in the MEPDG is 5.6 °C (10˚F), regardless of whether the slab is
doweled or undoweled. The MEPDG default value is close to that measured in this study for
the restrained slab but does not appear to be appropriate for unrestrained (i.e., undoweled)
slabs.
Acknowledgements
The authors would like to thank the Pennsylvania Department of Transportation (PennDOT)
and the Federal Highway Administration (FHWA) for their financial support of this study.
In addition, the authors would like to thank all of the graduate and undergraduate students
who assisted with this research effort.
References
American Association of State Highway and Transportation Officials (AASHTO). 1993.
Guide for Design of Pavement Structures. Washington, D.C.
ARA, Inc., ERES Consultants Division. March 2004. Guide for Mechanistic-Empirical
Design of New and Rehabilitated Pavement Structures. Final Report. National

23
Cooperative Highway Research Program. Transportation Research Board, National
Research Council. Champaign, Illinois.
Armaghani, J.M., Larsen, T.J. and Smith, L.L. 1987. Temperature Response of Concrete
Pavements. Transportation Research Record 1121: pp. 23-33.
Asbahan, R. E., McCracken, J. K. and Vandenbossche, J. M. November 2006. S.R.-22 Smart
Pavement Phase II: One-Year Material Properties and Pavement Response
Characteristics for Jointed Plain Concrete Pavements. Submitted to the Pennsylvania
Department of Transportation and the Federal Highway Administration, University of
Pittsburgh, Department of Civil and Environmental Engineering. Pittsburgh,
Pennsylvania.
Beckemeyer, C. A., Khazanovich, L., and Yu, H. T. 2002. Determining amount of built-in
curling in jointed plain concrete pavement: Case study of Pennsylvania I-80.
Transportation Research Record 1809. Transportation Research Board. Washington,
D.C. pp. 85–92.
Bergstrom, S.G. 1950. “Temperature stresses in concrete pavements”. Proceedings,
Handlingar, Swedish Cement and Concrete Research Institute, N:R 14, Sweden.
Bradbury, R. D. 1938. Reinforced Concrete Pavements. Wire Reinforcement Institute.
Washington, D.C.
Byrum, C. R. 2000. Analysis by high-speed profile of jointed concrete pavement slab
curvatures. Transportation Research Record 1730. Transportation Research Board.
Washington, D.C. pp. 1–9.
24
Eisenmann, J. and G. Leykauf, 1990. Simplified Calculation Method of Slab Curling Caused
by Surface Shrinkage. Proceedings, 2nd International Workshop on Theoretical
Design of Concrete Pavements: 185-197. Madrid, Spain.
Face Construction Technologies, Inc. 2004. Dipfloor 6.1. User’s Guide. Face Construction
Technologies, Inc.
Grasley, Z.C., and D.A. Lange. 2004. Modeling Drying Shrinkage Stress Gradients in
Concrete. Cement, Concrete and Aggregates (ASTM). 26: (2) pp. 115 22.
Grasley, Z.C., Lange, D.A. and D’Ambrosia, M.D. 2003. “Internal relative humidity and
drying stress gradients in concrete.” Proceedings of Engineering Conferences
International, Advances in Cement and Concrete IX, Copper Mountain, CO.
Gutierrez, J. J. 2008. Evaluating the JPCP Cracking Model of the Mechanistic-Empirical
Pavement Design Guide. Master’s Thesis, Master of Science in Civil Engineering,
Civil and Environmental Engineering Program, University of Pittsburgh.
Hansen, W., Wei, Y., Smiley, D.L., Peng, Y. and Jansen, E.A. December 2006. Effects of
Paving Conditions on Built-In Curling and Pavement Performance. International
Journal of Pavement Engineering. 7: (4) pp. 291-296.
Harik, I. E., P. Jianping, H. Southgate, and D. Allen. 1994. Temperature Effects on Rigid
Pavements. Journal of Transportation Engineering. 120: (1) pp. 127–143.
Heath, A. C., Roesler, J. R. and Harvey, J. T. March 2003. Modeling Longitudinal, Corner
and Transverse Cracking in Jointed Concrete Pavements. The International Journal
of Pavement Engineering. 4 (1) pp. 51-58.
Huang, Yang H. 2004. Pavement Analysis and Design. Prentice Hall Inc. Englewood Cliffs,
New Jersey.

25
Janssen, D. J. 1987. Moisture in PCC. Transportation Research Record 1121.
Janssen, D. J. and M. B. Snyder. June 2000. Temperature-Moment Concept for Evaluating
Pavement Temperature Data. Technical Note No. 19948. Journal of Infrastructure
Systems. American Society of Civil Engineers. Reston, VA, 6: (2) pp. 81-83.
Jeong, Jin-Hoon and Zollinger, Dan G. 2005. Environmental effects on the behavior of
jointed plain concrete pavements. Journal of Transportation Engineering. 131: (2)
pp. 140-148.
Khazanovich, L., H. T. Yu, S. Rao, K. Galasova, E. Shats, and R. Jones. 2000. ISLAB2000 -
Finite Element Analysis Program for Rigid and Composite Pavements, User’s Guide.
ERES Division of ARA, Inc. Champaign, IL.
McCracken, J., Asbahan, R. and Vandenbossche, J. 2008. S.R.-22 Smart Pavement Phase II
Final Report: Pavement Response Characteristics for Jointed Plain Concrete
Pavements. Submitted to the Pennsylvania Department of Transportation and the
Federal Highway Administration. University of Pittsburgh, Department of Civil and
Environmental Engineering, Pittsburgh, Pennsylvania.
Miner, M. A. 1945. Cumulative Damage in Fatigue. Transactions. American Society of
Mechanical Engineers, 67 pp. A159-A164.
Mohamed, A. R. and Hansen, W. 1997. Effect of Nonlinear Temperature Gradient on
Curling Stress in Concrete Pavements. Transportation Research Record 1568. TRB,
National Research Council. Washington, D.C. pp. 65-71.
Rao, C., E. J. Barenberg, M. B. Snyder, and S. Schmidt. 2001. Effects of Temperature and
Moisture on the Response of Jointed Concrete Pavements. Proceedings, 7th
International Conference on Concrete Pavements. Orlando, Florida.

26
Rao, S. and Roesler, R. R. April 2005. Characterizing Effective Built-In Curling From
Concrete Pavement Field Measurements. Journal of Transportation Engineering.
American Society of Civil Engineers. 131: (4) pp. 320-327.
Richardson, J. M., and Armaghani, J. M. 1987. Stress caused by temperature gradient in
Portland cement concrete pavements. Transportation Research Record 1121.
Transportation Research Board, National Academy Press. Washington, D.C. pp. 7–
13.
Ruiz J.M, Kim P.J., Schindler A.K., and, Rasmussen R.O. 2001. Validation of HIPERPAV
for prediction of early-age jointed concrete pavement behavior. Journal of the
Transportation Research Board, TRR No. 1778. Washington, D.C. pp. 17-25.
Shoukry, S.N. 2000. Backcalculation of thermally deformed concrete pavements. Journal of
Transportation Research Record No. 1716. National Research Council. Washington,
D.C. pp 64–72.
Teller, L.W. and Sutherland, E.C. 1936. “The structural design of Concrete Pavements,
Public Roads: Part II, Observed effects of variations in temperature and moisture on
the size, shape and stress resistance of concrete pavement slabs”, Vol. 16, November,
pp. 169-197.
Thomlinson, J. 1940. “Temperature variation and consequent stresses produced by daily and
seasonal temperature cycles in concrete slabs”. Concrete and Constructional
Engineering, Vol. 36, No. 6, pp. 298-307 and No. 7, pp. 352-360.
Thompson, M. R., B. J. Dempsey, H. Hill, and J. Vogel. 1987. Characterizing Temperature
Effects for Pavement Analysis and Design. Transportation Research Record 1121,
TRB, National Research Council. Washington, D.C. pp. 14–22.
27
Vandenbossche, J. M. 2003. “Interpreting Falling Weight Deflectometer Results for Curled
and Warped Portland Cement Concrete Pavements” Civil Engineering, University of
Minnesota, Doctor of Philosophy Dissertation.
Wells, S. A., Phillips, B. M. and Vandenbossche, J. M. June 2005. S.R.-22 Smart Pavement
Phase I: Early-Age Material Properties and Pavement Response Characteristics for
Jointed Plain Concrete Pavements; 28-Day Report Final Revision. Submitted to the
Pennsylvania Department of Transportation and the Federal Highway Administration.
University of Pittsburgh, Department of Civil and Environmental Engineering,
Pittsburgh, Pennsylvania.
Wells, S.A., Phillips, B. M. and Vandenbossche, J. M. December 2006. Quantifying Built-In
Construction Gradients and Early-Age Slab Deformation Caused by Environmental
Loads in a Jointed Plain Concrete Pavement. International Journal of Pavement
Engineering. 7: (4) pp. 275-289.
Westergaard, H. M. 1926. Analysis of Stresses in Concrete Pavement Due to Variations of
Temperature. Proc., Highway Research Board, Washington, D.C. Vol. 6, pp. 201-
215.
Westergaard, H. M. 1927. Theory of concrete pavement design. Proc.,Highway Research
Board, Part I. Washington, D.C. pp. 175–181.
William, G. W. and Shoukry, S. N. 2001. 3D Finite Element Analysis of Temperature-
Induced Stresses in Dowel Jointed Concrete Pavements. International Journal of
Geomechanics. 1: (3) pp. 291-308.

28
Yu, H. T., K. D. Smith, M. I. Darter, J. Jiang and L. Khazanovich. 1998. Performance of
Concrete Pavements Volume III - Improving Concrete Pavement Performance. Final
Report, FHWA-RD-95-111, Federal Highway Administration. McLean, VA.
Yu, H.T. and Khazanovich, L. September 2001. Effects of Construction Curling on Concrete
Pavement Behavior. Proceedings 7th
International Conference on Concrete
Pavements. Orlando, FL. pp. 55-67.

29
List of Figures
Figure 1. Locations of the sensors in the instrumented test sections.
Figure 2. Slab curvature calculated using measured temperature and moisture gradients.
Figure 3. Average slab curvature for the restrained and unrestrained slabs using computed
surface profile measurements from the slab diagonals.
Figure 4. Average slab curvatures along the slab diagonal due to moisture, creep and slab
restraint for restrained and unrestrained slabs.
Figure 5. Average curvatures computed using surface profile (DipstickTM) data versus
equivalent linear gradient for the diagonal surface profiles of restrained and unrestrained
slabs.
Figure 6. Average slab curvatures based on VW measurements versus equivalent linear
temperature gradient for the restrained and unrestrained slabs (April 2006 data).
Figure 7. Slab curvatures when the temperature gradient is zero.
Figure 8. Slab curvatures based on VW, surface profile (DipstickTM) and temperature and
moisture measurements during a single test day in March in 2005.
Figure 9. Difference in diagonal slab curvatures calculated using VW and surface profile data
( restrained and unrestrained slabs).

30
Figure 1. Locations of sensors in the instrumented test sections.
Instrumented Unrestrained Panels (No Dowel and Tie Bars)
Location of Surface Profile Measurements
Instrumented Restrained Panels (Dowel and Tie Bars)
C Static Strain Gages (VW)
Moisture Sensors (MC)
Thermocouples (TC)
Elevation Rods (ER)
Slab A Slab B Slab C
Transition Slab Slab A Slab B Slab C

31
Figure 2. Slab curvatures calculated using measured temperature and moisture gradients.

32
Figure 3. Average slab curvatures for the restrained and unrestrained slabs using computed
surface profile measurements from the slab diagonals.

33
Figure 4. Average slab curvatures along slab diagonals due to moisture, creep and slab
restraint for restrained and unrestrained slabs.

34
Figure 5. Average curvatures computed using surface profile (Dipstick™) data versus
equivalent linear temperature gradient for the diagonal surface profiles of restrained and
unrestrained slabs.

35
Figure 6. Average slab curvatures based on VW measurements versus equivalent linear
temperature gradient for restrained and unrestrained slabs (April 2006 data).
36
Figure 7. Slab curvatures when the measured temperature gradient is zero.

37
-0.0002
0
0.0002
0.0004
0.0006
0.0008
0:00 6:00 12:00 18:00 0:00
Co
rn
er C
urv
atu
re (
1/m
) .
VW (Unrestrained) Dipstick (Unrestrained)VW (Restrained) Dipstick (Restrained)Temperature Meas. Moisture Meas.Temp.+Moist. Meas.
Figure 8. Slab curvatures based on VW, surface profile (Dipstick™) and temperature and
moisture measurements during a single test day in March 2005.

38
-0.0001
0
0.0001
0.0002
0.0003
0.0004
0.0005
0.0006
0.0007
Aug
-04
Dec
-04
Apr
-05
Aug
-05
Dec
-05
Apr
-06
Aug
-06D
iffe
ren
ce i
n C
orn
er C
urv
atu
re
(1/m
)
Restrained Slabs Unrestrained Slabs
Figure 9. Differences in diagonal slab curvatures calculated using VW and surface profile
data (restrained and unrestrained slabs).