Embed Size (px)
Citation preview

Access Provided by Johns Hopkins University at 10/20/11 7:09PM GMT
© Meharry Medical College Journal of Health Care for the Poor and Underserved 22 (2011): 945–961.
part 2: Original paper
Cancer Screening among racial/ethnic and insurance groups in the United States:
a Comparison of Disparities in 2000 and 2008
Leiyu Shi, DrPH, MBA, MPALydie A. Lebrun, PhD, MPH
Jinsheng Zhu, MecJenna Tsai, EdD
Abstract: Using the National Health Interview Survey, we examined associations among race/ethnicity, insurance coverage, and cancer screening, and assessed changes in the magnitude of disparities over the past decade. Outcomes included recent cervical, breast, and colorectal cancer screening. Rates of colorectal screening increased for all racial/ethnic groups and some insurance groups from 2000 to 2008. However, rates of Pap tests and mammograms remained stagnant, and even decreased for certain groups. Some Hispanic-White and Asian-White disparities in cancer screening were reduced or eliminated over this time period. However, in 2008 Asians continued to have lower odds of Pap tests and Hispanics lower odds of colorectal cancer screening, even after accounting for potential confounders. There were no significant changes in Black-White disparities. The uninsured continued to be at a disadvantage for all three types of cancer screening, relative to the privately insured, as were publicly insured individuals with respect to colorectal cancer screening.
Key words: Race/ethnicity, insurance, preventive care, cancer screening, disparities.
Pervasive differences across racial/ethnic and socioeconomic groups in the United States (U.S.) have been well-documented regarding access to care, quality of care,
and health outcomes. Consequently, one of the nation’s overarching goals for the past decade or so has been to reduce and ultimately eliminate disparities in health and health care.1–4
The provision of primary and preventive health care in particular is important because these services provide opportunities for reducing mortality and morbidity
Leiyu Shi is affiliated with the Johns Hopkins Bloomberg School of Public Health, Department of Health Policy and Management, and with the Johns Hopkins Primary Care Policy Center. Lydie Lebrun was affiliated with the Johns Hopkins Bloomberg School of Public Health Primary Care Policy Center at the time this research was conducted. JinSheng Zhu is affiliated with the Johns Hopkins Bloomberg School of Public Health, Department of Health Policy and Management. Jenna TSai is affiliated with Hungkuang University in Taiwan. Please address correspondence to Leiyu Shi, DrPH, MBA, MPA, Professor, Johns Hopkins University, Bloomberg School of Public Health, Department of Health Policy and Management and Co-Director, Johns Hopkins Primary Care Policy Center, 624 North Broadway, Room 452, Baltimore, MD 21205; (410) 614-6507; [email protected].
946 Disparities in U.S. cancer screening, 2000 and 2008
among vulnerable populations by ensuring early detection of disease and treatment of health problems.5,6 In general, racial/ethnic minority status, lower education, lower income, and lack of health insurance coverage are associated with worse access to primary and preventive care.7–20
Yet despite the abundance of research examining health care disparities at various points in time, there remains a need for comparisons of disparities over time in order to track progress (or lack of progress) during the past decade. The purpose of this study was to examine racial/ethnic and insurance-based differences in preventive care in the U.S. population in 2000 and 2008, in order to examine changes over time. We focused on three cancer-related preventive services, in accordance with recommenda-tions from the U.S. Preventive Services Task Force.6 Other researchers have examined national racial/ethnic and socioeconomic disparities in cancer screening over this time frame, but have done so separately for cervical cancer,21 breast cancer,22–25 and colorectal cancer.26–29 One study examined screening rates for all three cancer types, but considered a shorter time interval (2000–2005) and restricted its analyses to dif-ferences between non-Hispanic Whites and Hispanics.30 In an effort to add to these previous reports, we assessed changes in cancer screening rates simultaneously for all three cancer types and included all racial/ethnic and insurance groups in our analyses. We hypothesized that disparities in cancer screening would be smaller at the end of the decade than at the beginning, owing to concerted federal policy efforts aimed at addressing such inequalities. Results of this study provide evidence regarding racial/ethnic and insurance disparities in access to preventive care in the U.S. after accounting for other socioeconomic and demographic factors.
Methods
Data sources. We analyzed data from the 2000 and 2008 National Health Interview Survey (NHIS).31,32 The NHIS is an in-person interview of households representing the civilian, noninstitutionalized population in the U.S. It is conducted annually by the Centers for Disease Control and Prevention’s National Center for Health Statistics. A complex, stratified sampling design is used to ensure a nationally representative sample. In 2000, information was collected on 32,274 adults 18 years and older; in 2008, the total sample size was 21,781.
Measures. Three cancer screening indicators were selected to represent commonly used measures of preventive care utilization. Each outcome was dichotomized into “recent screening” versus “no recent screening.” The three outcomes included self-reports of: (a) Pap test in the past two years among women ages 21 to 64 years (n513,822 in 2000; 9,113 in 2008), (b) mammogram in the past two years among women ages 50 to 74 years (n55,477 in 2000; 4,236 in 2008), and (c) colonoscopy/sigmoidoscopy/proctoscopy in the past 10 years or fecal occult blood tests (FOBT) using a home test kit in the past year, among adults ages 50 to 74 years (n59,738 in 2000; 7,565 in 2000).
For each type of test, respondents were asked, “Have you ever had a [screening test]?” and those who responded affirmatively were also asked, “When did you have your most recent [screening test]?” The NHIS questionnaire combined colonoscopy, sigmoidoscopy, and proctoscopy into a single question so it was not possible to assess
947Shi, Lebrun, Zhu, and Tsai
rates of screening for the individual procedures. In addition, screening tests were not distinguished from diagnostic tests.
The main independent variables of interest were race/ethnicity and type of insurance coverage. Respondents reported their own race and ethnicity, and categories included non-Hispanic White, non-Hispanic Black, Hispanic, and non-Hispanic Asian. Insurance categories included private insurance, Medicare, Medicaid, and uninsured.
Other covariates in the analyses included sex, age, education level, marital status, employment status, family income, health status, and language proficiency. Age was grouped as follows: 21–44 years versus 45–64 years (for Pap tests), and 50–64 years versus 65–74 years (for mammograms and colorectal cancer screenings). Education level included three categories: less than high school diploma, high school diploma or GED, and college degree or higher. Marital status was dichotomized into married and not married (including widowed, divorced, separated, and never married). Employ-ment status was also dichotomized into employed versus not employed. Family income consisted of four categories: less than $15,000, $15,000–$34,999, $35,000–$54,999, and $55,000 or higher. Respondents’ self-reported general health status was dichotomized into “excellent, very good, or good” versus “fair or poor.” Finally, language proficiency was dichotomized into English proficiency (i.e., respondents who completed the survey in English) versus limited English proficiency (i.e., respondents who completed the survey in Spanish, English and Spanish, or some other language).
Statistical analysis. Responses to any of the questions regarding cancer screen-ing which were originally coded as “refused,” “not ascertained,” or “don’t know” were recoded as “missing” and dropped from the analyses. After recoding, response rates for the cancer screening questions among eligible subsamples for Pap tests were 93.5% in 2000 and 95.5% in 2008; for mammograms, response rates were 93.2% in 2000 and 94.9% in 2008; and for colorectal cancer screening, response rates were 94.2% in 2000 and 95.8% in 2008. Similarly, any participants with missing information for any other covariates resulted in those observations being dropped from the analyses.
Analyses were first conducted with the 2000 NHIS and then the 2008 NHIS in order to identify changes between the two timepoints. For each year separately, we conducted bivariate analyses using designed-based Rao-Scott χ2 tests to compare the distributions of cancer screening measures across racial/ethnic groups and insurance groups. We also conducted similar χ2 tests to compare the age-adjusted rates of cancer screening between 2000 and 2008, for each racial/ethnic and insurance group (adjusted to the projected 2000 U.S. population using direct standardization procedures).33
We then created three-step logistic regression models for each of the three out-comes, analyzing data from 2000 and 2008 separately. To assess the total impact of race/ethnicity on cancer screening, we conducted simple logistic regressions of the main independent variable of interest on each of the outcomes. Next, we assessed the combined impact of both race/ethnicity and insurance coverage in each of the models to see if insurance attenuated any racial/ethnic disparities. Finally, we additionally adjusted for potential confounding factors, including sex, age, education, marital status, employment status, family income, health status, and language. Differences in effect sizes between 2000 and 2008 were also assessed to determine whether the changes in racial/ethnic and insurance-based disparities between the two years were statistically
948 Disparities in U.S. cancer screening, 2000 and 2008
significant. Specifically, for each cancer screening measure, the two data years were pooled and dummy variables for each racial/ethnic group, insurance group, and data year were added as main effects to the models, as well as interaction terms (for each race/ethnicity x year and insurance group x year interaction); statistical significance of interaction terms was assessed, in order to determine whether the associations between race/ethnicity and cancer screening (or insurance group and cancer screening) signifi-cantly differed according to year.
All analyses were conducted using SAS software, version 9.2, and included statistical methods for accounting for the complex sampling design.34 Two-tailed p-values less than or equal to .05 were considered statistically significant.
results
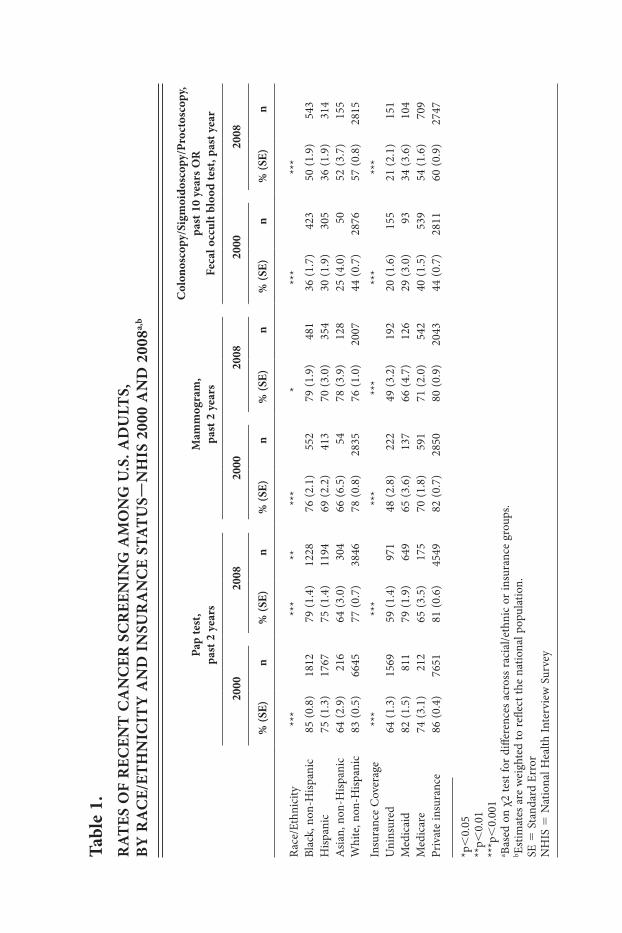
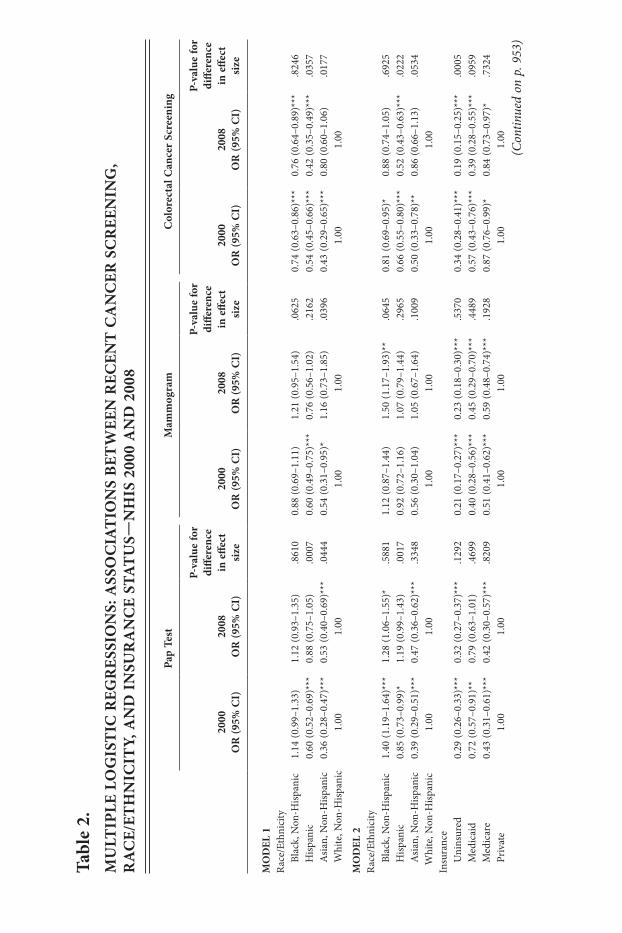
Cancer screening rates, 2000 and 2008. Table 1 shows rates of cancer screening for racial/ethnic and insurance groups in 2000 and 2008. In 2000, the rates of recent Pap tests ranged from 64% (for Asians and the uninsured) to 85–86% (for Blacks and the privately insured). For recent mammograms, the rates ranged from 48% for the unin-sured to 82% for the privately insured. There were much lower rates of colon cancer screening for all racial/ethnic and insurance groups (range: 20–44%).
Significant differences across racial/ethnic groups existed for all three cancer screening types, with non-Hispanic Whites generally having the highest rates of recently being screened. Blacks had similar rates of recent Pap tests and mammograms compared with Whites, but lower rates of colon cancer screening. Hispanics had even lower rates of cancer screening than Blacks, and Asians had the lowest rates of recent screening.
There were also significant differences across insurance groups for all outcomes. In 2000, privately insured adults consistently had the highest rates of recently being screened, and uninsured adults had the lowest rates; rates of screening for Medicare-insured adults and Medicaid-insured adults fell in between.
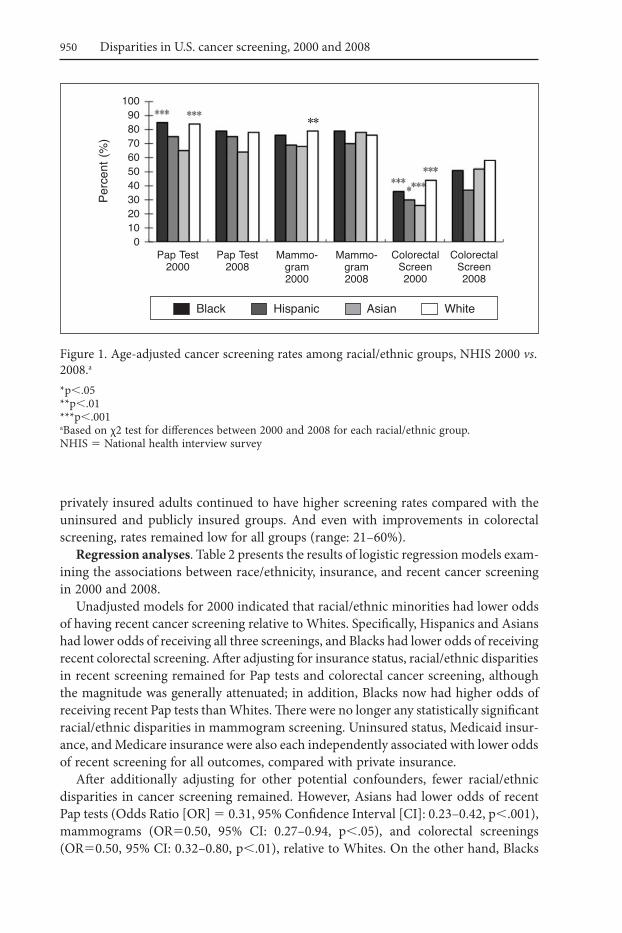
Figures 1 and 2 depict cancer screening rates in 2000 and 2008, and highlight statisti-cally significant increases or decreases in screening over time for each racial/ethnic and insurance group, respectively. Compared with 2000, rates of recent Pap tests in 2008 remained unchanged for Hispanics and Asians, and decreased about 6% for Blacks and Whites (Figure 1). Rates of Pap tests also decreased between the two timepoints for the uninsured, Medicare-insured, and privately insured (Figure 2). There was a slight but statistically significant decrease in recent mammogram screening among Whites between 2000 and 2008 (79% vs. 76%); no other changes over time in mam-mogram screening were significant. Across all racial/ethnic groups, rates of colorectal cancer screening significantly increased, ranging from a 7% increase for Hispanics to a 26% increase for Asians. Colorectal cancer screenings also increased between the two timepoints among Medicare-insured and privately insured respondents (14% and 16% increase, respectively).
Despite these improvements, racial/ethnic and insurance disparities persisted in 2008 (Table 1). Although there were no longer any significant racial/ethnic disparities for mammogram screening, Asians had disproportionately low rates of Pap tests and Hispanics had disproportionately low rates of colon cancer screening. In addition,
tabl
e 1.
r
at
eS O
F r
eCen
t C
an
Cer
SC
ree
nin
g a
MO
ng
U.S
. aD
Ult
S,
BY
ra
Ce/
etH
niC
itY
an
D i
nSU
ra
nC
e St
at
US—
nH
iS 2
000
an
D 2
008a,
b
pap
test
, pa
st 2
yea
rsM
amm
ogra
m,
past
2 y
ears
Col
onos
copy
/Sig
moi
dosc
opy/
proc
tosc
opy,
pa
st 1
0 ye
ars
Or
Fe
cal o
ccul
t blo
od te
st, p
ast y
ear
200
0 2
008
200
0 2
008
200
0 2
008
% (S
e )n
% (S
e )n
% (S
e ) n
% (S
e ) n
% (S
e )n
% (S
e ) n
Rac
e/Et
hnic
ity *
** *
****
***
* *
** *
**Bl
ack,
non
-Hisp
anic
85 (0
.8)
1812
79 (1
.4)
1228
76 (2
.1)
552
79 (1
.9)
481
36 (1
.7)
423
50 (1
.9)
543
Hisp
anic
75 (1
.3)
1767
75 (1
.4)
1194
69 (2
.2)
413
70 (3
.0)
354
30 (1
.9)
305
36 (1
.9)
314
Asia
n, n
on-H
ispan
ic64
(2.9
) 2
1664
(3.0
) 3
0466
(6.5
)
5478
(3.9
) 1
2825
(4.0
)
5052
(3.7
) 1
55W
hite
, non
-Hisp
anic
83 (0
.5)
6645
77 (0
.7)
3846
78 (0
.8)
2835
76 (1
.0)
2007
44 (0
.7)
2876
57 (0
.8)
2815
Insu
ranc
e C
over
age
***
***
***
***
***
***
Uni
nsur
ed64
(1.3
)15
6959
(1.4
) 9
7148
(2.8
) 2
2249
(3.2
) 1
9220
(1.6
) 1
5521
(2.1
) 1
51M
edic
aid
82 (1
.5)
811
79 (1
.9)
649
65 (3
.6)
137
66 (4
.7)
126
29 (3
.0)
93
34 (3
.6)
104
Med
icar
e74
(3.1
) 2
1265
(3.5
) 1
7570
(1.8
) 5
9171
(2.0
) 5
4240
(1.5
) 5
3954
(1.6
) 7
09Pr
ivat
e in
sura
nce
86 (0
.4)
7651
81 (0
.6)
4549
82 (0
.7)
2850
80 (0
.9)
2043
44 (0
.7)
2811
60 (0
.9)
2747
*p,
0.05
**p,
0.01
***p
,0.
001
a Base
d on
χ2
test
for
diffe
renc
es a
cros
s ra
cial
/eth
nic
or in
sura
nce
grou
ps.
b Estim
ates
are
wei
ghte
d to
refle
ct th
e na
tiona
l pop
ulat
ion.
SE
5 S
tand
ard
Erro
rN
HIS
5 N
atio
nal H
ealth
Inte
rvie
w S
urve
y
950 Disparities in U.S. cancer screening, 2000 and 2008
privately insured adults continued to have higher screening rates compared with the uninsured and publicly insured groups. And even with improvements in colorectal screening, rates remained low for all groups (range: 21–60%).
regression analyses. Table 2 presents the results of logistic regression models exam-ining the associations between race/ethnicity, insurance, and recent cancer screening in 2000 and 2008.
Unadjusted models for 2000 indicated that racial/ethnic minorities had lower odds of having recent cancer screening relative to Whites. Specifically, Hispanics and Asians had lower odds of receiving all three screenings, and Blacks had lower odds of receiving recent colorectal screening. After adjusting for insurance status, racial/ethnic disparities in recent screening remained for Pap tests and colorectal cancer screening, although the magnitude was generally attenuated; in addition, Blacks now had higher odds of receiving recent Pap tests than Whites. There were no longer any statistically significant racial/ethnic disparities in mammogram screening. Uninsured status, Medicaid insur-ance, and Medicare insurance were also each independently associated with lower odds of recent screening for all outcomes, compared with private insurance.
After additionally adjusting for other potential confounders, fewer racial/ethnic disparities in cancer screening remained. However, Asians had lower odds of recent Pap tests (Odds Ratio [OR] 5 0.31, 95% Confidence Interval [CI]: 0.23–0.42, p,.001), mammograms (OR50.50, 95% CI: 0.27–0.94, p,.05), and colorectal screenings (OR50.50, 95% CI: 0.32–0.80, p,.01), relative to Whites. On the other hand, Blacks
Figure 1. Age-adjusted cancer screening rates among racial/ethnic groups, NHIS 2000 vs. 2008.a
*p,.05**p,.01***p,.001aBased on χ2 test for differences between 2000 and 2008 for each racial/ethnic group.NHIS 5 National health interview survey
Perc
ent (
%)
Pap Test 2000
Mammo-gram 2000
Colorectal Screen 2000
Black Hispanic Asian White
1009080706050403020100
Pap Test 2008
Mammo-gram 2008
Colorectal Screen 2008
**
951Shi, Lebrun, Zhu, and Tsai
had higher odds of recent Pap tests (OR51.67, 95% CI: 1.41–1.97, p,.001) as well as recent mammograms (OR51.32, 95% CI: 1.01–1.72, p,.05), relative to Whites.
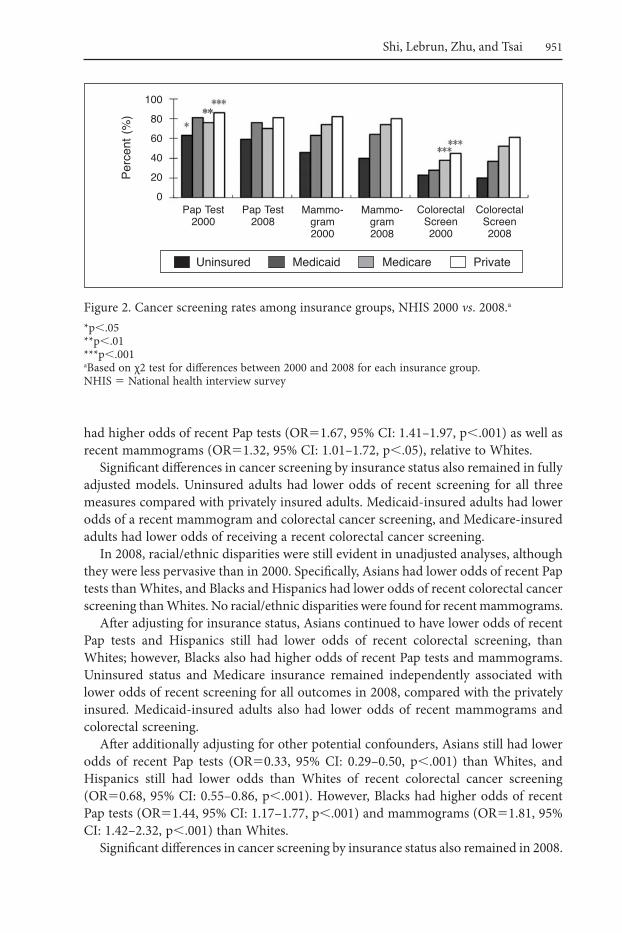
Significant differences in cancer screening by insurance status also remained in fully adjusted models. Uninsured adults had lower odds of recent screening for all three measures compared with privately insured adults. Medicaid-insured adults had lower odds of a recent mammogram and colorectal cancer screening, and Medicare-insured adults had lower odds of receiving a recent colorectal cancer screening.
In 2008, racial/ethnic disparities were still evident in unadjusted analyses, although they were less pervasive than in 2000. Specifically, Asians had lower odds of recent Pap tests than Whites, and Blacks and Hispanics had lower odds of recent colorectal cancer screening than Whites. No racial/ethnic disparities were found for recent mammograms.
After adjusting for insurance status, Asians continued to have lower odds of recent Pap tests and Hispanics still had lower odds of recent colorectal screening, than Whites; however, Blacks also had higher odds of recent Pap tests and mammograms. Uninsured status and Medicare insurance remained independently associated with lower odds of recent screening for all outcomes in 2008, compared with the privately insured. Medicaid-insured adults also had lower odds of recent mammograms and colorectal screening.
After additionally adjusting for other potential confounders, Asians still had lower odds of recent Pap tests (OR50.33, 95% CI: 0.29–0.50, p,.001) than Whites, and Hispanics still had lower odds than Whites of recent colorectal cancer screening (OR50.68, 95% CI: 0.55–0.86, p,.001). However, Blacks had higher odds of recent Pap tests (OR51.44, 95% CI: 1.17–1.77, p,.001) and mammograms (OR51.81, 95% CI: 1.42–2.32, p,.001) than Whites.
Significant differences in cancer screening by insurance status also remained in 2008.
Figure 2. Cancer screening rates among insurance groups, NHIS 2000 vs. 2008.a
*p,.05**p,.01***p,.001aBased on χ2 test for differences between 2000 and 2008 for each insurance group.NHIS 5 National health interview survey
Perc
ent (
%)
Pap Test 2000
Mammo-gram 2000
Colorectal Screen 2000
Uninsured Medicaid Medicare Private
100
80
60
40
20
0Pap Test
2008Mammo-
gram 2008
Colorectal Screen 2008
**
tabl
e 2.
MU
ltip
le l
Og
iSt
iC r
egr
eSSi
On
S: a
SSO
Cia
tiO
nS
Bet
Wee
n r
eCen
t C
an
Cer
SC
ree
nin
g,
ra
Ce/
etH
niC
itY,
an
D i
nSU
ra
nC
e St
at
US—
nH
iS 2
000
an
D 2
008
pap
test
Mam
mog
ram
Col
orec
tal C
ance
r Sc
reen
ing
2000
O
r (9
5% C
i)20
08
Or
(95%
Ci)
p-va
lue
for
diffe
renc
e in
effe
ct
size
2000
O
r (9
5% C
i)20
08
Or
(95%
Ci)
p-va
lue
for
diffe
renc
e in
effe
ct
size
2000
O
r (9
5% C
i)20
08
Or
(95%
Ci)
p-va
lue
for
diffe
renc
e in
effe
ct
size
MO
Del
1R
ace/
Ethn
icity
Bl
ack,
Non
-Hisp
anic
1.14
(0.9
9–1.
33)
1.12
(0.9
3–1.
35)
.861
00.
88 (0
.69–
1.11
)1.
21 (0
.95–
1.54
).0
625
0.74
(0.6
3–0.
86)*
**0.
76 (0
.64–
0.89
)***
.824
6
Hisp
anic
0.60
(0.5
2–0.
69)*
**0.
88 (0
.75–
1.05
).0
007
0.60
(0.4
9–0.
75)*
**0.
76 (0
.56–
1.02
).2
162
0.54
(0.4
5–0.
66)*
**0.
42 (0
.35–
0.49
)***
.035
7
Asia
n, N
on-H
ispan
ic0.
36 (0
.28–
0.47
)***
0.53
(0.4
0–0.
69)*
**.0
444
0.54
(0.3
1–0.
95)*
1.16
(0.7
3–1.
85)
.039
60.
43 (0
.29–
0.65
)***
0.80
(0.6
0–1.
06)
.017
7
Wh i
te, N
on-H
ispan
ic1.
001.
001.
001.
001.
001.
00
MO
Del
2R
ace/
Ethn
icity
Bl
ack,
Non
-Hisp
anic
1.40
(1.1
9–1.
64)*
**1.
28 (1
.06–
1.55
)*.5
881
1.12
(0.8
7–1.
44)
1.50
(1.1
7–1.
93)*
*.0
645
0.81
(0.6
9–0.
95)*
0.88
(0.7
4–1.
05)
.692
5
Hisp
anic
0.85
(0.7
3–0.
99)*
1.19
(0.9
9–1.
43)
.001
70.
92 (0
.72–
1.16
)1.
07 (0
.79–
1.44
).2
965
0.66
(0.5
5–0.
80)*
**0.
52 (0
.43–
0.63
)***
.022
2
Asia
n, N
on-H
ispan
ic0.
39 (0
.29–
0.51
)***
0.47
(0.3
6–0.
62)*
**.3
348
0.56
(0.3
0–1.
04)
1.05
(0.6
7–1.
64)
.100
90.
50 (0
.33–
0.78
)**
0.86
(0.6
6–1.
13)
.053
4
Whi
te, N
on-H
ispan
ic1.
001.
001.
001.
001.
001.
00In
sura
nce
U
nins
ured
0.29
(0.2
6–0.
33)*
**0.
32 (0
.27–
0.37
)***
.129
20.
21 (0
.17–
0.27
)***
0.23
(0.1
8–0.
30)*
**.5
370
0.34
(0.2
8–0.
41)*
**0.
19 (0
.15–
0.25
)***
.000
5
Med
icai
d0.
72 (0
.57–
0.91
)**
0.79
(0.6
3–1.
01)
.469
90.
40 (0
.28–
0.56
)***
0.45
(0.2
9–0.
70)*
**.4
489
0.57
(0.4
3–0.
76)*
**0.
39 (0
.28–
0.55
)***
.095
9
Med
icar
e0.
43 (0
.31–
0.61
)***
0.42
(0.3
0–0.
57)*
**.8
209
0.51
(0.4
1–0.
62)*
**0.
59 (0
.48–
0.74
)***
.192
80.
87 (0
.76–
0.99
)*0.
84 (0
.73–
0.97
)*.7
324
Pr
ivat
e1.
001.
001.
001.
001.
001.
00(C
ontin
ued
on p
. 953
)
MO
Del
3R
ace/
Ethn
icity
Bl
ack,
Non
-Hisp
anic
1.67
(1.4
1–1.
97)*
**1.
44 (1
.17–
1.77
)***
.501
71.
32 (1
.01–
1.72
)*1.
81 (1
.42–
2.32
)***
.133
90.
94 (0
.79–
1.10
)1.
04 (0
.87–
1.24
).5
881
H
ispan
ic0.
99 (0
.80–
1.21
)1.
09 (0
.88–
1.36
).0
031
1.26
(0.9
3–1.
71)
1.19
(0.8
5–1.
66)
.068
60.
92 (0
.71–
1.20
)0.
68 (0
.55–
0.86
)***
.024
0
Asia
n, N
on-H
ispan
ic0.
31(0
.23–
0.42
)***
0.
38 (0
.29–
0.50
)***
.275
70.
50 (0
.27–
0.94
)*0.
88 (0
.55–
1.4)
.049
00.
50 (0
.32–
0.80
)**
0.80
(0.6
0–1.
06)
.086
3
Whi
te, N
on-H
ispan
ic1.
001.
001.
001.
001.
001.
00In
sura
nce
U
nins
ured
0.40
(0.3
5–0.
47)*
**0.
42 (0
.35–
0.49
)***
.066
50.
27 (0
.21–
0.35
)***
0.31
(0.2
2–0.
42)*
**.2
715
0.48
(0.3
9–0.
59)*
**0.
27 (0
.21–
0.36
)***
.000
8
Med
icai
d1.
28 (0
.98–
1.67
)1.
39 (1
.04–
1.86
)*.2
729
0.66
(0.4
4–0.
97)*
0.95
(0.5
8–1.
58)
.447
20.
69 (0
.50–
0.96
)*0.
54 (0
.37–
0.78
)**
.120
6
Med
icar
e0.
91 (0
.61–
1.35
)0.
98 (0
.69–
1.40
).9
665
0.79
(0.6
2–1.
02)
1.01
(0.7
7–1.
33)
.278
20.
70 (0
.59–
0.83
)***
0.76
(0.6
4–0.
91)*
*.7
216
Pr
ivat
e1.
001.
001.
001.
001.
001.
00Se
x
Fem
ale
n/a
n/a
n/a
n/a
0.96
(0.8
7–1.
06)
1.00
(0.8
8–1.
13)
M
ale
n/a
n/a
n/a
n/a
1.00
1.00
Age
21–4
4 y e
ars
1.31
(1.1
6–1.
47)*
**1.
57 (1
.36–
1.81
)***
n/a
n/a
n/a
n/a
45
–64
year
s1.
001.
00n/
an/
an/
an/
a
50–6
4 ye
ars
n/a
n/a
1.18
(0.9
4–1.
47)
0.91
(0.7
3–1.
14)
0.58
(0.5
1–0.
67)*
**0.
61 (0
.52–
0.72
)***
65
–74
y ear
sn/
an/
a1.
001.
001.
001.
00
tabl
e 2.
(con
tinue
d)
pap
test
Mam
mog
ram
Col
orec
tal C
ance
r Sc
reen
ing
2000
O
r (9
5% C
i)20
08
Or
(95%
Ci)
p-va
lue
for
diffe
renc
e in
effe
ct
size
2000
O
r (9
5% C
i)20
08
Or
(95%
Ci)
p-va
lue
for
diffe
renc
e in
effe
ct
size
2000
O
r (9
5% C
i)20
08
Or
(95%
Ci)
p-va
lue
for
diffe
renc
e in
effe
ct
size
(Con
tinue
d on
p. 9
54)
tabl
e 2.
(con
tinue
d)
pap
test
Mam
mog
ram
Col
orec
tal C
ance
r Sc
reen
ing
2000
O
r (9
5% C
i)20
08
Or
(95%
Ci)
p-va
lue
for
diffe
renc
e in
effe
ct
size
2000
O
r (9
5% C
i)20
08
Or
(95%
Ci)
p-va
lue
for
diffe
renc
e in
effe
ct
size
2000
O
r (9
5% C
i)20
08
Or
(95%
Ci)
p-va
lue
for
diffe
renc
e in
effe
ct
size
Educ
atio
n
Less
than
hig
h
scho
ol d
iplo
ma
1.00
(0.8
3–1.
20)
0.98
(0.7
8–1.
22)
0.79
(0.6
4–0.
99)*
0.83
(0.6
1–1.
13)
0.76
(0.6
6–0.
87)*
**0.
76 (0
.62–
0.92
)**
So
me
colle
ge/
Ass
ocia
te d
egre
e1.
36 (1
.20–
1.55
)***
1.39
(1.1
8–1.
63)*
**1.
10 (0
.89–
1.36
)1.
24 (1
.01–
1.52
)*1.
30 (1
.13–
1.50
)***
1.29
(1.1
0–1.
50)*
*
Bach
elor
’s de
gree
or
hig
her
1.99
(1.6
8–2.
35)*
**
1.73
(1.4
2–2.
12)*
**1.
34 (1
.03–
1.74
)*1.
68 (1
.27–
2.21
)***
1.58
(1.3
5–1.
84)*
**1.
71 (1
.44–
2.04
)***
H
igh
scho
ol d
iplo
ma
or G
ED1.
001.
001.
001.
001.
001.
00M
arita
l Sta
tus
N
ot M
arri
ed0.
73 (0
.64–
0.84
)***
0.75
(0.6
5–0.
87)*
**0.
84 (0
.69–
1.01
)0.
70 (0
.58–
0.85
)***
0.84
(0.7
4–0.
95)*
*0.
89 (0
.78–
1.02
)
Mar
ried
1.00
1.00
1.00
1.00
1.00
1.00
Empl
oym
ent S
tatu
s
Not
Em
ploy
ed0.
75 (0
.65–
0.87
)***
0.81
(0.6
9 0.
95)*
0.
98 (0
.80–
1.2)
0.72
(0.5
8–0.
89)*
*1.
44 (1
.26–
1.65
)***
1.24
(1.0
6–1.
45)*
*
Empl
oyed
1.00
1.00
1.00
1.00
1.00
1.00
Fam
ily In
com
e
$55,
000
11.
57 (1
.26–
1.96
)***
1.39
(1.0
7–1.
81)*
2.23
(1.5
3–3.
26)*
**1.
57 (1
.11–
2.24
)*1.
40 (1
.13–
1.75
)**
1.36
(1.0
5–1.
77)*
$3
5,00
0–54
,999
1.23
(0.9
9–1.
53)
1.06
(0.8
2–1.
37)
1.78
(1.2
8–2.
47)*
**1.
08 (0
.77–
1.54
)1.
20 (0
.98–
1.47
)1.
14 (0
.88–
1.48
)
$15,
000–
34,9
990.
95 (0
.78–
1.15
)0.
92 (0
.74–
1.15
)1.
30 (1
.04–
1.63
)*0.
94 (0
.69–
1.28
)1.
11 (0
.91–
1.35
)1.
09 (0
.86–
1.39
)
,$1
5,00
01.
001.
001.
001.
001.
001.
00(C
ontin
ued
on p
. 955
)
tabl
e 2.
(con
tinue
d)
pap
test
Mam
mog
ram
Col
orec
tal C
ance
r Sc
reen
ing
2000
O
r (9
5% C
i)20
08
Or
(95%
Ci)
p-va
lue
for
diffe
renc
e in
effe
ct
size
2000
O
r (9
5% C
i)20
08
Or
(95%
Ci)
p-va
lue
for
diffe
renc
e in
effe
ct
size
2000
O
r (9
5% C
i)20
08
Or
(95%
Ci)
p-va
lue
for
diffe
renc
e in
effe
ct
size
Hea
lth S
tatu
s
Fair
/Poo
r1.
03 (0
.86–
1.24
)0.
77 (0
.63–
0.94
)*1.
23 (1
.01–
1.51
)*0.
89 (0
.70–
1.13
)1.
37 (1
.19–
1.58
)***
1.22
(1.0
4–1.
44)*
Ex
celle
nt/V
ery
G
ood/
Goo
d1.
001.
001.
001.
001.
001.
00La
ngua
ge
L im
ited
Engl
ish
profi
cien
cy0.
96 (0
.75–
1.25
)1.
46 (1
.04–
2.06
)*0.
67 (0
.44–
1.02
)1.
12 (0
.7–1
.80)
0.58
(0.4
1–0.
84)*
*0.
74 (0
.52–
1.05
)
Engl
ish p
rofic
ienc
y1.
001.
001.
001.
001.
001.
00
*p ,
.05
**p,
.01
***p
,.0
01O
R 5
Odd
s R
atio
CI 5
Con
fiden
ce In
terv
alN
HIS
5 N
atio
nal H
ealth
Inte
rvie
w S
urve
y
956 Disparities in U.S. cancer screening, 2000 and 2008
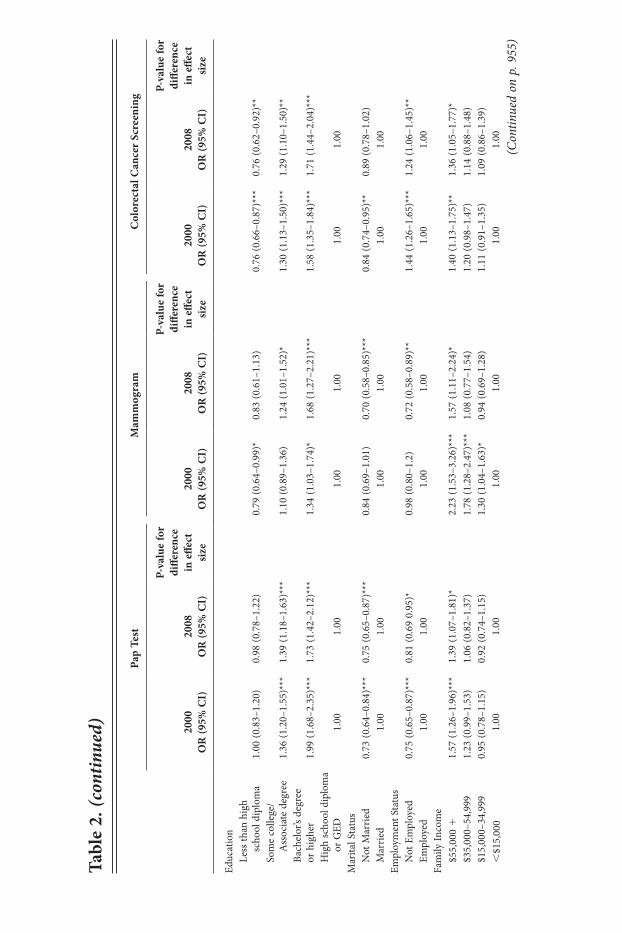
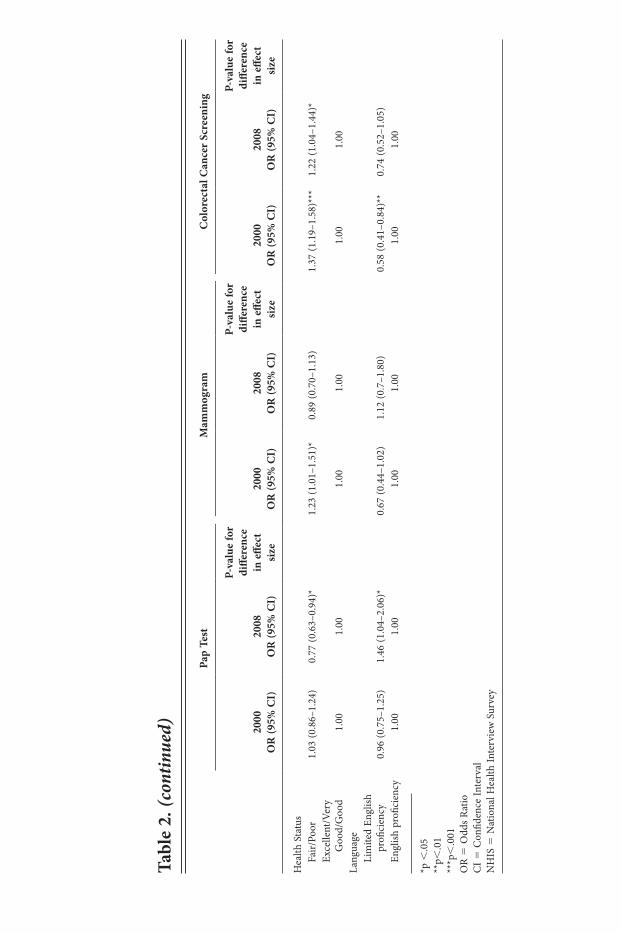
Uninsured adults continued to have lower odds of having a recent Pap test, mammo-gram, and colorectal cancer screening, compared with privately insured individuals. Medicare-insured and Medicaid-insured adults also had lower odds of having recent colorectal cancer screening; however, Medicaid-insured adults had higher odds of recent Pap test, relative to privately insured adults.
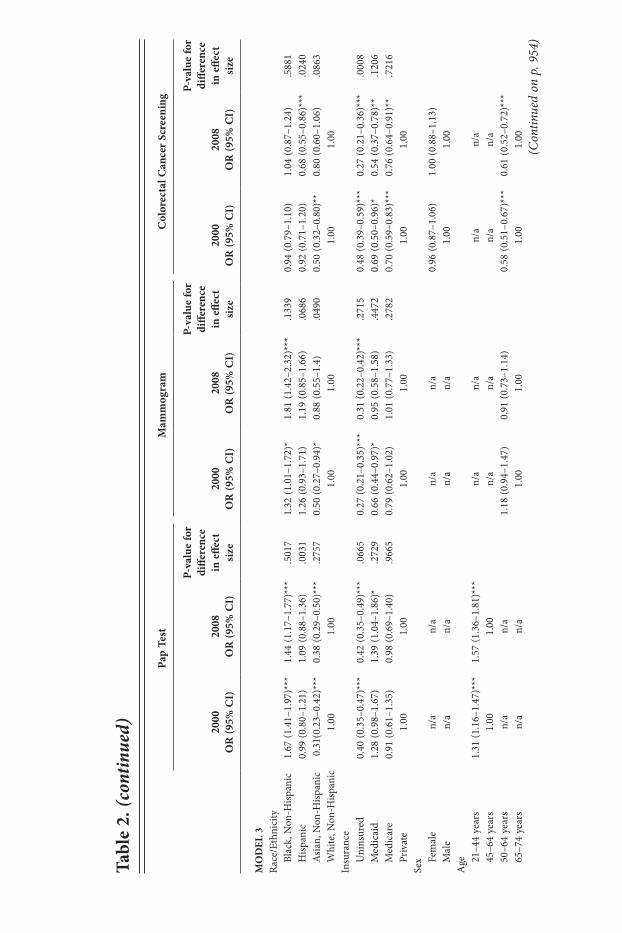
racial/ethnic and insurance disparities in 2000 vs. 2008. The results of effect modification analyses are presented in Table 2 to indicate statistically significant dif-ferences in the effect sizes between 2000 and 2008. First, racial/ethnic disparities in the unadjusted models were compared across the two timepoints: the Hispanic-White and Asian-White disparities were generally reduced or eliminated over this time period (with the exception of the Hispanic-White disparity for colorectal cancer screening, which worsened over time). There were no significant changes in the Black-White disparities for any of the cancer screening measures. In the adjusted models, most of the improvements in racial/ethnic disparities over time were no longer significant, indicating that most of the progress was due to changes in insurance coverage and other sociodemographic characteristics of the racial/ethnic groups. Finally, for colorectal cancer screening, insurance-based disparities between uninsured and privately insured adults worsened over time.
Discussion
Results from this study indicate that rates of colorectal cancer screening have increased for all racial/ethnic groups and some insurance groups from 2000 to 2008, although the rates are still lower than Pap test and mammogram rates. However, rates of Pap tests and mammograms have remained stagnant, and even decreased for certain racial/ethnic and insurance groups. Some Hispanic-White and Asian-White disparities in cancer screening seem to have been reduced or eliminated over this time period, but the disparities between uninsured and privately insured adults have apparently widened.
Disparities persist for certain racial/ethnic groups, even after accounting for other socioeconomic, demographic, health, and insurance factors. In particular, adjusted analyses with 2008 data indicate that Asians continue to have lower odds of Pap tests, relative to Whites. This may be due to poorer access to regular health care; immigrant status and acculturation; language barriers; cultural attitudes and beliefs; lack of culturally appropriate services; or lack of knowledge about cervical cancer, prevention services, or the health care system. Interventions that target these barriers can be expected to improve Pap test rates among Asians. In addition, being married, younger age, higher education and income, insurance coverage, and having a usual source of care have all been found to be associated with higher odds of cervical cancer screening among Asians in the U.S.35–41 The literature also suggests that there may be variations in receipt of recent Pap tests among Asian subgroups, which are currently masked by the use of the all-encompassing “Asian” category. Specifically, Filipinas have the highest rates of Pap tests while Vietnamese and Korean women have the lowest rates; Japanese, Chinese, and South Asian women fall in between the two extremes.39,42
In addition, Hispanics still have lower odds of colorectal cancer screening than Whites. Possible factors explaining Hispanics’ lower rates of colorectal screening include
957Shi, Lebrun, Zhu, and Tsai
economic barriers and poor access to care; lack of physician recommendations and referrals; lack of knowledge, misperceptions, fear and stigma, and fatalistic beliefs; and lower acculturation and language barriers.43–48 Addressing these barriers to care, par-ticularly through patient and health care provider education, could improve colorectal cancer screening rates among Hispanics. Similarly to the findings for Asians, research suggests that disparities in colorectal cancer screening vary by Hispanic national origin group: higher rates have been found among Cubans and Puerto Ricans, and lower rates among Dominicans and Mexicans.45,49
On the other hand, Blacks have higher odds of Pap tests and mammograms than Whites. This finding is consistent with previous studies, which have been document-ing higher rates of cancer screening among Black women for several years.50,51 These increased rates may be due to national efforts to promote cancer screening, such as the National Breast and Cervical Cancer Early Detection Program, as well as increased awareness regarding disparities among health care providers, which lead them to recommend screening to their minority patients. The uninsured continue to be at a disadvantage for all three types of cancer screening, relative to the privately insured, as are publicly insured individuals with respect to colorectal cancer screening.
Health policy efforts over the past decade have been characterized by concerted efforts to reduce health and health care disparities, yet much remains to be done. There appears to be movement in the right direction, as evidenced by the smaller magnitude of disparities across groups in 2008 versus 2000; however, demographic trends suggest that continued intervention is needed to address barriers to preventive care among minority populations and populations lacking private insurance. Vulnerable popula-tions are expected to grow in the U.S. in the coming years: economic hardship across the country is leading to an increase in individuals living in or near poverty, and racial/ethnic minority populations, especially Hispanics, are growing more quickly than the White population. Recent health care reform efforts will certainly help to improve access to care by increasing insurance coverage, however even the newly insured may face barriers given that the demand for primary and preventive services may outpace the supply. In addition, this study’s findings show that while the uninsured face the most difficulties obtaining care, individuals with Medicaid and Medicare also face barriers; thus, expansions to public insurance programs may not automatically improve access.
This study had several limitations. First, we examined differences in the receipt of preventive services at two points in time, but we cannot provide information about why disparities may have increased or decreased. In addition, although our analyses accounted for various potential confounding factors, other covariates were not avail-able due to the secondary nature of the data (e.g., usual source of care, knowledge and beliefs about cancer and cancer screening, immigration-and acculturation-related fac-tors, screening recommendations from health care providers). Prior studies suggest that these factors might help to explain some of the remaining racial/ethnic and insurance disparities in our analyses. Finally, the cancer screening data used in these analyses were based on self-reports from survey respondents, and may be vulnerable to recall bias. The true nature of cancer screening disparities may diverge from those presented here if different racial/ethnic or insurance groups reported their cancer screening behav-iors with different levels of accuracy. Indeed, validation studies have determined that
958 Disparities in U.S. cancer screening, 2000 and 2008
national survey data may overestimate cancer screening utilization and underestimate disparities due to racial/ethnic differences in reporting.52 Despite these limitations, this study documents enduring disparities in access to preventive care based on race/eth-nicity and insurance status. While improvements over the past decade are promising, we hope these findings serve to motivate renewed efforts towards reducing disparities.
acknowledgments
Financial support for this study was provided by the Health Services and Resources Administration (HRSA) of the U.S. Department of Health and Human Services (DHHS). The views expressed in this article are those of the authors and do not necessarily reflect the official policies of DHHS or HRSA, nor does mention of the department or agency imply endorsement by the U.S. government.
notes 1. Smedley B, Stith A, Nelson A, eds. Unequal treatment: confronting racial and ethnic
disparities in health care. Washington, DC: National Academy Press, 2003. 2. U.S. Department of Health and Human Services. Healthy people 2010. Washington,
DC: U.S. Department of Health and Human Services, 2000. 3. Institute of Medicine. Crossing the quality chasm: a new health system for the 21st
century. Washington, DC: National Academy Press, 2001. 4. Agency for Healthcare Research and Quality. National healthcare disparities report,
2008. Rockville, MD: Agency for Healthcare Research and Quality, 2009. Available at: http://www.ahrq.gov/qual/nhdr08/nhdr08.pdf.
5. Starfield B, Shi L, Macinko J. Contribution of primary care to health systems and health. Milbank Q. 2005;83(3):457–502.
6. Agency for Healthcare Research and Quality. Guide to clinical preventive services, 2010–2011: recommendations of the U.S. Preventive Services Task Force. Rockville, MD: Agency for Healthcare Research and Quality, 2010 Aug. Available at: http://www.ahrq.gov/clinic/pocketgd1011/pocketgd1011.pdf.
7. Gavin NI, Adams EK, Hartmann KE, et al. Racial and ethnic disparities in the use of pregnancy-related health care among Medicaid pregnant women. Matern Child Health J. 2004 Sep;8(3):113–26.
8. Hewitt M, Devesa SS, Breen N. Cervical cancer screening among U.S. women: analyses of the 2000 National Health Interview Survey. Prev Med. 2004 Aug;39(2):270–8.
9. Sambamoorthi U, McAlpine DD. Racial, ethnic, socioeconomic, and access disparities in the use of preventive services among women. Prev Med. 2003 Nov;37(5):475–84.
10. McBride DC, Drumm RD, Terry-McElrath Y, et al. Back to basics: the role of health insurance in getting a physical exam. Soc Work Health Care. 2005;42(1):93–106.
11. Fiscella K, Franks P, Doescher MP, et al. Disparities in health care by race, ethnicity, and language among the insured: findings from a national sample. Med Care. 2002 Jan;40(1):52–9.
12. Shi L, Stevens GD. Disparities in access to care and satisfaction among U.S. children: the roles of race/ethnicity and poverty status. Public Health Rep. 2005 Jul–Aug; 120(4):431–41.
13. Ayanian JZ, Weissman JS, Schneider EC, et al. Unmet health needs of uninsured adults in the United States. JAMA. 2000 Oct;284(16):2061–9.
959Shi, Lebrun, Zhu, and Tsai
14. Centers for Disease Control and Prevention/Morbidity and Mortality Weekly Report. Access to health care and preventive services among Hispanics and non-Hispanics—United States, 2001–2002. Centers for Disease Control and Prevention/Morbidity and Mortality Weekly Report. 2004;53(40):937–41.
15. Williams RL, Flocke SA, Stange KC. Race and preventive services delivery among Black patients and White patients seen in primary care. Med Care. 2001 Nov;39(11):1260–7.
16. Hegarty V, Burchett BM, Gold DT, et al. Racial differences in use of cancer prevention services among older Americans. J Am Geriatr Soc. 2000 Jul;48(7):735–40.
17. Selvin E, Brett K. Breast and cervical cancer screening: sociodemographic predictors among White, Black, and Hispanic women. Am J Public Health. 2003 Apr;93(4): 618–23.
18. Solberg LI, Brekke ML, Kottke TE. Are physicians less likely to recommend preven-tive services to low-SES patients? Prev Med. 1997 May–Jun;26(3):350–7.
19. DeVoe JE, Fryer GE, Phillips R, et al. Receipt of preventive care among adults: insur-ance status and usual source of care. Am J Public Health. 2003 May;93(5):786–91.
20. Corbie-Smith G, Flagg E, Doyle JP, et al. Influence of usual source of care on dif-ferences by race/ethnicity in receipt of preventive services. J Gen Intern Med. 2002 Jun;17(6):458–64.
21. Yu TC, Chou CF, Johnson PJ, et al. Persistent disparities in pap test use: assessments and predictions for Asian women in the U.S., 1982–2010. J Immigr Minor Health. 2010 Aug;12(4):445–53.
22. Breen N, Gentleman JF, Schiller JS. Update on mammography trends: comparisons of rates in 2000, 2005, and 2008. Cancer. 2010 Nov 30. [Epub ahead of print.]
23. Sabatino SA, Coates RJ, Uhler RJ, et al. Disparities in mammography use among U.S. women aged 40–64 years, by race, ethnicity, income, and health insurance status, 1993 and 2005. Med Care. 2008 Jul;46(7):692–700.
24. Chagpar AB, Polk HC Jr, McMasters KM. Racial trends in mammography rates: a population-based study. Surgery. 2008 Sep;144(3):467–72.
25. Kim J, Jang SN. Socioeconomic disparities in breast cancer screening among U.S. women: trends from 2000 to 2005. J Prev Med Public Health. 2008 May;41(3):186–94.
26. Trivers KF, Shaw KM, Sabatino SA, et al. Trends in colorectal cancer screening dispari-ties in people aged 50–64 years, 2000–2005. Am J Prev Med. 2008 Sep;35(3):185–93.
27. Shavers VL, Jackson MC, Sheppard VB. Racial/ethnic patterns of uptake of colorectal screening, National Health Interview Survey 2000–2008. J Natl Med Assoc. 2010 Jul; 102(7):621–35.
28. Fenton JJ, Cai Y, Green P, et al. Trends in colorectal cancer testing among Medicare subpopulations. Am J Prev Med. 2008 Sep;35(3):194–202.
29. Doubeni CA, Laiyemo AO, Reed G, et al. Socioeconomic and racial patterns of colorectal cancer screening among Medicare enrollees in 2000 to 2005. Cancer Epi-demiol Biomarkers Prev. 2009 Aug;18(8):2170–5.
30. Zhou J, Enewold L, Peoples GE, et al. Trends in cancer screening among Hispanic and White non-Hispanic women, 2000–2005. J Women’s Health (Larchmt). 2010 Dec; 19(12):2167–74.
31. National Center for Health Statistics. 2000 National Health Interview Survey (NHIS): public use data release/NHIS survey description. Hyattsville, MD: National Center for Health Statistics/Centers for Disease Control and Prevention, 2002 Mar. Available at: ftp://ftp.cdc.gov/pub/Health_Statistics/NCHS/Dataset_Documentation/NHIS/2000 /srvydesc.pdf.
960 Disparities in U.S. cancer screening, 2000 and 2008
32. National Center for Health Statistics. 2008 National Health Interview Survey (NHIS): public use data release/NHIS survey description. Hyattsville, MD: National Center for Health Statistics/Centers for Disease Control and Prevention, 2009 Jun. Available at: http://ftp.cdc.gov/pub/health_statistics/nchs/Dataset_Documentation/NHIS/2008 /srvydesc.pdf.
33. Curtin LR, Klein RJ. Direct standardization (age-adjusted death rates). Healthy People 2000 Stat Notes. 1995 Mar;(6):1–10.
34. SAS Institute. SAS, Version 9.2. Cary, NC: SAS Institute, 2008. 35. Lin MK, Moskowitz JM, Kazinets G, et al. Adherence to pap test guidelines: variation
among Asians in California. Ethn Dis. 2009 Autumn;19(4):425–32.36. Lee HY, Ju E, Vang PD, et al. Breast and cervical cancer screening among Asian Ameri-
can women and Latinas: does race/ethnicity matter? J Womens Health (Larchmt). 2010 Oct;19(10):1877–84.
37. Ho IK, Dinh KT. Cervical cancer screening among Southeast Asian American women. J Immigr Minor Health. 2011 Feb;13(1):49–60.
38. Lee EE, Fogg L, Menon U. Knowledge and beliefs related to cervical cancer and screening among Korean American women. West J Nurs Res. 2008 Dec;30(8):960–74.
39. Pourat N, Kagawa-Singer M, Breen N, et al. Access versus acculturation: identifying modifiable factors to promote cancer screening among Asian American women. Med Care. 2010 Dec;48(12):1088–96.
40. Ma GX, Toubbeh JI, Wang MQ, et al. Factors associated with cervical cancer screening compliance and noncompliance among Chinese, Korean, Vietnamese, and Cambodian women. J National Med Assoc. 2009 Jun;101(6):541–51.
41. Wang JH, Sheppard VB, Schwartz MD, et al. Disparities in cervical cancer screen-ing between Asian American and Non-Hispanic White women. Cancer Epidemiol Biomarkers Prev. 2008 Aug;17(8):1968–73.
42. Kagawa-Singer M, Pourat N, Breen N, et al. Breast and cervical cancer screening rates of subgroups of Asian American women in California. Med Care Res Rev. 2007 Dec;64(6):706–30.
43. Diaz JA, Roberts MB, Goldman RE, et al. Effect of language on colorectal cancer screening among Latinos and non-Latinos. Cancer Epidemiol Biomarkers Prev. 2008 Aug;17(8):2169–73.
44. Johnson-Kozlow M. Colorectal cancer screening of Californian adults of Mexican origin as a function of acculturation. J Immigr Minor Health. 2010 Aug;12(4):454–61.
45. Afable-Munsuz A, Liang SY, Ponce NA, et al. Acculturation and colorectal cancer screening among older Latino adults: differential associations by national origin. J Gen Intern Med. 2009 Aug;24(8):963–70.
46. Powe BD, Cooper DL, Harmond L, et al. Comparing knowledge of colorectal and prostate cancer among African American and Hispanic men. Cancer Nurs. 2009 Sep–Oct;32(5):412–7.
47. Goldman RE, Diaz JA, Kim I. Perspectives of colorectal cancer risk and screening among Dominicans and Puerto Ricans: stigma and misperceptions. Qual Health Res. 2009 Nov;19(11):1559–68.
48. Jandorf L, Ellison J, Villagra C, et al. Understanding the barriers and facilitators of colorectal cancer screening among low income immigrant Hispanics. J Immigr Minor Health. 2010 Aug;12(4):462–9.
49. Jerant AF, Arellanes RE, Franks P. Factors associated with Hispanic/non-Hispanic White colorectal cancer screening disparities. J Gen Intern Med. 2008 Aug;23(8):1241–5.

961Shi, Lebrun, Zhu, and Tsai
50. Makuc DM, Freid VM, Kleinman JC. National trends in the use of preventive health care by women. Am J Public Health. 1989 Jan;79(1):21–26.
51. De Alba I, Ngo-Metzger Q, Sweningson JM, et al. Pap smear use in California: are we closing the racial/ethnic gap? Prev Med. 2005 Jun;40(6):747–55.
52. Rauscher GH, Johnson TP, Cho YI, et al. Accuracy of self-reported cancer-screening histories: a meta-analysis. Cancer Epidemiol Biomarkers Prev. 2008 Apr;17(4):748–57.