Embed Size (px)
Citation preview
Commonwealth of Pennsylvania
Department of Human Services
Children’s Health Insurance Program
HEDIS 2016 Comprehensive Report
FINAL REPORT
Completed on: December 19, 2016
PA CHIP HEDIS 2016 Comprehensive Performance Report Page 2 of 89 Draft Version: 12/19/2016
TABLE OF CONTENTS
INTRODUCTION ............................................................................................................................. 4
ACCESS TO CARE .......................................................................................................................... 6
CHILDREN AND ADOLESCENTS’ ACCESS TO PRIMARY CARE PRACTITIONERS
(CAP) ............................................................................................................................................. 7
ANNUAL DENTAL VISITS (ADV) .......................................................................................... 13
USE OF SERVICES ....................................................................................................................... 15
WELL-CHILD VISITS IN THE FIRST 15 MONTHS OF LIFE (W15) ................................ 18
WELL-CHILD VISITS IN THE 3RD, 4TH, 5TH AND 6TH YEARS OF LIFE (W34) ...... 21
ADOLESCENT WELL-CARE VISITS (AWC) ........................................................................ 23
AMBULATORY CARE (AMB) .................................................................................................. 25
Ambulatory Care – Emergency Department Visits ................................................................. 25
Ambulatory Care - Outpatient Visits .......................................................................................... 30
INPATIENT UTILIZATION - GENERAL HOSPITAL/ACUTE CARE (IPU) ..................... 32
Total Inpatient Utilization - Discharges ..................................................................................... 32
Total Inpatient Utilization – Average Length of Stay .............................................................. 33
IDENTIFICATION OF ALCOHOL AND OTHER DRUG SERVICES (IAD) ...................... 35
MENTAL HEALTH UTILIZATION (MPT) ............................................................................. 37
EFFECTIVENESS OF CARE ....................................................................................................... 40
WEIGHT ASSESSMENT AND COUNSELING FOR NUTRITION AND PHYSICAL
ACTIVITY (WCC) ...................................................................................................................... 43
CHILDHOOD IMMUNIZATION STATUS (CIS) ................................................................... 55
IMMUNIZATIONS FOR ADOLESCENTS (IMA) .................................................................. 68
HUMAN PAPILLOMAVIRUS VACCINE FOR FEMALE ADOLESCENTS (HPV) ........... 72
LEAD SCREENING IN CHILDREN (LSC) ............................................................................. 74
CHLAMYDIA SCREENING IN WOMEN (CHL) .................................................................... 76
APPROPRIATE TESTING FOR CHILDREN WITH PHARYNGITIS (CWP) .................... 78
PA CHIP HEDIS 2016 Comprehensive Performance Report Page 3 of 89 Draft Version: 12/19/2016
APPROPRIATE TREATMENT FOR CHILDREN WITH UPPER RESPIRATORY
INFECTION (URI) ..................................................................................................................... 80
MEDICATION MANAGEMENT FOR PEOPLE WITH ASTHMA (MMA) .......................... 82
FOLLOW-UP CARE FOR CHILDREN PRESCRIBED ADHD MEDICATION (ADD) ....... 84
FOLLOW UP CARE AFTER HOSPITALIZATION FOR MENTAL ILLNESS (FUH) ....... 87
PA CHIP HEDIS 2016 Comprehensive Performance Report Page 4 of 89 Draft Version: 12/19/2016
INTRODUCTION
As part of the Balanced Budget Act of 1997, the United States Congress created Title XXI, the State
Children's Health Insurance Program (CHIP), to address the growing problem of children without
health insurance. SCHIP was designed as a federal/state partnership, similar to Medicaid, with the
goal of expanding health insurance to children whose families earn too much money to be eligible for
Medicaid, but not enough money to purchase private insurance. In 1998, the State legislature
repealed the existing Children’s Health Care Act and enacted Act 1998-68 to establish the current
Pennsylvania (PA) CHIP. On April 16, 2015, President Barack Obama signed into law H.R.2:
Medicare Access and CHIP Reauthorization Act of 2015 which reauthorized and finances CHIP
through Fiscal Year 2017.
PA CHIP is administrated through the Pennsylvania Department of Human Services (DHS). The
program is supported by both state and federal funds. The program provides payment for health care
coverage for eligible children who meet income and other criteria. Approximately 168,000 children are
enrolled in PA CHIP as of November 2016.
In order for a child to qualify for free or subsidized PA CHIP, the family’s income must fall within a
certain range and the child must:
Not be eligible for Medicaid or have any other health insurance
Be under age 19
Be a citizen of the United States, a permanent legal alien or a refugee as determined by the U.S. Immigration and Naturalization Service
Be a Pennsylvania resident
Children enrolled in the PA CHIP program receive comprehensive medically necessary or appropriate
health care benefits, including but not limited to:
Immunizations
Routine check-ups
Prescription drugs
Dental care
Vision and eye care
Maternity care
Mental health benefits
Up to 90 days hospitalization/year
Durable medical equipment
Substance abuse treatment
Partial hospitalization for mental health services
Rehabilitation therapies
Home health care
Hospice and Palliative services
Medically necessary orthodontia
Autism spectrum disorder and related services
PA CHIP HEDIS 2016 Comprehensive Performance Report Page 5 of 89 Draft Version: 12/19/2016
Health Plans in this Report
This report presents data collected from ten health plans (contractors) that provide health care
benefits for PA CHIP enrollees.
Aetna: Aetna Health, Inc.
Capital Blue Cross (CBC): Capital Blue Cross through Keystone Health Plan Central
First Priority Health (NEPA): Blue Cross of Northeastern PA
Geisinger (GHP): Geisinger Health Plan
Highmark HMO: Highmark Inc. through Highmark Blue Cross Blue Shield
Highmark PPO: Highmark Inc. through Highmark Blue Shield
Independence Blue Cross (IBC): Independence Blue Cross
Health Partners (HPHP): Health Partners of Philadelphia, Inc
UnitedHealthcare (UHC): UnitedHealthcare Community Health Plan
UPMC for Kids (UPMC): UPMC Health Plan
Methodology
Information in the Comprehensive Performance Report is drawn primarily from Healthcare
Effectiveness Data and Information Set (HEDIS®1) performance measures, which are a standard set
of performance measures developed by the National Committee for Quality Assurance (NCQATM).
Rates for HEDIS® 2016 measures listed throughout this report reflect services delivered during the
2015 calendar year (CY), or where applicable, in CY 2014. Similarly, HEDIS® 2015 rates reflect
services delivered during CY 2014 and CY 2013, with HEDIS® 2014 rates reflecting services
delivered during CY 2013 and CY 2012 where applicable.
The 2016 PA CHIP HEDIS® Comprehensive Performance Report is organized with performance
measures grouped by HEDIS® domain into three sections: Access to Care, Use of Services and
Effectiveness of Care. For each performance measure, a measure description is provided followed by
results and analyses, including narrative analysis, tables and graphs where applicable. Comparison
tables including Medicaid Managed Care (MMC) National HMO only, MMC Regional (Mid-Atlantic
region: New Jersey, New York, Pennsylvania) HMO only and PA MMC benchmarks are also included
when available. Year over year comparisons and comparisons to benchmarks are made based on
percentage point differences.
1 HEDIS is a registered trademark of the National Committee for Quality Assurance
PA CHIP HEDIS 2016 Comprehensive Performance Report Page 6 of 89 Draft Version: 12/19/2016
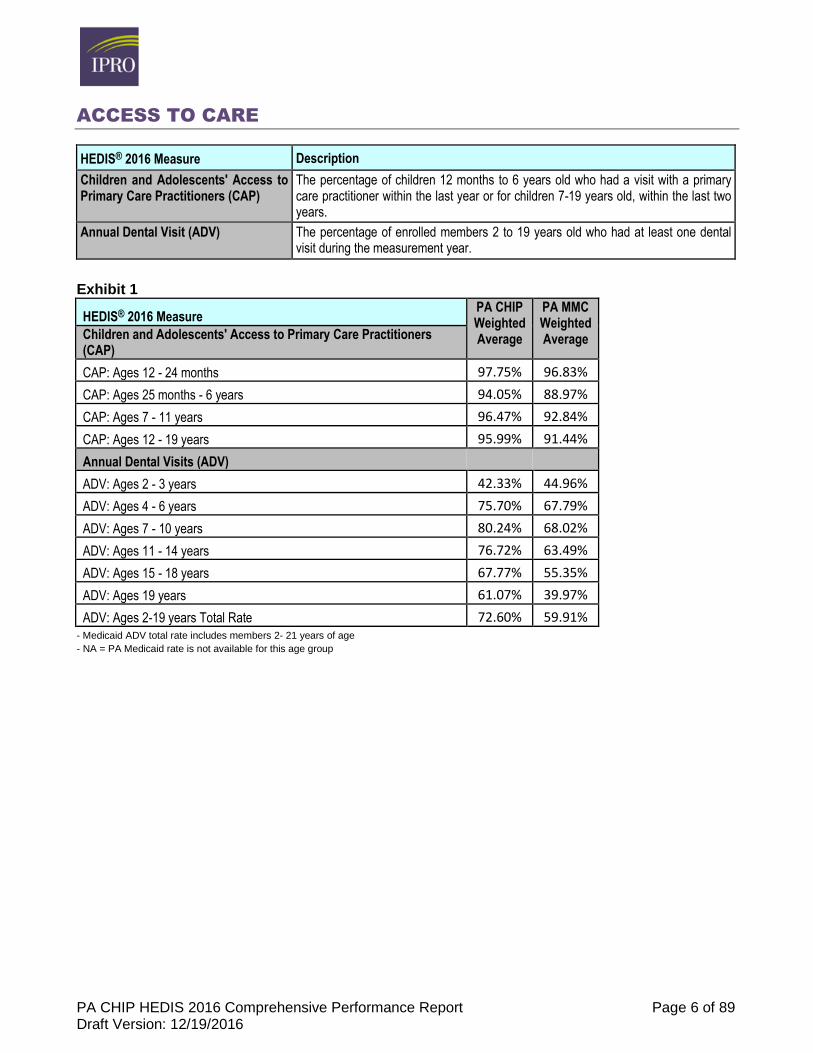
ACCESS TO CARE
HEDIS® 2016 Measure Description
Children and Adolescents' Access to Primary Care Practitioners (CAP)
The percentage of children 12 months to 6 years old who had a visit with a primary care practitioner within the last year or for children 7-19 years old, within the last two years.
Annual Dental Visit (ADV) The percentage of enrolled members 2 to 19 years old who had at least one dental visit during the measurement year.
Exhibit 1
HEDIS® 2016 Measure PA CHIP Weighted Average
PA MMC Weighted Average Children and Adolescents' Access to Primary Care Practitioners
(CAP)
CAP: Ages 12 - 24 months 97.75% 96.83%
CAP: Ages 25 months - 6 years 94.05% 88.97%
CAP: Ages 7 - 11 years 96.47% 92.84%
CAP: Ages 12 - 19 years 95.99% 91.44%
Annual Dental Visits (ADV)
ADV: Ages 2 - 3 years 42.33% 44.96%
ADV: Ages 4 - 6 years 75.70% 67.79%
ADV: Ages 7 - 10 years 80.24% 68.02%
ADV: Ages 11 - 14 years 76.72% 63.49%
ADV: Ages 15 - 18 years 67.77% 55.35%
ADV: Ages 19 years 61.07% 39.97%
ADV: Ages 2-19 years Total Rate 72.60% 59.91% - Medicaid ADV total rate includes members 2- 21 years of age
- NA = PA Medicaid rate is not available for this age group
PA CHIP HEDIS 2016 Comprehensive Performance Report Page 7 of 89 Draft Version: 12/19/2016
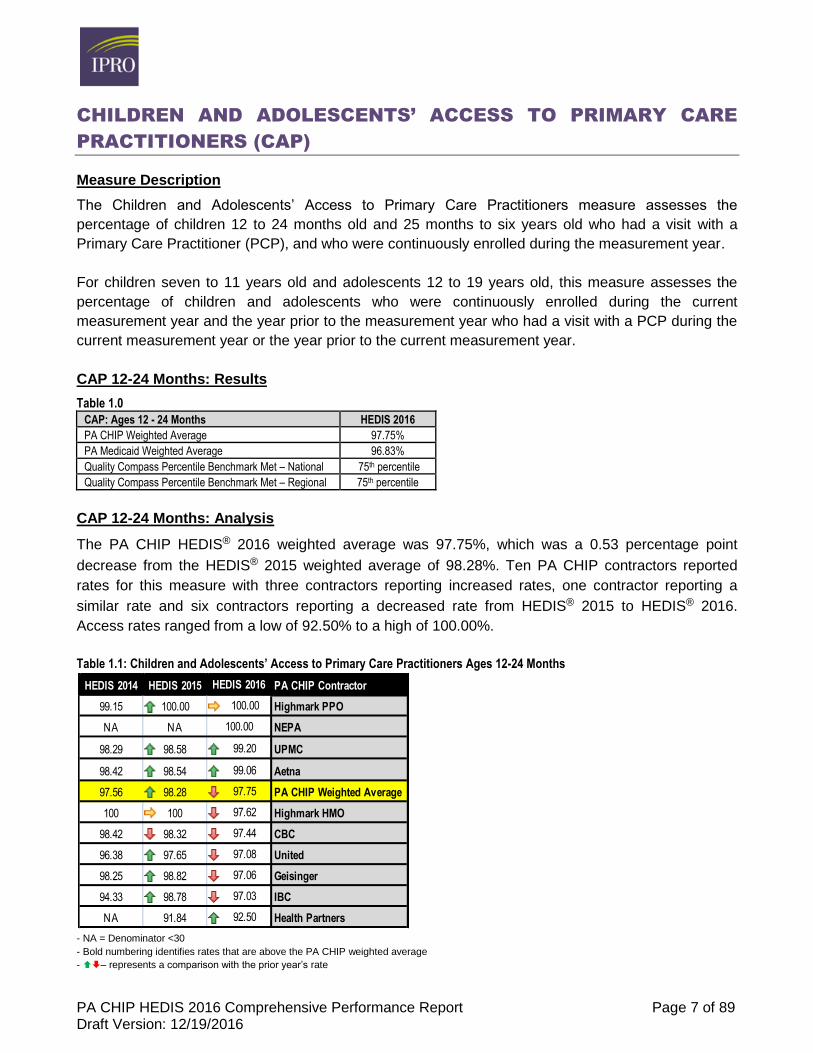
CHILDREN AND ADOLESCENTS’ ACCESS TO PRIMARY CARE
PRACTITIONERS (CAP)
Measure Description
The Children and Adolescents’ Access to Primary Care Practitioners measure assesses the
percentage of children 12 to 24 months old and 25 months to six years old who had a visit with a
Primary Care Practitioner (PCP), and who were continuously enrolled during the measurement year.
For children seven to 11 years old and adolescents 12 to 19 years old, this measure assesses the
percentage of children and adolescents who were continuously enrolled during the current
measurement year and the year prior to the measurement year who had a visit with a PCP during the
current measurement year or the year prior to the current measurement year.
CAP 12-24 Months: Results
Table 1.0
CAP: Ages 12 - 24 Months HEDIS 2016
PA CHIP Weighted Average 97.75%
PA Medicaid Weighted Average 96.83%
Quality Compass Percentile Benchmark Met – National 75th percentile
Quality Compass Percentile Benchmark Met – Regional 75th percentile
CAP 12-24 Months: Analysis
The PA CHIP HEDIS® 2016 weighted average was 97.75%, which was a 0.53 percentage point
decrease from the HEDIS® 2015 weighted average of 98.28%. Ten PA CHIP contractors reported
rates for this measure with three contractors reporting increased rates, one contractor reporting a
similar rate and six contractors reporting a decreased rate from HEDIS® 2015 to HEDIS® 2016.
Access rates ranged from a low of 92.50% to a high of 100.00%.
Table 1.1: Children and Adolescents’ Access to Primary Care Practitioners Ages 12-24 Months
- NA = Denominator <30
- Bold numbering identifies rates that are above the PA CHIP weighted average
- – represents a comparison with the prior year’s rate
HEDIS 2014 HEDIS 2015 HEDIS 2016 PA CHIP Contractor
99.15 100.00 100.00 Highmark PPO
NA NA 100.00 NEPA
98.29 98.58 99.20 UPMC
98.42 98.54 99.06 Aetna
97.56 98.28 97.75 PA CHIP Weighted Average
100 100 97.62 Highmark HMO
98.42 98.32 97.44 CBC
96.38 97.65 97.08 United
98.25 98.82 97.06 Geisinger
94.33 98.78 97.03 IBC
NA 91.84 92.50 Health Partners
PA CHIP HEDIS 2016 Comprehensive Performance Report Page 8 of 89 Draft Version: 12/19/2016
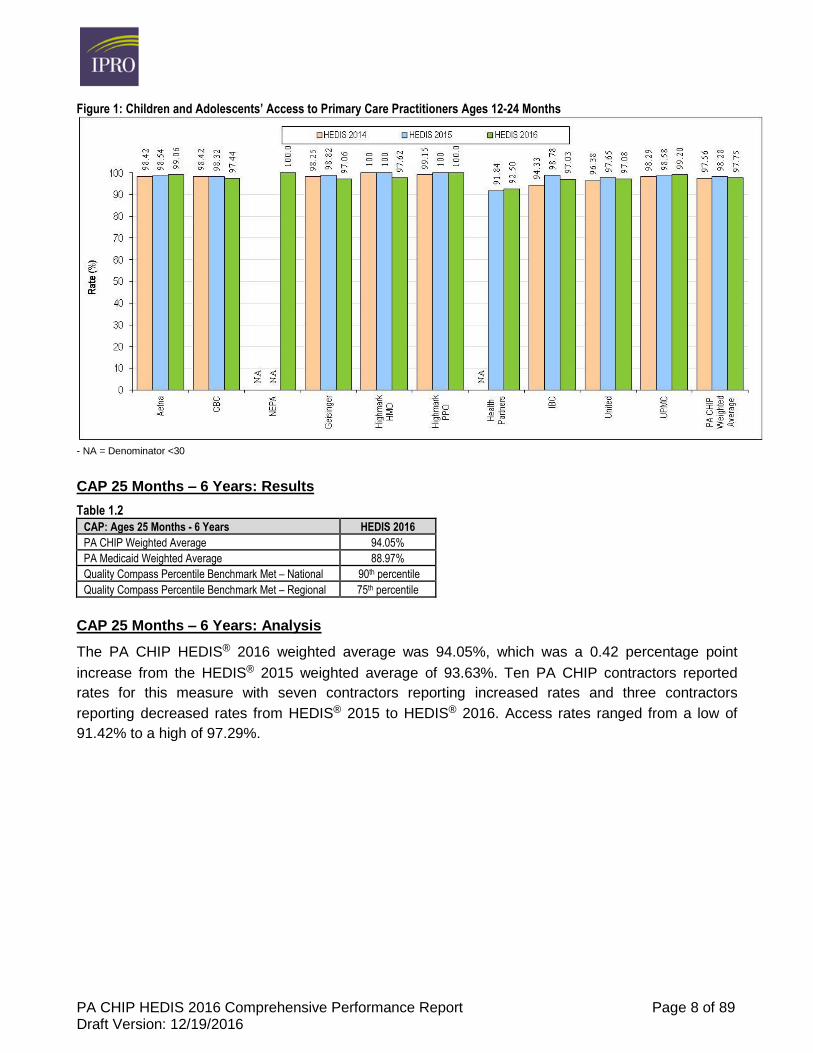
Figure 1: Children and Adolescents’ Access to Primary Care Practitioners Ages 12-24 Months
- NA = Denominator <30
CAP 25 Months – 6 Years: Results
Table 1.2
CAP: Ages 25 Months - 6 Years HEDIS 2016
PA CHIP Weighted Average 94.05%
PA Medicaid Weighted Average 88.97%
Quality Compass Percentile Benchmark Met – National 90th percentile
Quality Compass Percentile Benchmark Met – Regional 75th percentile
CAP 25 Months – 6 Years: Analysis
The PA CHIP HEDIS® 2016 weighted average was 94.05%, which was a 0.42 percentage point
increase from the HEDIS® 2015 weighted average of 93.63%. Ten PA CHIP contractors reported
rates for this measure with seven contractors reporting increased rates and three contractors
reporting decreased rates from HEDIS® 2015 to HEDIS® 2016. Access rates ranged from a low of
91.42% to a high of 97.29%.
PA CHIP HEDIS 2016 Comprehensive Performance Report Page 9 of 89 Draft Version: 12/19/2016
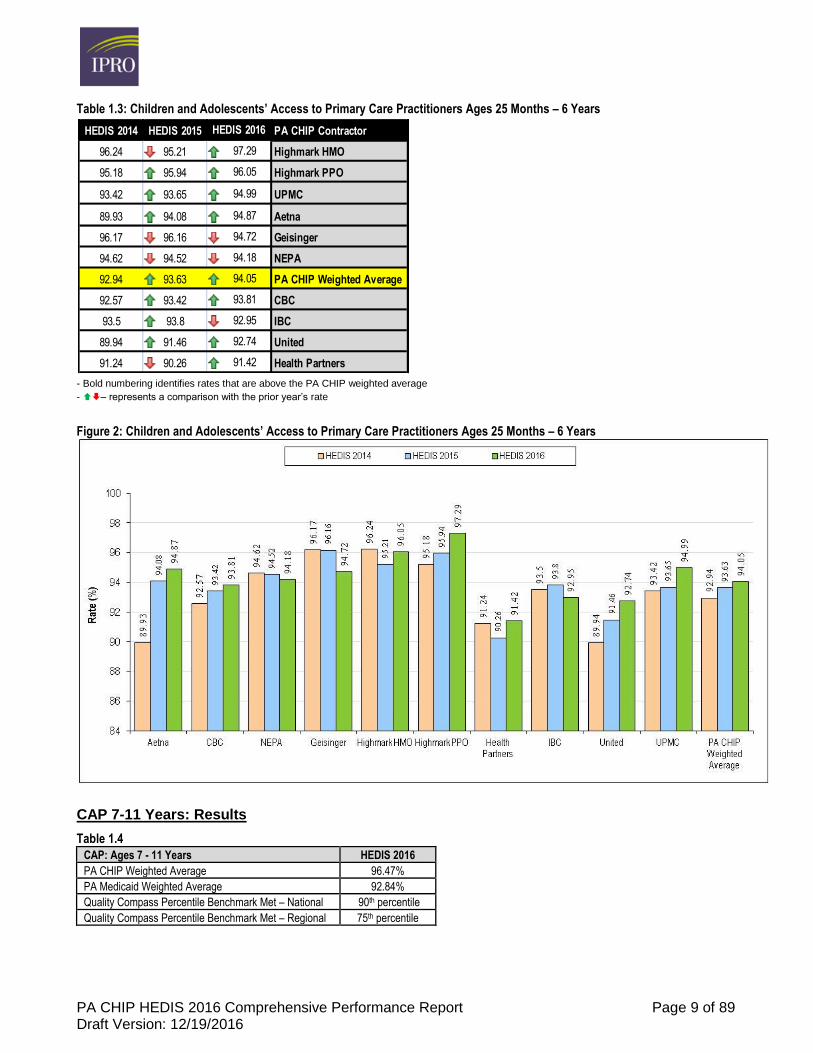
Table 1.3: Children and Adolescents’ Access to Primary Care Practitioners Ages 25 Months – 6 Years
- Bold numbering identifies rates that are above the PA CHIP weighted average
- – represents a comparison with the prior year’s rate
Figure 2: Children and Adolescents’ Access to Primary Care Practitioners Ages 25 Months – 6 Years
CAP 7-11 Years: Results
Table 1.4
CAP: Ages 7 - 11 Years HEDIS 2016
PA CHIP Weighted Average 96.47%
PA Medicaid Weighted Average 92.84%
Quality Compass Percentile Benchmark Met – National 90th percentile
Quality Compass Percentile Benchmark Met – Regional 75th percentile
HEDIS 2014 HEDIS 2015 HEDIS 2016 PA CHIP Contractor
96.24 95.21 97.29 Highmark HMO
95.18 95.94 96.05 Highmark PPO
93.42 93.65 94.99 UPMC
89.93 94.08 94.87 Aetna
96.17 96.16 94.72 Geisinger
94.62 94.52 94.18 NEPA
92.94 93.63 94.05 PA CHIP Weighted Average
92.57 93.42 93.81 CBC
93.5 93.8 92.95 IBC
89.94 91.46 92.74 United
91.24 90.26 91.42 Health Partners
PA CHIP HEDIS 2016 Comprehensive Performance Report Page 10 of 89 Draft Version: 12/19/2016
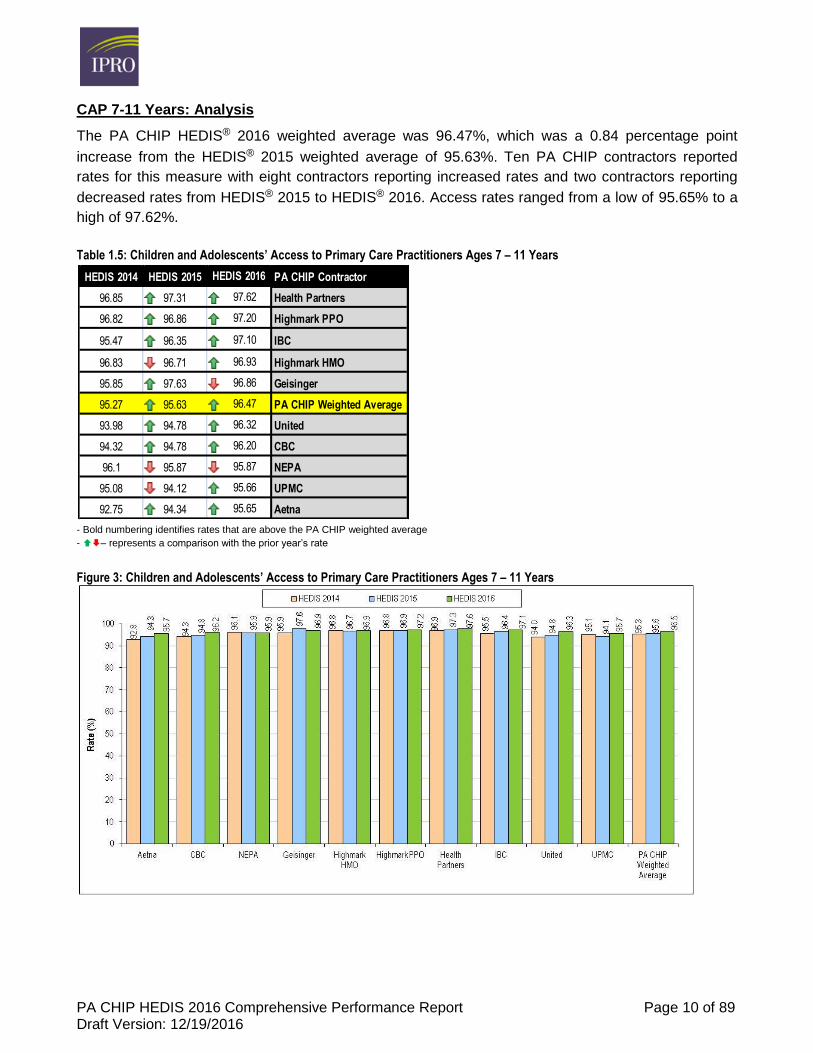
CAP 7-11 Years: Analysis
The PA CHIP HEDIS® 2016 weighted average was 96.47%, which was a 0.84 percentage point
increase from the HEDIS® 2015 weighted average of 95.63%. Ten PA CHIP contractors reported
rates for this measure with eight contractors reporting increased rates and two contractors reporting
decreased rates from HEDIS® 2015 to HEDIS® 2016. Access rates ranged from a low of 95.65% to a
high of 97.62%.
Table 1.5: Children and Adolescents’ Access to Primary Care Practitioners Ages 7 – 11 Years
- Bold numbering identifies rates that are above the PA CHIP weighted average
- – represents a comparison with the prior year’s rate
Figure 3: Children and Adolescents’ Access to Primary Care Practitioners Ages 7 – 11 Years
HEDIS 2014 HEDIS 2015 HEDIS 2016 PA CHIP Contractor
96.85 97.31 97.62 Health Partners
96.82 96.86 97.20 Highmark PPO
95.47 96.35 97.10 IBC
96.83 96.71 96.93 Highmark HMO
95.85 97.63 96.86 Geisinger
95.27 95.63 96.47 PA CHIP Weighted Average
93.98 94.78 96.32 United
94.32 94.78 96.20 CBC
96.1 95.87 95.87 NEPA
95.08 94.12 95.66 UPMC
92.75 94.34 95.65 Aetna
PA CHIP HEDIS 2016 Comprehensive Performance Report Page 11 of 89 Draft Version: 12/19/2016
CAP 12-19 Years: Results
Table 1.6
CAP: Ages 12 - 19 Years HEDIS 2016
PA CHIP Weighted Average 95.99%
PA Medicaid Weighted Average 91.44%
Quality Compass Percentile Benchmark Met – National 95th percentile
Quality Compass Percentile Benchmark Met – Regional 95th percentile
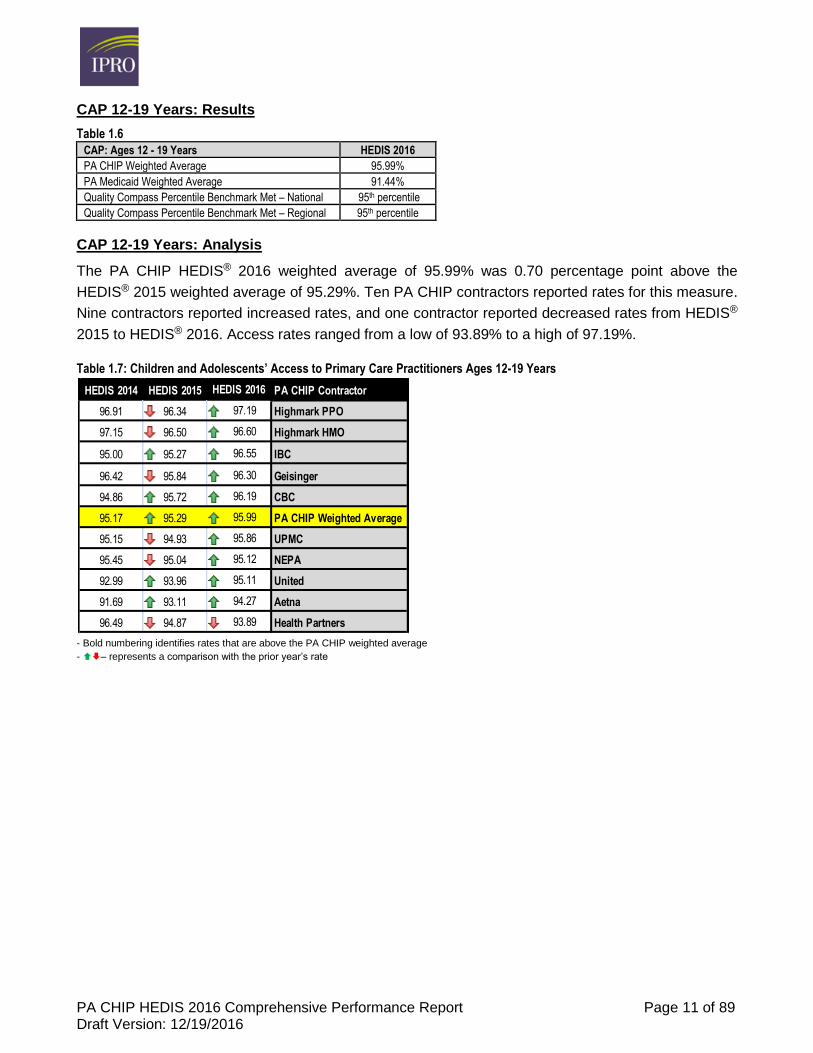
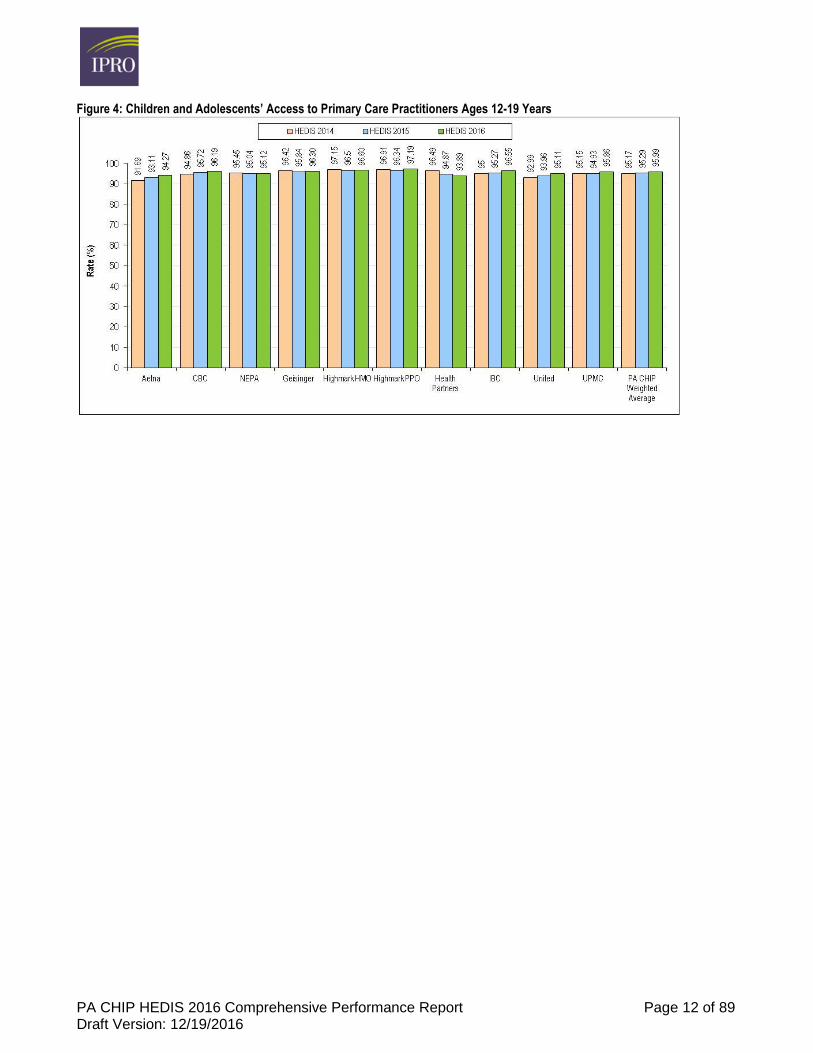
CAP 12-19 Years: Analysis
The PA CHIP HEDIS® 2016 weighted average of 95.99% was 0.70 percentage point above the
HEDIS® 2015 weighted average of 95.29%. Ten PA CHIP contractors reported rates for this measure.
Nine contractors reported increased rates, and one contractor reported decreased rates from HEDIS®
2015 to HEDIS® 2016. Access rates ranged from a low of 93.89% to a high of 97.19%.
Table 1.7: Children and Adolescents’ Access to Primary Care Practitioners Ages 12-19 Years
- Bold numbering identifies rates that are above the PA CHIP weighted average
- – represents a comparison with the prior year’s rate
HEDIS 2014 HEDIS 2015 HEDIS 2016 PA CHIP Contractor
96.91 96.34 97.19 Highmark PPO
97.15 96.50 96.60 Highmark HMO
95.00 95.27 96.55 IBC
96.42 95.84 96.30 Geisinger
94.86 95.72 96.19 CBC
95.17 95.29 95.99 PA CHIP Weighted Average
95.15 94.93 95.86 UPMC
95.45 95.04 95.12 NEPA
92.99 93.96 95.11 United
91.69 93.11 94.27 Aetna
96.49 94.87 93.89 Health Partners
PA CHIP HEDIS 2016 Comprehensive Performance Report Page 12 of 89 Draft Version: 12/19/2016
Figure 4: Children and Adolescents’ Access to Primary Care Practitioners Ages 12-19 Years
PA CHIP HEDIS 2016 Comprehensive Performance Report Page 13 of 89 Draft Version: 12/19/2016
ANNUAL DENTAL VISITS (ADV)
Measure Description
This measure assesses the percentage of children and adolescents two to 19 years old who were
continuously enrolled during the measurement year, and who had a dental visit during the
measurement year.
ADV: Results
Table 1.8
ADV: Ages 2-19 Years Total Rate HEDIS 2016
PA CHIP Weighted Average 72.60%
PA Medicaid Weighted Average 59.91%
Quality Compass Percentile Benchmark Met – National 95th percentile
Quality Compass Percentile Benchmark Met – Regional 95th percentile
- Medicaid rate and benchmarks include members 2-21 years old
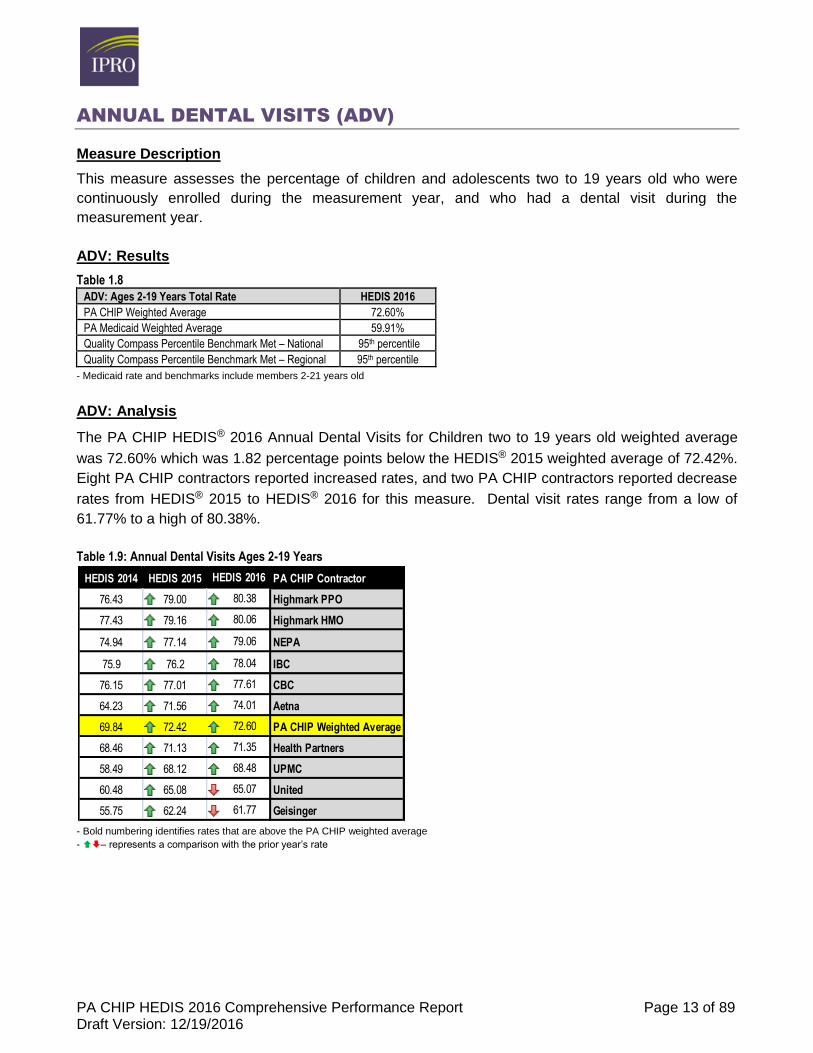
ADV: Analysis
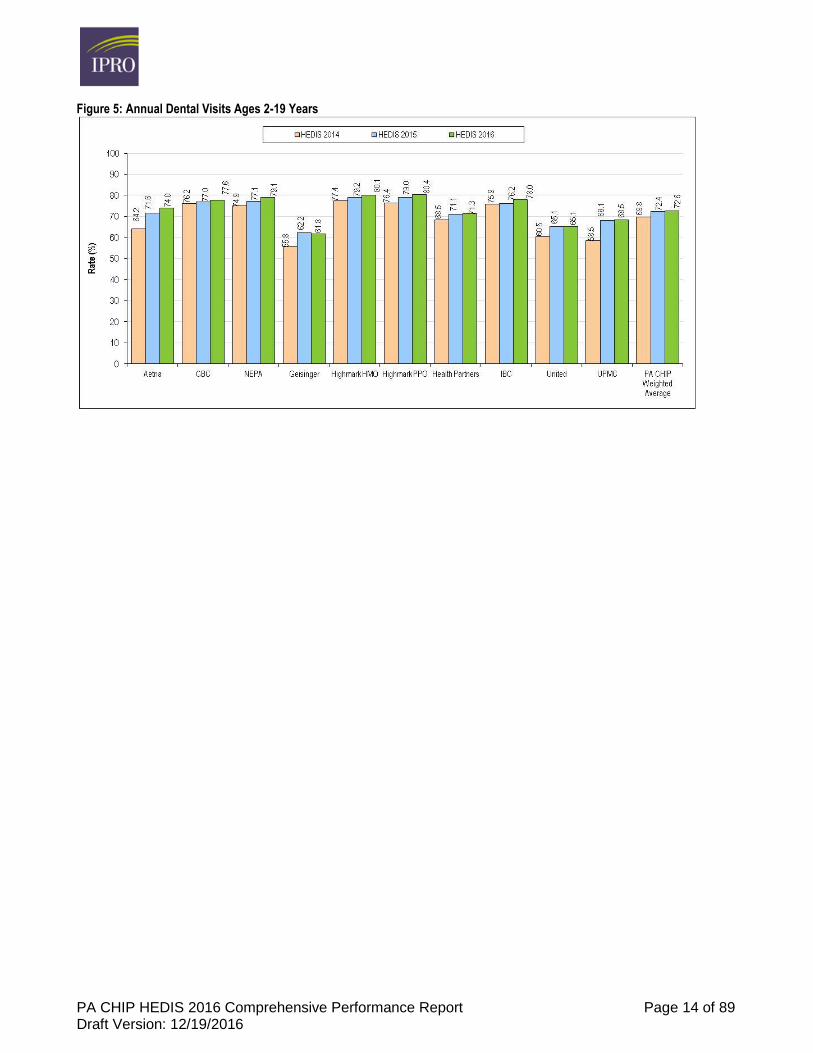
The PA CHIP HEDIS® 2016 Annual Dental Visits for Children two to 19 years old weighted average
was 72.60% which was 1.82 percentage points below the HEDIS® 2015 weighted average of 72.42%.
Eight PA CHIP contractors reported increased rates, and two PA CHIP contractors reported decrease
rates from HEDIS® 2015 to HEDIS® 2016 for this measure. Dental visit rates range from a low of
61.77% to a high of 80.38%.
Table 1.9: Annual Dental Visits Ages 2-19 Years
- Bold numbering identifies rates that are above the PA CHIP weighted average
- – represents a comparison with the prior year’s rate
HEDIS 2014 HEDIS 2015 HEDIS 2016 PA CHIP Contractor
76.43 79.00 80.38 Highmark PPO
77.43 79.16 80.06 Highmark HMO
74.94 77.14 79.06 NEPA
75.9 76.2 78.04 IBC
76.15 77.01 77.61 CBC
64.23 71.56 74.01 Aetna
69.84 72.42 72.60 PA CHIP Weighted Average
68.46 71.13 71.35 Health Partners
58.49 68.12 68.48 UPMC
60.48 65.08 65.07 United
55.75 62.24 61.77 Geisinger
PA CHIP HEDIS 2016 Comprehensive Performance Report Page 14 of 89 Draft Version: 12/19/2016
Figure 5: Annual Dental Visits Ages 2-19 Years
PA CHIP HEDIS 2016 Comprehensive Performance Report Page 15 of 89 Draft Version: 12/19/2016
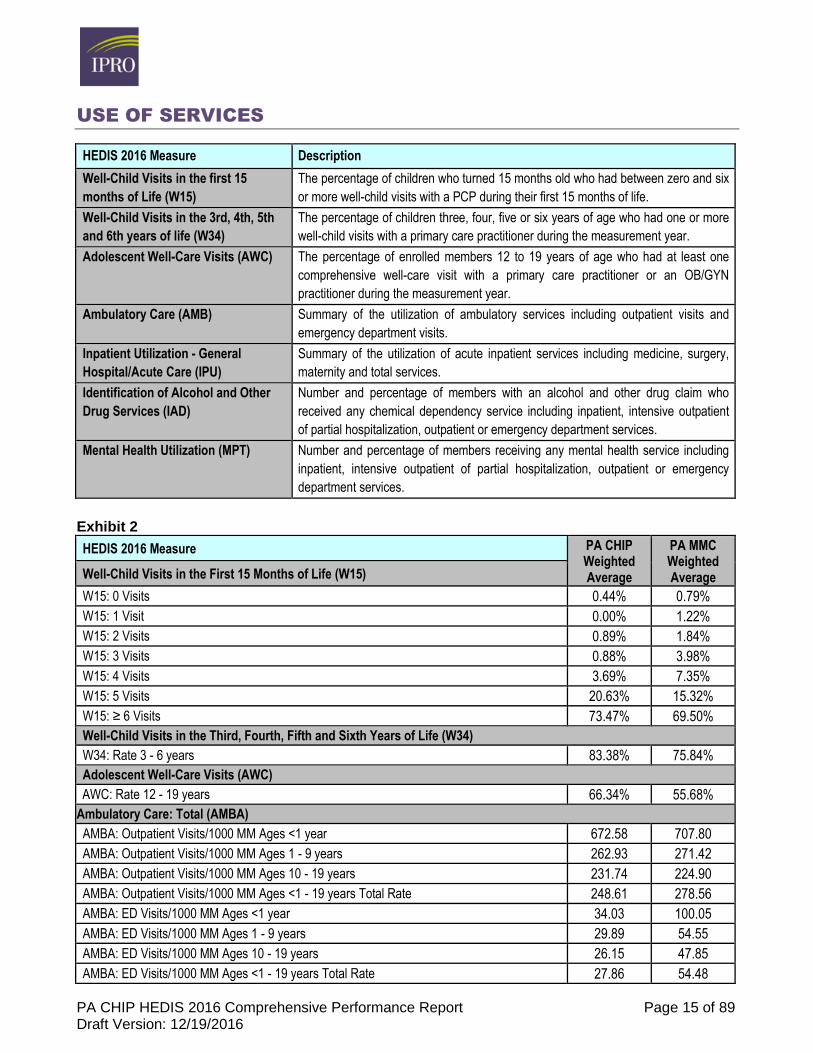
USE OF SERVICES
HEDIS 2016 Measure Description
Well-Child Visits in the first 15
months of Life (W15)
The percentage of children who turned 15 months old who had between zero and six
or more well-child visits with a PCP during their first 15 months of life.
Well-Child Visits in the 3rd, 4th, 5th
and 6th years of life (W34)
The percentage of children three, four, five or six years of age who had one or more
well-child visits with a primary care practitioner during the measurement year.
Adolescent Well-Care Visits (AWC) The percentage of enrolled members 12 to 19 years of age who had at least one
comprehensive well-care visit with a primary care practitioner or an OB/GYN
practitioner during the measurement year.
Ambulatory Care (AMB) Summary of the utilization of ambulatory services including outpatient visits and
emergency department visits.
Inpatient Utilization - General
Hospital/Acute Care (IPU)
Summary of the utilization of acute inpatient services including medicine, surgery,
maternity and total services.
Identification of Alcohol and Other
Drug Services (IAD)
Number and percentage of members with an alcohol and other drug claim who
received any chemical dependency service including inpatient, intensive outpatient
of partial hospitalization, outpatient or emergency department services.
Mental Health Utilization (MPT) Number and percentage of members receiving any mental health service including
inpatient, intensive outpatient of partial hospitalization, outpatient or emergency
department services.
Exhibit 2
HEDIS 2016 Measure PA CHIP Weighted Average
PA MMC Weighted Average Well-Child Visits in the First 15 Months of Life (W15)
W15: 0 Visits 0.44% 0.79%
W15: 1 Visit 0.00% 1.22%
W15: 2 Visits 0.89% 1.84%
W15: 3 Visits 0.88% 3.98%
W15: 4 Visits 3.69% 7.35%
W15: 5 Visits 20.63% 15.32%
W15: ≥ 6 Visits 73.47% 69.50%
Well-Child Visits in the Third, Fourth, Fifth and Sixth Years of Life (W34)
W34: Rate 3 - 6 years 83.38% 75.84%
Adolescent Well-Care Visits (AWC)
AWC: Rate 12 - 19 years 66.34% 55.68%
Ambulatory Care: Total (AMBA)
AMBA: Outpatient Visits/1000 MM Ages <1 year 672.58 707.80
AMBA: Outpatient Visits/1000 MM Ages 1 - 9 years 262.93 271.42
AMBA: Outpatient Visits/1000 MM Ages 10 - 19 years 231.74 224.90
AMBA: Outpatient Visits/1000 MM Ages <1 - 19 years Total Rate 248.61 278.56
AMBA: ED Visits/1000 MM Ages <1 year 34.03 100.05
AMBA: ED Visits/1000 MM Ages 1 - 9 years 29.89 54.55
AMBA: ED Visits/1000 MM Ages 10 - 19 years 26.15 47.85
AMBA: ED Visits/1000 MM Ages <1 - 19 years Total Rate 27.86 54.48
PA CHIP HEDIS 2016 Comprehensive Performance Report Page 16 of 89 Draft Version: 12/19/2016
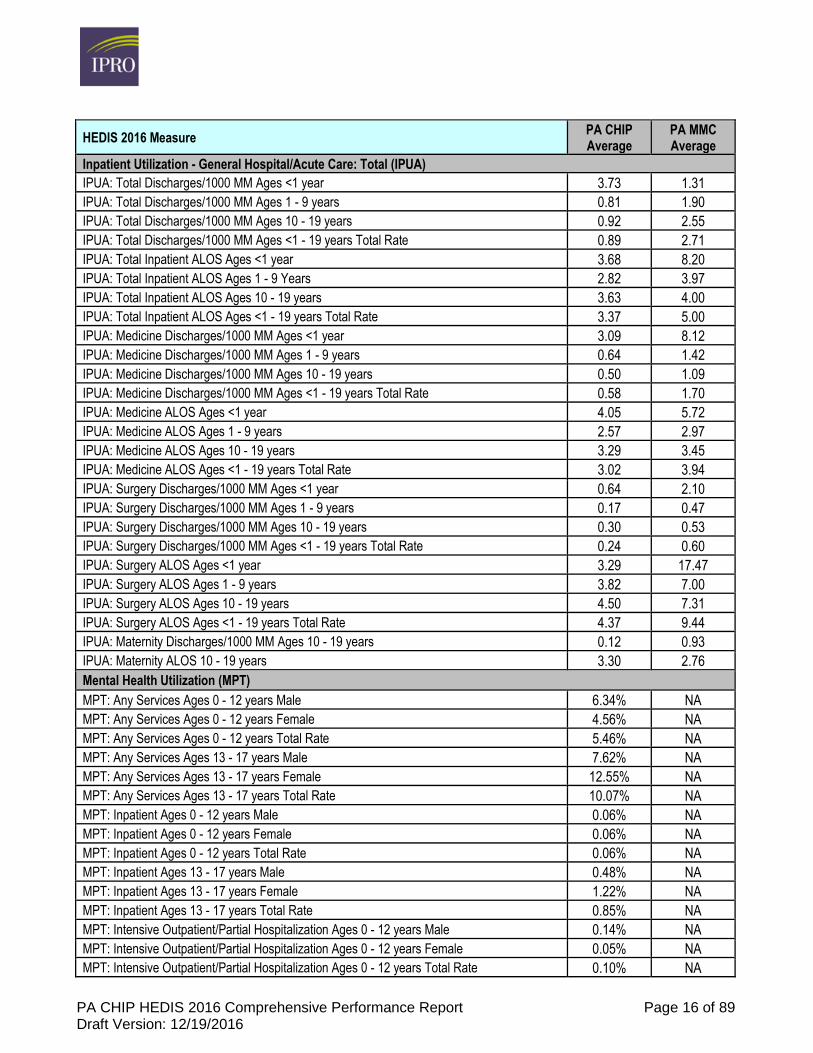
HEDIS 2016 Measure PA CHIP Average
PA MMC Average
Inpatient Utilization - General Hospital/Acute Care: Total (IPUA)
IPUA: Total Discharges/1000 MM Ages <1 year 3.73 1.31
IPUA: Total Discharges/1000 MM Ages 1 - 9 years 0.81 1.90
IPUA: Total Discharges/1000 MM Ages 10 - 19 years 0.92 2.55
IPUA: Total Discharges/1000 MM Ages <1 - 19 years Total Rate 0.89 2.71
IPUA: Total Inpatient ALOS Ages <1 year 3.68 8.20
IPUA: Total Inpatient ALOS Ages 1 - 9 Years 2.82 3.97
IPUA: Total Inpatient ALOS Ages 10 - 19 years 3.63 4.00
IPUA: Total Inpatient ALOS Ages <1 - 19 years Total Rate 3.37 5.00
IPUA: Medicine Discharges/1000 MM Ages <1 year 3.09 8.12
IPUA: Medicine Discharges/1000 MM Ages 1 - 9 years 0.64 1.42
IPUA: Medicine Discharges/1000 MM Ages 10 - 19 years 0.50 1.09
IPUA: Medicine Discharges/1000 MM Ages <1 - 19 years Total Rate 0.58 1.70
IPUA: Medicine ALOS Ages <1 year 4.05 5.72
IPUA: Medicine ALOS Ages 1 - 9 years 2.57 2.97
IPUA: Medicine ALOS Ages 10 - 19 years 3.29 3.45
IPUA: Medicine ALOS Ages <1 - 19 years Total Rate 3.02 3.94
IPUA: Surgery Discharges/1000 MM Ages <1 year 0.64 2.10
IPUA: Surgery Discharges/1000 MM Ages 1 - 9 years 0.17 0.47
IPUA: Surgery Discharges/1000 MM Ages 10 - 19 years 0.30 0.53
IPUA: Surgery Discharges/1000 MM Ages <1 - 19 years Total Rate 0.24 0.60
IPUA: Surgery ALOS Ages <1 year 3.29 17.47
IPUA: Surgery ALOS Ages 1 - 9 years 3.82 7.00
IPUA: Surgery ALOS Ages 10 - 19 years 4.50 7.31
IPUA: Surgery ALOS Ages <1 - 19 years Total Rate 4.37 9.44
IPUA: Maternity Discharges/1000 MM Ages 10 - 19 years 0.12 0.93
IPUA: Maternity ALOS 10 - 19 years 3.30 2.76
Mental Health Utilization (MPT)
MPT: Any Services Ages 0 - 12 years Male 6.34% NA
MPT: Any Services Ages 0 - 12 years Female 4.56% NA
MPT: Any Services Ages 0 - 12 years Total Rate 5.46% NA
MPT: Any Services Ages 13 - 17 years Male 7.62% NA
MPT: Any Services Ages 13 - 17 years Female 12.55% NA
MPT: Any Services Ages 13 - 17 years Total Rate 10.07% NA
MPT: Inpatient Ages 0 - 12 years Male 0.06% NA
MPT: Inpatient Ages 0 - 12 years Female 0.06% NA
MPT: Inpatient Ages 0 - 12 years Total Rate 0.06% NA
MPT: Inpatient Ages 13 - 17 years Male 0.48% NA
MPT: Inpatient Ages 13 - 17 years Female 1.22% NA
MPT: Inpatient Ages 13 - 17 years Total Rate 0.85% NA
MPT: Intensive Outpatient/Partial Hospitalization Ages 0 - 12 years Male 0.14% NA
MPT: Intensive Outpatient/Partial Hospitalization Ages 0 - 12 years Female 0.05% NA
MPT: Intensive Outpatient/Partial Hospitalization Ages 0 - 12 years Total Rate 0.10% NA
PA CHIP HEDIS 2016 Comprehensive Performance Report Page 17 of 89 Draft Version: 12/19/2016
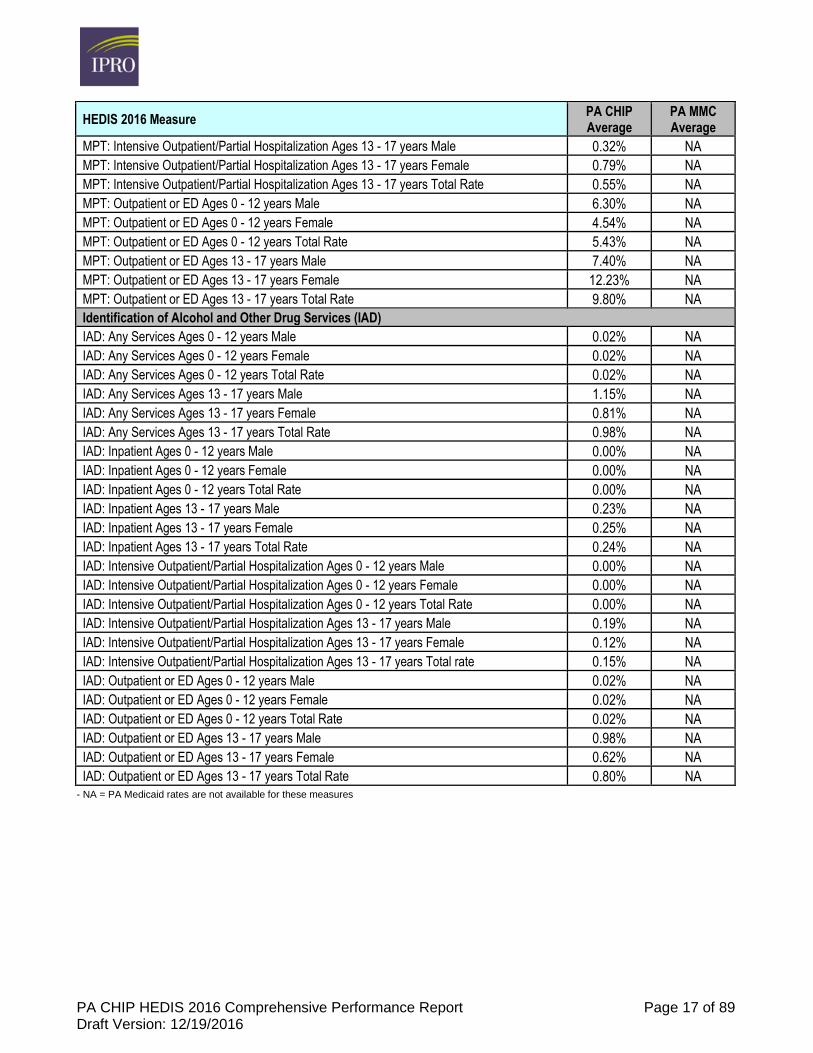
HEDIS 2016 Measure PA CHIP Average
PA MMC Average
MPT: Intensive Outpatient/Partial Hospitalization Ages 13 - 17 years Male 0.32% NA
MPT: Intensive Outpatient/Partial Hospitalization Ages 13 - 17 years Female 0.79% NA
MPT: Intensive Outpatient/Partial Hospitalization Ages 13 - 17 years Total Rate 0.55% NA
MPT: Outpatient or ED Ages 0 - 12 years Male 6.30% NA
MPT: Outpatient or ED Ages 0 - 12 years Female 4.54% NA
MPT: Outpatient or ED Ages 0 - 12 years Total Rate 5.43% NA
MPT: Outpatient or ED Ages 13 - 17 years Male 7.40% NA
MPT: Outpatient or ED Ages 13 - 17 years Female 12.23% NA
MPT: Outpatient or ED Ages 13 - 17 years Total Rate 9.80% NA
Identification of Alcohol and Other Drug Services (IAD)
IAD: Any Services Ages 0 - 12 years Male 0.02% NA
IAD: Any Services Ages 0 - 12 years Female 0.02% NA
IAD: Any Services Ages 0 - 12 years Total Rate 0.02% NA
IAD: Any Services Ages 13 - 17 years Male 1.15% NA
IAD: Any Services Ages 13 - 17 years Female 0.81% NA
IAD: Any Services Ages 13 - 17 years Total Rate 0.98% NA
IAD: Inpatient Ages 0 - 12 years Male 0.00% NA
IAD: Inpatient Ages 0 - 12 years Female 0.00% NA
IAD: Inpatient Ages 0 - 12 years Total Rate 0.00% NA
IAD: Inpatient Ages 13 - 17 years Male 0.23% NA
IAD: Inpatient Ages 13 - 17 years Female 0.25% NA
IAD: Inpatient Ages 13 - 17 years Total Rate 0.24% NA
IAD: Intensive Outpatient/Partial Hospitalization Ages 0 - 12 years Male 0.00% NA
IAD: Intensive Outpatient/Partial Hospitalization Ages 0 - 12 years Female 0.00% NA
IAD: Intensive Outpatient/Partial Hospitalization Ages 0 - 12 years Total Rate 0.00% NA
IAD: Intensive Outpatient/Partial Hospitalization Ages 13 - 17 years Male 0.19% NA
IAD: Intensive Outpatient/Partial Hospitalization Ages 13 - 17 years Female 0.12% NA
IAD: Intensive Outpatient/Partial Hospitalization Ages 13 - 17 years Total rate 0.15% NA
IAD: Outpatient or ED Ages 0 - 12 years Male 0.02% NA
IAD: Outpatient or ED Ages 0 - 12 years Female 0.02% NA
IAD: Outpatient or ED Ages 0 - 12 years Total Rate 0.02% NA
IAD: Outpatient or ED Ages 13 - 17 years Male 0.98% NA
IAD: Outpatient or ED Ages 13 - 17 years Female 0.62% NA
IAD: Outpatient or ED Ages 13 - 17 years Total Rate 0.80% NA - NA = PA Medicaid rates are not available for these measures
PA CHIP HEDIS 2016 Comprehensive Performance Report Page 18 of 89 Draft Version: 12/19/2016
WELL-CHILD VISITS IN THE FIRST 15 MONTHS OF LIFE (W15)
Measure Description
This measure assesses the percentage of enrollees who turned 15 months old during the
measurement year, who were continuously enrolled from 31 days of age through 15 months of age
who had zero, one, two, three, four, five or six or more well-child visits with a PCP during their first 15
months of life.
W15 - 4 Visits: Results
Table 2.0
W15: 4 Visits HEDIS 2016
PA CHIP Weighted Average 3.69%
PA Medicaid Weighted Average 7.35%
Quality Compass Percentile Benchmark Met – National 5th percentile
Quality Compass Percentile Benchmark Met – Regional 5th percentile
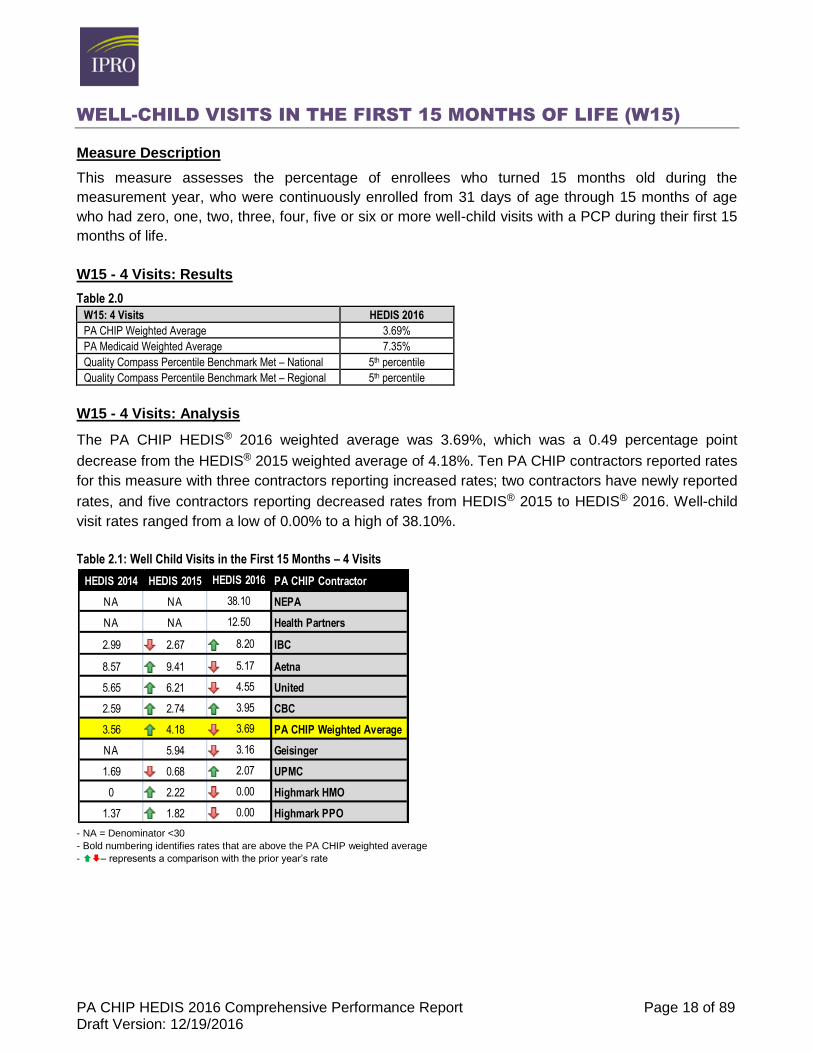
W15 - 4 Visits: Analysis
The PA CHIP HEDIS® 2016 weighted average was 3.69%, which was a 0.49 percentage point
decrease from the HEDIS® 2015 weighted average of 4.18%. Ten PA CHIP contractors reported rates
for this measure with three contractors reporting increased rates; two contractors have newly reported
rates, and five contractors reporting decreased rates from HEDIS® 2015 to HEDIS® 2016. Well-child
visit rates ranged from a low of 0.00% to a high of 38.10%.
Table 2.1: Well Child Visits in the First 15 Months – 4 Visits
- NA = Denominator <30
- Bold numbering identifies rates that are above the PA CHIP weighted average
- – represents a comparison with the prior year’s rate
HEDIS 2014 HEDIS 2015 HEDIS 2016 PA CHIP Contractor
NA NA 38.10 NEPA
NA NA 12.50 Health Partners
2.99 2.67 8.20 IBC
8.57 9.41 5.17 Aetna
5.65 6.21 4.55 United
2.59 2.74 3.95 CBC
3.56 4.18 3.69 PA CHIP Weighted Average
NA 5.94 3.16 Geisinger
1.69 0.68 2.07 UPMC
0 2.22 0.00 Highmark HMO
1.37 1.82 0.00 Highmark PPO
PA CHIP HEDIS 2016 Comprehensive Performance Report Page 19 of 89 Draft Version: 12/19/2016
W15 - 5 Visits: Results
Table 2.2
W15: 5 Visits HEDIS 2016
PA CHIP Weighted Average 20.63%
PA Medicaid Weighted Average 15.32%
Quality Compass Percentile Benchmark Met – National 75th percentile
Quality Compass Percentile Benchmark Met – Regional 90th percentile
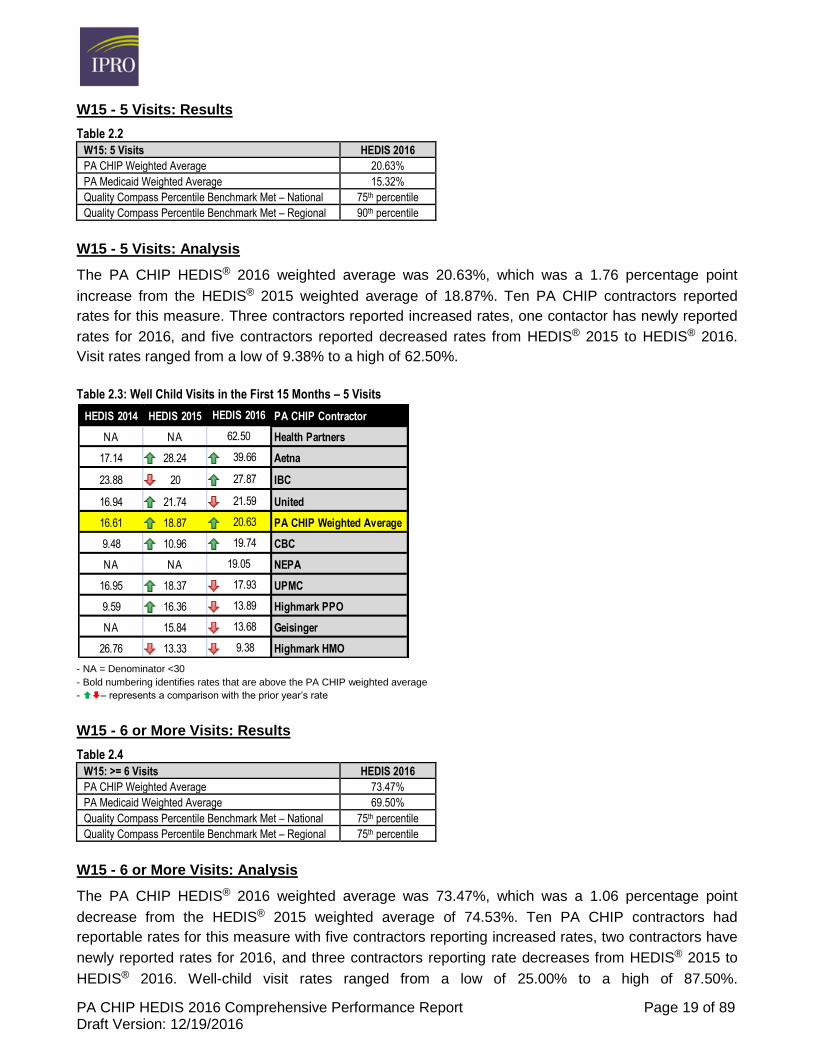
W15 - 5 Visits: Analysis
The PA CHIP HEDIS® 2016 weighted average was 20.63%, which was a 1.76 percentage point
increase from the HEDIS® 2015 weighted average of 18.87%. Ten PA CHIP contractors reported
rates for this measure. Three contractors reported increased rates, one contactor has newly reported
rates for 2016, and five contractors reported decreased rates from HEDIS® 2015 to HEDIS® 2016.
Visit rates ranged from a low of 9.38% to a high of 62.50%.
Table 2.3: Well Child Visits in the First 15 Months – 5 Visits
- NA = Denominator <30
- Bold numbering identifies rates that are above the PA CHIP weighted average
- – represents a comparison with the prior year’s rate
W15 - 6 or More Visits: Results
Table 2.4
W15: >= 6 Visits HEDIS 2016
PA CHIP Weighted Average 73.47%
PA Medicaid Weighted Average 69.50%
Quality Compass Percentile Benchmark Met – National 75th percentile
Quality Compass Percentile Benchmark Met – Regional 75th percentile
W15 - 6 or More Visits: Analysis
The PA CHIP HEDIS® 2016 weighted average was 73.47%, which was a 1.06 percentage point
decrease from the HEDIS® 2015 weighted average of 74.53%. Ten PA CHIP contractors had
reportable rates for this measure with five contractors reporting increased rates, two contractors have
newly reported rates for 2016, and three contractors reporting rate decreases from HEDIS® 2015 to
HEDIS® 2016. Well-child visit rates ranged from a low of 25.00% to a high of 87.50%.
HEDIS 2014 HEDIS 2015 HEDIS 2016 PA CHIP Contractor
NA NA 62.50 Health Partners
17.14 28.24 39.66 Aetna
23.88 20 27.87 IBC
16.94 21.74 21.59 United
16.61 18.87 20.63 PA CHIP Weighted Average
9.48 10.96 19.74 CBC
NA NA 19.05 NEPA
16.95 18.37 17.93 UPMC
9.59 16.36 13.89 Highmark PPO
NA 15.84 13.68 Geisinger
26.76 13.33 9.38 Highmark HMO
PA CHIP HEDIS 2016 Comprehensive Performance Report Page 20 of 89 Draft Version: 12/19/2016
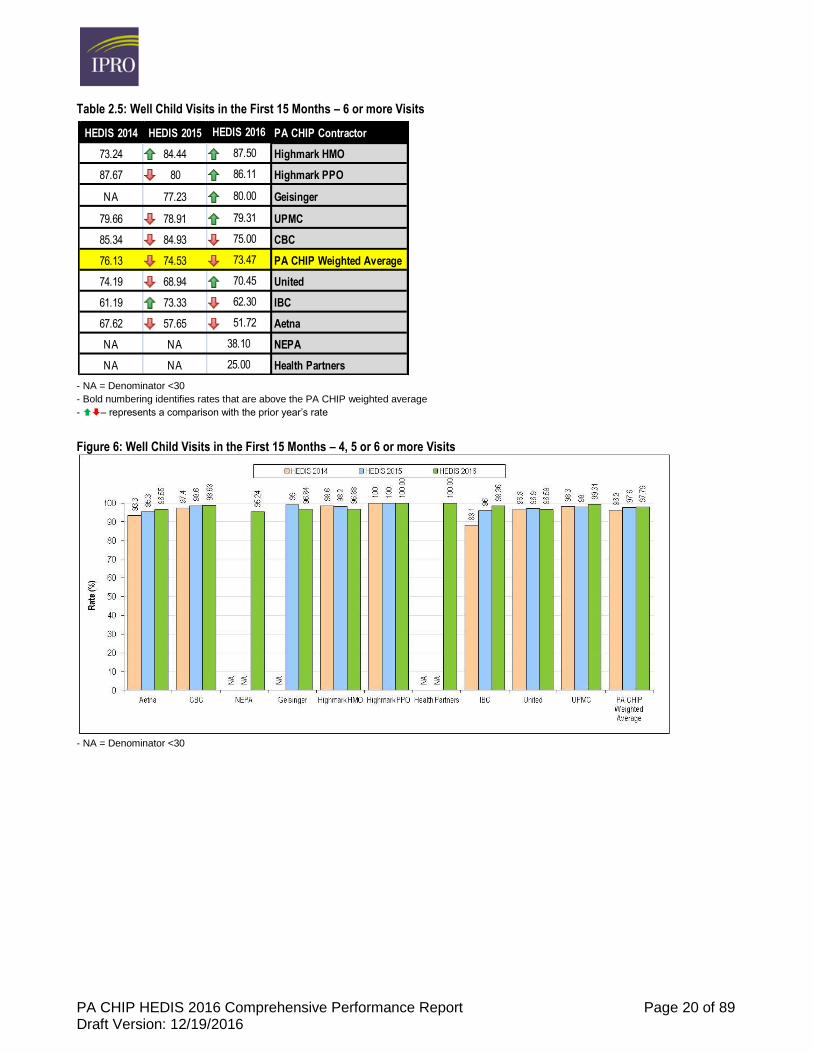
Table 2.5: Well Child Visits in the First 15 Months – 6 or more Visits
- NA = Denominator <30
- Bold numbering identifies rates that are above the PA CHIP weighted average
- – represents a comparison with the prior year’s rate
Figure 6: Well Child Visits in the First 15 Months – 4, 5 or 6 or more Visits
- NA = Denominator <30
HEDIS 2014 HEDIS 2015 HEDIS 2016 PA CHIP Contractor
73.24 84.44 87.50 Highmark HMO
87.67 80 86.11 Highmark PPO
NA 77.23 80.00 Geisinger
79.66 78.91 79.31 UPMC
85.34 84.93 75.00 CBC
76.13 74.53 73.47 PA CHIP Weighted Average
74.19 68.94 70.45 United
61.19 73.33 62.30 IBC
67.62 57.65 51.72 Aetna
NA NA 38.10 NEPA
NA NA 25.00 Health Partners
PA CHIP HEDIS 2016 Comprehensive Performance Report Page 21 of 89 Draft Version: 12/19/2016
WELL-CHILD VISITS IN THE 3RD, 4TH, 5TH AND 6TH YEARS OF
LIFE (W34)
Measure Description
This measure assesses the percentage of enrollees who were three, four, five or six years old during
the measurement year, who were continuously enrolled during the measurement year and who had
one or more well-child visits with a PCP during the measurement year.
W34: Results
Table 2.6
W34: Rate 3 - 6 years HEDIS 2016
PA CHIP Weighted Average 83.38%
PA Medicaid Weighted Average 75.84%
Quality Compass Percentile Benchmark Met – National 90th percentile
Quality Compass Percentile Benchmark Met – Regional 90th percentile
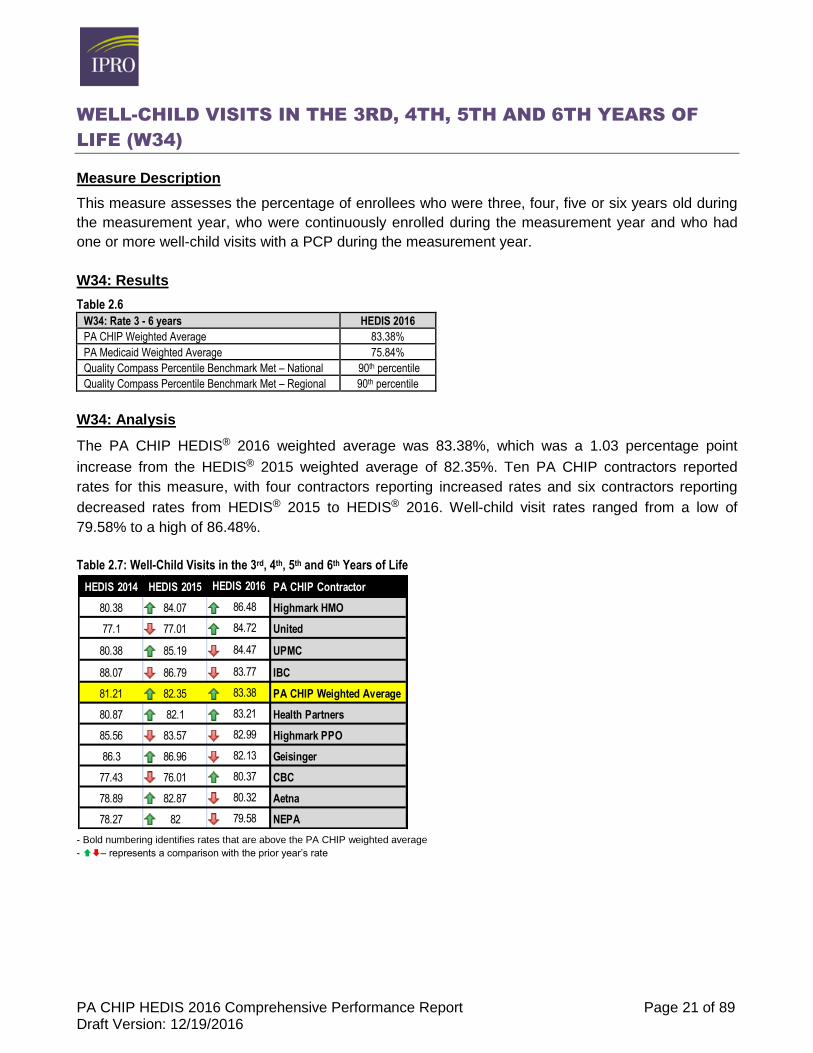
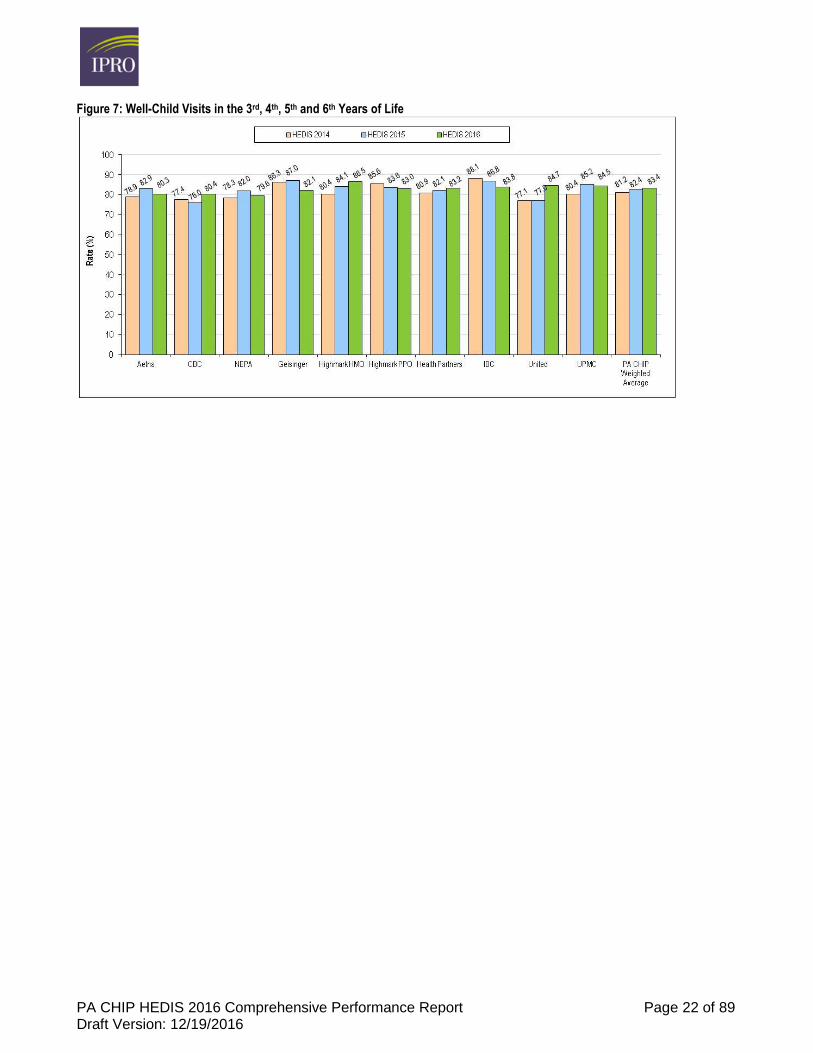
W34: Analysis
The PA CHIP HEDIS® 2016 weighted average was 83.38%, which was a 1.03 percentage point
increase from the HEDIS® 2015 weighted average of 82.35%. Ten PA CHIP contractors reported
rates for this measure, with four contractors reporting increased rates and six contractors reporting
decreased rates from HEDIS® 2015 to HEDIS® 2016. Well-child visit rates ranged from a low of
79.58% to a high of 86.48%.
Table 2.7: Well-Child Visits in the 3rd, 4th, 5th and 6th Years of Life
- Bold numbering identifies rates that are above the PA CHIP weighted average
- – represents a comparison with the prior year’s rate
HEDIS 2014 HEDIS 2015 HEDIS 2016 PA CHIP Contractor
80.38 84.07 86.48 Highmark HMO
77.1 77.01 84.72 United
80.38 85.19 84.47 UPMC
88.07 86.79 83.77 IBC
81.21 82.35 83.38 PA CHIP Weighted Average
80.87 82.1 83.21 Health Partners
85.56 83.57 82.99 Highmark PPO
86.3 86.96 82.13 Geisinger
77.43 76.01 80.37 CBC
78.89 82.87 80.32 Aetna
78.27 82 79.58 NEPA
PA CHIP HEDIS 2016 Comprehensive Performance Report Page 22 of 89 Draft Version: 12/19/2016
Figure 7: Well-Child Visits in the 3rd, 4th, 5th and 6th Years of Life
PA CHIP HEDIS 2016 Comprehensive Performance Report Page 23 of 89 Draft Version: 12/19/2016
ADOLESCENT WELL-CARE VISITS (AWC)
Measure Description
This measure assesses the percentage of enrollees 12 to 19 years old, who were continuously
enrolled during the measurement year and who had at least one comprehensive well-care visit with a
PCP or OB/GYN during the measurement year.
AWC: Results
Table 2.8
AWC: Rate 12 - 19 years HEDIS 2016
PA CHIP Weighted Average 66.34%
PA Medicaid Weighted Average* 55.68%
Quality Compass Percentile Benchmark Met – National* 90th percentile
Quality Compass Percentile Benchmark Met – Regional* 90th percentile
- Medicaid rate and benchmarks include members 12-21 years old
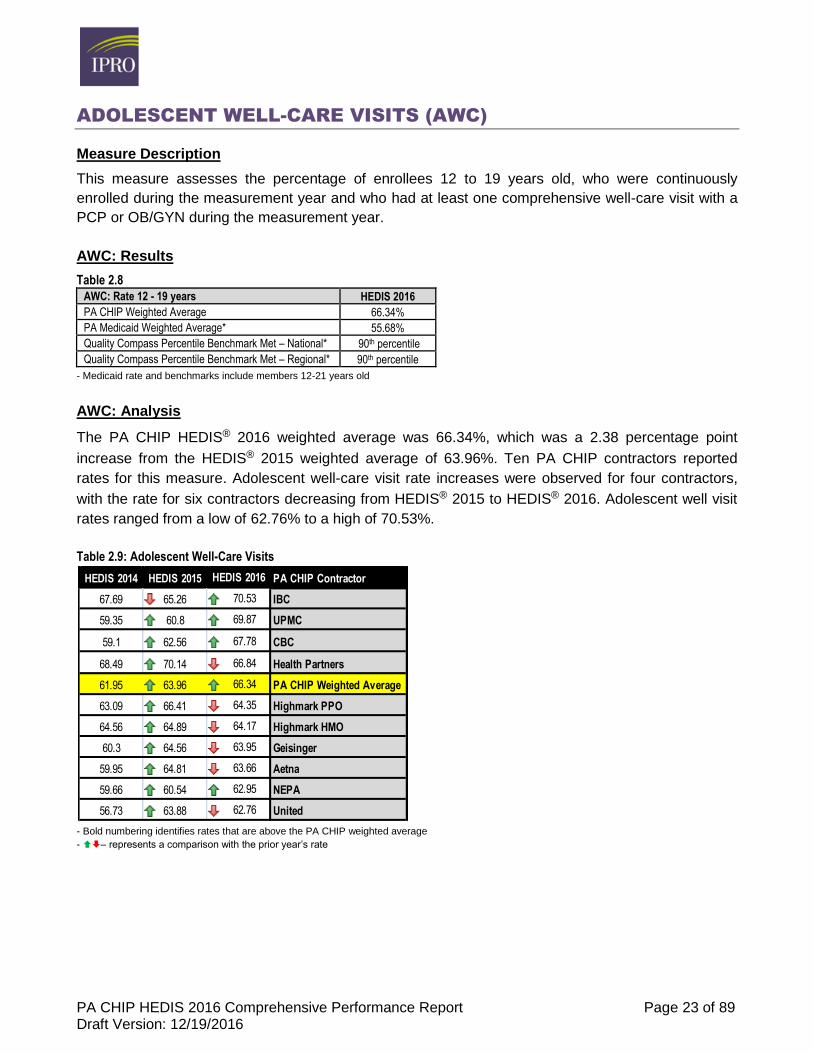
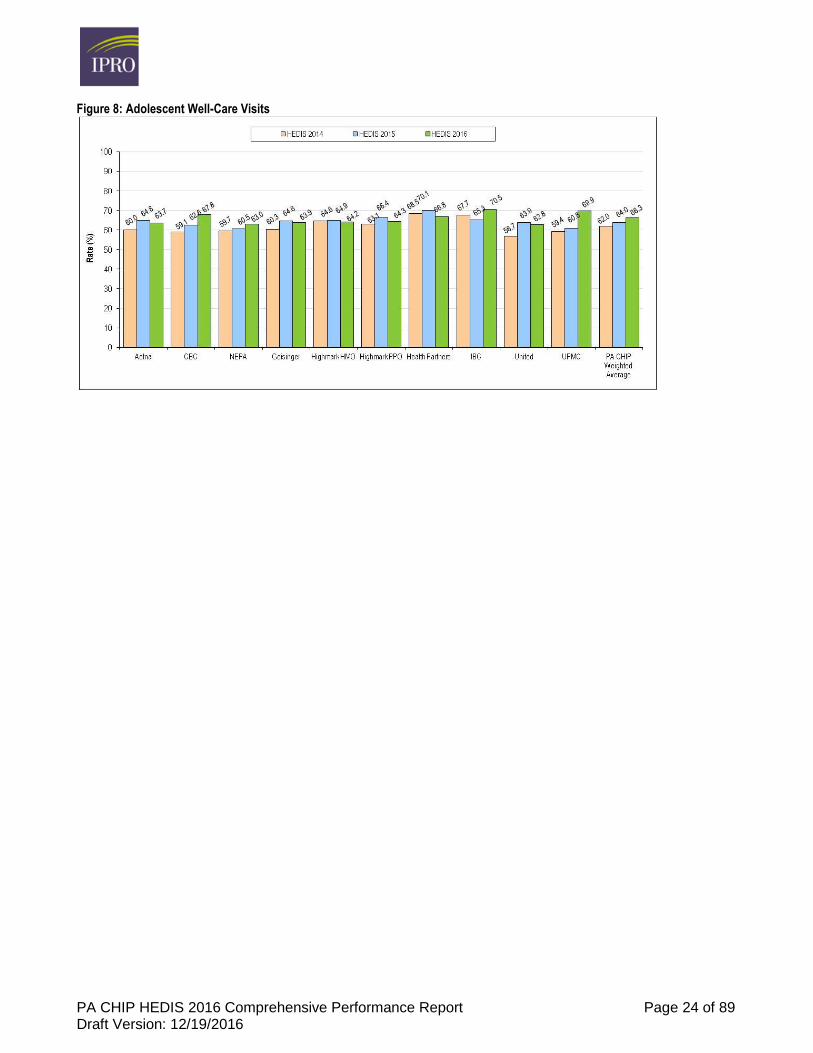
AWC: Analysis
The PA CHIP HEDIS® 2016 weighted average was 66.34%, which was a 2.38 percentage point
increase from the HEDIS® 2015 weighted average of 63.96%. Ten PA CHIP contractors reported
rates for this measure. Adolescent well-care visit rate increases were observed for four contractors,
with the rate for six contractors decreasing from HEDIS® 2015 to HEDIS® 2016. Adolescent well visit
rates ranged from a low of 62.76% to a high of 70.53%.
Table 2.9: Adolescent Well-Care Visits
- Bold numbering identifies rates that are above the PA CHIP weighted average
- – represents a comparison with the prior year’s rate
HEDIS 2014 HEDIS 2015 HEDIS 2016 PA CHIP Contractor
67.69 65.26 70.53 IBC
59.35 60.8 69.87 UPMC
59.1 62.56 67.78 CBC
68.49 70.14 66.84 Health Partners
61.95 63.96 66.34 PA CHIP Weighted Average
63.09 66.41 64.35 Highmark PPO
64.56 64.89 64.17 Highmark HMO
60.3 64.56 63.95 Geisinger
59.95 64.81 63.66 Aetna
59.66 60.54 62.95 NEPA
56.73 63.88 62.76 United
PA CHIP HEDIS 2016 Comprehensive Performance Report Page 24 of 89 Draft Version: 12/19/2016
Figure 8: Adolescent Well-Care Visits
PA CHIP HEDIS 2016 Comprehensive Performance Report Page 25 of 89 Draft Version: 12/19/2016
AMBULATORY CARE (AMB)
Measure Description
The ambulatory care measure summarizes utilization of ambulatory care in outpatient visits and
emergency department visits for children less than one year old, one to nine years old, 10 to 19 years
old and less than one to 19 years old. This measure is an inverted measure with a lower rate
representing better performance.
Ambulatory Care – Emergency Department Visits
AMB ED Visits <1-19 Years: Results
Table 2.10
AMB ED Visits/1000 MM Ages <1 – 19 Years HEDIS 2016
PA CHIP Weighted Average 27.86
PA Medicaid Weighted Average* 54.48
Quality Compass Percentile Benchmark Met – National** NA
Quality Compass Percentile Benchmark Met – Regional** NA
* Calculated for comparison with CHIP rates
** Medicaid benchmarks are not available for the <1-19 age range
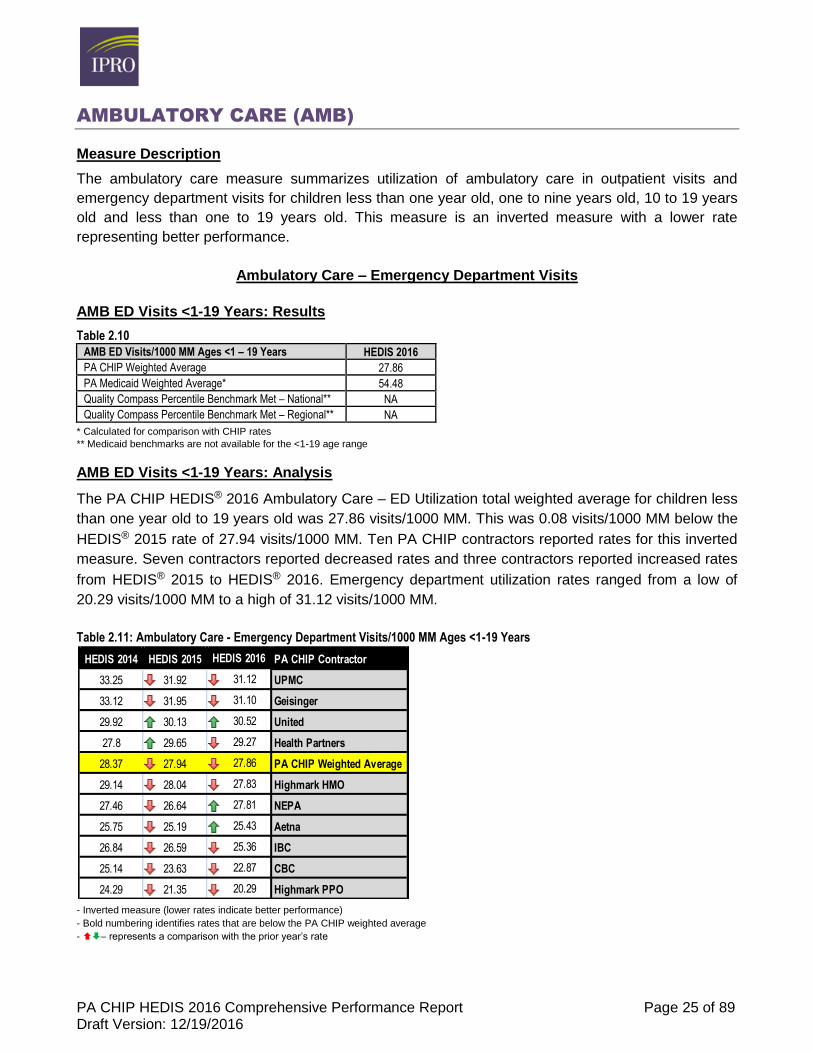
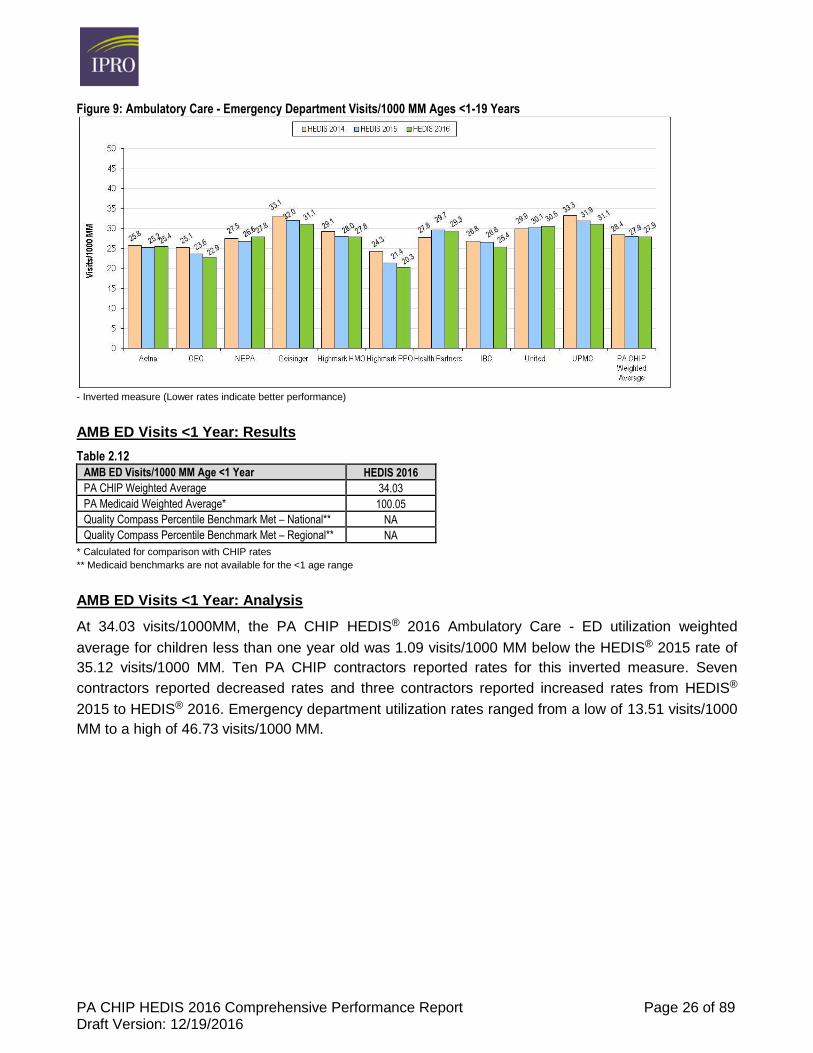
AMB ED Visits <1-19 Years: Analysis
The PA CHIP HEDIS® 2016 Ambulatory Care – ED Utilization total weighted average for children less
than one year old to 19 years old was 27.86 visits/1000 MM. This was 0.08 visits/1000 MM below the
HEDIS® 2015 rate of 27.94 visits/1000 MM. Ten PA CHIP contractors reported rates for this inverted
measure. Seven contractors reported decreased rates and three contractors reported increased rates
from HEDIS® 2015 to HEDIS® 2016. Emergency department utilization rates ranged from a low of
20.29 visits/1000 MM to a high of 31.12 visits/1000 MM.
Table 2.11: Ambulatory Care - Emergency Department Visits/1000 MM Ages <1-19 Years
- Inverted measure (lower rates indicate better performance)
- Bold numbering identifies rates that are below the PA CHIP weighted average
- – represents a comparison with the prior year’s rate
HEDIS 2014 HEDIS 2015 HEDIS 2016 PA CHIP Contractor
33.25 31.92 31.12 UPMC
33.12 31.95 31.10 Geisinger
29.92 30.13 30.52 United
27.8 29.65 29.27 Health Partners
28.37 27.94 27.86 PA CHIP Weighted Average
29.14 28.04 27.83 Highmark HMO
27.46 26.64 27.81 NEPA
25.75 25.19 25.43 Aetna
26.84 26.59 25.36 IBC
25.14 23.63 22.87 CBC
24.29 21.35 20.29 Highmark PPO
PA CHIP HEDIS 2016 Comprehensive Performance Report Page 26 of 89 Draft Version: 12/19/2016
Figure 9: Ambulatory Care - Emergency Department Visits/1000 MM Ages <1-19 Years
- Inverted measure (Lower rates indicate better performance)
AMB ED Visits <1 Year: Results
Table 2.12
AMB ED Visits/1000 MM Age <1 Year HEDIS 2016
PA CHIP Weighted Average 34.03
PA Medicaid Weighted Average* 100.05
Quality Compass Percentile Benchmark Met – National** NA
Quality Compass Percentile Benchmark Met – Regional** NA
* Calculated for comparison with CHIP rates
** Medicaid benchmarks are not available for the <1 age range
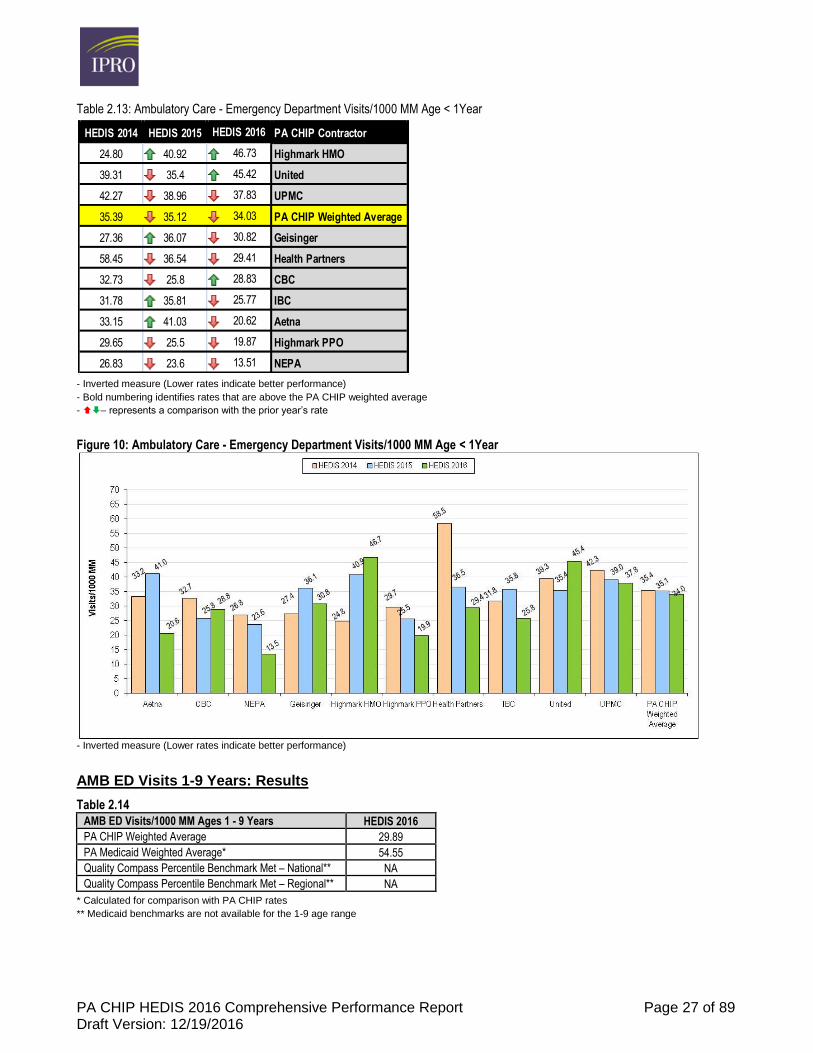
AMB ED Visits <1 Year: Analysis
At 34.03 visits/1000MM, the PA CHIP HEDIS® 2016 Ambulatory Care - ED utilization weighted
average for children less than one year old was 1.09 visits/1000 MM below the HEDIS® 2015 rate of
35.12 visits/1000 MM. Ten PA CHIP contractors reported rates for this inverted measure. Seven
contractors reported decreased rates and three contractors reported increased rates from HEDIS®
2015 to HEDIS® 2016. Emergency department utilization rates ranged from a low of 13.51 visits/1000
MM to a high of 46.73 visits/1000 MM.
PA CHIP HEDIS 2016 Comprehensive Performance Report Page 27 of 89 Draft Version: 12/19/2016
Table 2.13: Ambulatory Care - Emergency Department Visits/1000 MM Age < 1Year
- Inverted measure (Lower rates indicate better performance)
- Bold numbering identifies rates that are above the PA CHIP weighted average
- – represents a comparison with the prior year’s rate
Figure 10: Ambulatory Care - Emergency Department Visits/1000 MM Age < 1Year
- Inverted measure (Lower rates indicate better performance)
AMB ED Visits 1-9 Years: Results
Table 2.14
AMB ED Visits/1000 MM Ages 1 - 9 Years HEDIS 2016
PA CHIP Weighted Average 29.89
PA Medicaid Weighted Average* 54.55
Quality Compass Percentile Benchmark Met – National** NA
Quality Compass Percentile Benchmark Met – Regional** NA
* Calculated for comparison with PA CHIP rates
** Medicaid benchmarks are not available for the 1-9 age range
HEDIS 2014 HEDIS 2015 HEDIS 2016 PA CHIP Contractor
24.80 40.92 46.73 Highmark HMO
39.31 35.4 45.42 United
42.27 38.96 37.83 UPMC
35.39 35.12 34.03 PA CHIP Weighted Average
27.36 36.07 30.82 Geisinger
58.45 36.54 29.41 Health Partners
32.73 25.8 28.83 CBC
31.78 35.81 25.77 IBC
33.15 41.03 20.62 Aetna
29.65 25.5 19.87 Highmark PPO
26.83 23.6 13.51 NEPA
PA CHIP HEDIS 2016 Comprehensive Performance Report Page 28 of 89 Draft Version: 12/19/2016
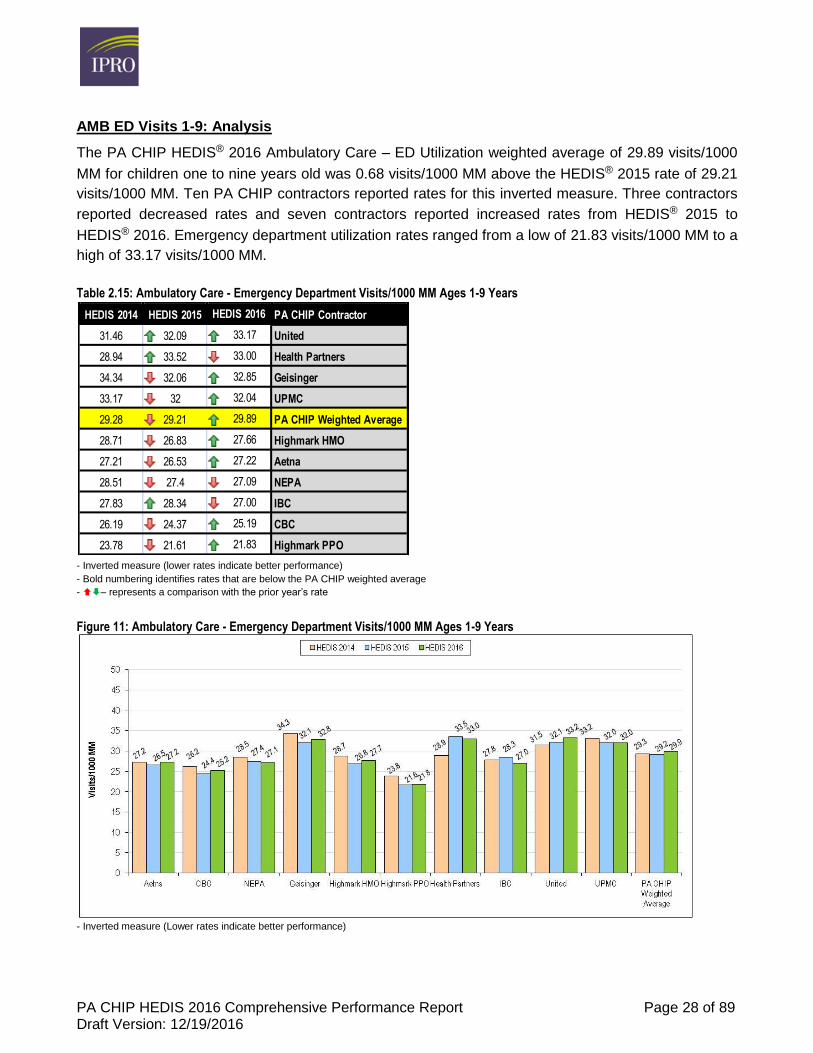
AMB ED Visits 1-9: Analysis
The PA CHIP HEDIS® 2016 Ambulatory Care – ED Utilization weighted average of 29.89 visits/1000
MM for children one to nine years old was 0.68 visits/1000 MM above the HEDIS® 2015 rate of 29.21
visits/1000 MM. Ten PA CHIP contractors reported rates for this inverted measure. Three contractors
reported decreased rates and seven contractors reported increased rates from HEDIS® 2015 to
HEDIS® 2016. Emergency department utilization rates ranged from a low of 21.83 visits/1000 MM to a
high of 33.17 visits/1000 MM.
Table 2.15: Ambulatory Care - Emergency Department Visits/1000 MM Ages 1-9 Years
- Inverted measure (lower rates indicate better performance)
- Bold numbering identifies rates that are below the PA CHIP weighted average
- – represents a comparison with the prior year’s rate
Figure 11: Ambulatory Care - Emergency Department Visits/1000 MM Ages 1-9 Years
- Inverted measure (Lower rates indicate better performance)
HEDIS 2014 HEDIS 2015 HEDIS 2016 PA CHIP Contractor
31.46 32.09 33.17 United
28.94 33.52 33.00 Health Partners
34.34 32.06 32.85 Geisinger
33.17 32 32.04 UPMC
29.28 29.21 29.89 PA CHIP Weighted Average
28.71 26.83 27.66 Highmark HMO
27.21 26.53 27.22 Aetna
28.51 27.4 27.09 NEPA
27.83 28.34 27.00 IBC
26.19 24.37 25.19 CBC
23.78 21.61 21.83 Highmark PPO
PA CHIP HEDIS 2016 Comprehensive Performance Report Page 29 of 89 Draft Version: 12/19/2016
AMB ED Visits 10-19 Years: Results
Table 2.16
AMB ED Visits/1000 MM Ages 10 – 19 Years HEDIS 2016
PA CHIP Weighted Average 26.15
PA Medicaid Weighted Average* 47.85
Quality Compass Percentile Benchmark Met – National** NA
Quality Compass Percentile Benchmark Met – Regional** NA
* Calculated for comparison with CHIP rates
** Medicaid benchmarks are not available for the 10-19 age range
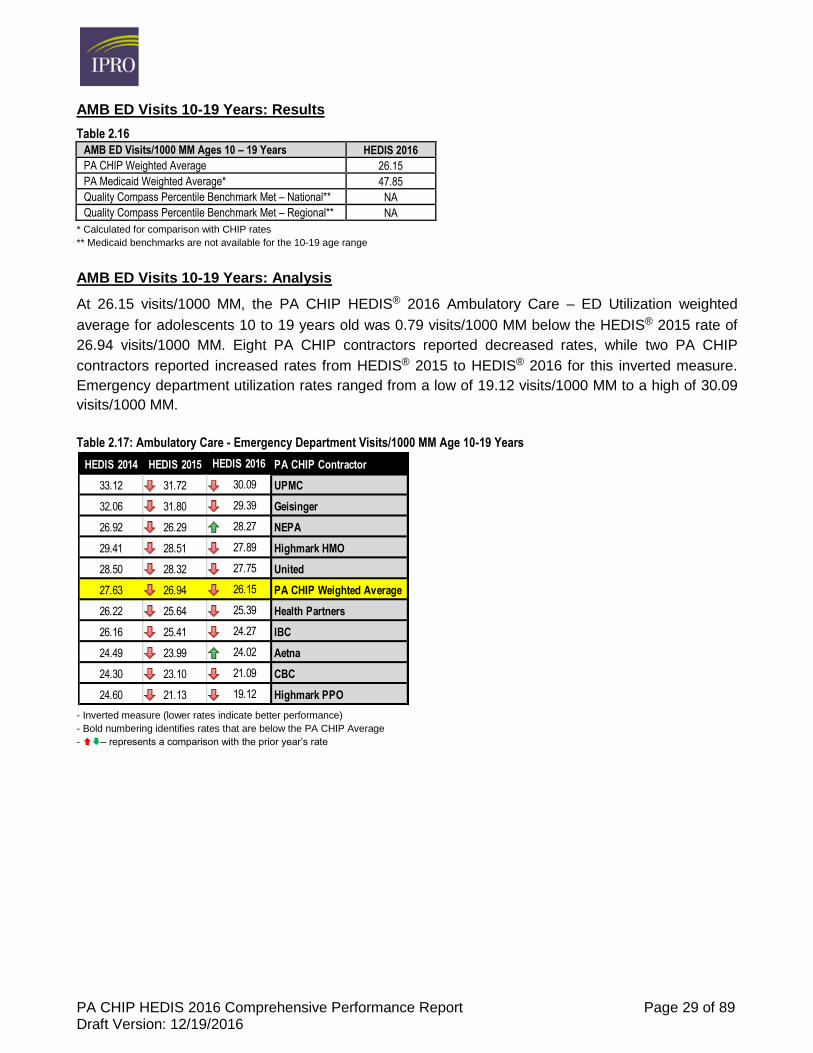
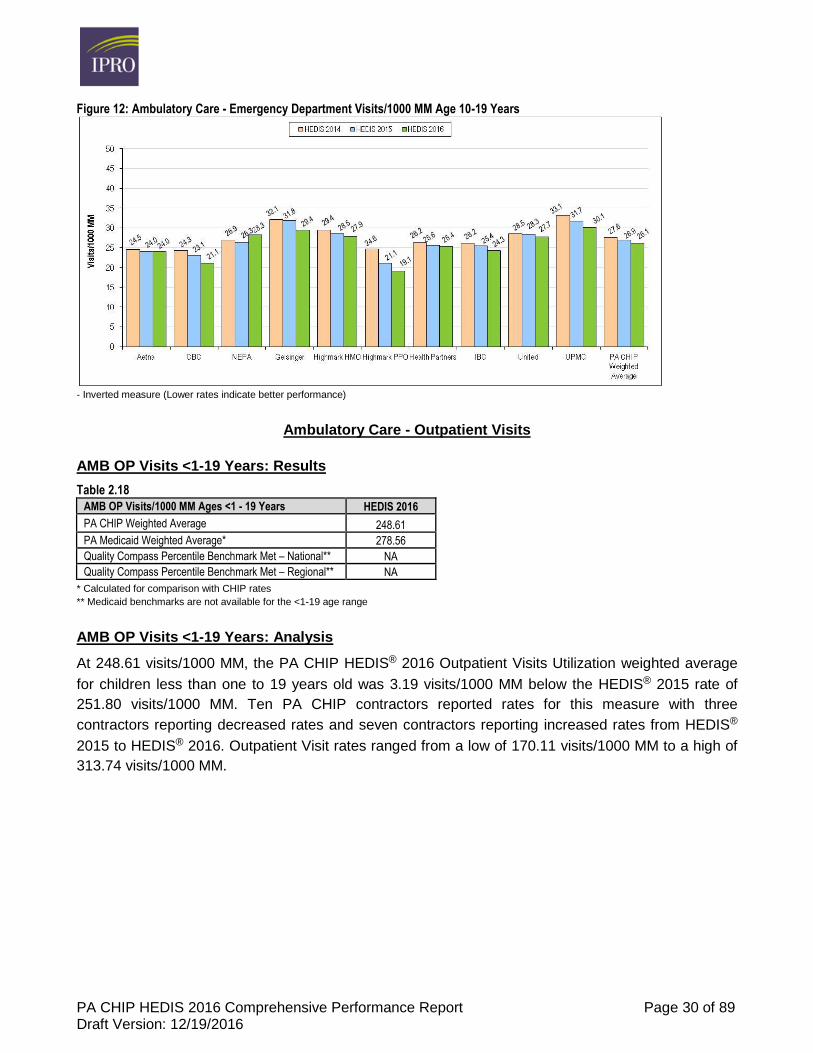
AMB ED Visits 10-19 Years: Analysis
At 26.15 visits/1000 MM, the PA CHIP HEDIS® 2016 Ambulatory Care – ED Utilization weighted
average for adolescents 10 to 19 years old was 0.79 visits/1000 MM below the HEDIS® 2015 rate of
26.94 visits/1000 MM. Eight PA CHIP contractors reported decreased rates, while two PA CHIP
contractors reported increased rates from HEDIS® 2015 to HEDIS® 2016 for this inverted measure.
Emergency department utilization rates ranged from a low of 19.12 visits/1000 MM to a high of 30.09
visits/1000 MM.
Table 2.17: Ambulatory Care - Emergency Department Visits/1000 MM Age 10-19 Years
- Inverted measure (lower rates indicate better performance)
- Bold numbering identifies rates that are below the PA CHIP Average
- – represents a comparison with the prior year’s rate
HEDIS 2014 HEDIS 2015 HEDIS 2016 PA CHIP Contractor
33.12 31.72 30.09 UPMC
32.06 31.80 29.39 Geisinger
26.92 26.29 28.27 NEPA
29.41 28.51 27.89 Highmark HMO
28.50 28.32 27.75 United
27.63 26.94 26.15 PA CHIP Weighted Average
26.22 25.64 25.39 Health Partners
26.16 25.41 24.27 IBC
24.49 23.99 24.02 Aetna
24.30 23.10 21.09 CBC
24.60 21.13 19.12 Highmark PPO
PA CHIP HEDIS 2016 Comprehensive Performance Report Page 30 of 89 Draft Version: 12/19/2016
Figure 12: Ambulatory Care - Emergency Department Visits/1000 MM Age 10-19 Years
- Inverted measure (Lower rates indicate better performance)
Ambulatory Care - Outpatient Visits
AMB OP Visits <1-19 Years: Results
Table 2.18
AMB OP Visits/1000 MM Ages <1 - 19 Years HEDIS 2016
PA CHIP Weighted Average 248.61
PA Medicaid Weighted Average* 278.56
Quality Compass Percentile Benchmark Met – National** NA
Quality Compass Percentile Benchmark Met – Regional** NA
* Calculated for comparison with CHIP rates
** Medicaid benchmarks are not available for the <1-19 age range
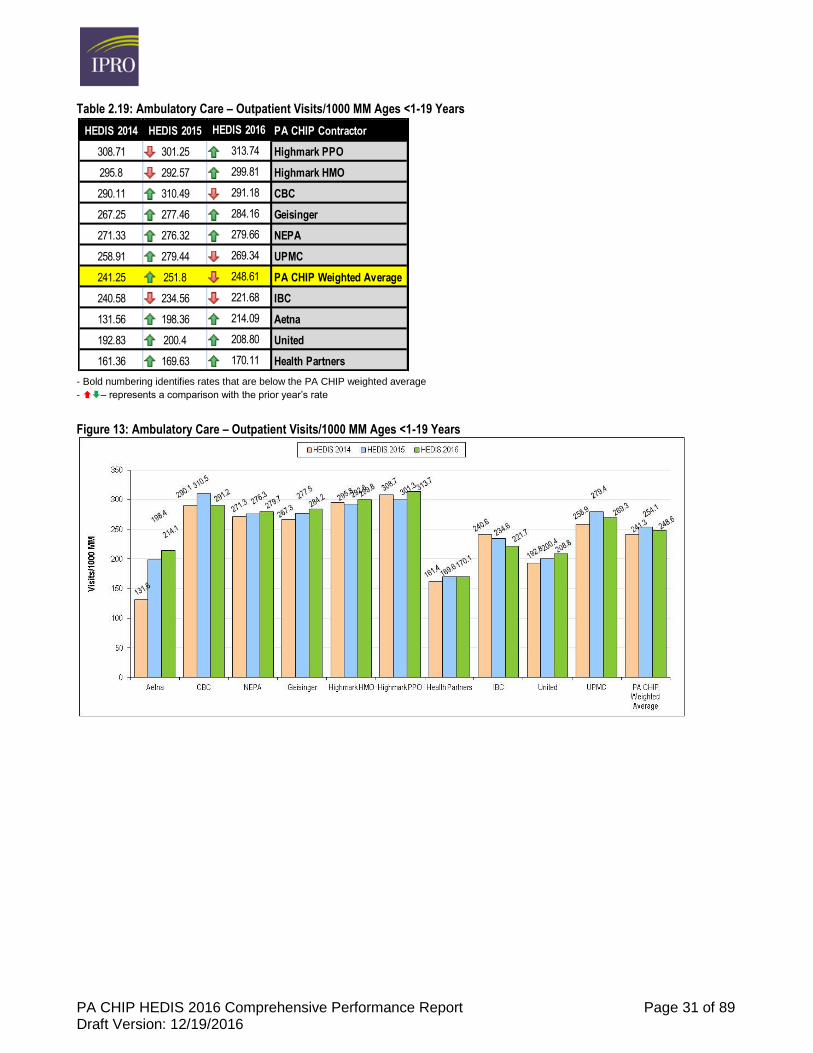
AMB OP Visits <1-19 Years: Analysis
At 248.61 visits/1000 MM, the PA CHIP HEDIS® 2016 Outpatient Visits Utilization weighted average
for children less than one to 19 years old was 3.19 visits/1000 MM below the HEDIS® 2015 rate of
251.80 visits/1000 MM. Ten PA CHIP contractors reported rates for this measure with three
contractors reporting decreased rates and seven contractors reporting increased rates from HEDIS®
2015 to HEDIS® 2016. Outpatient Visit rates ranged from a low of 170.11 visits/1000 MM to a high of
313.74 visits/1000 MM.
PA CHIP HEDIS 2016 Comprehensive Performance Report Page 31 of 89 Draft Version: 12/19/2016
Table 2.19: Ambulatory Care – Outpatient Visits/1000 MM Ages <1-19 Years
- Bold numbering identifies rates that are below the PA CHIP weighted average
- – represents a comparison with the prior year’s rate
Figure 13: Ambulatory Care – Outpatient Visits/1000 MM Ages <1-19 Years
HEDIS 2014 HEDIS 2015 HEDIS 2016 PA CHIP Contractor
308.71 301.25 313.74 Highmark PPO
295.8 292.57 299.81 Highmark HMO
290.11 310.49 291.18 CBC
267.25 277.46 284.16 Geisinger
271.33 276.32 279.66 NEPA
258.91 279.44 269.34 UPMC
241.25 251.8 248.61 PA CHIP Weighted Average
240.58 234.56 221.68 IBC
131.56 198.36 214.09 Aetna
192.83 200.4 208.80 United
161.36 169.63 170.11 Health Partners
PA CHIP HEDIS 2016 Comprehensive Performance Report Page 32 of 89 Draft Version: 12/19/2016
INPATIENT UTILIZATION - GENERAL HOSPITAL/ACUTE CARE (IPU)
Measure Description
The Inpatient Utilization measure summarizes utilization of acute inpatient services in medicine,
maternity, surgery and total services for children less than one, one to nine, 10 to 19 years old and
less than one to 19 years old. This measure is an inverted measure with a lower rate representing
better performance.
Total Inpatient Utilization - Discharges
IPU Total Discharges <1-19 Years: Results
Table 2.20
IPU Total Discharges/1000 MM Ages <1 – 19 Years HEDIS 2016
PA CHIP Average 0.89
PA Medicaid Average* 2.71
Quality Compass Percentile Benchmark Met – National** NA
Quality Compass Percentile Benchmark Met – Regional** NA
* Calculated for comparison with CHIP rates
** Medicaid benchmarks are not available for the <1-19 age range
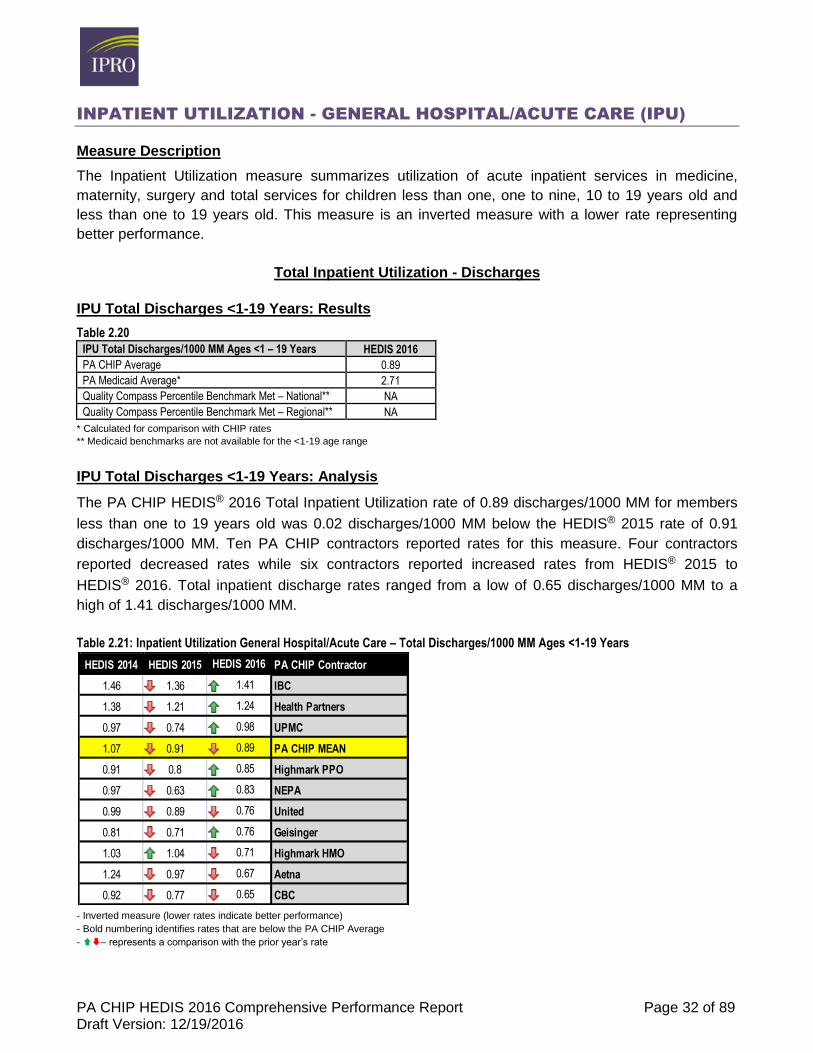
IPU Total Discharges <1-19 Years: Analysis
The PA CHIP HEDIS® 2016 Total Inpatient Utilization rate of 0.89 discharges/1000 MM for members
less than one to 19 years old was 0.02 discharges/1000 MM below the HEDIS® 2015 rate of 0.91
discharges/1000 MM. Ten PA CHIP contractors reported rates for this measure. Four contractors
reported decreased rates while six contractors reported increased rates from HEDIS® 2015 to
HEDIS® 2016. Total inpatient discharge rates ranged from a low of 0.65 discharges/1000 MM to a
high of 1.41 discharges/1000 MM.
Table 2.21: Inpatient Utilization General Hospital/Acute Care – Total Discharges/1000 MM Ages <1-19 Years
- Inverted measure (lower rates indicate better performance)
- Bold numbering identifies rates that are below the PA CHIP Average
- – represents a comparison with the prior year’s rate
HEDIS 2014 HEDIS 2015 HEDIS 2016 PA CHIP Contractor
1.46 1.36 1.41 IBC
1.38 1.21 1.24 Health Partners
0.97 0.74 0.98 UPMC
1.07 0.91 0.89 PA CHIP MEAN
0.91 0.8 0.85 Highmark PPO
0.97 0.63 0.83 NEPA
0.99 0.89 0.76 United
0.81 0.71 0.76 Geisinger
1.03 1.04 0.71 Highmark HMO
1.24 0.97 0.67 Aetna
0.92 0.77 0.65 CBC
PA CHIP HEDIS 2016 Comprehensive Performance Report Page 33 of 89 Draft Version: 12/19/2016
Figure 14: Inpatient Utilization General Hospital/Acute Care – Total Discharges/1000 MM Ages <1-19 Years
- Inverted measure (lower rates indicate better performance)
Total Inpatient Utilization – Average Length of Stay
IPU Total ALOS <1-19 Years: Results
Table 2.22
IPU Total ALOS Ages <1 – 19 Years HEDIS 2016
PA CHIP Average 3.37
PA Medicaid Average* 5.00
Quality Compass Percentile Benchmark Met – National** NA
Quality Compass Percentile Benchmark Met – Regional** NA
* Calculated for comparison with CHIP rates
** Medicaid benchmarks are not available for the <1-19 age range
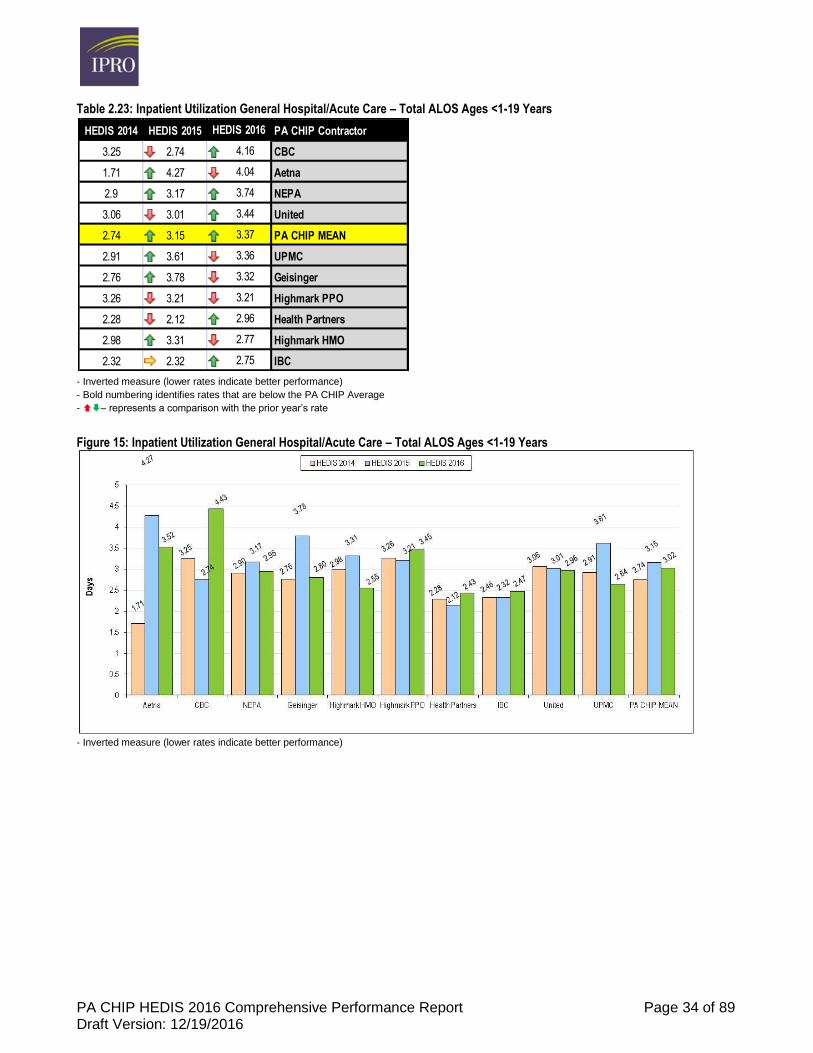
IPU Total ALOS <1-19 Years: Analysis
The PA CHIP HEDIS® 2016 Total Inpatient Discharges Average Length of Stay (ALOS) for children
less than one to 19 years old at 3.37 days was 0.22 days above the HEDIS® 2015 rate of 3.15 days.
Ten PA CHIP contractors reported rates for this measure. Five contractors reported decreased
average length of stay, and five contractors reported increased average length of stay from HEDIS®
2015 to HEDIS® 2016 . Total inpatient average length of stay ranged from a low of 2.75 days to a high
of 4.16 days.
PA CHIP HEDIS 2016 Comprehensive Performance Report Page 34 of 89 Draft Version: 12/19/2016
Table 2.23: Inpatient Utilization General Hospital/Acute Care – Total ALOS Ages <1-19 Years
- Inverted measure (lower rates indicate better performance)
- Bold numbering identifies rates that are below the PA CHIP Average
- – represents a comparison with the prior year’s rate
Figure 15: Inpatient Utilization General Hospital/Acute Care – Total ALOS Ages <1-19 Years
- Inverted measure (lower rates indicate better performance)
HEDIS 2014 HEDIS 2015 HEDIS 2016 PA CHIP Contractor
3.25 2.74 4.16 CBC
1.71 4.27 4.04 Aetna
2.9 3.17 3.74 NEPA
3.06 3.01 3.44 United
2.74 3.15 3.37 PA CHIP MEAN
2.91 3.61 3.36 UPMC
2.76 3.78 3.32 Geisinger
3.26 3.21 3.21 Highmark PPO
2.28 2.12 2.96 Health Partners
2.98 3.31 2.77 Highmark HMO
2.32 2.32 2.75 IBC
PA CHIP HEDIS 2016 Comprehensive Performance Report Page 35 of 89 Draft Version: 12/19/2016
IDENTIFICATION OF ALCOHOL AND OTHER DRUG SERVICES (IAD)
Measure Description
Identification of alcohol and other drug services reports the number and percentage of members zero
to 12 years old and 13 to 17 years old with an alcohol and other drug (AOD) claim, who received any
service, inpatient, intensive outpatient or partial hospitalization or outpatient or emergency department
chemical dependency services during the measurement year.
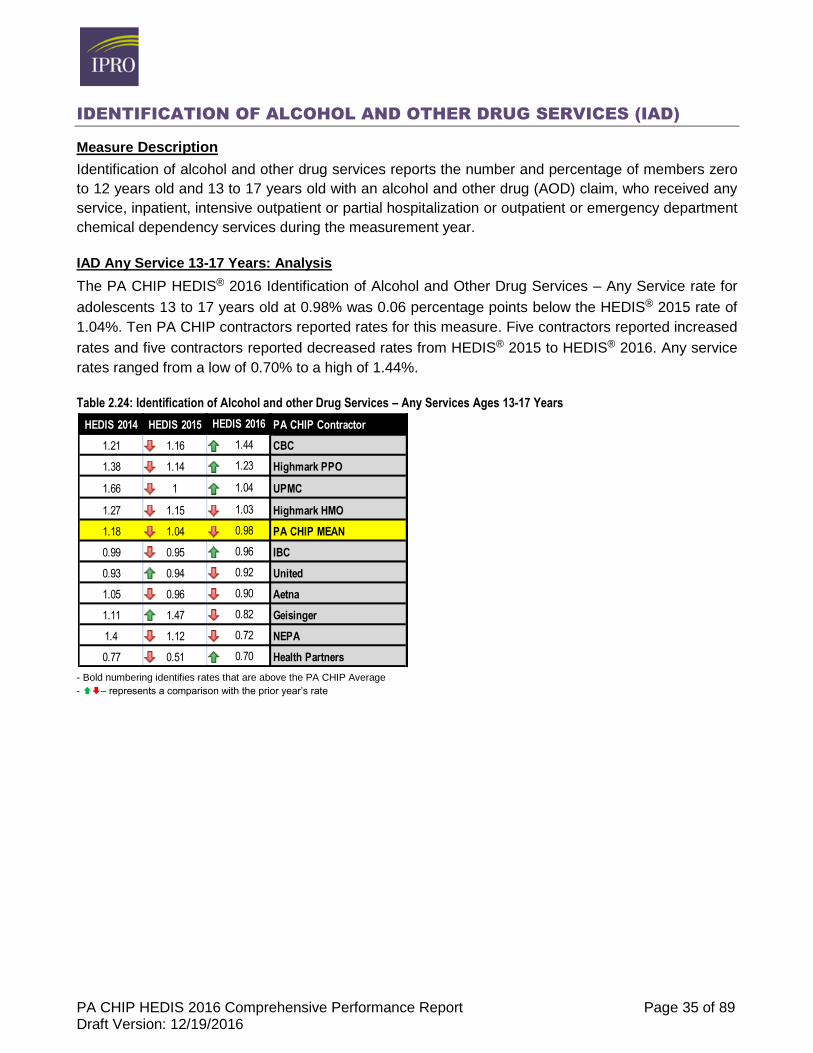
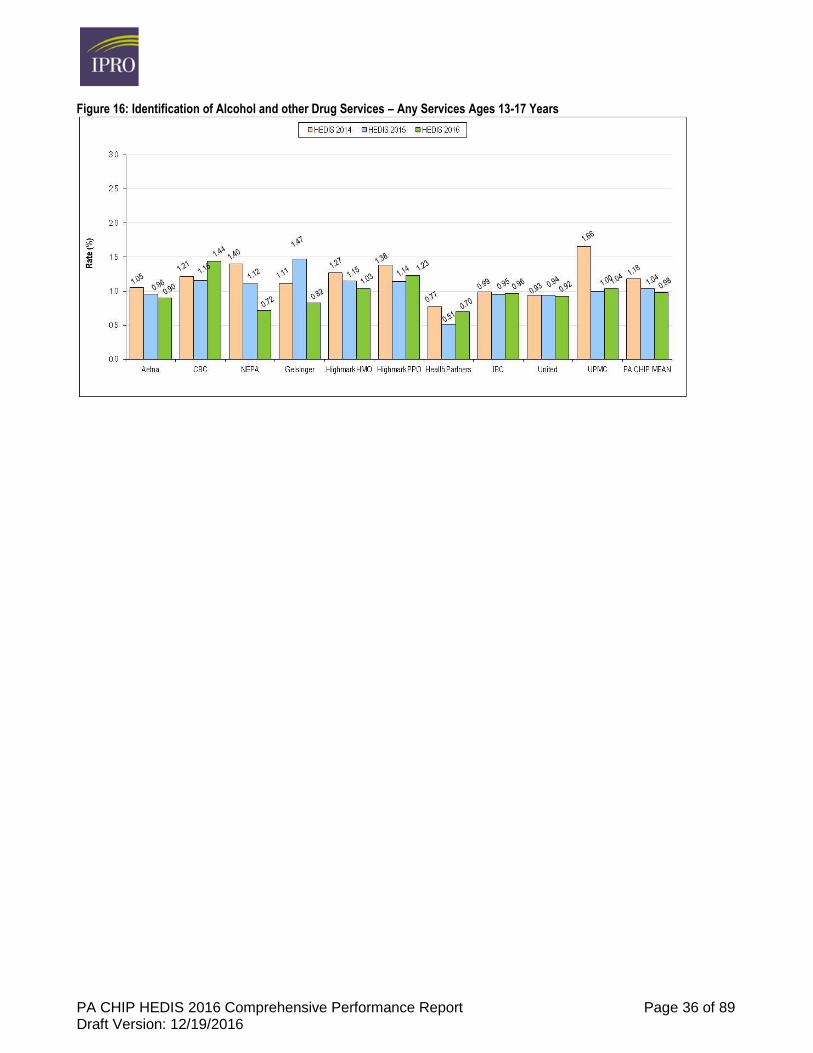
IAD Any Service 13-17 Years: Analysis
The PA CHIP HEDIS® 2016 Identification of Alcohol and Other Drug Services – Any Service rate for
adolescents 13 to 17 years old at 0.98% was 0.06 percentage points below the HEDIS® 2015 rate of
1.04%. Ten PA CHIP contractors reported rates for this measure. Five contractors reported increased
rates and five contractors reported decreased rates from HEDIS® 2015 to HEDIS® 2016. Any service
rates ranged from a low of 0.70% to a high of 1.44%.
Table 2.24: Identification of Alcohol and other Drug Services – Any Services Ages 13-17 Years
- Bold numbering identifies rates that are above the PA CHIP Average
- – represents a comparison with the prior year’s rate
HEDIS 2014 HEDIS 2015 HEDIS 2016 PA CHIP Contractor
1.21 1.16 1.44 CBC
1.38 1.14 1.23 Highmark PPO
1.66 1 1.04 UPMC
1.27 1.15 1.03 Highmark HMO
1.18 1.04 0.98 PA CHIP MEAN
0.99 0.95 0.96 IBC
0.93 0.94 0.92 United
1.05 0.96 0.90 Aetna
1.11 1.47 0.82 Geisinger
1.4 1.12 0.72 NEPA
0.77 0.51 0.70 Health Partners
PA CHIP HEDIS 2016 Comprehensive Performance Report Page 36 of 89 Draft Version: 12/19/2016
Figure 16: Identification of Alcohol and other Drug Services – Any Services Ages 13-17 Years
PA CHIP HEDIS 2016 Comprehensive Performance Report Page 37 of 89 Draft Version: 12/19/2016
MENTAL HEALTH UTILIZATION (MPT)
Measure Description
The Mental Health Utilization measure reports the number and percentage of members who received
any mental health service including inpatient, intensive outpatient or partial hospitalization and
outpatient or emergency department services during the measurement year.
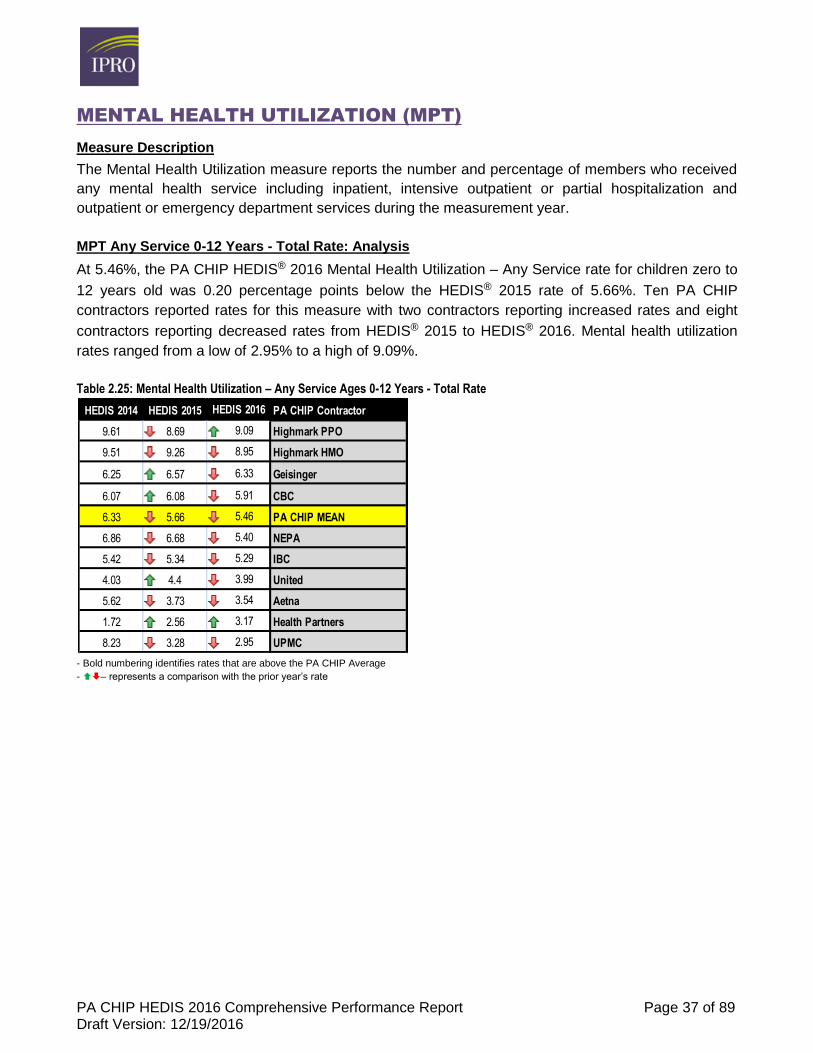
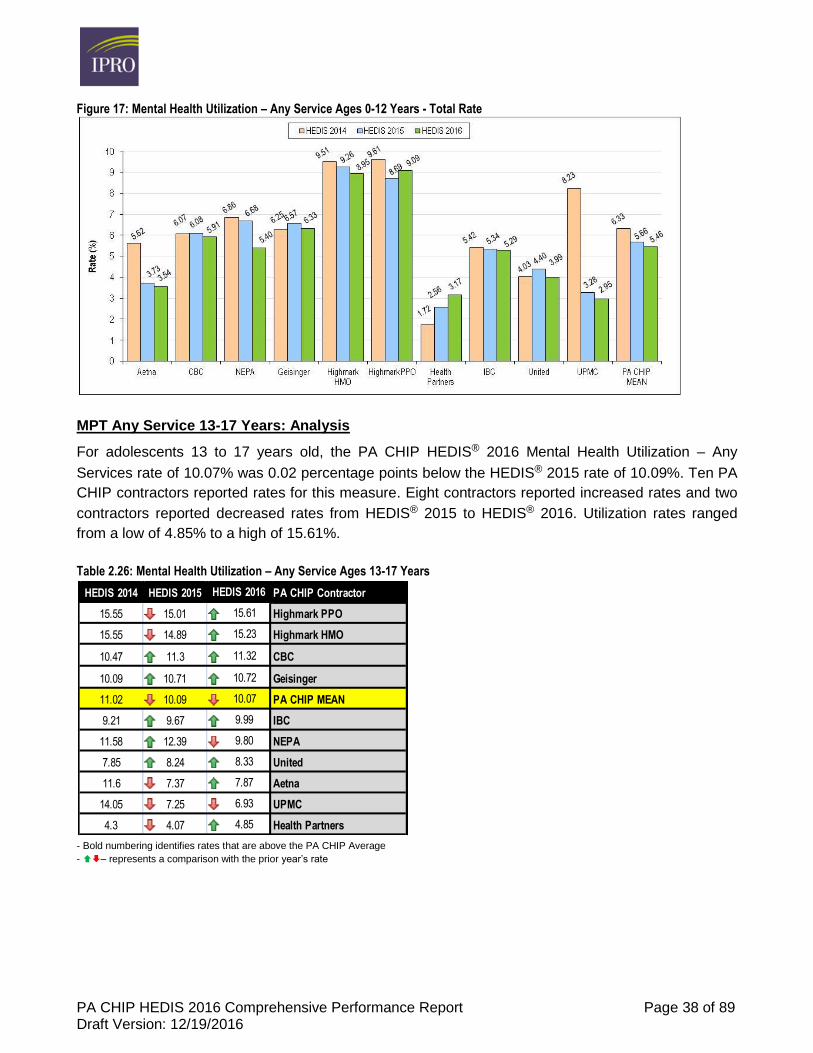
MPT Any Service 0-12 Years - Total Rate: Analysis
At 5.46%, the PA CHIP HEDIS® 2016 Mental Health Utilization – Any Service rate for children zero to
12 years old was 0.20 percentage points below the HEDIS® 2015 rate of 5.66%. Ten PA CHIP
contractors reported rates for this measure with two contractors reporting increased rates and eight
contractors reporting decreased rates from HEDIS® 2015 to HEDIS® 2016. Mental health utilization
rates ranged from a low of 2.95% to a high of 9.09%.
Table 2.25: Mental Health Utilization – Any Service Ages 0-12 Years - Total Rate
- Bold numbering identifies rates that are above the PA CHIP Average
- – represents a comparison with the prior year’s rate
HEDIS 2014 HEDIS 2015 HEDIS 2016 PA CHIP Contractor
9.61 8.69 9.09 Highmark PPO
9.51 9.26 8.95 Highmark HMO
6.25 6.57 6.33 Geisinger
6.07 6.08 5.91 CBC
6.33 5.66 5.46 PA CHIP MEAN
6.86 6.68 5.40 NEPA
5.42 5.34 5.29 IBC
4.03 4.4 3.99 United
5.62 3.73 3.54 Aetna
1.72 2.56 3.17 Health Partners
8.23 3.28 2.95 UPMC
PA CHIP HEDIS 2016 Comprehensive Performance Report Page 38 of 89 Draft Version: 12/19/2016
Figure 17: Mental Health Utilization – Any Service Ages 0-12 Years - Total Rate
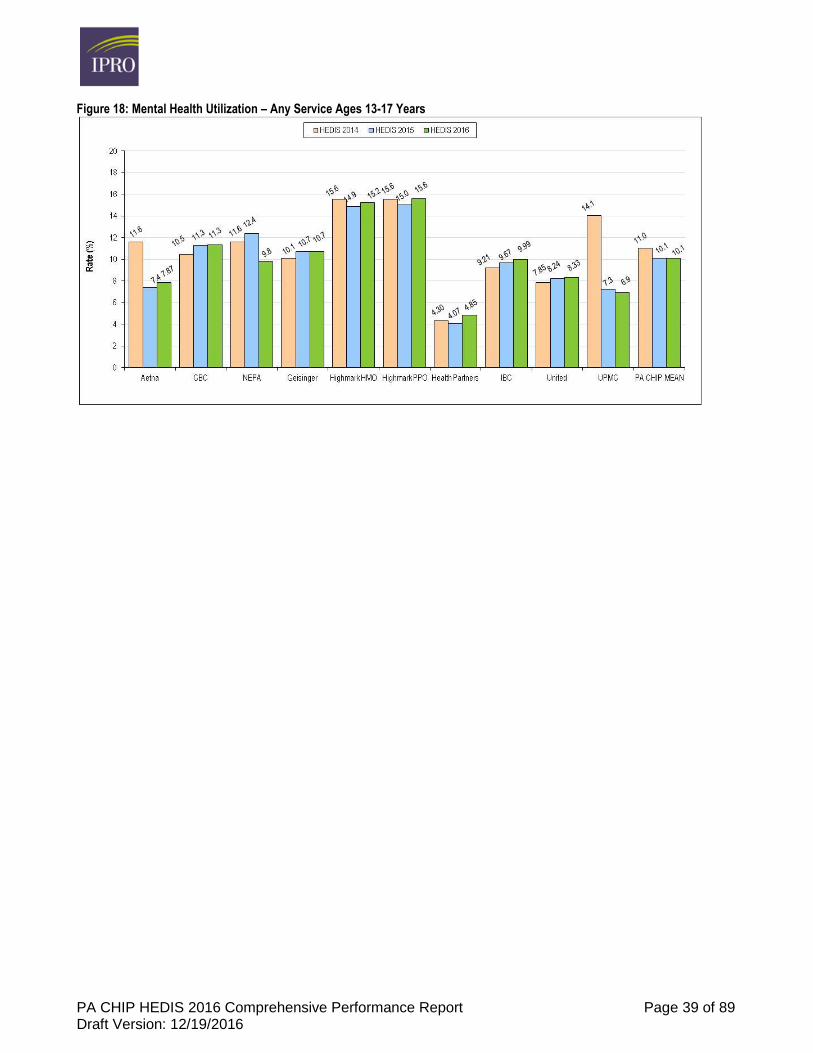
MPT Any Service 13-17 Years: Analysis
For adolescents 13 to 17 years old, the PA CHIP HEDIS® 2016 Mental Health Utilization – Any
Services rate of 10.07% was 0.02 percentage points below the HEDIS® 2015 rate of 10.09%. Ten PA
CHIP contractors reported rates for this measure. Eight contractors reported increased rates and two
contractors reported decreased rates from HEDIS® 2015 to HEDIS® 2016. Utilization rates ranged
from a low of 4.85% to a high of 15.61%.
Table 2.26: Mental Health Utilization – Any Service Ages 13-17 Years
- Bold numbering identifies rates that are above the PA CHIP Average
- – represents a comparison with the prior year’s rate
HEDIS 2014 HEDIS 2015 HEDIS 2016 PA CHIP Contractor
15.55 15.01 15.61 Highmark PPO
15.55 14.89 15.23 Highmark HMO
10.47 11.3 11.32 CBC
10.09 10.71 10.72 Geisinger
11.02 10.09 10.07 PA CHIP MEAN
9.21 9.67 9.99 IBC
11.58 12.39 9.80 NEPA
7.85 8.24 8.33 United
11.6 7.37 7.87 Aetna
14.05 7.25 6.93 UPMC
4.3 4.07 4.85 Health Partners
PA CHIP HEDIS 2016 Comprehensive Performance Report Page 39 of 89 Draft Version: 12/19/2016
Figure 18: Mental Health Utilization – Any Service Ages 13-17 Years
PA CHIP HEDIS 2016 Comprehensive Performance Report Page 40 of 89 Draft Version: 12/19/2016
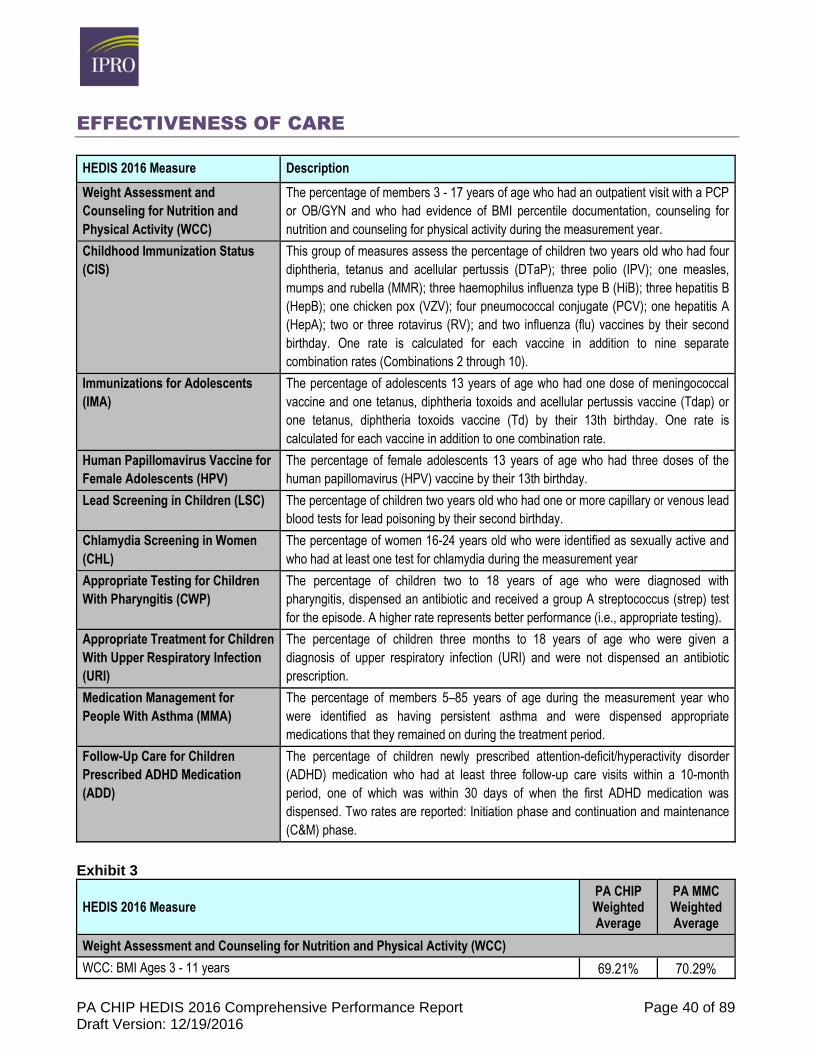
EFFECTIVENESS OF CARE
HEDIS 2016 Measure Description
Weight Assessment and
Counseling for Nutrition and
Physical Activity (WCC)
The percentage of members 3 - 17 years of age who had an outpatient visit with a PCP
or OB/GYN and who had evidence of BMI percentile documentation, counseling for
nutrition and counseling for physical activity during the measurement year.
Childhood Immunization Status
(CIS)
This group of measures assess the percentage of children two years old who had four
diphtheria, tetanus and acellular pertussis (DTaP); three polio (IPV); one measles,
mumps and rubella (MMR); three haemophilus influenza type B (HiB); three hepatitis B
(HepB); one chicken pox (VZV); four pneumococcal conjugate (PCV); one hepatitis A
(HepA); two or three rotavirus (RV); and two influenza (flu) vaccines by their second
birthday. One rate is calculated for each vaccine in addition to nine separate
combination rates (Combinations 2 through 10).
Immunizations for Adolescents
(IMA)
The percentage of adolescents 13 years of age who had one dose of meningococcal
vaccine and one tetanus, diphtheria toxoids and acellular pertussis vaccine (Tdap) or
one tetanus, diphtheria toxoids vaccine (Td) by their 13th birthday. One rate is
calculated for each vaccine in addition to one combination rate.
Human Papillomavirus Vaccine for
Female Adolescents (HPV)
The percentage of female adolescents 13 years of age who had three doses of the
human papillomavirus (HPV) vaccine by their 13th birthday.
Lead Screening in Children (LSC) The percentage of children two years old who had one or more capillary or venous lead
blood tests for lead poisoning by their second birthday.
Chlamydia Screening in Women
(CHL)
The percentage of women 16-24 years old who were identified as sexually active and
who had at least one test for chlamydia during the measurement year
Appropriate Testing for Children
With Pharyngitis (CWP)
The percentage of children two to 18 years of age who were diagnosed with
pharyngitis, dispensed an antibiotic and received a group A streptococcus (strep) test
for the episode. A higher rate represents better performance (i.e., appropriate testing).
Appropriate Treatment for Children
With Upper Respiratory Infection
(URI)
The percentage of children three months to 18 years of age who were given a
diagnosis of upper respiratory infection (URI) and were not dispensed an antibiotic
prescription.
Medication Management for
People With Asthma (MMA)
The percentage of members 5–85 years of age during the measurement year who
were identified as having persistent asthma and were dispensed appropriate
medications that they remained on during the treatment period.
Follow-Up Care for Children
Prescribed ADHD Medication
(ADD)
The percentage of children newly prescribed attention-deficit/hyperactivity disorder
(ADHD) medication who had at least three follow-up care visits within a 10-month
period, one of which was within 30 days of when the first ADHD medication was
dispensed. Two rates are reported: Initiation phase and continuation and maintenance
(C&M) phase.
Exhibit 3
HEDIS 2016 Measure PA CHIP Weighted Average
PA MMC Weighted Average
Weight Assessment and Counseling for Nutrition and Physical Activity (WCC)
WCC: BMI Ages 3 - 11 years 69.21% 70.29%
PA CHIP HEDIS 2016 Comprehensive Performance Report Page 41 of 89 Draft Version: 12/19/2016
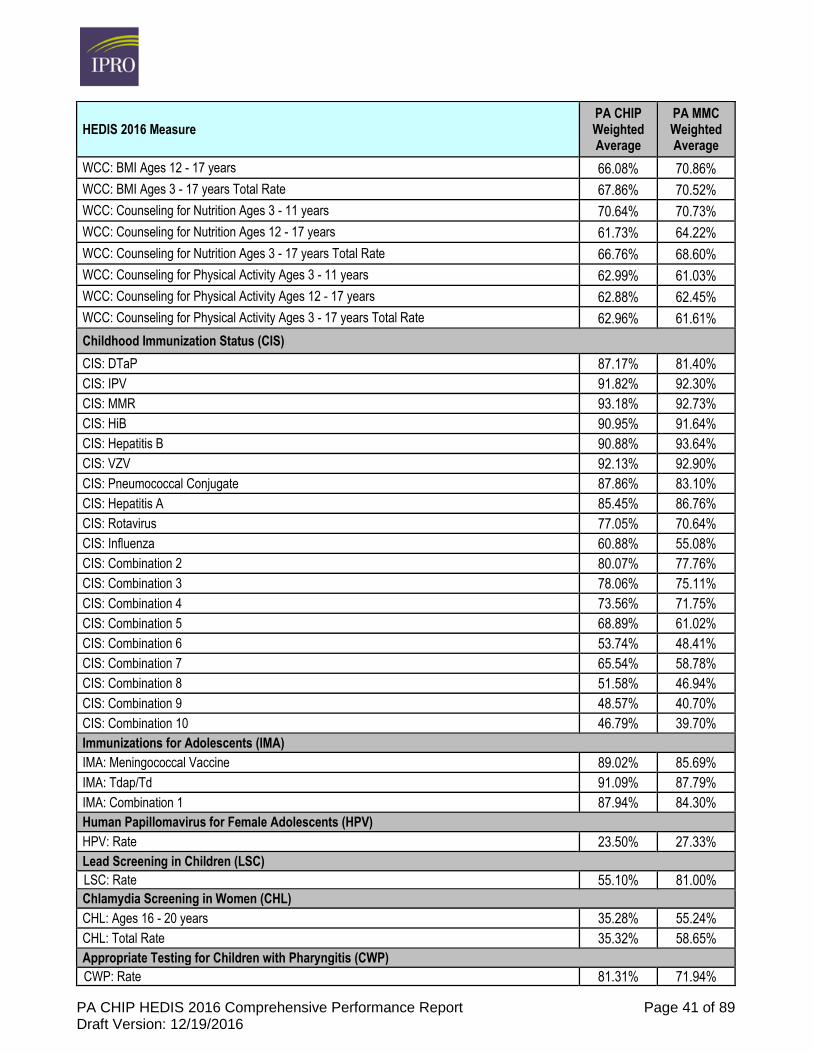
HEDIS 2016 Measure PA CHIP Weighted Average
PA MMC Weighted Average
WCC: BMI Ages 12 - 17 years 66.08% 70.86%
WCC: BMI Ages 3 - 17 years Total Rate 67.86% 70.52%
WCC: Counseling for Nutrition Ages 3 - 11 years 70.64% 70.73%
WCC: Counseling for Nutrition Ages 12 - 17 years 61.73% 64.22%
WCC: Counseling for Nutrition Ages 3 - 17 years Total Rate 66.76% 68.60%
WCC: Counseling for Physical Activity Ages 3 - 11 years 62.99% 61.03%
WCC: Counseling for Physical Activity Ages 12 - 17 years 62.88% 62.45%
WCC: Counseling for Physical Activity Ages 3 - 17 years Total Rate 62.96% 61.61%
Childhood Immunization Status (CIS)
CIS: DTaP 87.17% 81.40%
CIS: IPV 91.82% 92.30%
CIS: MMR 93.18% 92.73%
CIS: HiB 90.95% 91.64%
CIS: Hepatitis B 90.88% 93.64%
CIS: VZV 92.13% 92.90%
CIS: Pneumococcal Conjugate 87.86% 83.10%
CIS: Hepatitis A 85.45% 86.76%
CIS: Rotavirus 77.05% 70.64%
CIS: Influenza 60.88% 55.08%
CIS: Combination 2 80.07% 77.76%
CIS: Combination 3 78.06% 75.11%
CIS: Combination 4 73.56% 71.75%
CIS: Combination 5 68.89% 61.02%
CIS: Combination 6 53.74% 48.41%
CIS: Combination 7 65.54% 58.78%
CIS: Combination 8 51.58% 46.94%
CIS: Combination 9 48.57% 40.70%
CIS: Combination 10 46.79% 39.70%
Immunizations for Adolescents (IMA)
IMA: Meningococcal Vaccine 89.02% 85.69%
IMA: Tdap/Td 91.09% 87.79%
IMA: Combination 1 87.94% 84.30%
Human Papillomavirus for Female Adolescents (HPV)
HPV: Rate 23.50% 27.33%
Lead Screening in Children (LSC)
LSC: Rate 55.10% 81.00%
Chlamydia Screening in Women (CHL)
CHL: Ages 16 - 20 years 35.28% 55.24%
CHL: Total Rate 35.32% 58.65%
Appropriate Testing for Children with Pharyngitis (CWP)
CWP: Rate 81.31% 71.94%
PA CHIP HEDIS 2016 Comprehensive Performance Report Page 42 of 89 Draft Version: 12/19/2016
HEDIS 2016 Measure PA CHIP Weighted Average
PA MMC Weighted Average
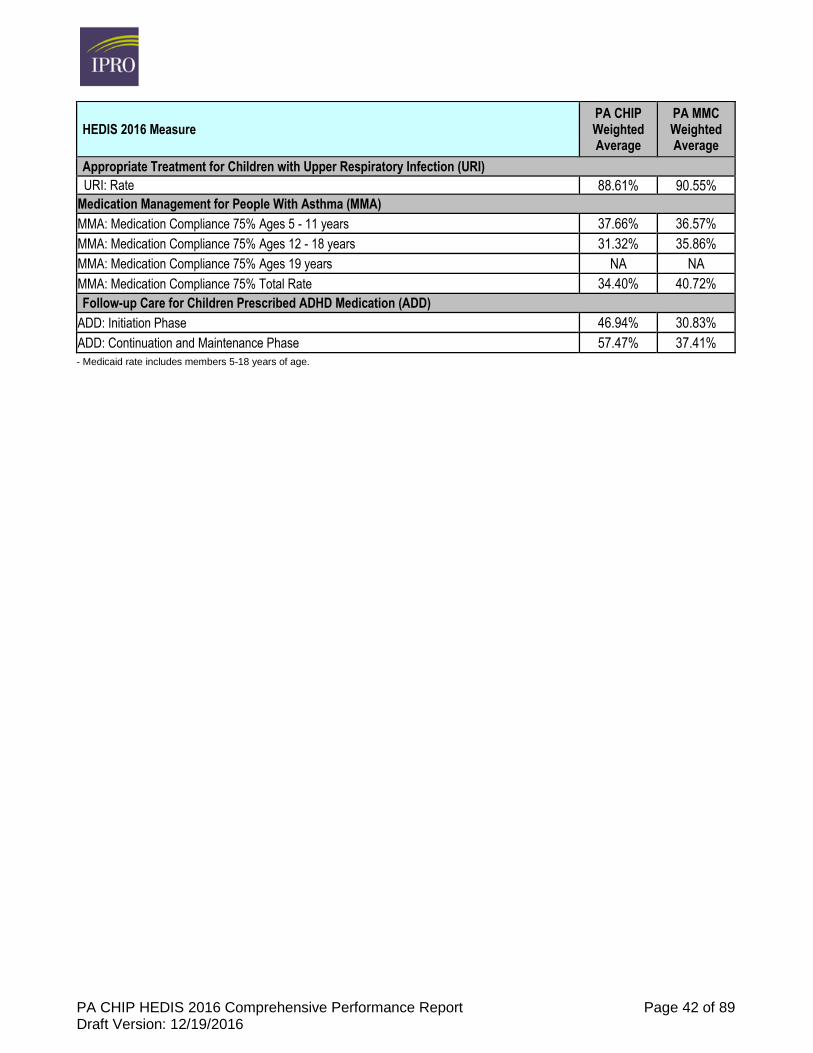
Appropriate Treatment for Children with Upper Respiratory Infection (URI)
URI: Rate 88.61% 90.55%
Medication Management for People With Asthma (MMA)
MMA: Medication Compliance 75% Ages 5 - 11 years 37.66% 36.57%
MMA: Medication Compliance 75% Ages 12 - 18 years 31.32% 35.86%
MMA: Medication Compliance 75% Ages 19 years NA NA
MMA: Medication Compliance 75% Total Rate 34.40% 40.72%
Follow-up Care for Children Prescribed ADHD Medication (ADD)
ADD: Initiation Phase 46.94% 30.83%
ADD: Continuation and Maintenance Phase 57.47% 37.41%
- Medicaid rate includes members 5-18 years of age.
PA CHIP HEDIS 2016 Comprehensive Performance Report Page 43 of 89 Draft Version: 12/19/2016
WEIGHT ASSESSMENT AND COUNSELING FOR NUTRITION AND
PHYSICAL ACTIVITY (WCC)
Measure Description
This set of measures assesses the percentage of members 3-17 years old who had an outpatient visit
with a PCP or OB/GYN and who had evidence of Body Mass Index (BMI) percentile documentation,
counseling for nutrition and counseling for physical activity during the measurement year.
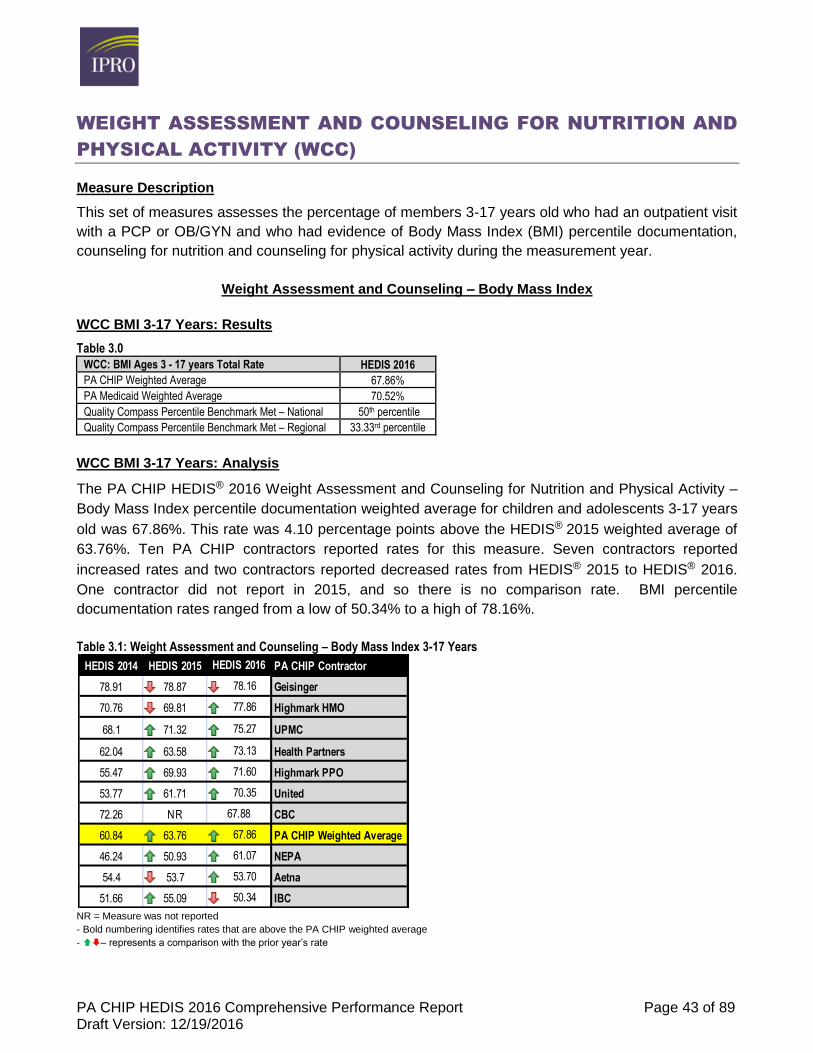
Weight Assessment and Counseling – Body Mass Index
WCC BMI 3-17 Years: Results
Table 3.0
WCC: BMI Ages 3 - 17 years Total Rate HEDIS 2016
PA CHIP Weighted Average 67.86%
PA Medicaid Weighted Average 70.52%
Quality Compass Percentile Benchmark Met – National 50th percentile
Quality Compass Percentile Benchmark Met – Regional 33.33rd percentile
WCC BMI 3-17 Years: Analysis
The PA CHIP HEDIS® 2016 Weight Assessment and Counseling for Nutrition and Physical Activity –
Body Mass Index percentile documentation weighted average for children and adolescents 3-17 years
old was 67.86%. This rate was 4.10 percentage points above the HEDIS® 2015 weighted average of
63.76%. Ten PA CHIP contractors reported rates for this measure. Seven contractors reported
increased rates and two contractors reported decreased rates from HEDIS® 2015 to HEDIS® 2016.
One contractor did not report in 2015, and so there is no comparison rate. BMI percentile
documentation rates ranged from a low of 50.34% to a high of 78.16%.
Table 3.1: Weight Assessment and Counseling – Body Mass Index 3-17 Years
NR = Measure was not reported
- Bold numbering identifies rates that are above the PA CHIP weighted average
- – represents a comparison with the prior year’s rate
HEDIS 2014 HEDIS 2015 HEDIS 2016 PA CHIP Contractor
78.91 78.87 78.16 Geisinger
70.76 69.81 77.86 Highmark HMO
68.1 71.32 75.27 UPMC
62.04 63.58 73.13 Health Partners
55.47 69.93 71.60 Highmark PPO
53.77 61.71 70.35 United
72.26 NR 67.88 CBC
60.84 63.76 67.86 PA CHIP Weighted Average
46.24 50.93 61.07 NEPA
54.4 53.7 53.70 Aetna
51.66 55.09 50.34 IBC
PA CHIP HEDIS 2016 Comprehensive Performance Report Page 44 of 89 Draft Version: 12/19/2016
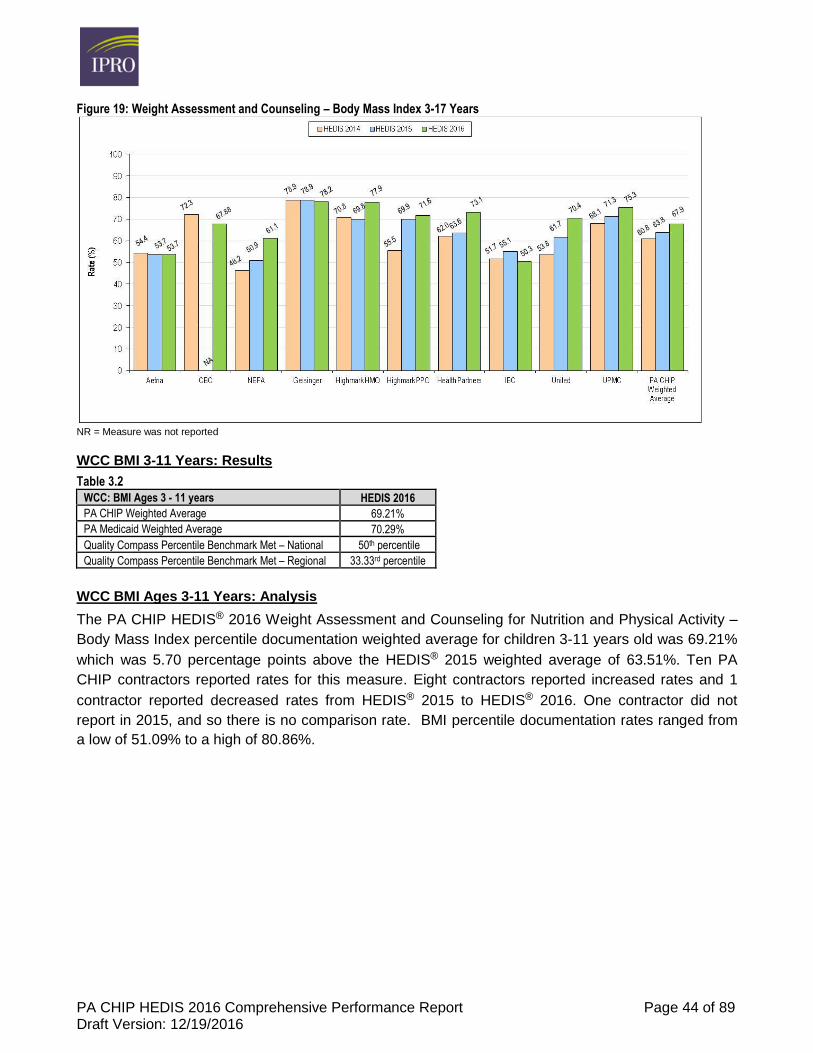
Figure 19: Weight Assessment and Counseling – Body Mass Index 3-17 Years
NR = Measure was not reported
WCC BMI 3-11 Years: Results
Table 3.2
WCC: BMI Ages 3 - 11 years HEDIS 2016
PA CHIP Weighted Average 69.21%
PA Medicaid Weighted Average 70.29%
Quality Compass Percentile Benchmark Met – National 50th percentile
Quality Compass Percentile Benchmark Met – Regional 33.33rd percentile
WCC BMI Ages 3-11 Years: Analysis
The PA CHIP HEDIS® 2016 Weight Assessment and Counseling for Nutrition and Physical Activity –
Body Mass Index percentile documentation weighted average for children 3-11 years old was 69.21%
which was 5.70 percentage points above the HEDIS® 2015 weighted average of 63.51%. Ten PA
CHIP contractors reported rates for this measure. Eight contractors reported increased rates and 1
contractor reported decreased rates from HEDIS® 2015 to HEDIS® 2016. One contractor did not
report in 2015, and so there is no comparison rate. BMI percentile documentation rates ranged from
a low of 51.09% to a high of 80.86%.
PA CHIP HEDIS 2016 Comprehensive Performance Report Page 45 of 89 Draft Version: 12/19/2016
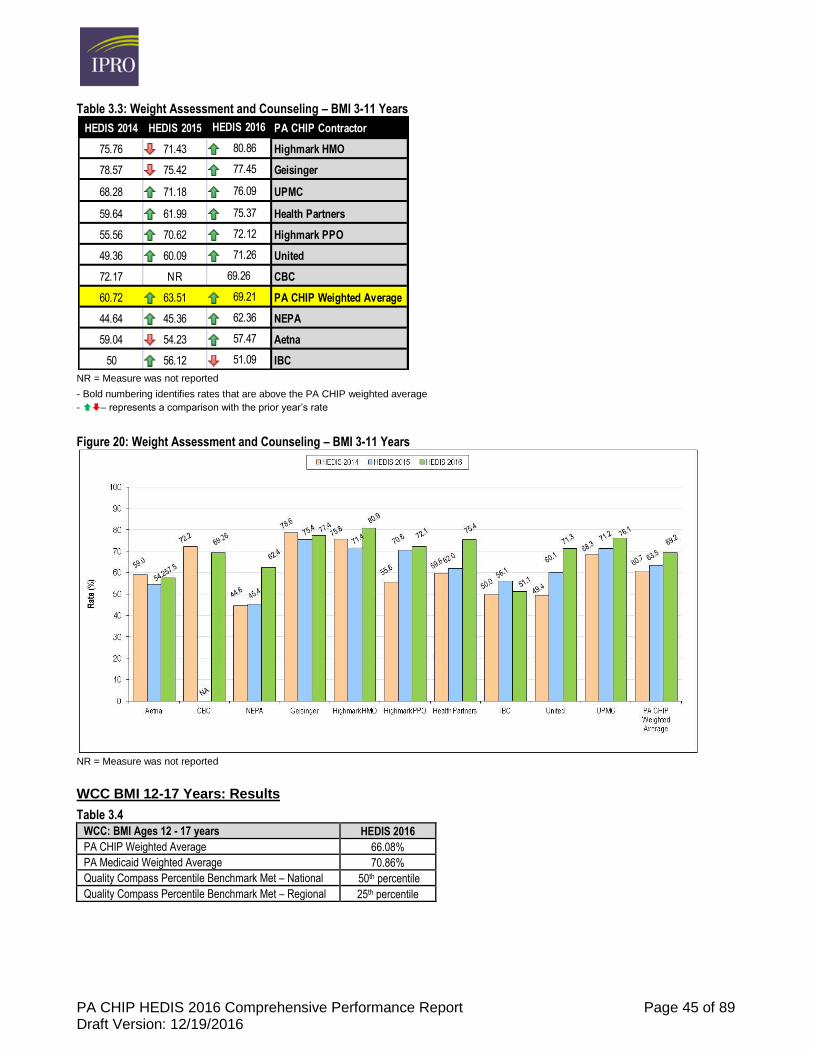
Table 3.3: Weight Assessment and Counseling – BMI 3-11 Years
NR = Measure was not reported
- Bold numbering identifies rates that are above the PA CHIP weighted average
- – represents a comparison with the prior year’s rate
Figure 20: Weight Assessment and Counseling – BMI 3-11 Years
NR = Measure was not reported
WCC BMI 12-17 Years: Results
Table 3.4
WCC: BMI Ages 12 - 17 years HEDIS 2016
PA CHIP Weighted Average 66.08%
PA Medicaid Weighted Average 70.86%
Quality Compass Percentile Benchmark Met – National 50th percentile
Quality Compass Percentile Benchmark Met – Regional 25th percentile
HEDIS 2014 HEDIS 2015 HEDIS 2016 PA CHIP Contractor
75.76 71.43 80.86 Highmark HMO
78.57 75.42 77.45 Geisinger
68.28 71.18 76.09 UPMC
59.64 61.99 75.37 Health Partners
55.56 70.62 72.12 Highmark PPO
49.36 60.09 71.26 United
72.17 NR 69.26 CBC
60.72 63.51 69.21 PA CHIP Weighted Average
44.64 45.36 62.36 NEPA
59.04 54.23 57.47 Aetna
50 56.12 51.09 IBC
PA CHIP HEDIS 2016 Comprehensive Performance Report Page 46 of 89 Draft Version: 12/19/2016
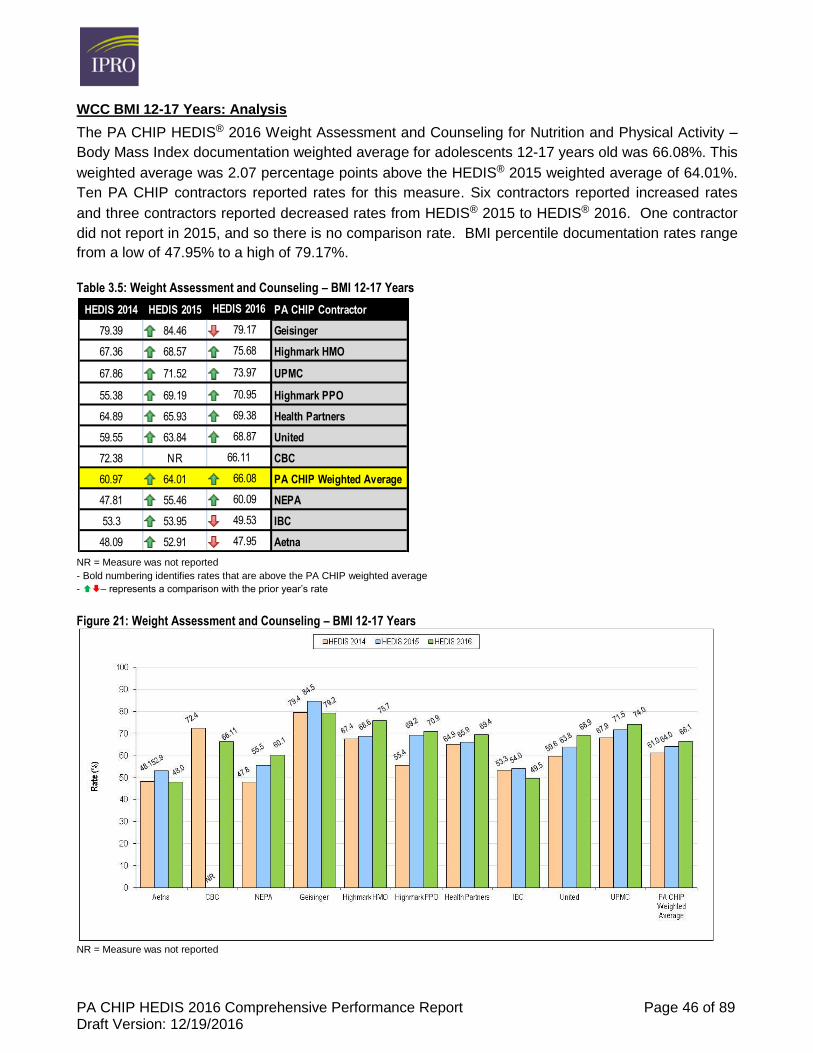
WCC BMI 12-17 Years: Analysis
The PA CHIP HEDIS® 2016 Weight Assessment and Counseling for Nutrition and Physical Activity –
Body Mass Index documentation weighted average for adolescents 12-17 years old was 66.08%. This
weighted average was 2.07 percentage points above the HEDIS® 2015 weighted average of 64.01%.
Ten PA CHIP contractors reported rates for this measure. Six contractors reported increased rates
and three contractors reported decreased rates from HEDIS® 2015 to HEDIS® 2016. One contractor
did not report in 2015, and so there is no comparison rate. BMI percentile documentation rates range
from a low of 47.95% to a high of 79.17%.
Table 3.5: Weight Assessment and Counseling – BMI 12-17 Years
NR = Measure was not reported
- Bold numbering identifies rates that are above the PA CHIP weighted average
- – represents a comparison with the prior year’s rate
Figure 21: Weight Assessment and Counseling – BMI 12-17 Years
NR = Measure was not reported
HEDIS 2014 HEDIS 2015 HEDIS 2016 PA CHIP Contractor
79.39 84.46 79.17 Geisinger
67.36 68.57 75.68 Highmark HMO
67.86 71.52 73.97 UPMC
55.38 69.19 70.95 Highmark PPO
64.89 65.93 69.38 Health Partners
59.55 63.84 68.87 United
72.38 NR 66.11 CBC
60.97 64.01 66.08 PA CHIP Weighted Average
47.81 55.46 60.09 NEPA
53.3 53.95 49.53 IBC
48.09 52.91 47.95 Aetna
PA CHIP HEDIS 2016 Comprehensive Performance Report Page 47 of 89 Draft Version: 12/19/2016
Weight Assessment and Counseling – Nutrition
WCC Nutrition 3-17 Years: Results
Table 3.6
WCC: Nutrition Ages 3 - 17 years Total Rate HEDIS 2016
PA CHIP Weighted Average 66.76%
PA Medicaid Weighted Average 68.60%
Quality Compass Percentile Benchmark Met – National 50th percentile
Quality Compass Percentile Benchmark Met – Regional 25th percentile
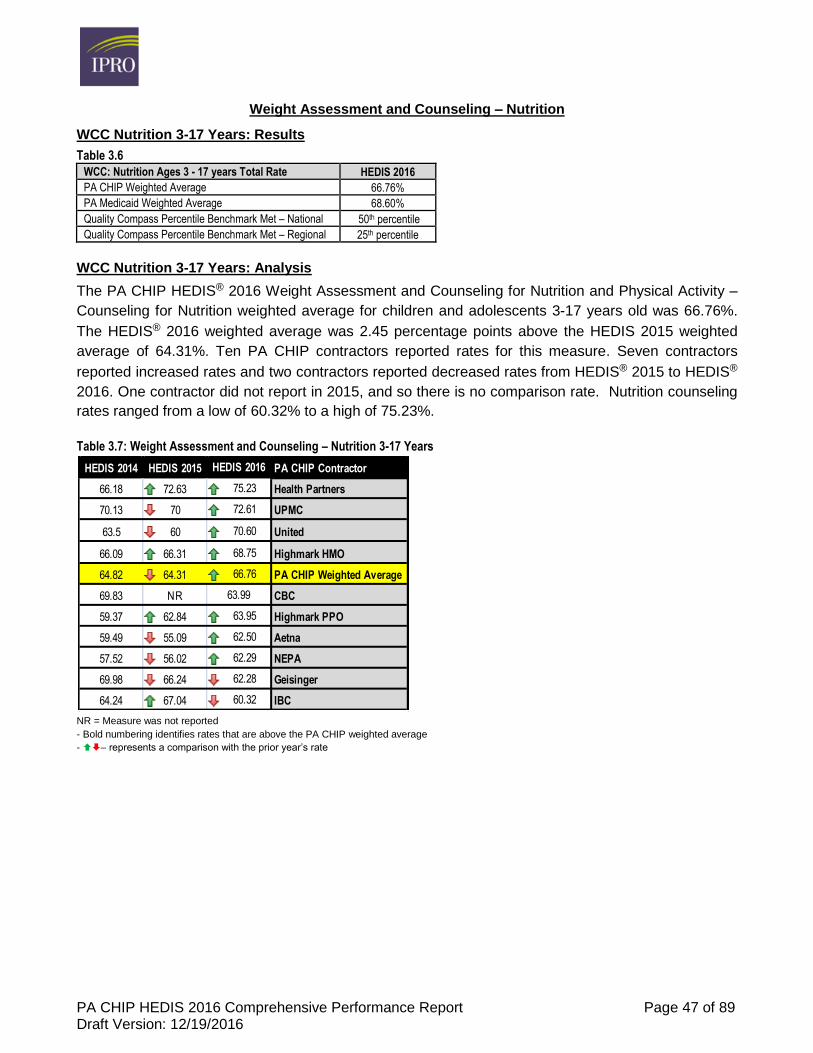
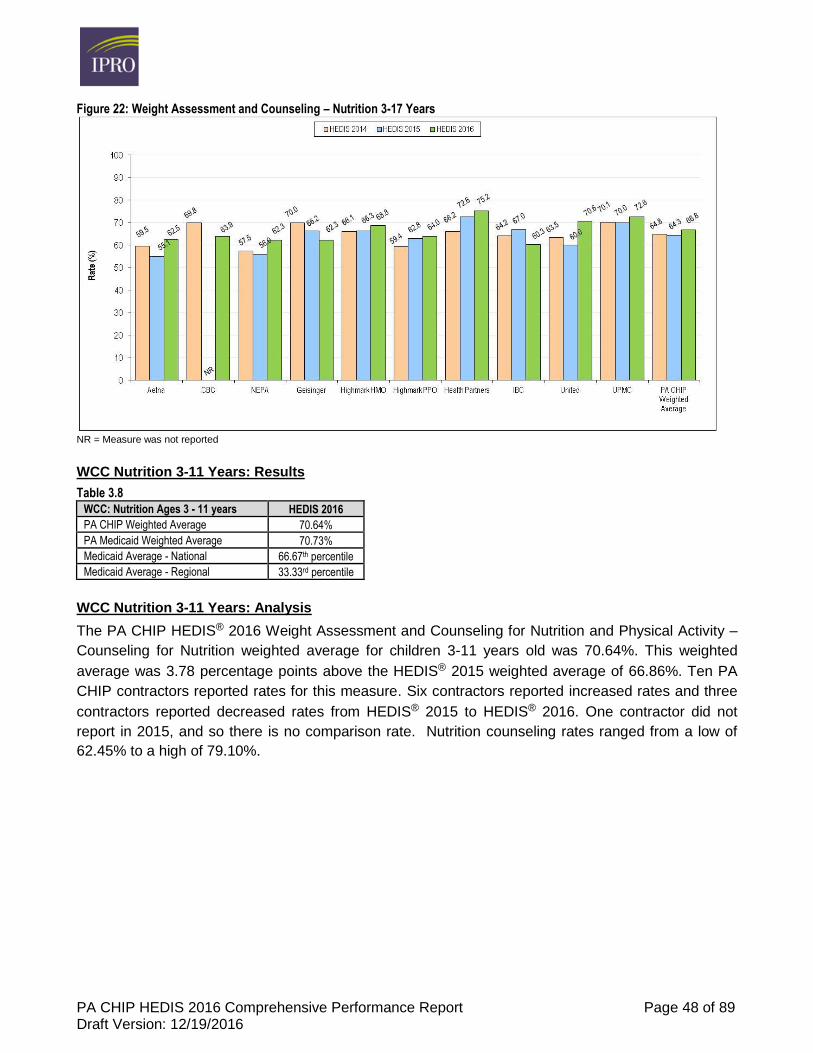
WCC Nutrition 3-17 Years: Analysis
The PA CHIP HEDIS® 2016 Weight Assessment and Counseling for Nutrition and Physical Activity –
Counseling for Nutrition weighted average for children and adolescents 3-17 years old was 66.76%.
The HEDIS® 2016 weighted average was 2.45 percentage points above the HEDIS 2015 weighted
average of 64.31%. Ten PA CHIP contractors reported rates for this measure. Seven contractors
reported increased rates and two contractors reported decreased rates from HEDIS® 2015 to HEDIS®
2016. One contractor did not report in 2015, and so there is no comparison rate. Nutrition counseling
rates ranged from a low of 60.32% to a high of 75.23%.
Table 3.7: Weight Assessment and Counseling – Nutrition 3-17 Years
NR = Measure was not reported
- Bold numbering identifies rates that are above the PA CHIP weighted average
- – represents a comparison with the prior year’s rate
HEDIS 2014 HEDIS 2015 HEDIS 2016 PA CHIP Contractor
66.18 72.63 75.23 Health Partners
70.13 70 72.61 UPMC
63.5 60 70.60 United
66.09 66.31 68.75 Highmark HMO
64.82 64.31 66.76 PA CHIP Weighted Average
69.83 NR 63.99 CBC
59.37 62.84 63.95 Highmark PPO
59.49 55.09 62.50 Aetna
57.52 56.02 62.29 NEPA
69.98 66.24 62.28 Geisinger
64.24 67.04 60.32 IBC
PA CHIP HEDIS 2016 Comprehensive Performance Report Page 48 of 89 Draft Version: 12/19/2016
Figure 22: Weight Assessment and Counseling – Nutrition 3-17 Years
NR = Measure was not reported
WCC Nutrition 3-11 Years: Results
Table 3.8
WCC: Nutrition Ages 3 - 11 years HEDIS 2016
PA CHIP Weighted Average 70.64%
PA Medicaid Weighted Average 70.73%
Medicaid Average - National 66.67th percentile
Medicaid Average - Regional 33.33rd percentile
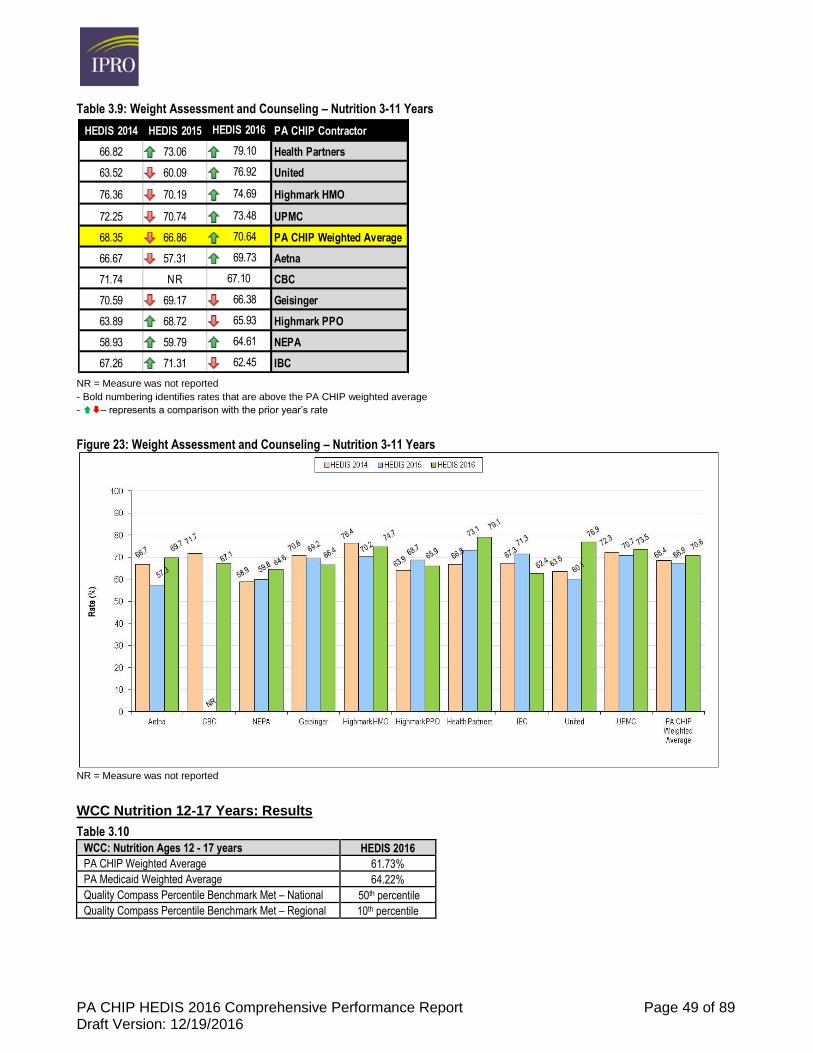
WCC Nutrition 3-11 Years: Analysis
The PA CHIP HEDIS® 2016 Weight Assessment and Counseling for Nutrition and Physical Activity –
Counseling for Nutrition weighted average for children 3-11 years old was 70.64%. This weighted
average was 3.78 percentage points above the HEDIS® 2015 weighted average of 66.86%. Ten PA
CHIP contractors reported rates for this measure. Six contractors reported increased rates and three
contractors reported decreased rates from HEDIS® 2015 to HEDIS® 2016. One contractor did not
report in 2015, and so there is no comparison rate. Nutrition counseling rates ranged from a low of
62.45% to a high of 79.10%.
PA CHIP HEDIS 2016 Comprehensive Performance Report Page 49 of 89 Draft Version: 12/19/2016
Table 3.9: Weight Assessment and Counseling – Nutrition 3-11 Years
NR = Measure was not reported
- Bold numbering identifies rates that are above the PA CHIP weighted average
- – represents a comparison with the prior year’s rate
Figure 23: Weight Assessment and Counseling – Nutrition 3-11 Years
NR = Measure was not reported
WCC Nutrition 12-17 Years: Results
Table 3.10
WCC: Nutrition Ages 12 - 17 years HEDIS 2016
PA CHIP Weighted Average 61.73%
PA Medicaid Weighted Average 64.22%
Quality Compass Percentile Benchmark Met – National 50th percentile
Quality Compass Percentile Benchmark Met – Regional 10th percentile
HEDIS 2014 HEDIS 2015 HEDIS 2016 PA CHIP Contractor
66.82 73.06 79.10 Health Partners
63.52 60.09 76.92 United
76.36 70.19 74.69 Highmark HMO
72.25 70.74 73.48 UPMC
68.35 66.86 70.64 PA CHIP Weighted Average
66.67 57.31 69.73 Aetna
71.74 NR 67.10 CBC
70.59 69.17 66.38 Geisinger
63.89 68.72 65.93 Highmark PPO
58.93 59.79 64.61 NEPA
67.26 71.31 62.45 IBC
PA CHIP HEDIS 2016 Comprehensive Performance Report Page 50 of 89 Draft Version: 12/19/2016
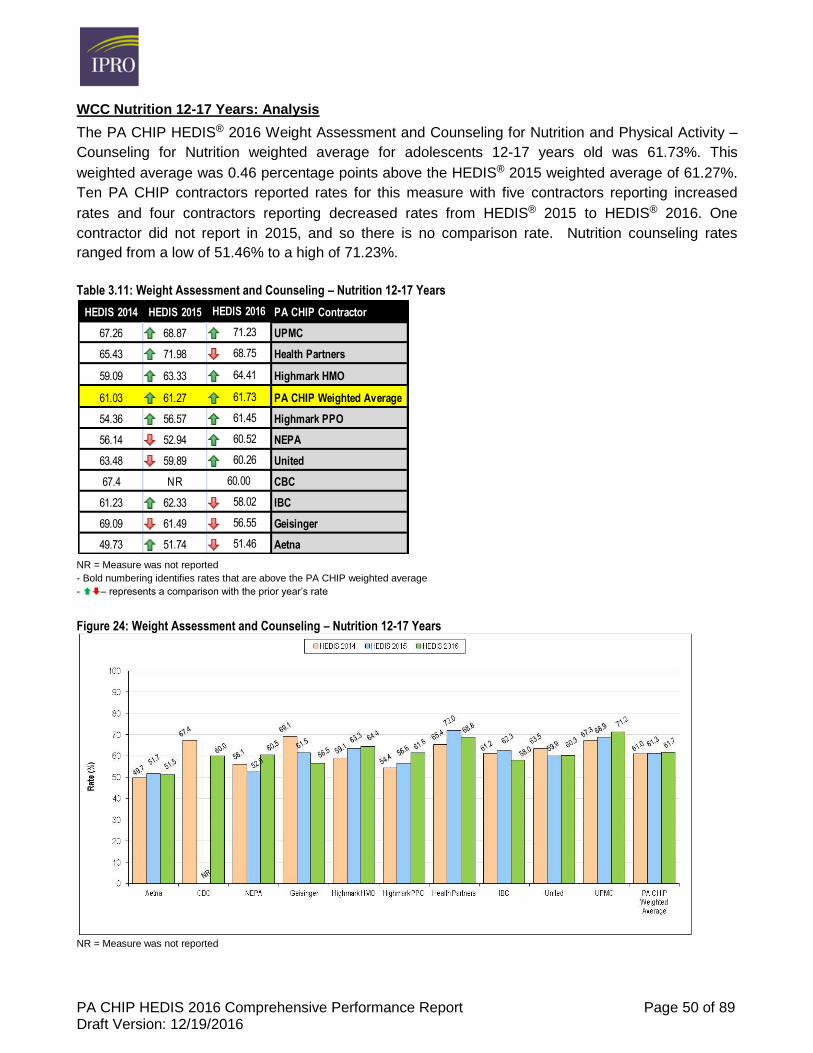
WCC Nutrition 12-17 Years: Analysis
The PA CHIP HEDIS® 2016 Weight Assessment and Counseling for Nutrition and Physical Activity –
Counseling for Nutrition weighted average for adolescents 12-17 years old was 61.73%. This
weighted average was 0.46 percentage points above the HEDIS® 2015 weighted average of 61.27%.
Ten PA CHIP contractors reported rates for this measure with five contractors reporting increased
rates and four contractors reporting decreased rates from HEDIS® 2015 to HEDIS® 2016. One
contractor did not report in 2015, and so there is no comparison rate. Nutrition counseling rates
ranged from a low of 51.46% to a high of 71.23%.
Table 3.11: Weight Assessment and Counseling – Nutrition 12-17 Years
NR = Measure was not reported
- Bold numbering identifies rates that are above the PA CHIP weighted average
- – represents a comparison with the prior year’s rate
Figure 24: Weight Assessment and Counseling – Nutrition 12-17 Years
NR = Measure was not reported
HEDIS 2014 HEDIS 2015 HEDIS 2016 PA CHIP Contractor
67.26 68.87 71.23 UPMC
65.43 71.98 68.75 Health Partners
59.09 63.33 64.41 Highmark HMO
61.03 61.27 61.73 PA CHIP Weighted Average
54.36 56.57 61.45 Highmark PPO
56.14 52.94 60.52 NEPA
63.48 59.89 60.26 United
67.4 NR 60.00 CBC
61.23 62.33 58.02 IBC
69.09 61.49 56.55 Geisinger
49.73 51.74 51.46 Aetna
PA CHIP HEDIS 2016 Comprehensive Performance Report Page 51 of 89 Draft Version: 12/19/2016
Weight Assessment and Counseling – Physical Activity
WCC Physical Activity 3-17 Years: Results
Table 3.12
WCC: Physical Activity Ages 3 - 17 Total Rate HEDIS 2016
PA CHIP Weighted Average 62.96%
PA Medicaid Weighted Average 61.61%
Quality Compass Percentile Benchmark Met – National 66.67th percentile
Quality Compass Percentile Benchmark Met – Regional 50th percentile
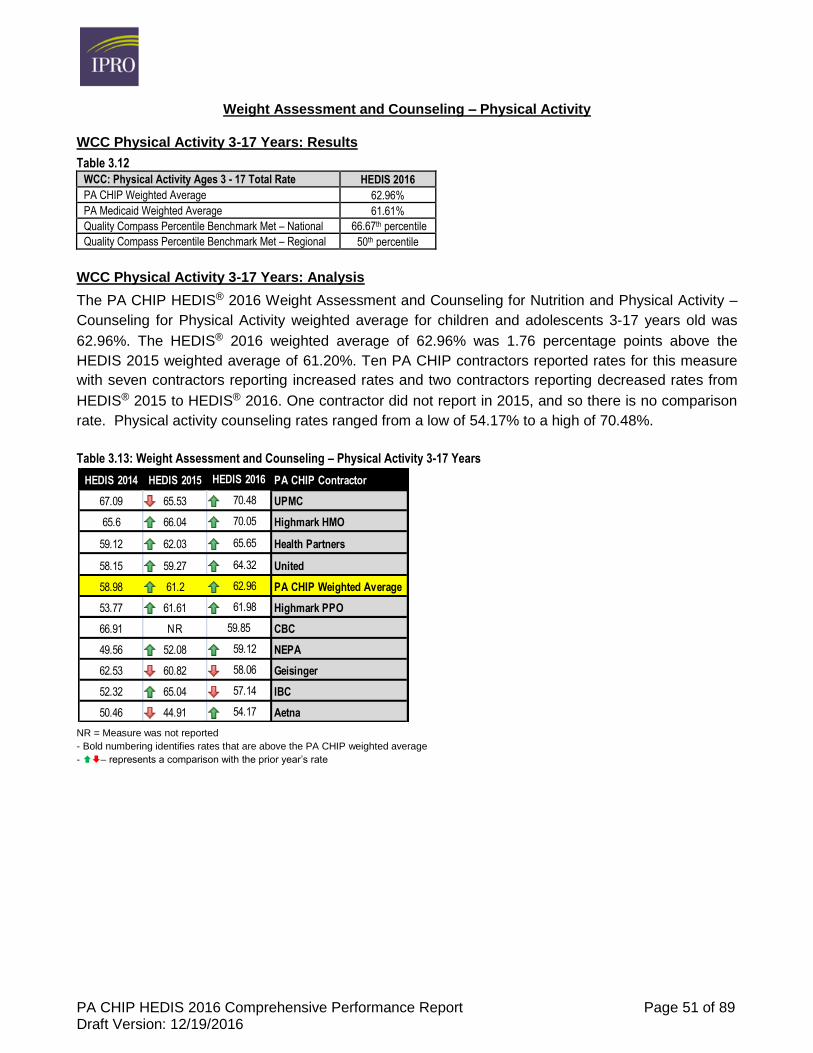
WCC Physical Activity 3-17 Years: Analysis
The PA CHIP HEDIS® 2016 Weight Assessment and Counseling for Nutrition and Physical Activity –
Counseling for Physical Activity weighted average for children and adolescents 3-17 years old was
62.96%. The HEDIS® 2016 weighted average of 62.96% was 1.76 percentage points above the
HEDIS 2015 weighted average of 61.20%. Ten PA CHIP contractors reported rates for this measure
with seven contractors reporting increased rates and two contractors reporting decreased rates from
HEDIS® 2015 to HEDIS® 2016. One contractor did not report in 2015, and so there is no comparison
rate. Physical activity counseling rates ranged from a low of 54.17% to a high of 70.48%.
Table 3.13: Weight Assessment and Counseling – Physical Activity 3-17 Years
NR = Measure was not reported - Bold numbering identifies rates that are above the PA CHIP weighted average
- – represents a comparison with the prior year’s rate
HEDIS 2014 HEDIS 2015 HEDIS 2016 PA CHIP Contractor
67.09 65.53 70.48 UPMC
65.6 66.04 70.05 Highmark HMO
59.12 62.03 65.65 Health Partners
58.15 59.27 64.32 United
58.98 61.2 62.96 PA CHIP Weighted Average
53.77 61.61 61.98 Highmark PPO
66.91 NR 59.85 CBC
49.56 52.08 59.12 NEPA
62.53 60.82 58.06 Geisinger
52.32 65.04 57.14 IBC
50.46 44.91 54.17 Aetna
PA CHIP HEDIS 2016 Comprehensive Performance Report Page 52 of 89 Draft Version: 12/19/2016
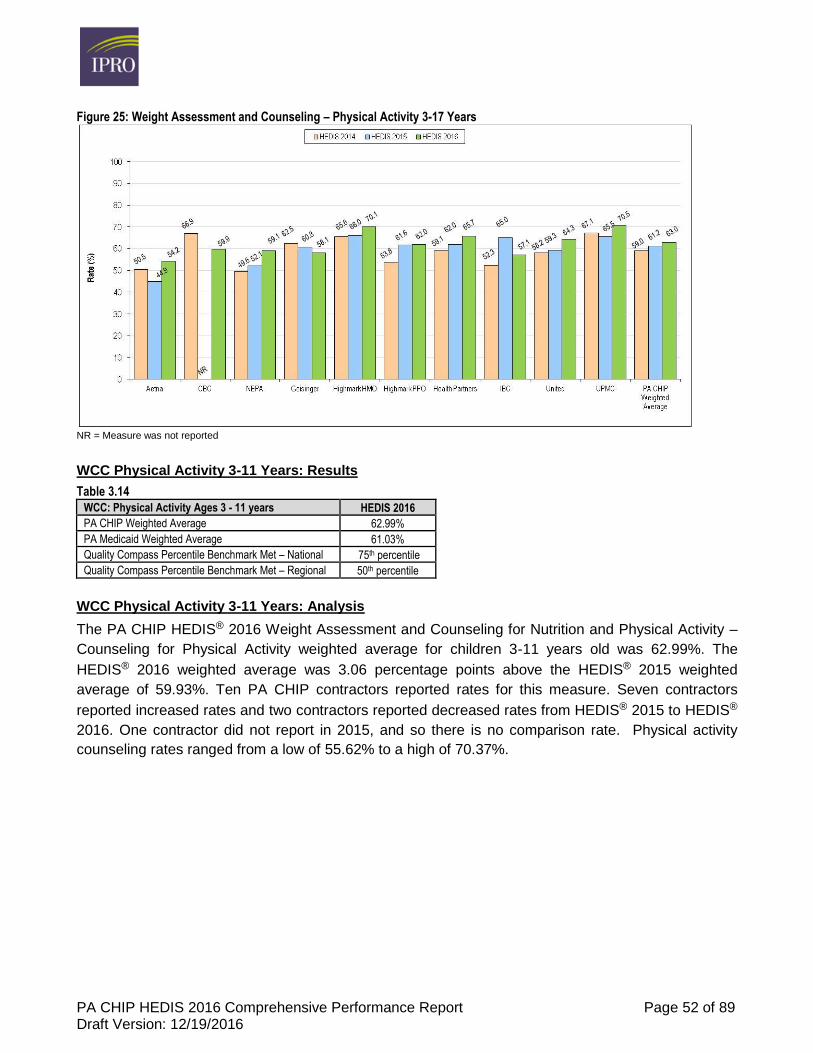
Figure 25: Weight Assessment and Counseling – Physical Activity 3-17 Years
NR = Measure was not reported
WCC Physical Activity 3-11 Years: Results
Table 3.14
WCC: Physical Activity Ages 3 - 11 years HEDIS 2016
PA CHIP Weighted Average 62.99%
PA Medicaid Weighted Average 61.03%
Quality Compass Percentile Benchmark Met – National 75th percentile
Quality Compass Percentile Benchmark Met – Regional 50th percentile
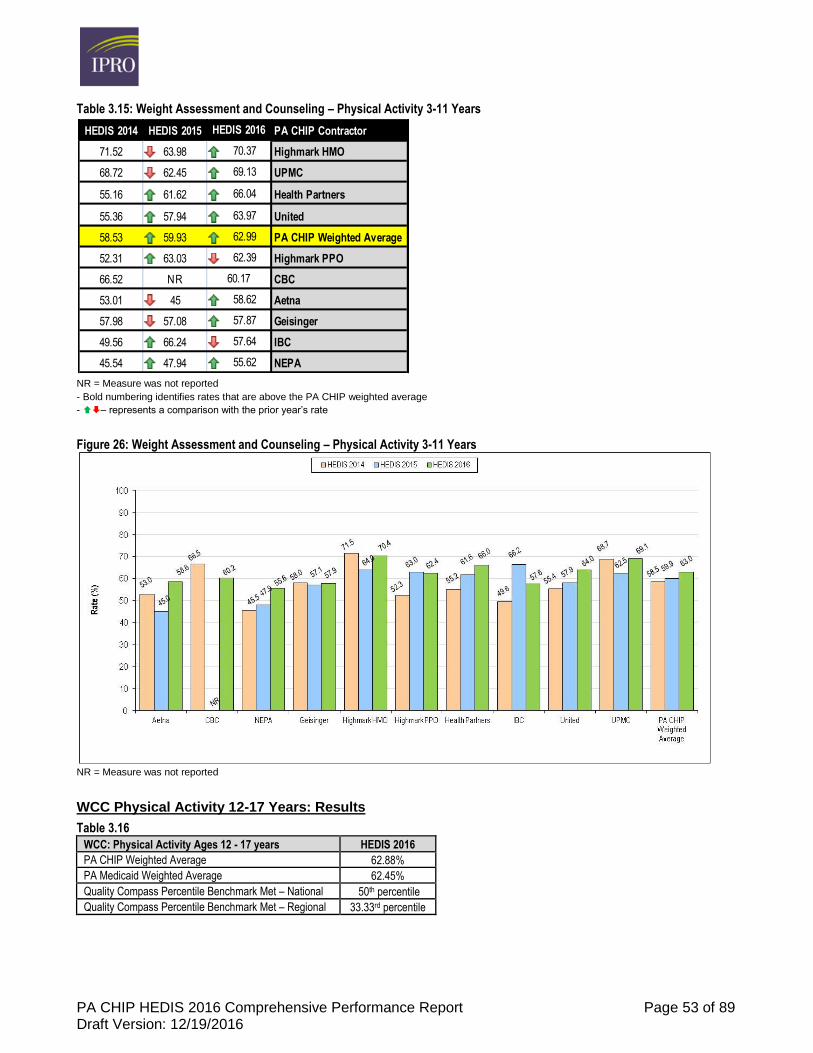
WCC Physical Activity 3-11 Years: Analysis
The PA CHIP HEDIS® 2016 Weight Assessment and Counseling for Nutrition and Physical Activity –
Counseling for Physical Activity weighted average for children 3-11 years old was 62.99%. The
HEDIS® 2016 weighted average was 3.06 percentage points above the HEDIS® 2015 weighted
average of 59.93%. Ten PA CHIP contractors reported rates for this measure. Seven contractors
reported increased rates and two contractors reported decreased rates from HEDIS® 2015 to HEDIS®
2016. One contractor did not report in 2015, and so there is no comparison rate. Physical activity
counseling rates ranged from a low of 55.62% to a high of 70.37%.
PA CHIP HEDIS 2016 Comprehensive Performance Report Page 53 of 89 Draft Version: 12/19/2016
Table 3.15: Weight Assessment and Counseling – Physical Activity 3-11 Years
NR = Measure was not reported - Bold numbering identifies rates that are above the PA CHIP weighted average
- – represents a comparison with the prior year’s rate
Figure 26: Weight Assessment and Counseling – Physical Activity 3-11 Years
NR = Measure was not reported
WCC Physical Activity 12-17 Years: Results
Table 3.16
WCC: Physical Activity Ages 12 - 17 years HEDIS 2016
PA CHIP Weighted Average 62.88%
PA Medicaid Weighted Average 62.45%
Quality Compass Percentile Benchmark Met – National 50th percentile
Quality Compass Percentile Benchmark Met – Regional 33.33rd percentile
HEDIS 2014 HEDIS 2015 HEDIS 2016 PA CHIP Contractor
71.52 63.98 70.37 Highmark HMO
68.72 62.45 69.13 UPMC
55.16 61.62 66.04 Health Partners
55.36 57.94 63.97 United
58.53 59.93 62.99 PA CHIP Weighted Average
52.31 63.03 62.39 Highmark PPO
66.52 NR 60.17 CBC
53.01 45 58.62 Aetna
57.98 57.08 57.87 Geisinger
49.56 66.24 57.64 IBC
45.54 47.94 55.62 NEPA
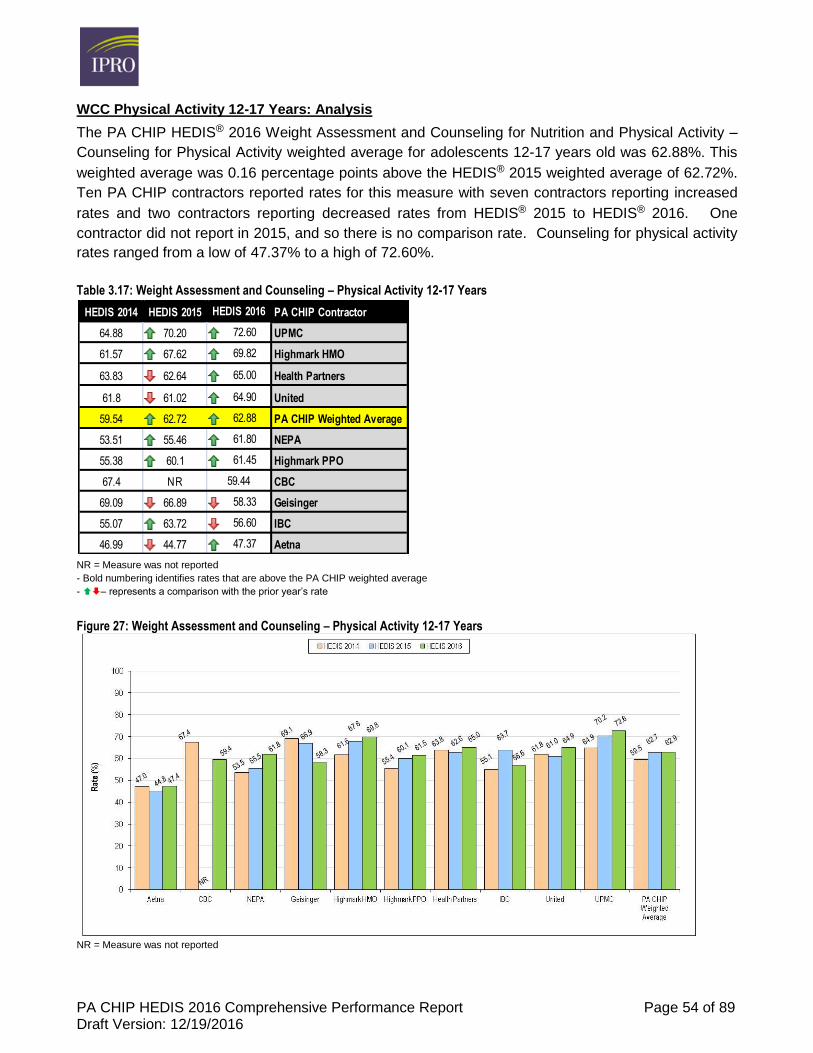
PA CHIP HEDIS 2016 Comprehensive Performance Report Page 54 of 89 Draft Version: 12/19/2016
WCC Physical Activity 12-17 Years: Analysis
The PA CHIP HEDIS® 2016 Weight Assessment and Counseling for Nutrition and Physical Activity –
Counseling for Physical Activity weighted average for adolescents 12-17 years old was 62.88%. This
weighted average was 0.16 percentage points above the HEDIS® 2015 weighted average of 62.72%.
Ten PA CHIP contractors reported rates for this measure with seven contractors reporting increased
rates and two contractors reporting decreased rates from HEDIS® 2015 to HEDIS® 2016. One
contractor did not report in 2015, and so there is no comparison rate. Counseling for physical activity
rates ranged from a low of 47.37% to a high of 72.60%.
Table 3.17: Weight Assessment and Counseling – Physical Activity 12-17 Years
NR = Measure was not reported
- Bold numbering identifies rates that are above the PA CHIP weighted average
- – represents a comparison with the prior year’s rate
Figure 27: Weight Assessment and Counseling – Physical Activity 12-17 Years
NR = Measure was not reported
HEDIS 2014 HEDIS 2015 HEDIS 2016 PA CHIP Contractor
64.88 70.20 72.60 UPMC
61.57 67.62 69.82 Highmark HMO
63.83 62.64 65.00 Health Partners
61.8 61.02 64.90 United
59.54 62.72 62.88 PA CHIP Weighted Average
53.51 55.46 61.80 NEPA
55.38 60.1 61.45 Highmark PPO
67.4 NR 59.44 CBC
69.09 66.89 58.33 Geisinger
55.07 63.72 56.60 IBC
46.99 44.77 47.37 Aetna
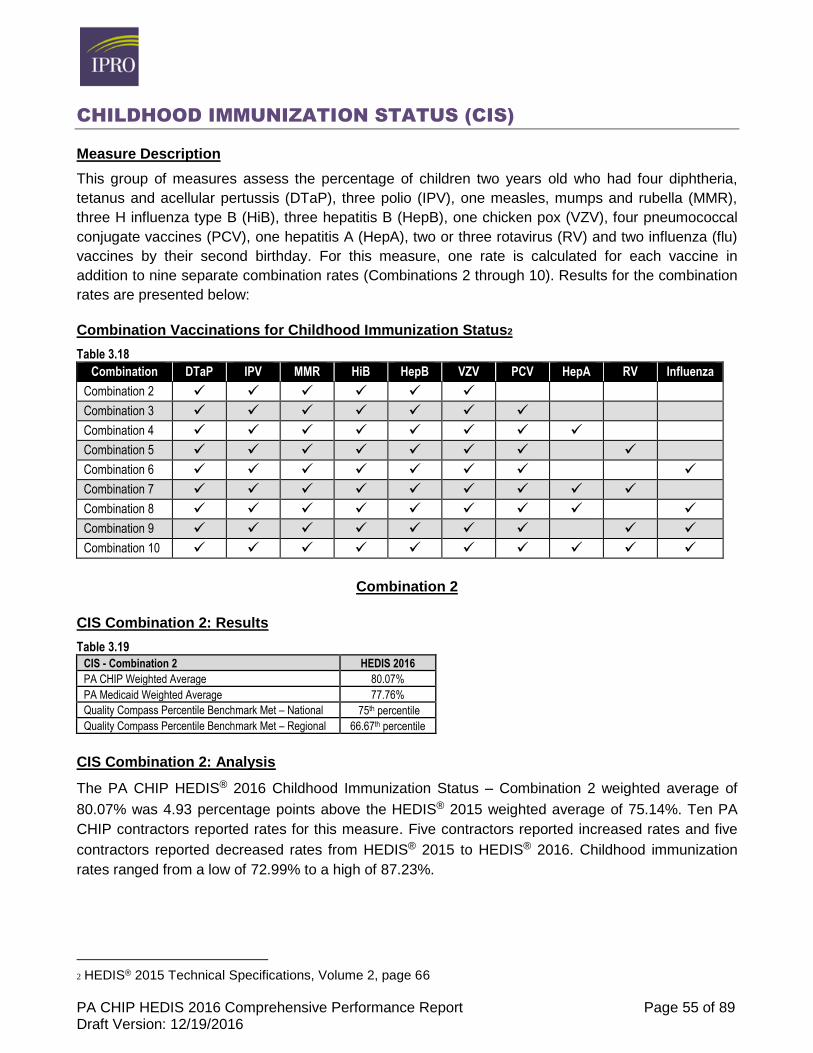
PA CHIP HEDIS 2016 Comprehensive Performance Report Page 55 of 89 Draft Version: 12/19/2016
CHILDHOOD IMMUNIZATION STATUS (CIS)
Measure Description
This group of measures assess the percentage of children two years old who had four diphtheria,
tetanus and acellular pertussis (DTaP), three polio (IPV), one measles, mumps and rubella (MMR),
three H influenza type B (HiB), three hepatitis B (HepB), one chicken pox (VZV), four pneumococcal
conjugate vaccines (PCV), one hepatitis A (HepA), two or three rotavirus (RV) and two influenza (flu)
vaccines by their second birthday. For this measure, one rate is calculated for each vaccine in
addition to nine separate combination rates (Combinations 2 through 10). Results for the combination
rates are presented below:
Combination Vaccinations for Childhood Immunization Status2
Table 3.18
Combination DTaP IPV MMR HiB HepB VZV PCV HepA RV Influenza
Combination 2 Combination 3 Combination 4 Combination 5 Combination 6 Combination 7 Combination 8 Combination 9 Combination 10
Combination 2
CIS Combination 2: Results
Table 3.19
CIS - Combination 2 HEDIS 2016
PA CHIP Weighted Average 80.07%
PA Medicaid Weighted Average 77.76%
Quality Compass Percentile Benchmark Met – National 75th percentile
Quality Compass Percentile Benchmark Met – Regional 66.67th percentile
CIS Combination 2: Analysis
The PA CHIP HEDIS® 2016 Childhood Immunization Status – Combination 2 weighted average of
80.07% was 4.93 percentage points above the HEDIS® 2015 weighted average of 75.14%. Ten PA
CHIP contractors reported rates for this measure. Five contractors reported increased rates and five
contractors reported decreased rates from HEDIS® 2015 to HEDIS® 2016. Childhood immunization
rates ranged from a low of 72.99% to a high of 87.23%.
2 HEDIS® 2015 Technical Specifications, Volume 2, page 66
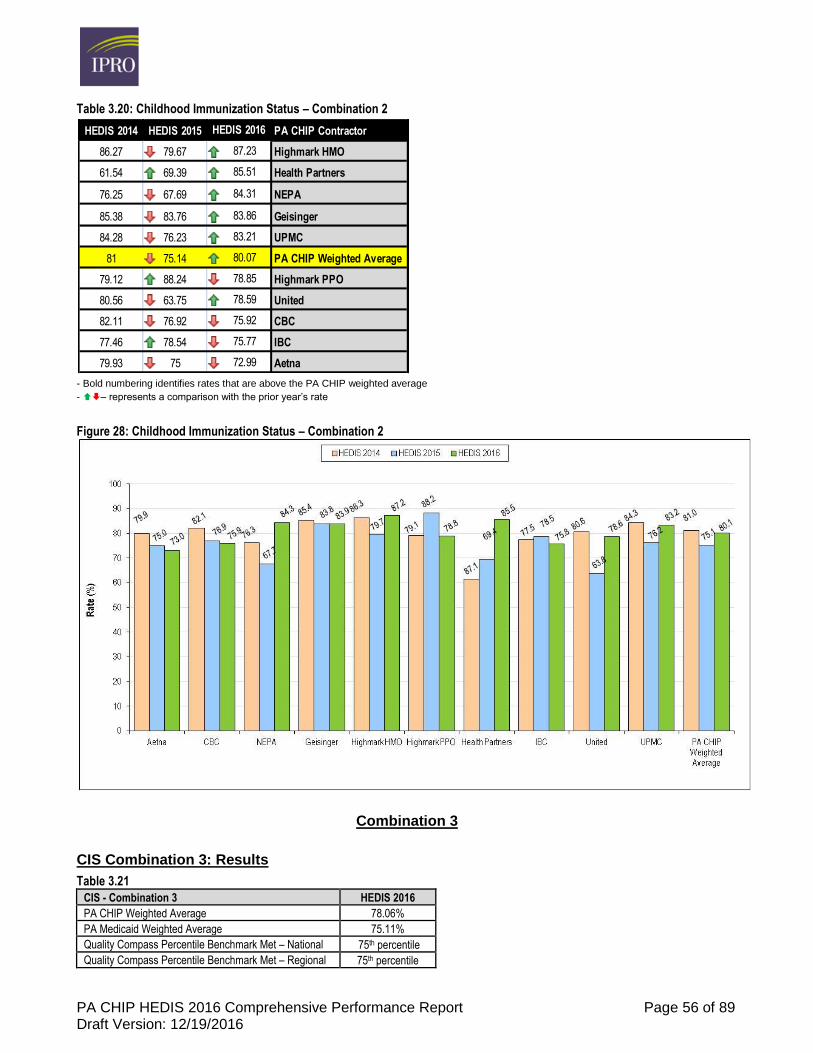
PA CHIP HEDIS 2016 Comprehensive Performance Report Page 56 of 89 Draft Version: 12/19/2016
Table 3.20: Childhood Immunization Status – Combination 2
- Bold numbering identifies rates that are above the PA CHIP weighted average
- – represents a comparison with the prior year’s rate
Figure 28: Childhood Immunization Status – Combination 2
Combination 3
CIS Combination 3: Results
Table 3.21
CIS - Combination 3 HEDIS 2016
PA CHIP Weighted Average 78.06%
PA Medicaid Weighted Average 75.11%
Quality Compass Percentile Benchmark Met – National 75th percentile
Quality Compass Percentile Benchmark Met – Regional 75th percentile
HEDIS 2014 HEDIS 2015 HEDIS 2016 PA CHIP Contractor
86.27 79.67 87.23 Highmark HMO
61.54 69.39 85.51 Health Partners
76.25 67.69 84.31 NEPA
85.38 83.76 83.86 Geisinger
84.28 76.23 83.21 UPMC
81 75.14 80.07 PA CHIP Weighted Average
79.12 88.24 78.85 Highmark PPO
80.56 63.75 78.59 United
82.11 76.92 75.92 CBC
77.46 78.54 75.77 IBC
79.93 75 72.99 Aetna
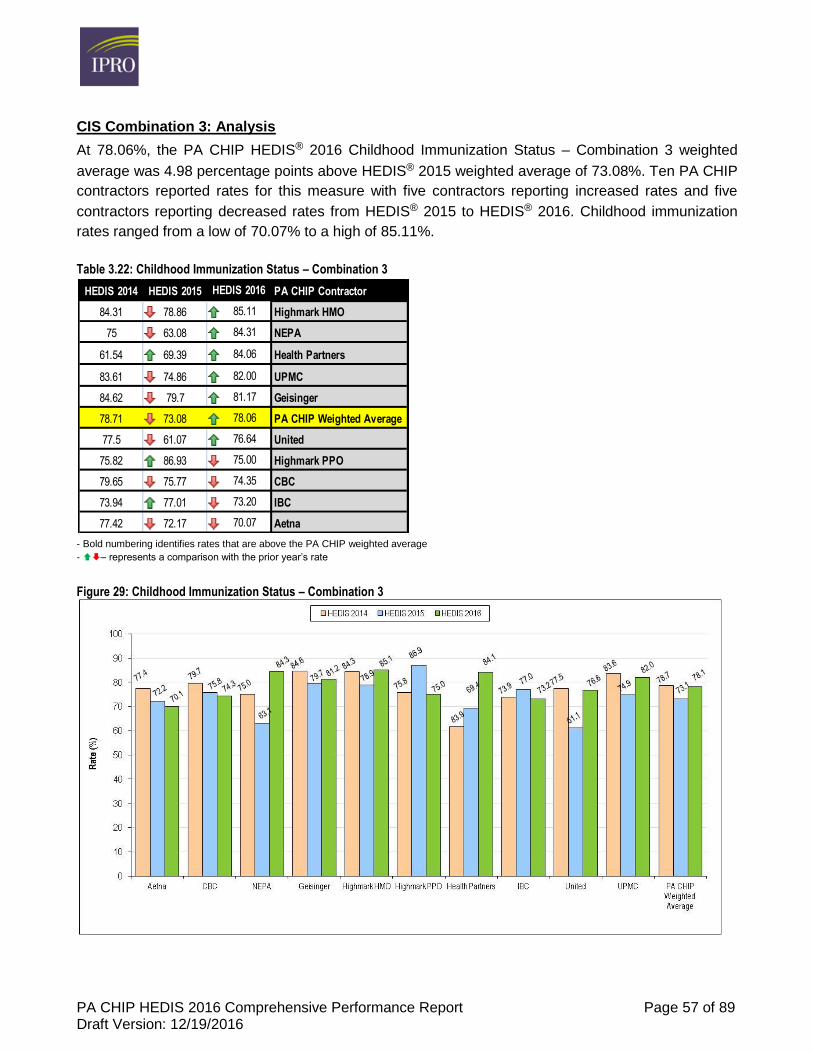
PA CHIP HEDIS 2016 Comprehensive Performance Report Page 57 of 89 Draft Version: 12/19/2016
CIS Combination 3: Analysis
At 78.06%, the PA CHIP HEDIS® 2016 Childhood Immunization Status – Combination 3 weighted
average was 4.98 percentage points above HEDIS® 2015 weighted average of 73.08%. Ten PA CHIP
contractors reported rates for this measure with five contractors reporting increased rates and five
contractors reporting decreased rates from HEDIS® 2015 to HEDIS® 2016. Childhood immunization
rates ranged from a low of 70.07% to a high of 85.11%.
Table 3.22: Childhood Immunization Status – Combination 3
- Bold numbering identifies rates that are above the PA CHIP weighted average
- – represents a comparison with the prior year’s rate
Figure 29: Childhood Immunization Status – Combination 3
HEDIS 2014 HEDIS 2015 HEDIS 2016 PA CHIP Contractor
84.31 78.86 85.11 Highmark HMO
75 63.08 84.31 NEPA
61.54 69.39 84.06 Health Partners
83.61 74.86 82.00 UPMC
84.62 79.7 81.17 Geisinger
78.71 73.08 78.06 PA CHIP Weighted Average
77.5 61.07 76.64 United
75.82 86.93 75.00 Highmark PPO
79.65 75.77 74.35 CBC
73.94 77.01 73.20 IBC
77.42 72.17 70.07 Aetna
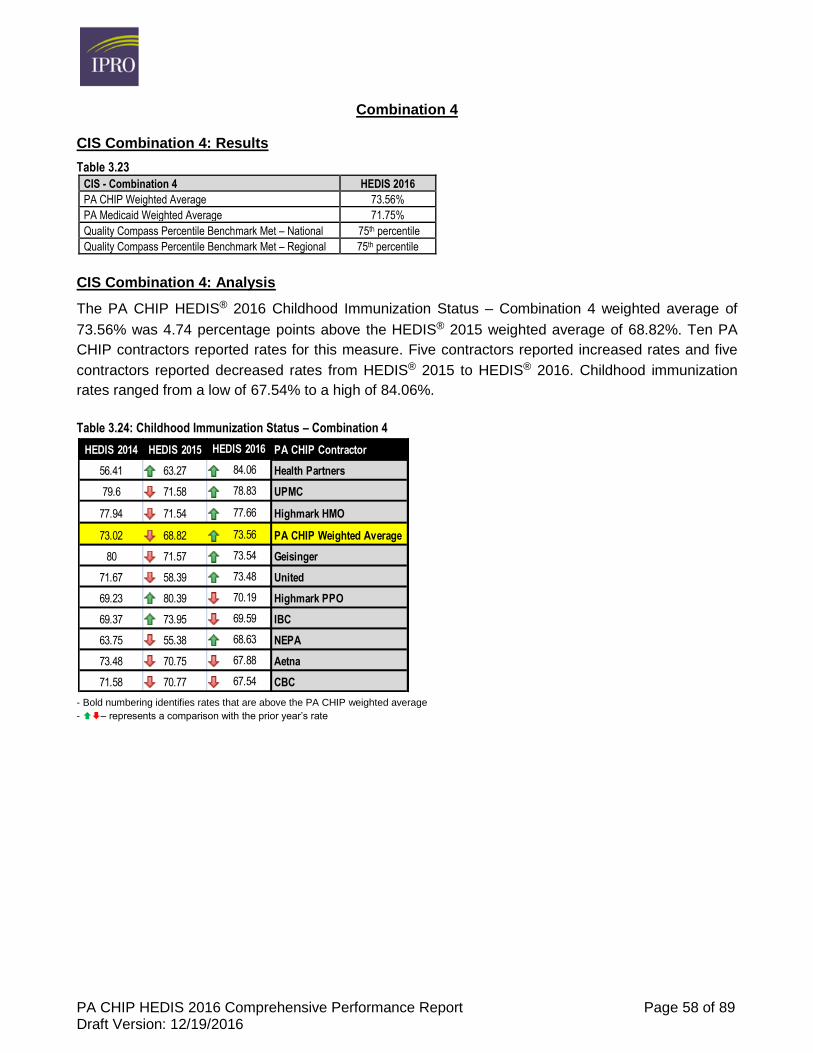
PA CHIP HEDIS 2016 Comprehensive Performance Report Page 58 of 89 Draft Version: 12/19/2016
Combination 4
CIS Combination 4: Results
Table 3.23
CIS - Combination 4 HEDIS 2016
PA CHIP Weighted Average 73.56%
PA Medicaid Weighted Average 71.75%
Quality Compass Percentile Benchmark Met – National 75th percentile
Quality Compass Percentile Benchmark Met – Regional 75th percentile
CIS Combination 4: Analysis
The PA CHIP HEDIS® 2016 Childhood Immunization Status – Combination 4 weighted average of
73.56% was 4.74 percentage points above the HEDIS® 2015 weighted average of 68.82%. Ten PA
CHIP contractors reported rates for this measure. Five contractors reported increased rates and five
contractors reported decreased rates from HEDIS® 2015 to HEDIS® 2016. Childhood immunization
rates ranged from a low of 67.54% to a high of 84.06%.
Table 3.24: Childhood Immunization Status – Combination 4
- Bold numbering identifies rates that are above the PA CHIP weighted average
- – represents a comparison with the prior year’s rate
HEDIS 2014 HEDIS 2015 HEDIS 2016 PA CHIP Contractor
56.41 63.27 84.06 Health Partners
79.6 71.58 78.83 UPMC
77.94 71.54 77.66 Highmark HMO
73.02 68.82 73.56 PA CHIP Weighted Average
80 71.57 73.54 Geisinger
71.67 58.39 73.48 United
69.23 80.39 70.19 Highmark PPO
69.37 73.95 69.59 IBC
63.75 55.38 68.63 NEPA
73.48 70.75 67.88 Aetna
71.58 70.77 67.54 CBC
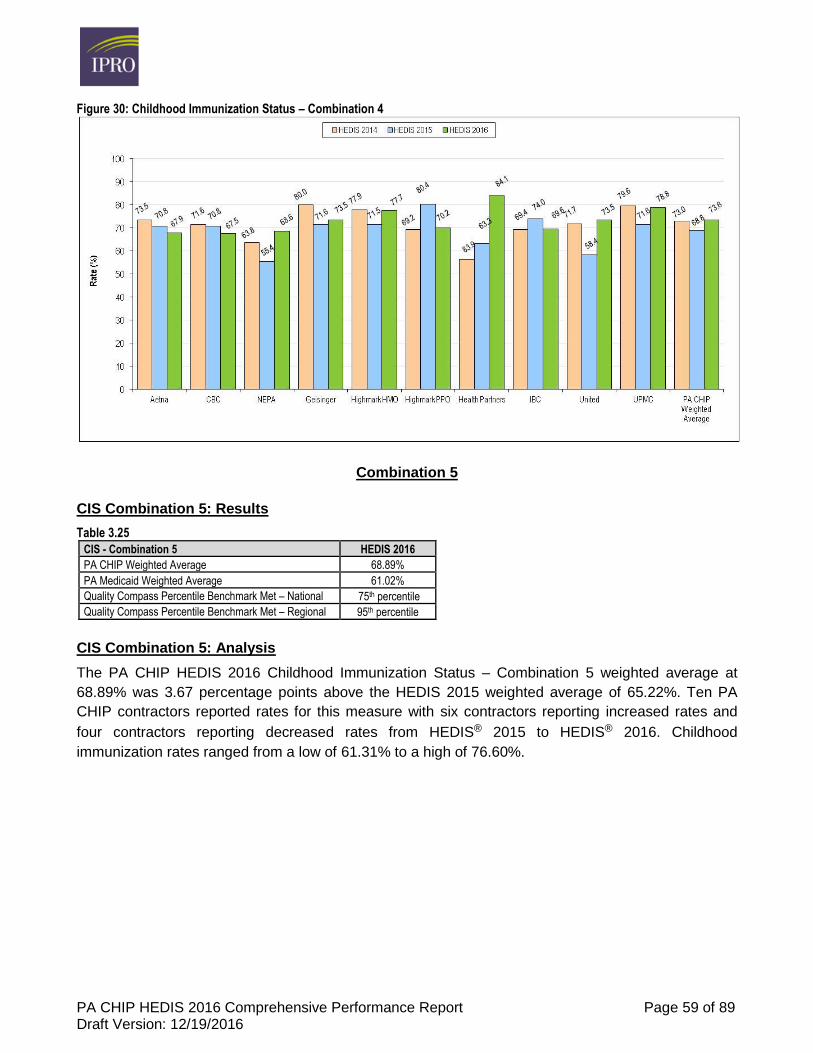
PA CHIP HEDIS 2016 Comprehensive Performance Report Page 59 of 89 Draft Version: 12/19/2016
Figure 30: Childhood Immunization Status – Combination 4
Combination 5
CIS Combination 5: Results
Table 3.25
CIS - Combination 5 HEDIS 2016
PA CHIP Weighted Average 68.89%
PA Medicaid Weighted Average 61.02%
Quality Compass Percentile Benchmark Met – National 75th percentile
Quality Compass Percentile Benchmark Met – Regional 95th percentile
CIS Combination 5: Analysis
The PA CHIP HEDIS 2016 Childhood Immunization Status – Combination 5 weighted average at
68.89% was 3.67 percentage points above the HEDIS 2015 weighted average of 65.22%. Ten PA
CHIP contractors reported rates for this measure with six contractors reporting increased rates and
four contractors reporting decreased rates from HEDIS® 2015 to HEDIS® 2016. Childhood
immunization rates ranged from a low of 61.31% to a high of 76.60%.
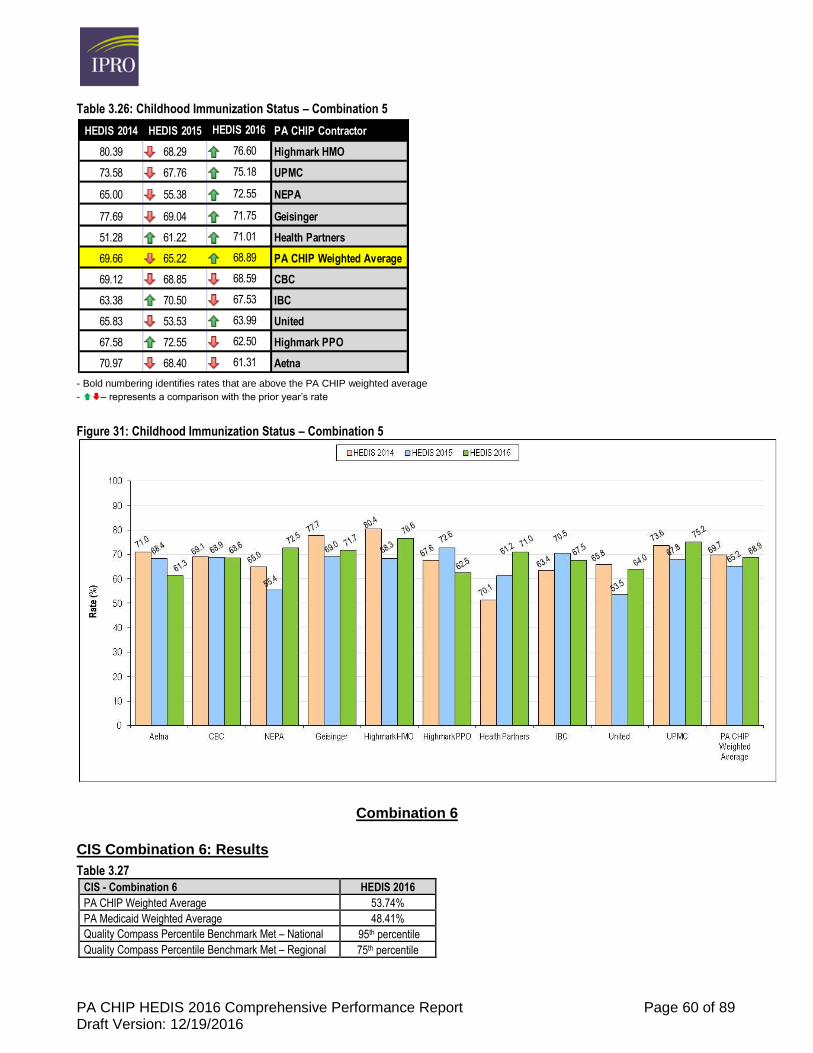
PA CHIP HEDIS 2016 Comprehensive Performance Report Page 60 of 89 Draft Version: 12/19/2016
Table 3.26: Childhood Immunization Status – Combination 5
- Bold numbering identifies rates that are above the PA CHIP weighted average
- – represents a comparison with the prior year’s rate
Figure 31: Childhood Immunization Status – Combination 5
Combination 6
CIS Combination 6: Results
Table 3.27
CIS - Combination 6 HEDIS 2016
PA CHIP Weighted Average 53.74%
PA Medicaid Weighted Average 48.41%
Quality Compass Percentile Benchmark Met – National 95th percentile
Quality Compass Percentile Benchmark Met – Regional 75th percentile
HEDIS 2014 HEDIS 2015 HEDIS 2016 PA CHIP Contractor
80.39 68.29 76.60 Highmark HMO
73.58 67.76 75.18 UPMC
65.00 55.38 72.55 NEPA
77.69 69.04 71.75 Geisinger
51.28 61.22 71.01 Health Partners
69.66 65.22 68.89 PA CHIP Weighted Average
69.12 68.85 68.59 CBC
63.38 70.50 67.53 IBC
65.83 53.53 63.99 United
67.58 72.55 62.50 Highmark PPO
70.97 68.40 61.31 Aetna
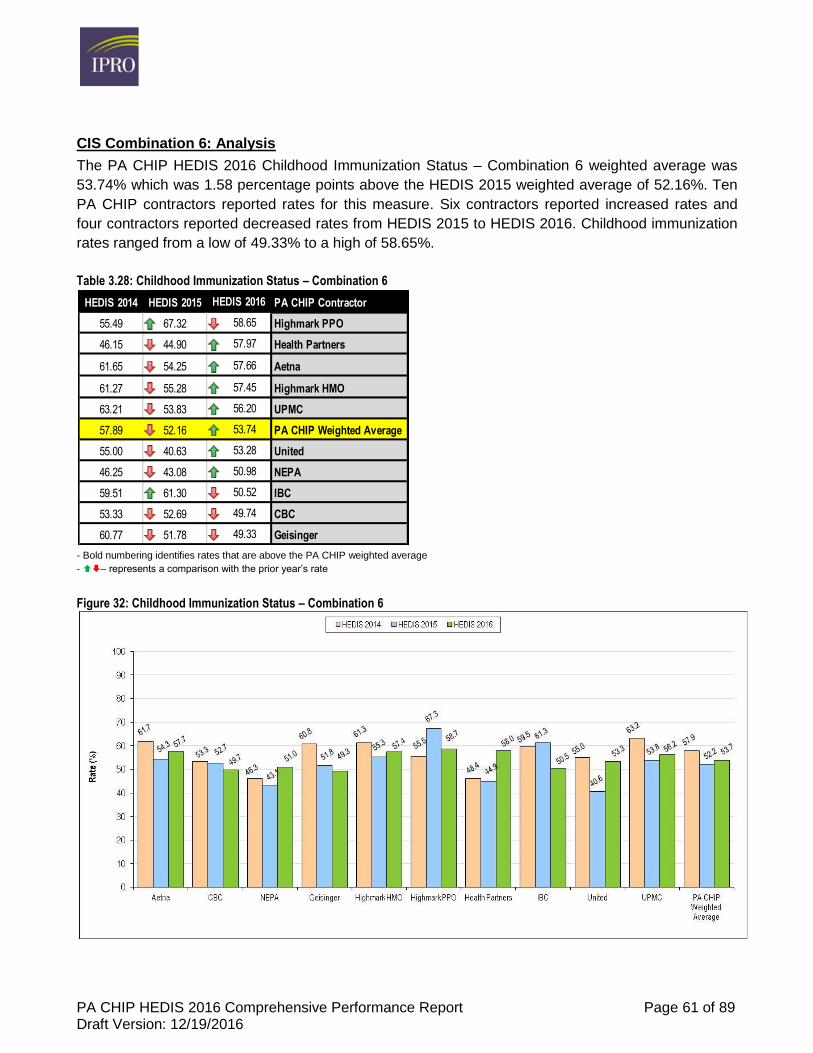
PA CHIP HEDIS 2016 Comprehensive Performance Report Page 61 of 89 Draft Version: 12/19/2016
CIS Combination 6: Analysis
The PA CHIP HEDIS 2016 Childhood Immunization Status – Combination 6 weighted average was
53.74% which was 1.58 percentage points above the HEDIS 2015 weighted average of 52.16%. Ten
PA CHIP contractors reported rates for this measure. Six contractors reported increased rates and
four contractors reported decreased rates from HEDIS 2015 to HEDIS 2016. Childhood immunization
rates ranged from a low of 49.33% to a high of 58.65%.
Table 3.28: Childhood Immunization Status – Combination 6
- Bold numbering identifies rates that are above the PA CHIP weighted average
- – represents a comparison with the prior year’s rate
Figure 32: Childhood Immunization Status – Combination 6
HEDIS 2014 HEDIS 2015 HEDIS 2016 PA CHIP Contractor
55.49 67.32 58.65 Highmark PPO
46.15 44.90 57.97 Health Partners
61.65 54.25 57.66 Aetna
61.27 55.28 57.45 Highmark HMO
63.21 53.83 56.20 UPMC
57.89 52.16 53.74 PA CHIP Weighted Average
55.00 40.63 53.28 United
46.25 43.08 50.98 NEPA
59.51 61.30 50.52 IBC
53.33 52.69 49.74 CBC
60.77 51.78 49.33 Geisinger
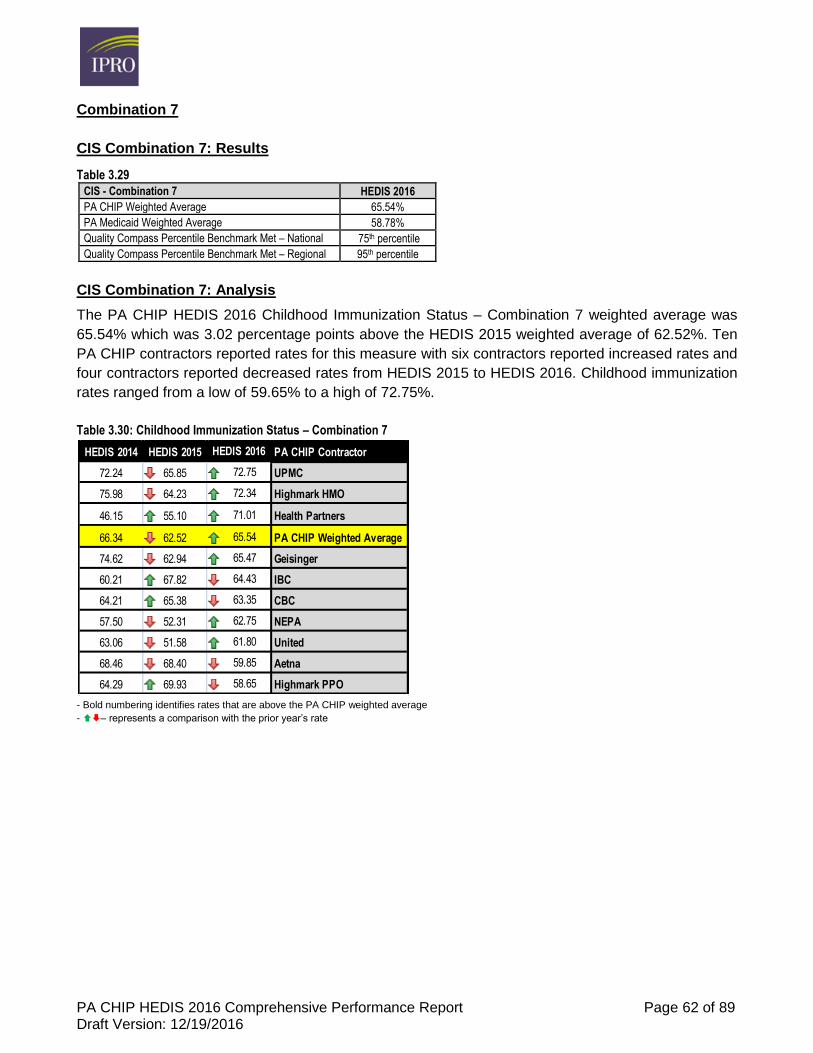
PA CHIP HEDIS 2016 Comprehensive Performance Report Page 62 of 89 Draft Version: 12/19/2016
Combination 7
CIS Combination 7: Results
Table 3.29
CIS - Combination 7 HEDIS 2016
PA CHIP Weighted Average 65.54%
PA Medicaid Weighted Average 58.78%
Quality Compass Percentile Benchmark Met – National 75th percentile
Quality Compass Percentile Benchmark Met – Regional 95th percentile
CIS Combination 7: Analysis
The PA CHIP HEDIS 2016 Childhood Immunization Status – Combination 7 weighted average was
65.54% which was 3.02 percentage points above the HEDIS 2015 weighted average of 62.52%. Ten
PA CHIP contractors reported rates for this measure with six contractors reported increased rates and
four contractors reported decreased rates from HEDIS 2015 to HEDIS 2016. Childhood immunization
rates ranged from a low of 59.65% to a high of 72.75%.
Table 3.30: Childhood Immunization Status – Combination 7
- Bold numbering identifies rates that are above the PA CHIP weighted average
- – represents a comparison with the prior year’s rate
HEDIS 2014 HEDIS 2015 HEDIS 2016 PA CHIP Contractor
72.24 65.85 72.75 UPMC
75.98 64.23 72.34 Highmark HMO
46.15 55.10 71.01 Health Partners
66.34 62.52 65.54 PA CHIP Weighted Average
74.62 62.94 65.47 Geisinger
60.21 67.82 64.43 IBC
64.21 65.38 63.35 CBC
57.50 52.31 62.75 NEPA
63.06 51.58 61.80 United
68.46 68.40 59.85 Aetna
64.29 69.93 58.65 Highmark PPO
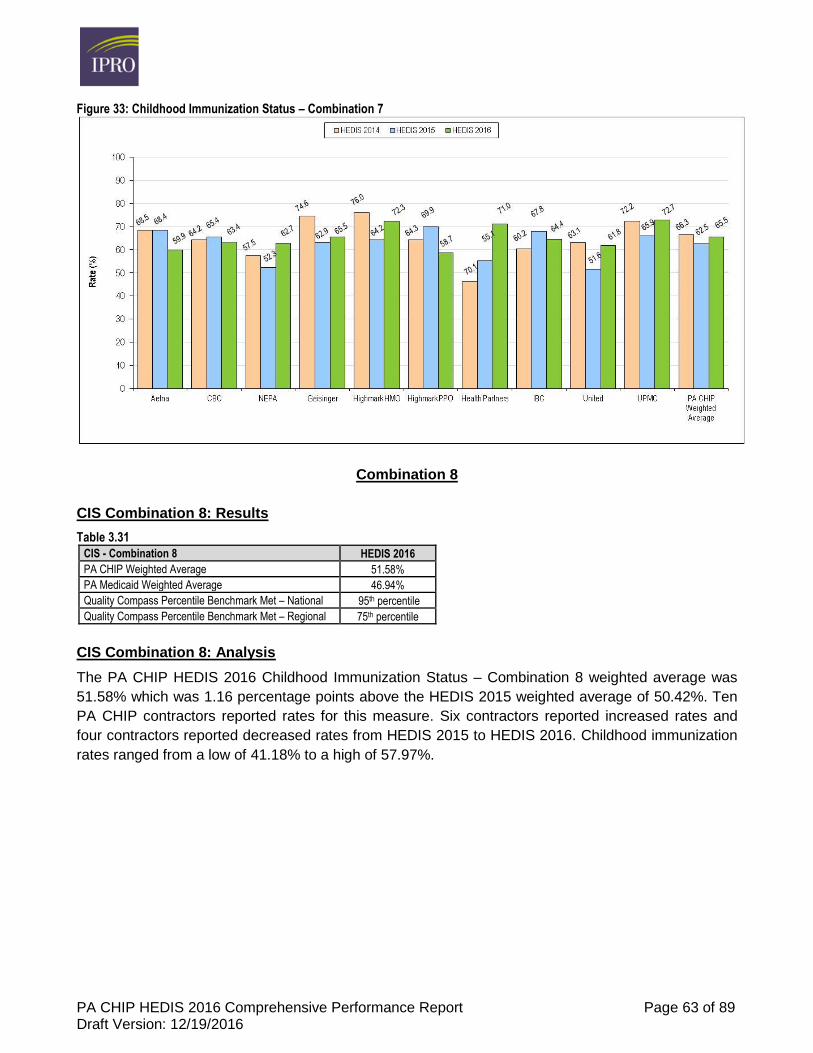
PA CHIP HEDIS 2016 Comprehensive Performance Report Page 63 of 89 Draft Version: 12/19/2016
Figure 33: Childhood Immunization Status – Combination 7
Combination 8
CIS Combination 8: Results
Table 3.31
CIS - Combination 8 HEDIS 2016
PA CHIP Weighted Average 51.58%
PA Medicaid Weighted Average 46.94%
Quality Compass Percentile Benchmark Met – National 95th percentile
Quality Compass Percentile Benchmark Met – Regional 75th percentile
CIS Combination 8: Analysis
The PA CHIP HEDIS 2016 Childhood Immunization Status – Combination 8 weighted average was
51.58% which was 1.16 percentage points above the HEDIS 2015 weighted average of 50.42%. Ten
PA CHIP contractors reported rates for this measure. Six contractors reported increased rates and
four contractors reported decreased rates from HEDIS 2015 to HEDIS 2016. Childhood immunization
rates ranged from a low of 41.18% to a high of 57.97%.
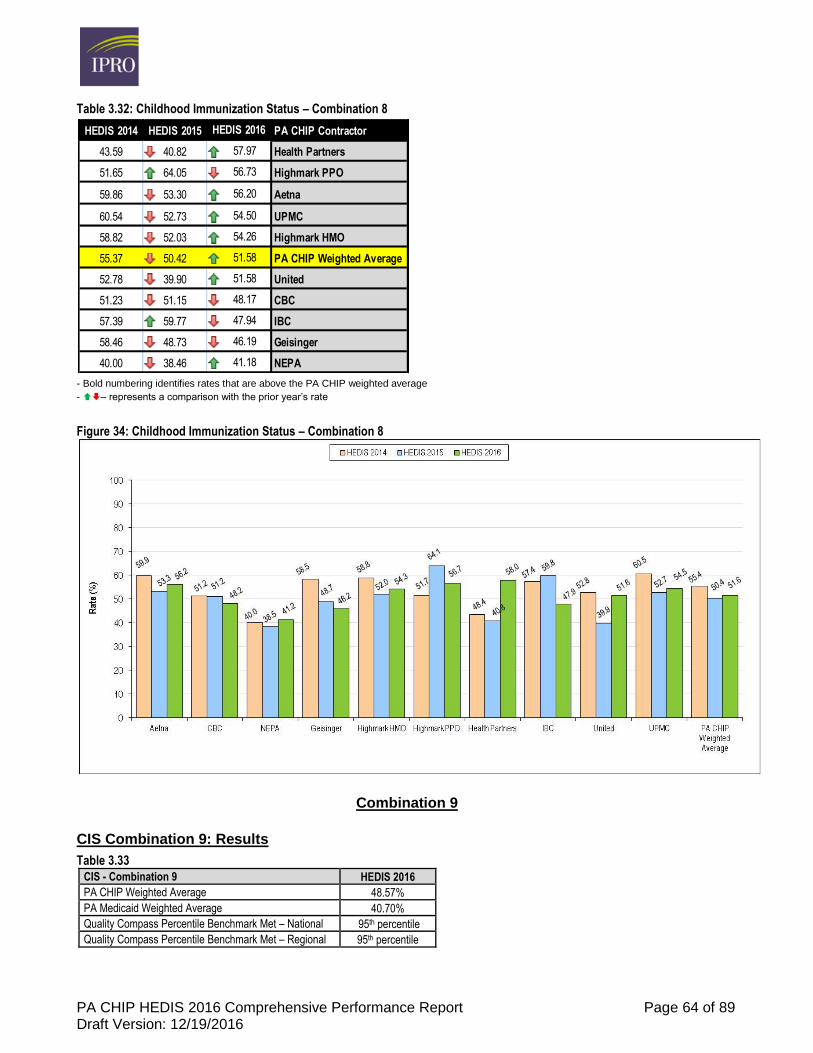
PA CHIP HEDIS 2016 Comprehensive Performance Report Page 64 of 89 Draft Version: 12/19/2016
Table 3.32: Childhood Immunization Status – Combination 8
- Bold numbering identifies rates that are above the PA CHIP weighted average
- – represents a comparison with the prior year’s rate
Figure 34: Childhood Immunization Status – Combination 8
Combination 9
CIS Combination 9: Results
Table 3.33
CIS - Combination 9 HEDIS 2016
PA CHIP Weighted Average 48.57%
PA Medicaid Weighted Average 40.70%
Quality Compass Percentile Benchmark Met – National 95th percentile
Quality Compass Percentile Benchmark Met – Regional 95th percentile
HEDIS 2014 HEDIS 2015 HEDIS 2016 PA CHIP Contractor
43.59 40.82 57.97 Health Partners
51.65 64.05 56.73 Highmark PPO
59.86 53.30 56.20 Aetna
60.54 52.73 54.50 UPMC
58.82 52.03 54.26 Highmark HMO
55.37 50.42 51.58 PA CHIP Weighted Average
52.78 39.90 51.58 United
51.23 51.15 48.17 CBC
57.39 59.77 47.94 IBC
58.46 48.73 46.19 Geisinger
40.00 38.46 41.18 NEPA
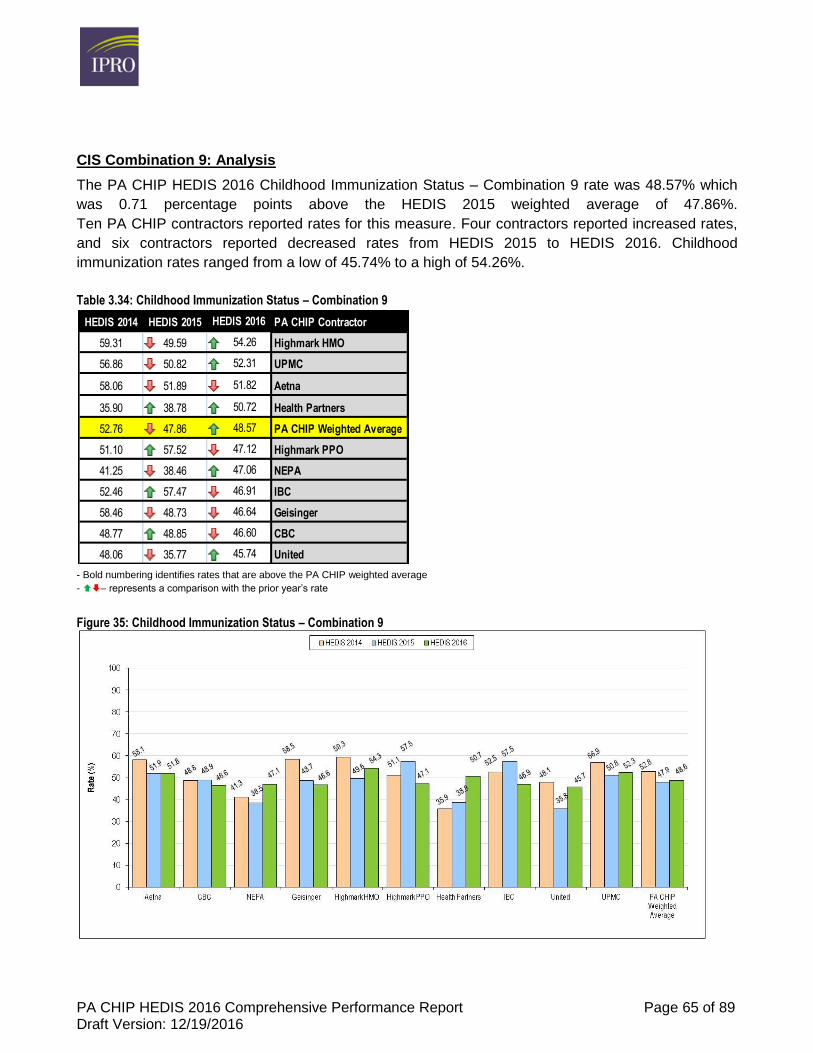
PA CHIP HEDIS 2016 Comprehensive Performance Report Page 65 of 89 Draft Version: 12/19/2016
CIS Combination 9: Analysis
The PA CHIP HEDIS 2016 Childhood Immunization Status – Combination 9 rate was 48.57% which
was 0.71 percentage points above the HEDIS 2015 weighted average of 47.86%.
Ten PA CHIP contractors reported rates for this measure. Four contractors reported increased rates,
and six contractors reported decreased rates from HEDIS 2015 to HEDIS 2016. Childhood
immunization rates ranged from a low of 45.74% to a high of 54.26%.
Table 3.34: Childhood Immunization Status – Combination 9
- Bold numbering identifies rates that are above the PA CHIP weighted average
- – represents a comparison with the prior year’s rate
Figure 35: Childhood Immunization Status – Combination 9
HEDIS 2014 HEDIS 2015 HEDIS 2016 PA CHIP Contractor
59.31 49.59 54.26 Highmark HMO
56.86 50.82 52.31 UPMC
58.06 51.89 51.82 Aetna
35.90 38.78 50.72 Health Partners
52.76 47.86 48.57 PA CHIP Weighted Average
51.10 57.52 47.12 Highmark PPO
41.25 38.46 47.06 NEPA
52.46 57.47 46.91 IBC
58.46 48.73 46.64 Geisinger
48.77 48.85 46.60 CBC
48.06 35.77 45.74 United
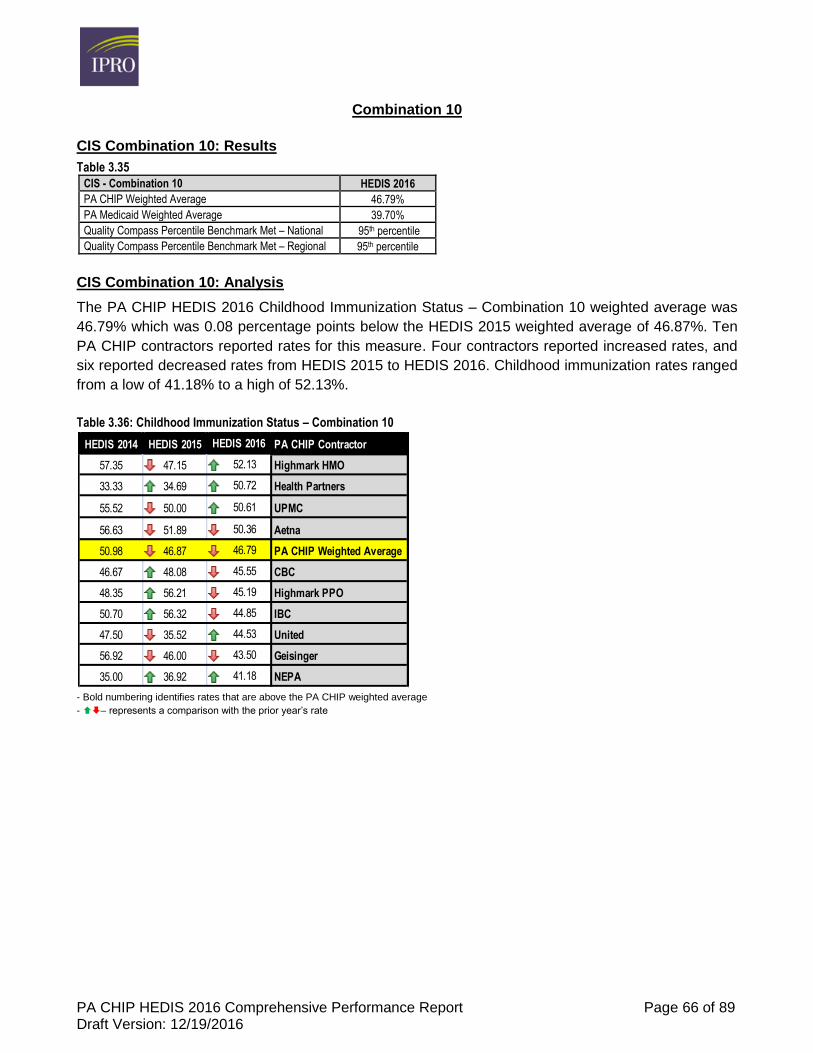
PA CHIP HEDIS 2016 Comprehensive Performance Report Page 66 of 89 Draft Version: 12/19/2016
Combination 10
CIS Combination 10: Results
Table 3.35
CIS - Combination 10 HEDIS 2016
PA CHIP Weighted Average 46.79%
PA Medicaid Weighted Average 39.70%
Quality Compass Percentile Benchmark Met – National 95th percentile
Quality Compass Percentile Benchmark Met – Regional 95th percentile
CIS Combination 10: Analysis
The PA CHIP HEDIS 2016 Childhood Immunization Status – Combination 10 weighted average was
46.79% which was 0.08 percentage points below the HEDIS 2015 weighted average of 46.87%. Ten
PA CHIP contractors reported rates for this measure. Four contractors reported increased rates, and
six reported decreased rates from HEDIS 2015 to HEDIS 2016. Childhood immunization rates ranged
from a low of 41.18% to a high of 52.13%.
Table 3.36: Childhood Immunization Status – Combination 10
- Bold numbering identifies rates that are above the PA CHIP weighted average
- – represents a comparison with the prior year’s rate
HEDIS 2014 HEDIS 2015 HEDIS 2016 PA CHIP Contractor
57.35 47.15 52.13 Highmark HMO
33.33 34.69 50.72 Health Partners
55.52 50.00 50.61 UPMC
56.63 51.89 50.36 Aetna
50.98 46.87 46.79 PA CHIP Weighted Average
46.67 48.08 45.55 CBC
48.35 56.21 45.19 Highmark PPO
50.70 56.32 44.85 IBC
47.50 35.52 44.53 United
56.92 46.00 43.50 Geisinger
35.00 36.92 41.18 NEPA
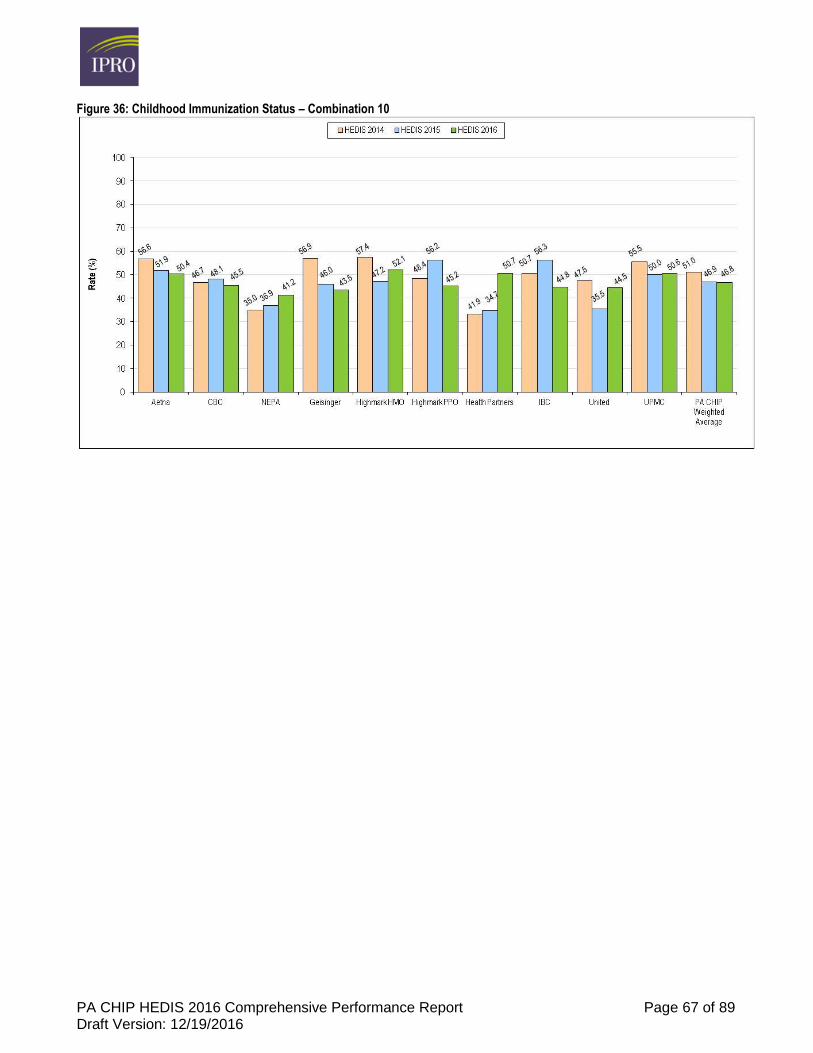
PA CHIP HEDIS 2016 Comprehensive Performance Report Page 67 of 89 Draft Version: 12/19/2016
Figure 36: Childhood Immunization Status – Combination 10
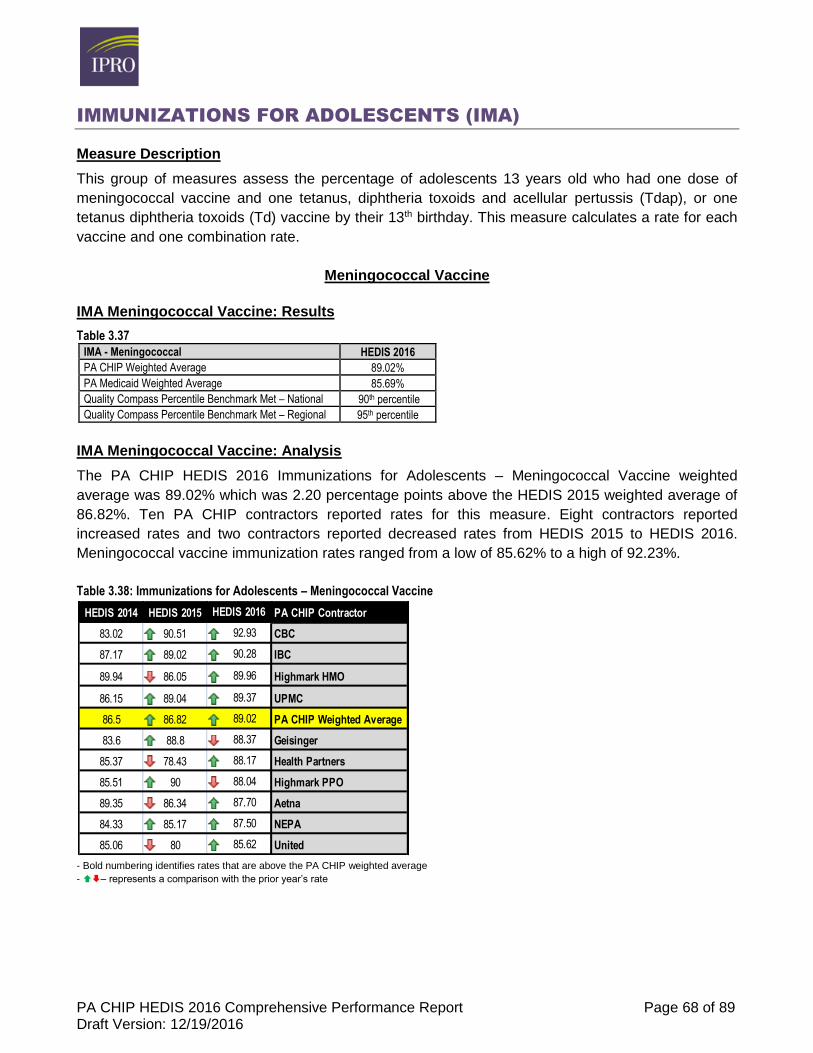
PA CHIP HEDIS 2016 Comprehensive Performance Report Page 68 of 89 Draft Version: 12/19/2016
IMMUNIZATIONS FOR ADOLESCENTS (IMA)
Measure Description
This group of measures assess the percentage of adolescents 13 years old who had one dose of
meningococcal vaccine and one tetanus, diphtheria toxoids and acellular pertussis (Tdap), or one
tetanus diphtheria toxoids (Td) vaccine by their 13th birthday. This measure calculates a rate for each
vaccine and one combination rate.
Meningococcal Vaccine
IMA Meningococcal Vaccine: Results
Table 3.37
IMA - Meningococcal HEDIS 2016
PA CHIP Weighted Average 89.02%
PA Medicaid Weighted Average 85.69%
Quality Compass Percentile Benchmark Met – National 90th percentile
Quality Compass Percentile Benchmark Met – Regional 95th percentile
IMA Meningococcal Vaccine: Analysis
The PA CHIP HEDIS 2016 Immunizations for Adolescents – Meningococcal Vaccine weighted
average was 89.02% which was 2.20 percentage points above the HEDIS 2015 weighted average of
86.82%. Ten PA CHIP contractors reported rates for this measure. Eight contractors reported
increased rates and two contractors reported decreased rates from HEDIS 2015 to HEDIS 2016.
Meningococcal vaccine immunization rates ranged from a low of 85.62% to a high of 92.23%.
Table 3.38: Immunizations for Adolescents – Meningococcal Vaccine
- Bold numbering identifies rates that are above the PA CHIP weighted average
- – represents a comparison with the prior year’s rate
HEDIS 2014 HEDIS 2015 HEDIS 2016 PA CHIP Contractor
83.02 90.51 92.93 CBC
87.17 89.02 90.28 IBC
89.94 86.05 89.96 Highmark HMO
86.15 89.04 89.37 UPMC
86.5 86.82 89.02 PA CHIP Weighted Average
83.6 88.8 88.37 Geisinger
85.37 78.43 88.17 Health Partners
85.51 90 88.04 Highmark PPO
89.35 86.34 87.70 Aetna
84.33 85.17 87.50 NEPA
85.06 80 85.62 United
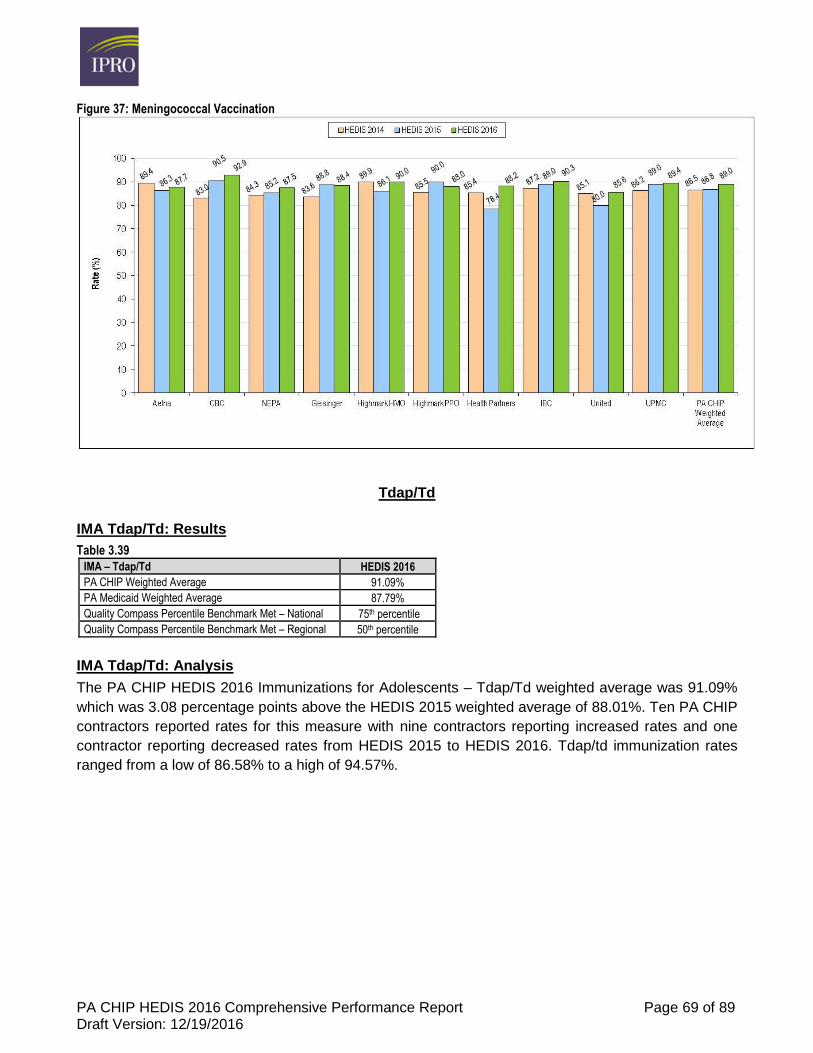
PA CHIP HEDIS 2016 Comprehensive Performance Report Page 69 of 89 Draft Version: 12/19/2016
Figure 37: Meningococcal Vaccination
Tdap/Td
IMA Tdap/Td: Results
Table 3.39
IMA – Tdap/Td HEDIS 2016
PA CHIP Weighted Average 91.09%
PA Medicaid Weighted Average 87.79%
Quality Compass Percentile Benchmark Met – National 75th percentile
Quality Compass Percentile Benchmark Met – Regional 50th percentile
IMA Tdap/Td: Analysis
The PA CHIP HEDIS 2016 Immunizations for Adolescents – Tdap/Td weighted average was 91.09%
which was 3.08 percentage points above the HEDIS 2015 weighted average of 88.01%. Ten PA CHIP
contractors reported rates for this measure with nine contractors reporting increased rates and one
contractor reporting decreased rates from HEDIS 2015 to HEDIS 2016. Tdap/td immunization rates
ranged from a low of 86.58% to a high of 94.57%.
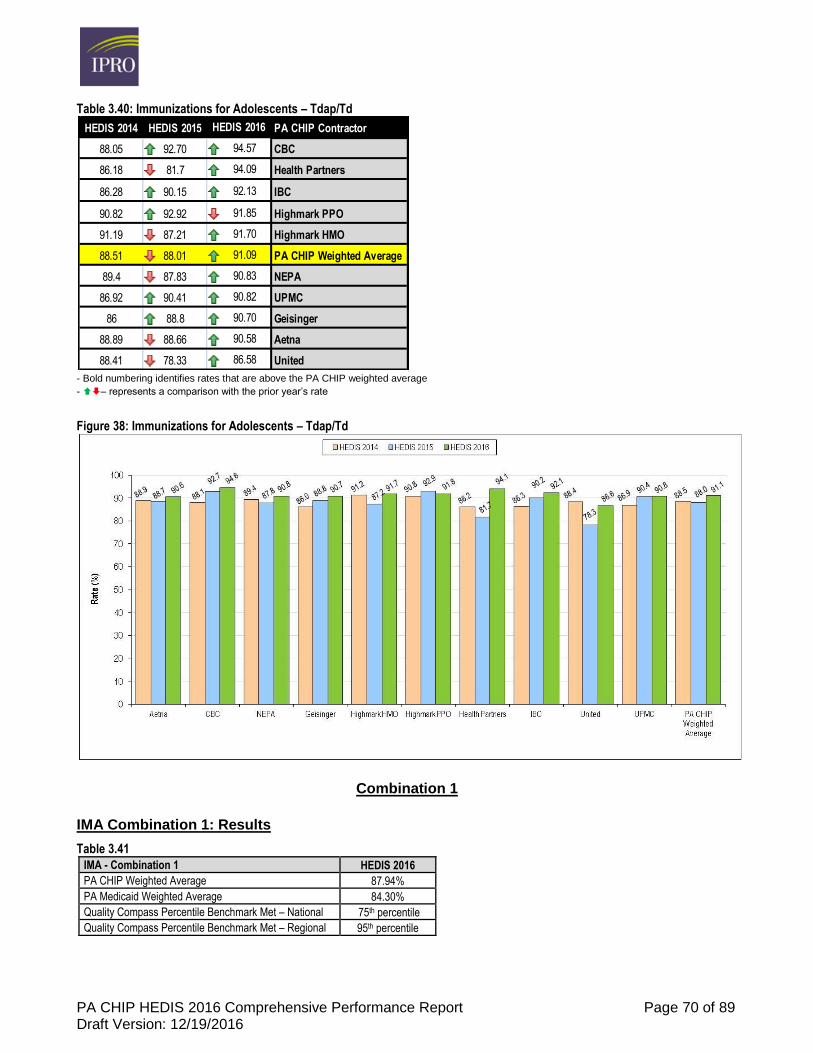
PA CHIP HEDIS 2016 Comprehensive Performance Report Page 70 of 89 Draft Version: 12/19/2016
Table 3.40: Immunizations for Adolescents – Tdap/Td
- Bold numbering identifies rates that are above the PA CHIP weighted average
- – represents a comparison with the prior year’s rate
Figure 38: Immunizations for Adolescents – Tdap/Td
Combination 1
IMA Combination 1: Results
Table 3.41
IMA - Combination 1 HEDIS 2016
PA CHIP Weighted Average 87.94%
PA Medicaid Weighted Average 84.30%
Quality Compass Percentile Benchmark Met – National 75th percentile
Quality Compass Percentile Benchmark Met – Regional 95th percentile
HEDIS 2014 HEDIS 2015 HEDIS 2016 PA CHIP Contractor
88.05 92.70 94.57 CBC
86.18 81.7 94.09 Health Partners
86.28 90.15 92.13 IBC
90.82 92.92 91.85 Highmark PPO
91.19 87.21 91.70 Highmark HMO
88.51 88.01 91.09 PA CHIP Weighted Average
89.4 87.83 90.83 NEPA
86.92 90.41 90.82 UPMC
86 88.8 90.70 Geisinger
88.89 88.66 90.58 Aetna
88.41 78.33 86.58 United
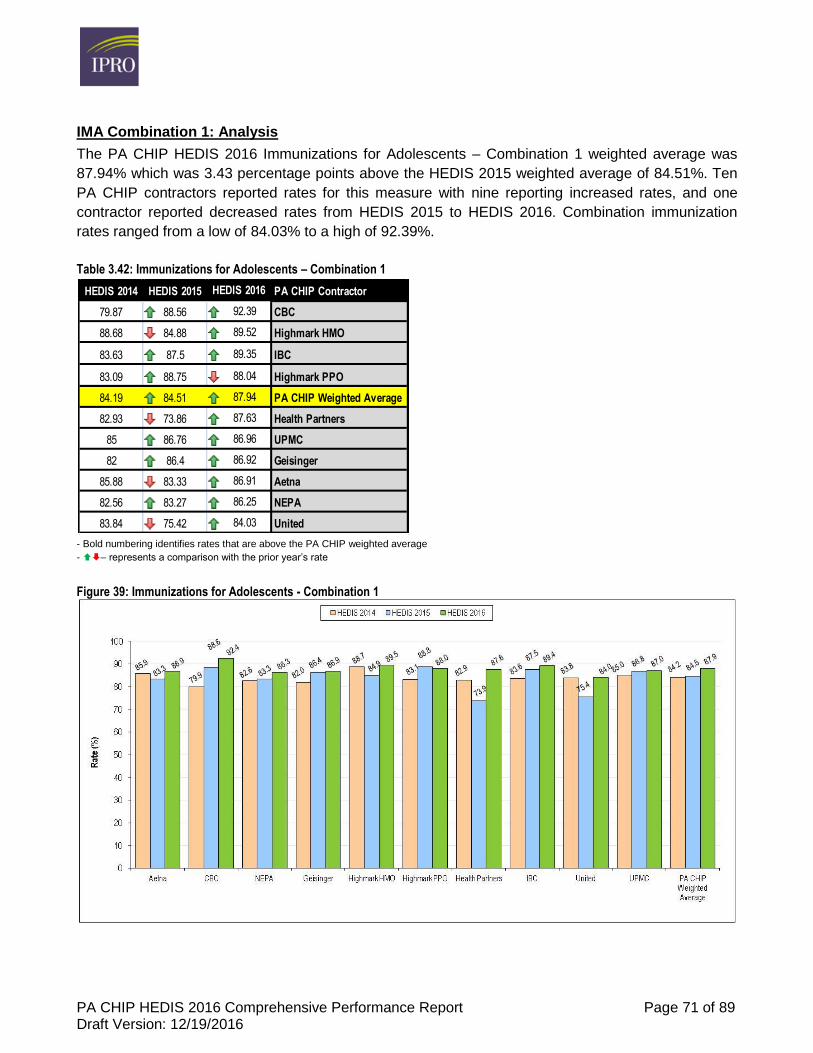
PA CHIP HEDIS 2016 Comprehensive Performance Report Page 71 of 89 Draft Version: 12/19/2016
IMA Combination 1: Analysis
The PA CHIP HEDIS 2016 Immunizations for Adolescents – Combination 1 weighted average was
87.94% which was 3.43 percentage points above the HEDIS 2015 weighted average of 84.51%. Ten
PA CHIP contractors reported rates for this measure with nine reporting increased rates, and one
contractor reported decreased rates from HEDIS 2015 to HEDIS 2016. Combination immunization
rates ranged from a low of 84.03% to a high of 92.39%.
Table 3.42: Immunizations for Adolescents – Combination 1
- Bold numbering identifies rates that are above the PA CHIP weighted average
- – represents a comparison with the prior year’s rate
Figure 39: Immunizations for Adolescents - Combination 1
HEDIS 2014 HEDIS 2015 HEDIS 2016 PA CHIP Contractor
79.87 88.56 92.39 CBC
88.68 84.88 89.52 Highmark HMO
83.63 87.5 89.35 IBC
83.09 88.75 88.04 Highmark PPO
84.19 84.51 87.94 PA CHIP Weighted Average
82.93 73.86 87.63 Health Partners
85 86.76 86.96 UPMC
82 86.4 86.92 Geisinger
85.88 83.33 86.91 Aetna
82.56 83.27 86.25 NEPA
83.84 75.42 84.03 United
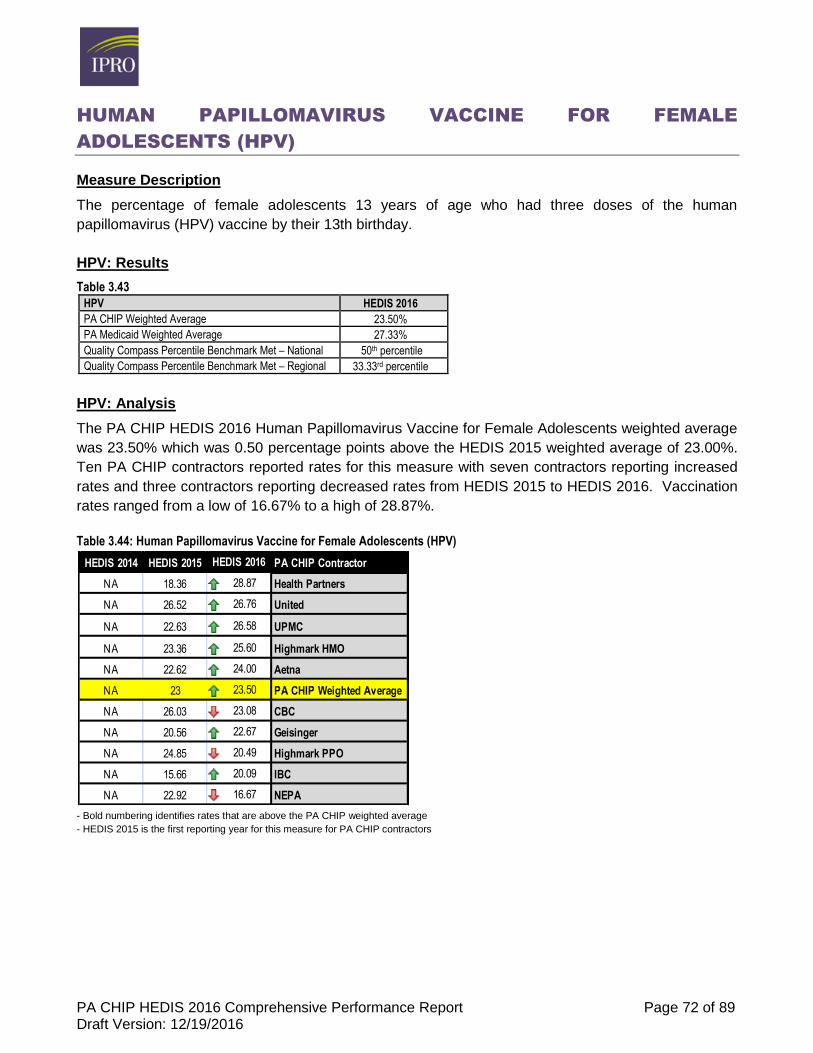
PA CHIP HEDIS 2016 Comprehensive Performance Report Page 72 of 89 Draft Version: 12/19/2016
HUMAN PAPILLOMAVIRUS VACCINE FOR FEMALE
ADOLESCENTS (HPV)
Measure Description
The percentage of female adolescents 13 years of age who had three doses of the human
papillomavirus (HPV) vaccine by their 13th birthday.
HPV: Results
Table 3.43
HPV HEDIS 2016
PA CHIP Weighted Average 23.50%
PA Medicaid Weighted Average 27.33%
Quality Compass Percentile Benchmark Met – National 50th percentile
Quality Compass Percentile Benchmark Met – Regional 33.33rd percentile
HPV: Analysis
The PA CHIP HEDIS 2016 Human Papillomavirus Vaccine for Female Adolescents weighted average
was 23.50% which was 0.50 percentage points above the HEDIS 2015 weighted average of 23.00%.
Ten PA CHIP contractors reported rates for this measure with seven contractors reporting increased
rates and three contractors reporting decreased rates from HEDIS 2015 to HEDIS 2016. Vaccination
rates ranged from a low of 16.67% to a high of 28.87%.
Table 3.44: Human Papillomavirus Vaccine for Female Adolescents (HPV)
- Bold numbering identifies rates that are above the PA CHIP weighted average
- HEDIS 2015 is the first reporting year for this measure for PA CHIP contractors
HEDIS 2014 HEDIS 2015 HEDIS 2016 PA CHIP Contractor
NA 18.36 28.87 Health Partners
NA 26.52 26.76 United
NA 22.63 26.58 UPMC
NA 23.36 25.60 Highmark HMO
NA 22.62 24.00 Aetna
NA 23 23.50 PA CHIP Weighted Average
NA 26.03 23.08 CBC
NA 20.56 22.67 Geisinger
NA 24.85 20.49 Highmark PPO
NA 15.66 20.09 IBC
NA 22.92 16.67 NEPA
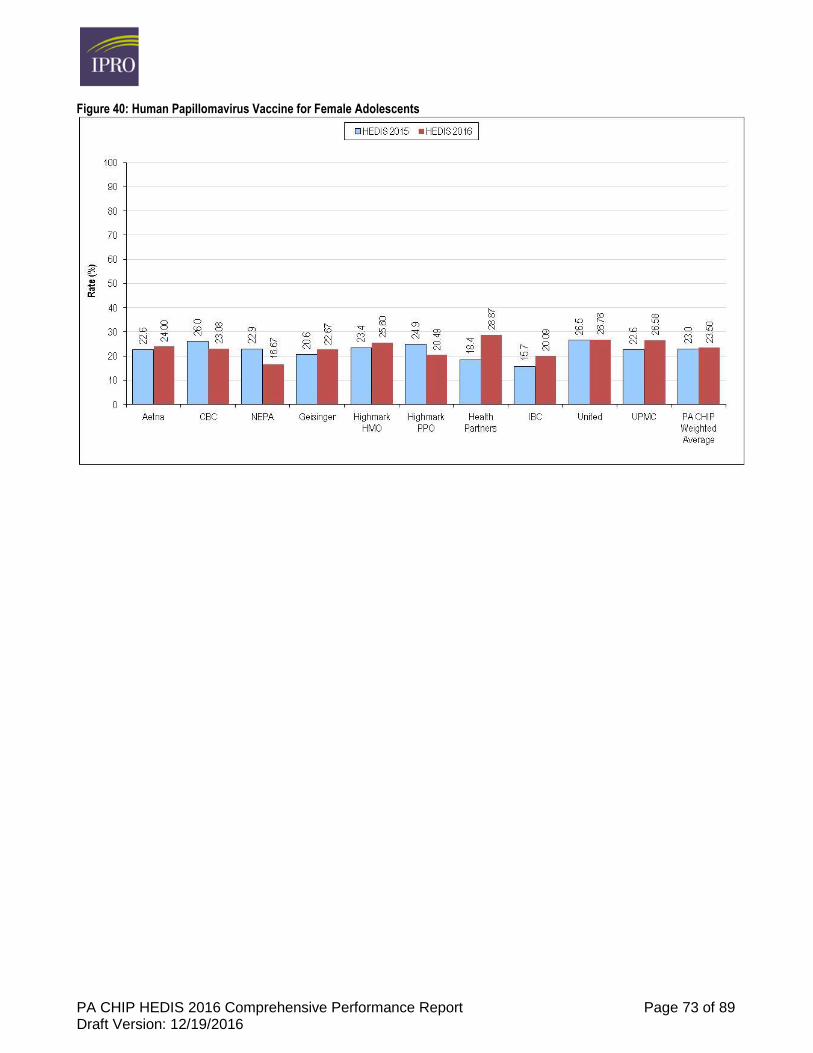
PA CHIP HEDIS 2016 Comprehensive Performance Report Page 73 of 89 Draft Version: 12/19/2016
Figure 40: Human Papillomavirus Vaccine for Female Adolescents
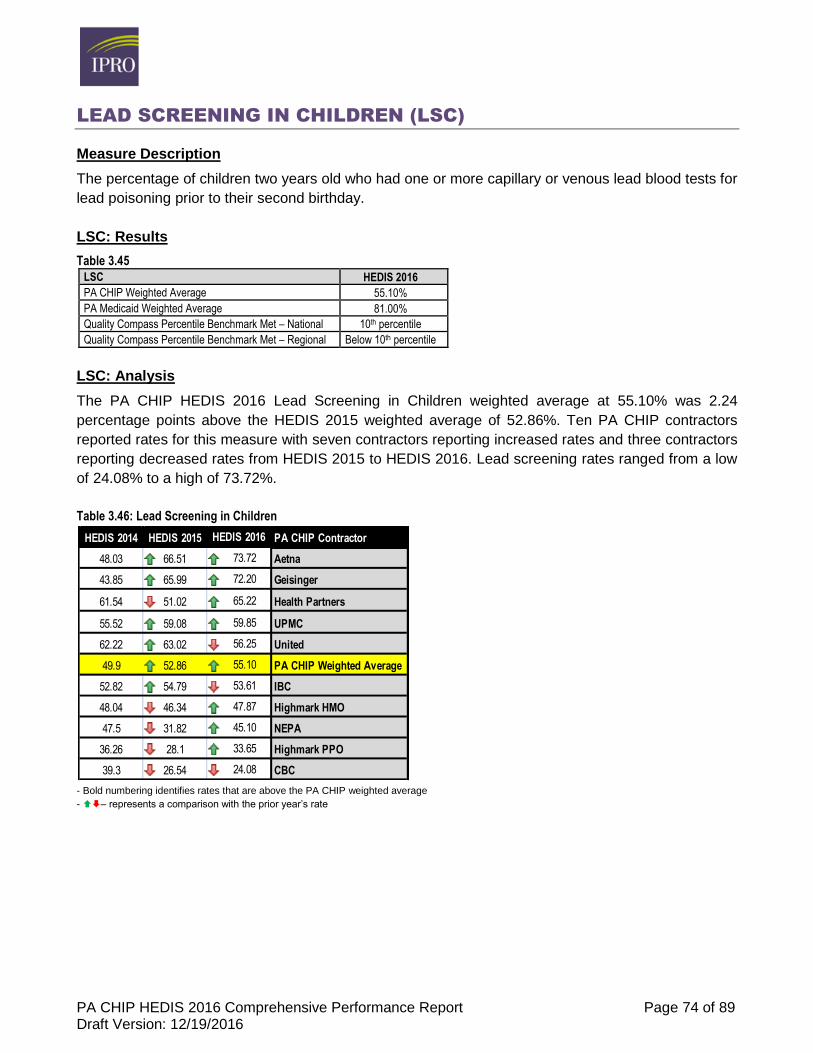
PA CHIP HEDIS 2016 Comprehensive Performance Report Page 74 of 89 Draft Version: 12/19/2016
LEAD SCREENING IN CHILDREN (LSC)
Measure Description
The percentage of children two years old who had one or more capillary or venous lead blood tests for
lead poisoning prior to their second birthday.
LSC: Results
Table 3.45
LSC HEDIS 2016
PA CHIP Weighted Average 55.10%
PA Medicaid Weighted Average 81.00%
Quality Compass Percentile Benchmark Met – National 10th percentile
Quality Compass Percentile Benchmark Met – Regional Below 10th percentile
LSC: Analysis
The PA CHIP HEDIS 2016 Lead Screening in Children weighted average at 55.10% was 2.24
percentage points above the HEDIS 2015 weighted average of 52.86%. Ten PA CHIP contractors
reported rates for this measure with seven contractors reporting increased rates and three contractors
reporting decreased rates from HEDIS 2015 to HEDIS 2016. Lead screening rates ranged from a low
of 24.08% to a high of 73.72%.
Table 3.46: Lead Screening in Children
- Bold numbering identifies rates that are above the PA CHIP weighted average
- – represents a comparison with the prior year’s rate
HEDIS 2014 HEDIS 2015 HEDIS 2016 PA CHIP Contractor
48.03 66.51 73.72 Aetna
43.85 65.99 72.20 Geisinger
61.54 51.02 65.22 Health Partners
55.52 59.08 59.85 UPMC
62.22 63.02 56.25 United
49.9 52.86 55.10 PA CHIP Weighted Average
52.82 54.79 53.61 IBC
48.04 46.34 47.87 Highmark HMO
47.5 31.82 45.10 NEPA
36.26 28.1 33.65 Highmark PPO
39.3 26.54 24.08 CBC
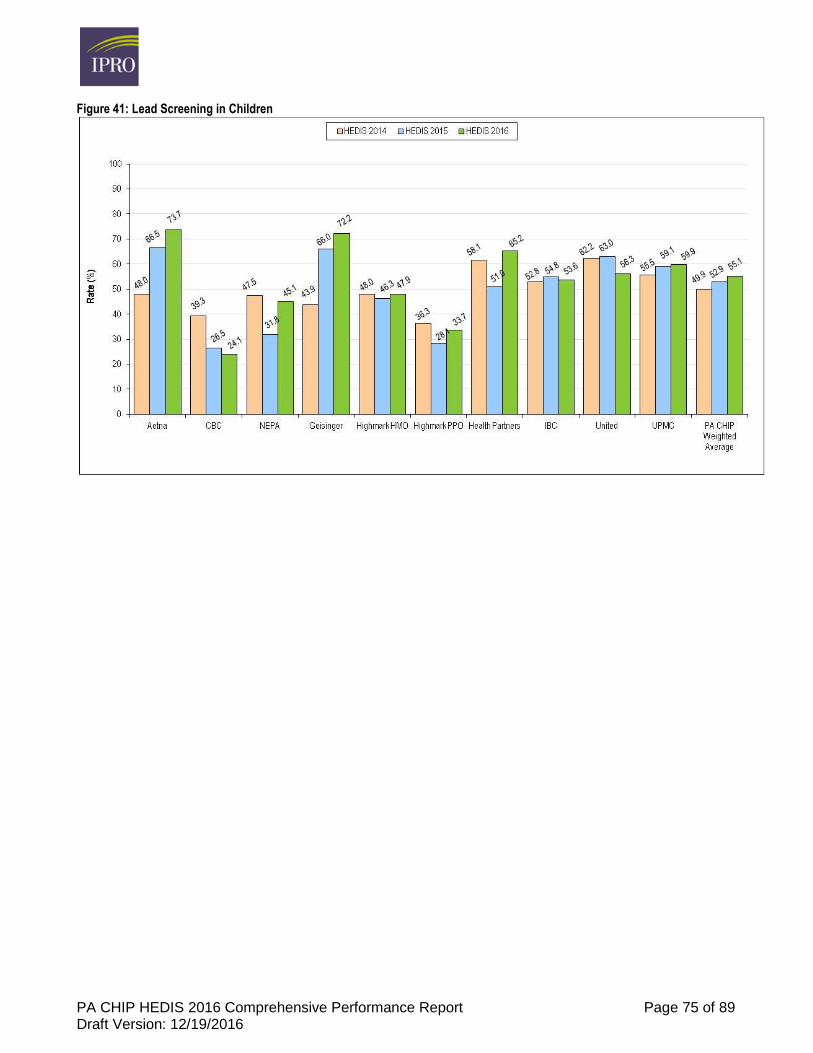
PA CHIP HEDIS 2016 Comprehensive Performance Report Page 75 of 89 Draft Version: 12/19/2016
Figure 41: Lead Screening in Children
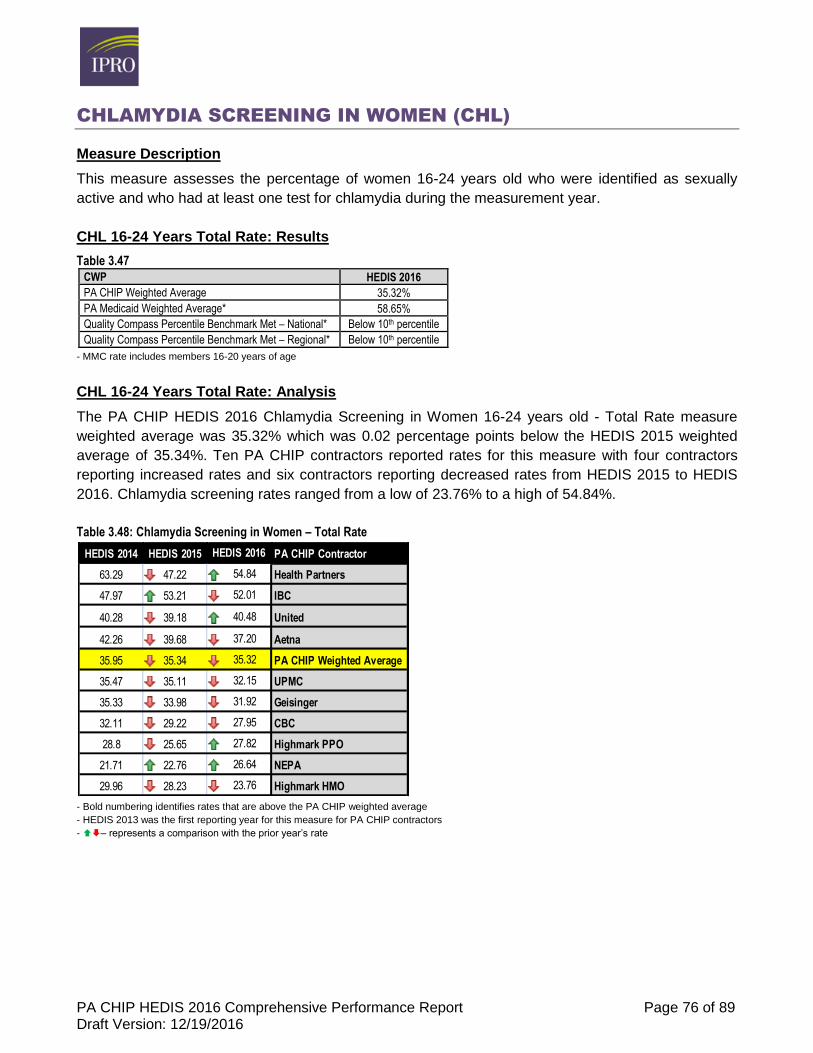
PA CHIP HEDIS 2016 Comprehensive Performance Report Page 76 of 89 Draft Version: 12/19/2016
CHLAMYDIA SCREENING IN WOMEN (CHL)
Measure Description
This measure assesses the percentage of women 16-24 years old who were identified as sexually
active and who had at least one test for chlamydia during the measurement year.
CHL 16-24 Years Total Rate: Results
Table 3.47
CWP HEDIS 2016
PA CHIP Weighted Average 35.32%
PA Medicaid Weighted Average* 58.65%
Quality Compass Percentile Benchmark Met – National* Below 10th percentile
Quality Compass Percentile Benchmark Met – Regional* Below 10th percentile
- MMC rate includes members 16-20 years of age
CHL 16-24 Years Total Rate: Analysis
The PA CHIP HEDIS 2016 Chlamydia Screening in Women 16-24 years old - Total Rate measure
weighted average was 35.32% which was 0.02 percentage points below the HEDIS 2015 weighted
average of 35.34%. Ten PA CHIP contractors reported rates for this measure with four contractors
reporting increased rates and six contractors reporting decreased rates from HEDIS 2015 to HEDIS
2016. Chlamydia screening rates ranged from a low of 23.76% to a high of 54.84%.
Table 3.48: Chlamydia Screening in Women – Total Rate
- Bold numbering identifies rates that are above the PA CHIP weighted average
- HEDIS 2013 was the first reporting year for this measure for PA CHIP contractors
- – represents a comparison with the prior year’s rate
HEDIS 2014 HEDIS 2015 HEDIS 2016 PA CHIP Contractor
63.29 47.22 54.84 Health Partners
47.97 53.21 52.01 IBC
40.28 39.18 40.48 United
42.26 39.68 37.20 Aetna
35.95 35.34 35.32 PA CHIP Weighted Average
35.47 35.11 32.15 UPMC
35.33 33.98 31.92 Geisinger
32.11 29.22 27.95 CBC
28.8 25.65 27.82 Highmark PPO
21.71 22.76 26.64 NEPA
29.96 28.23 23.76 Highmark HMO
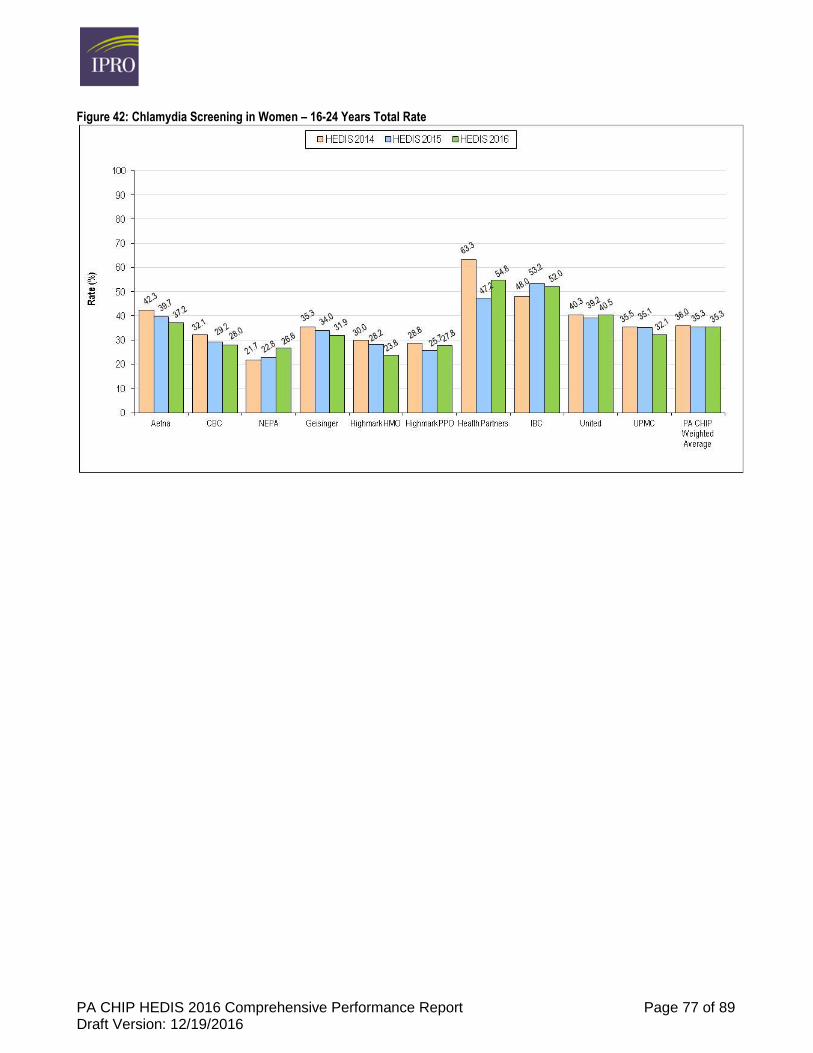
PA CHIP HEDIS 2016 Comprehensive Performance Report Page 77 of 89 Draft Version: 12/19/2016
Figure 42: Chlamydia Screening in Women – 16-24 Years Total Rate
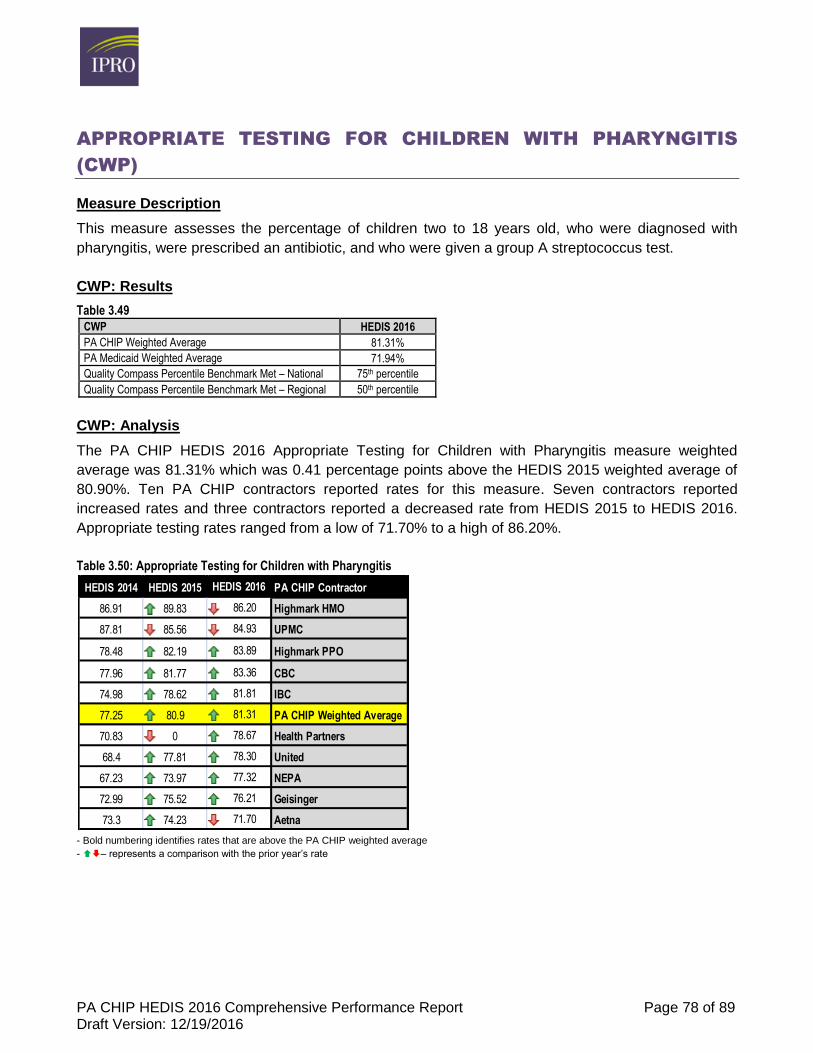
PA CHIP HEDIS 2016 Comprehensive Performance Report Page 78 of 89 Draft Version: 12/19/2016
APPROPRIATE TESTING FOR CHILDREN WITH PHARYNGITIS
(CWP)
Measure Description
This measure assesses the percentage of children two to 18 years old, who were diagnosed with
pharyngitis, were prescribed an antibiotic, and who were given a group A streptococcus test.
CWP: Results
Table 3.49
CWP HEDIS 2016
PA CHIP Weighted Average 81.31%
PA Medicaid Weighted Average 71.94%
Quality Compass Percentile Benchmark Met – National 75th percentile
Quality Compass Percentile Benchmark Met – Regional 50th percentile
CWP: Analysis
The PA CHIP HEDIS 2016 Appropriate Testing for Children with Pharyngitis measure weighted
average was 81.31% which was 0.41 percentage points above the HEDIS 2015 weighted average of
80.90%. Ten PA CHIP contractors reported rates for this measure. Seven contractors reported
increased rates and three contractors reported a decreased rate from HEDIS 2015 to HEDIS 2016.
Appropriate testing rates ranged from a low of 71.70% to a high of 86.20%.
Table 3.50: Appropriate Testing for Children with Pharyngitis
- Bold numbering identifies rates that are above the PA CHIP weighted average
- – represents a comparison with the prior year’s rate
HEDIS 2014 HEDIS 2015 HEDIS 2016 PA CHIP Contractor
86.91 89.83 86.20 Highmark HMO
87.81 85.56 84.93 UPMC
78.48 82.19 83.89 Highmark PPO
77.96 81.77 83.36 CBC
74.98 78.62 81.81 IBC
77.25 80.9 81.31 PA CHIP Weighted Average
70.83 0 78.67 Health Partners
68.4 77.81 78.30 United
67.23 73.97 77.32 NEPA
72.99 75.52 76.21 Geisinger
73.3 74.23 71.70 Aetna
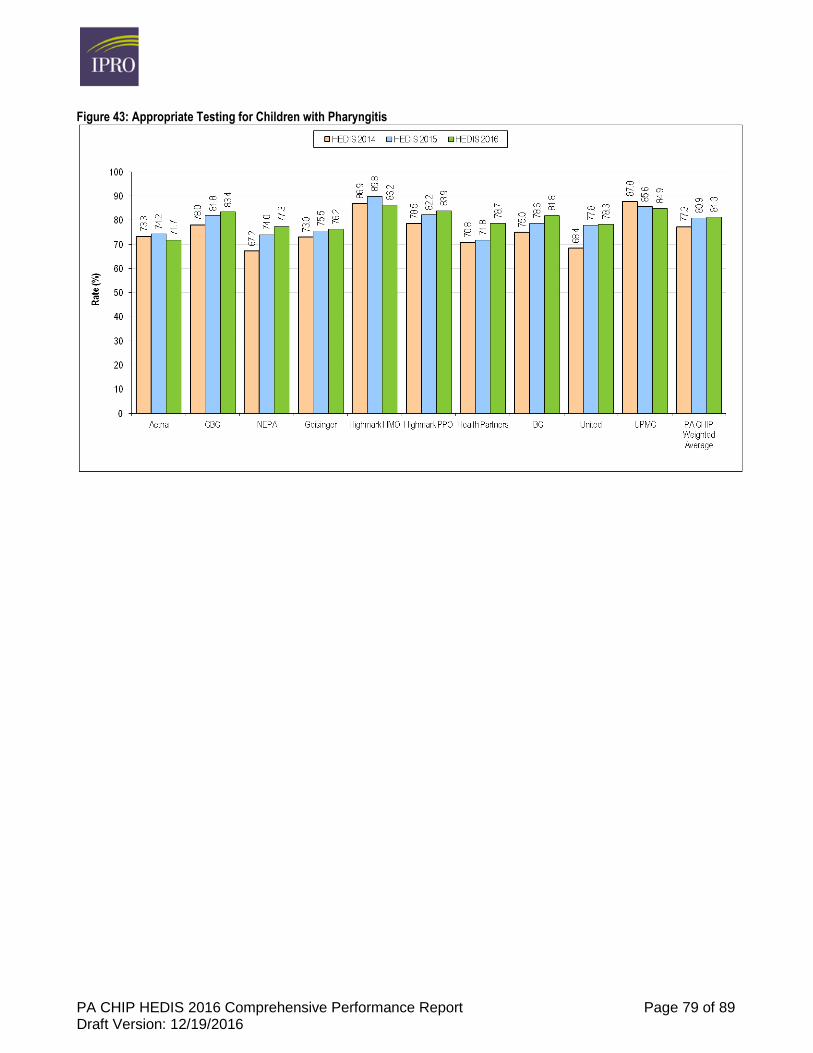
PA CHIP HEDIS 2016 Comprehensive Performance Report Page 79 of 89 Draft Version: 12/19/2016
Figure 43: Appropriate Testing for Children with Pharyngitis
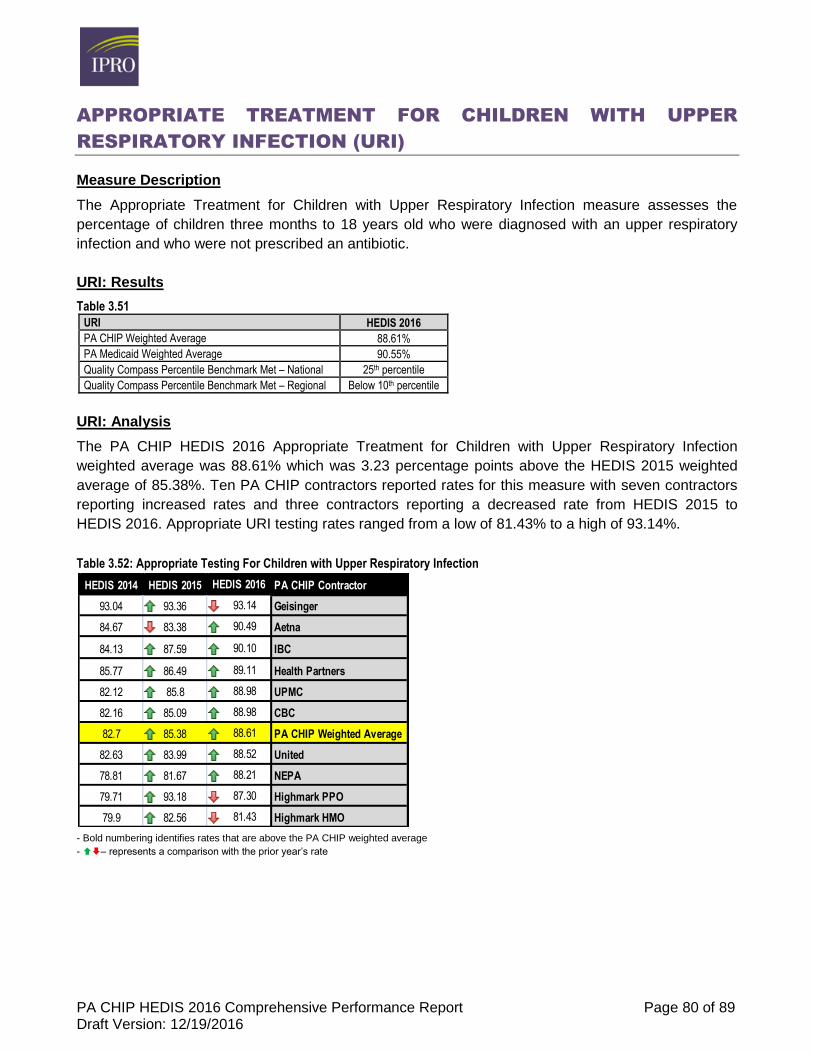
PA CHIP HEDIS 2016 Comprehensive Performance Report Page 80 of 89 Draft Version: 12/19/2016
APPROPRIATE TREATMENT FOR CHILDREN WITH UPPER
RESPIRATORY INFECTION (URI)
Measure Description
The Appropriate Treatment for Children with Upper Respiratory Infection measure assesses the
percentage of children three months to 18 years old who were diagnosed with an upper respiratory
infection and who were not prescribed an antibiotic.
URI: Results
Table 3.51
URI HEDIS 2016
PA CHIP Weighted Average 88.61%
PA Medicaid Weighted Average 90.55%
Quality Compass Percentile Benchmark Met – National 25th percentile
Quality Compass Percentile Benchmark Met – Regional Below 10th percentile
URI: Analysis
The PA CHIP HEDIS 2016 Appropriate Treatment for Children with Upper Respiratory Infection
weighted average was 88.61% which was 3.23 percentage points above the HEDIS 2015 weighted
average of 85.38%. Ten PA CHIP contractors reported rates for this measure with seven contractors
reporting increased rates and three contractors reporting a decreased rate from HEDIS 2015 to
HEDIS 2016. Appropriate URI testing rates ranged from a low of 81.43% to a high of 93.14%.
Table 3.52: Appropriate Testing For Children with Upper Respiratory Infection
- Bold numbering identifies rates that are above the PA CHIP weighted average
- – represents a comparison with the prior year’s rate
HEDIS 2014 HEDIS 2015 HEDIS 2016 PA CHIP Contractor
93.04 93.36 93.14 Geisinger
84.67 83.38 90.49 Aetna
84.13 87.59 90.10 IBC
85.77 86.49 89.11 Health Partners
82.12 85.8 88.98 UPMC
82.16 85.09 88.98 CBC
82.7 85.38 88.61 PA CHIP Weighted Average
82.63 83.99 88.52 United
78.81 81.67 88.21 NEPA
79.71 93.18 87.30 Highmark PPO
79.9 82.56 81.43 Highmark HMO
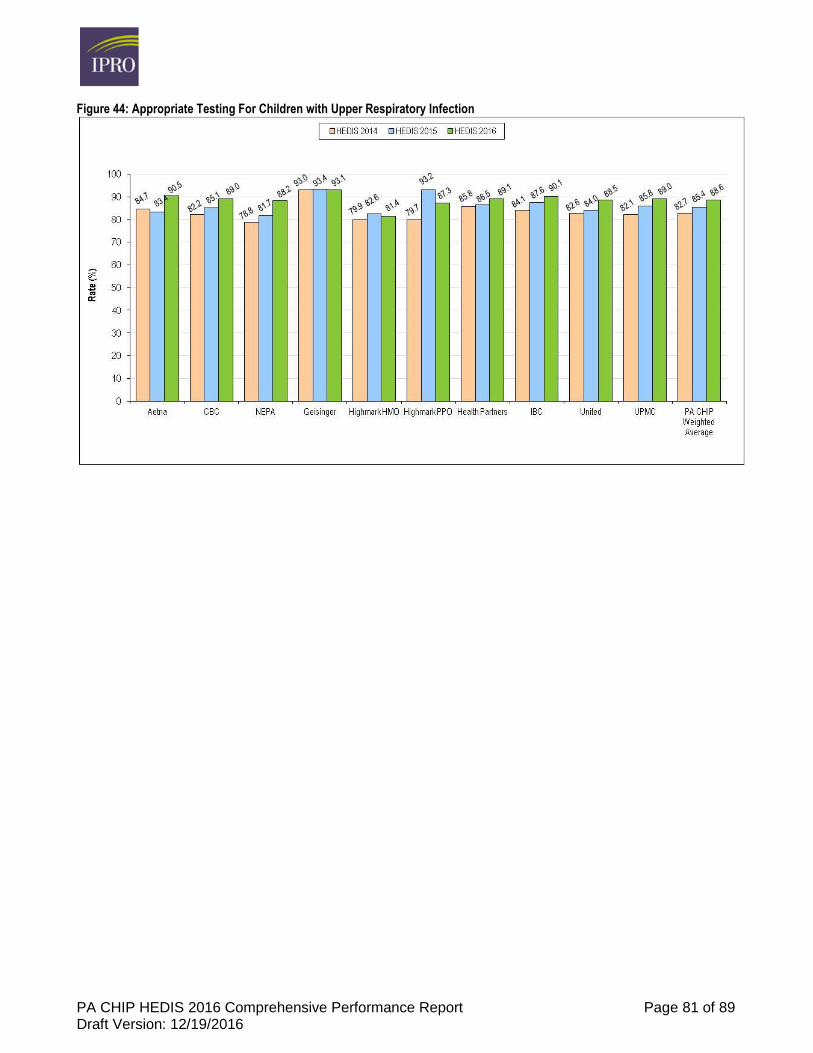
PA CHIP HEDIS 2016 Comprehensive Performance Report Page 81 of 89 Draft Version: 12/19/2016
Figure 44: Appropriate Testing For Children with Upper Respiratory Infection
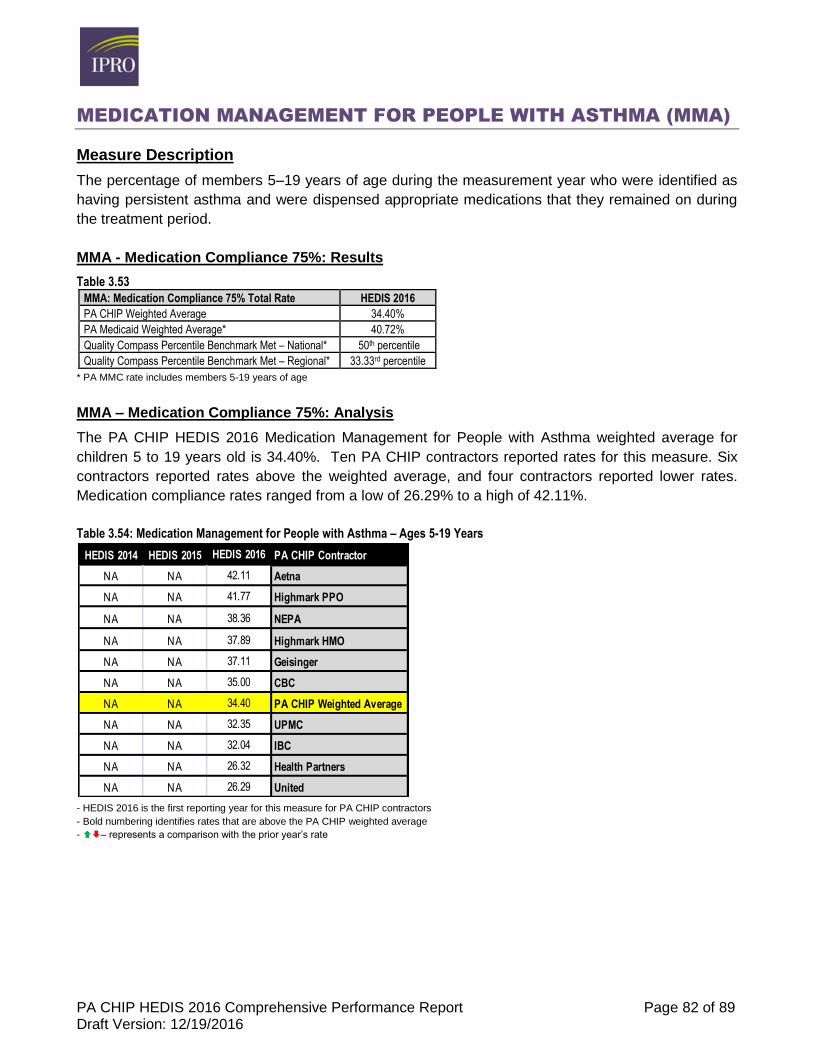
PA CHIP HEDIS 2016 Comprehensive Performance Report Page 82 of 89 Draft Version: 12/19/2016
MEDICATION MANAGEMENT FOR PEOPLE WITH ASTHMA (MMA)
Measure Description
The percentage of members 5–19 years of age during the measurement year who were identified as
having persistent asthma and were dispensed appropriate medications that they remained on during
the treatment period.
MMA - Medication Compliance 75%: Results
Table 3.53
MMA: Medication Compliance 75% Total Rate HEDIS 2016
PA CHIP Weighted Average 34.40%
PA Medicaid Weighted Average* 40.72%
Quality Compass Percentile Benchmark Met – National* 50th percentile
Quality Compass Percentile Benchmark Met – Regional* 33.33rd percentile
* PA MMC rate includes members 5-19 years of age
MMA – Medication Compliance 75%: Analysis
The PA CHIP HEDIS 2016 Medication Management for People with Asthma weighted average for
children 5 to 19 years old is 34.40%. Ten PA CHIP contractors reported rates for this measure. Six
contractors reported rates above the weighted average, and four contractors reported lower rates.
Medication compliance rates ranged from a low of 26.29% to a high of 42.11%.
Table 3.54: Medication Management for People with Asthma – Ages 5-19 Years
- HEDIS 2016 is the first reporting year for this measure for PA CHIP contractors
- Bold numbering identifies rates that are above the PA CHIP weighted average
- – represents a comparison with the prior year’s rate
HEDIS 2014 HEDIS 2015 HEDIS 2016 PA CHIP Contractor
NA NA 42.11 Aetna
NA NA 41.77 Highmark PPO
NA NA 38.36 NEPA
NA NA 37.89 Highmark HMO
NA NA 37.11 Geisinger
NA NA 35.00 CBC
NA NA 34.40 PA CHIP Weighted Average
NA NA 32.35 UPMC
NA NA 32.04 IBC
NA NA 26.32 Health Partners
NA NA 26.29 United
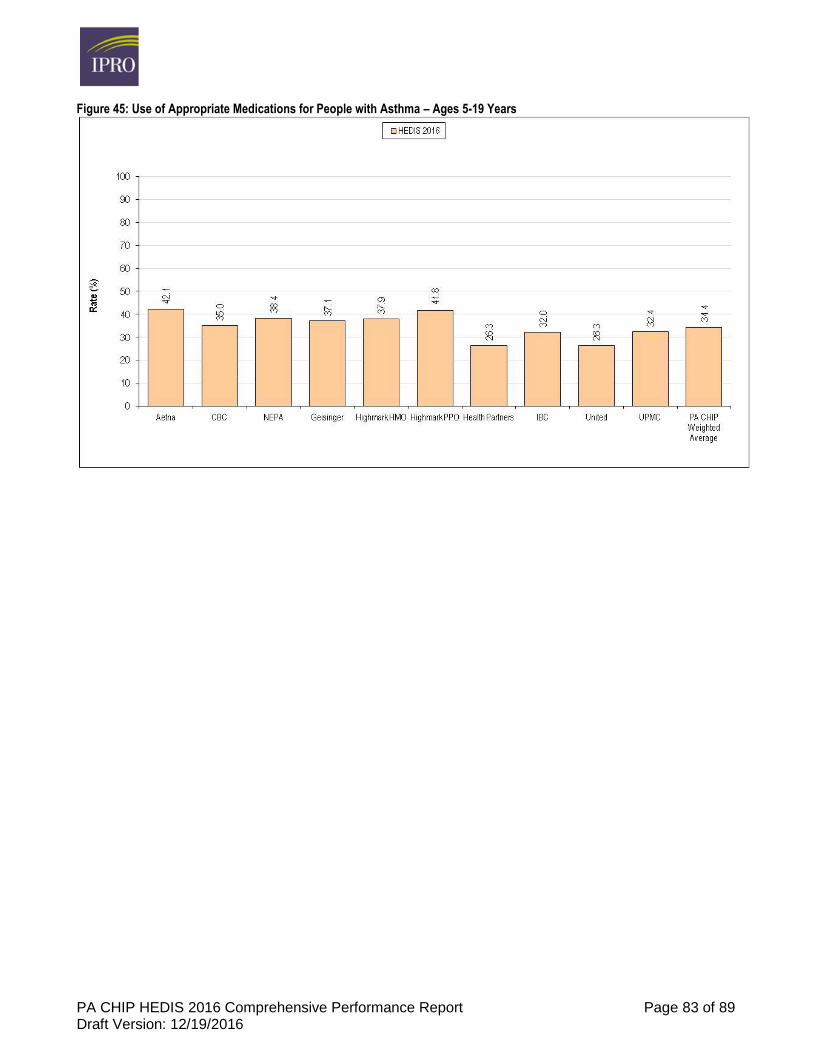
PA CHIP HEDIS 2016 Comprehensive Performance Report Page 83 of 89 Draft Version: 12/19/2016
Figure 45: Use of Appropriate Medications for People with Asthma – Ages 5-19 Years
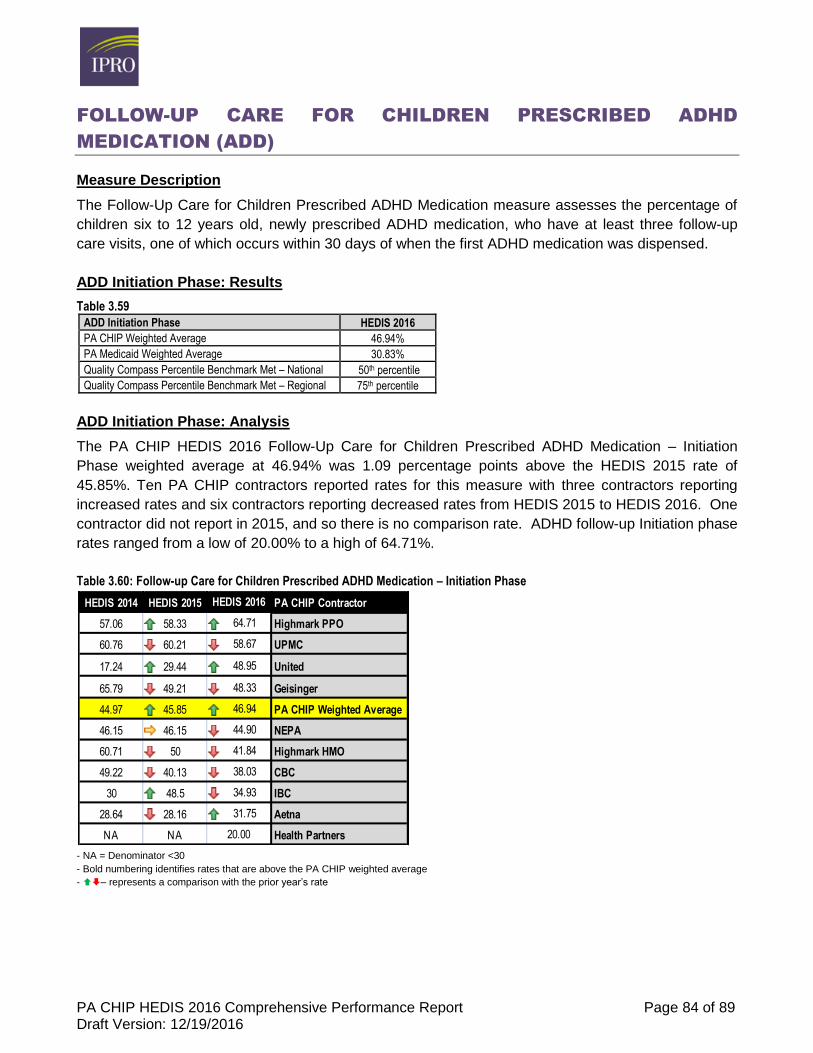
PA CHIP HEDIS 2016 Comprehensive Performance Report Page 84 of 89 Draft Version: 12/19/2016
FOLLOW-UP CARE FOR CHILDREN PRESCRIBED ADHD
MEDICATION (ADD)
Measure Description
The Follow-Up Care for Children Prescribed ADHD Medication measure assesses the percentage of
children six to 12 years old, newly prescribed ADHD medication, who have at least three follow-up
care visits, one of which occurs within 30 days of when the first ADHD medication was dispensed.
ADD Initiation Phase: Results
Table 3.59
ADD Initiation Phase HEDIS 2016
PA CHIP Weighted Average 46.94%
PA Medicaid Weighted Average 30.83%
Quality Compass Percentile Benchmark Met – National 50th percentile
Quality Compass Percentile Benchmark Met – Regional 75th percentile
ADD Initiation Phase: Analysis
The PA CHIP HEDIS 2016 Follow-Up Care for Children Prescribed ADHD Medication – Initiation
Phase weighted average at 46.94% was 1.09 percentage points above the HEDIS 2015 rate of
45.85%. Ten PA CHIP contractors reported rates for this measure with three contractors reporting
increased rates and six contractors reporting decreased rates from HEDIS 2015 to HEDIS 2016. One
contractor did not report in 2015, and so there is no comparison rate. ADHD follow-up Initiation phase
rates ranged from a low of 20.00% to a high of 64.71%.
Table 3.60: Follow-up Care for Children Prescribed ADHD Medication – Initiation Phase
- NA = Denominator <30
- Bold numbering identifies rates that are above the PA CHIP weighted average
- – represents a comparison with the prior year’s rate
HEDIS 2014 HEDIS 2015 HEDIS 2016 PA CHIP Contractor
57.06 58.33 64.71 Highmark PPO
60.76 60.21 58.67 UPMC
17.24 29.44 48.95 United
65.79 49.21 48.33 Geisinger
44.97 45.85 46.94 PA CHIP Weighted Average
46.15 46.15 44.90 NEPA
60.71 50 41.84 Highmark HMO
49.22 40.13 38.03 CBC
30 48.5 34.93 IBC
28.64 28.16 31.75 Aetna
NA NA 20.00 Health Partners
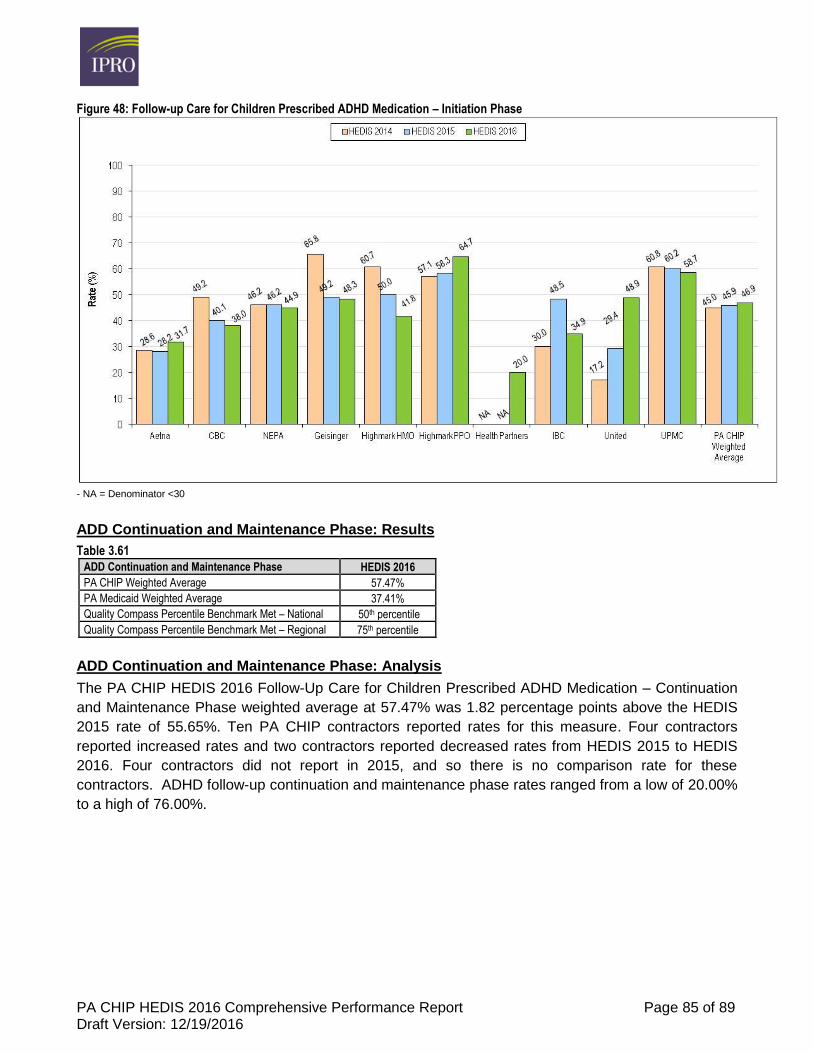
PA CHIP HEDIS 2016 Comprehensive Performance Report Page 85 of 89 Draft Version: 12/19/2016
Figure 48: Follow-up Care for Children Prescribed ADHD Medication – Initiation Phase
- NA = Denominator <30
ADD Continuation and Maintenance Phase: Results
Table 3.61
ADD Continuation and Maintenance Phase HEDIS 2016
PA CHIP Weighted Average 57.47%
PA Medicaid Weighted Average 37.41%
Quality Compass Percentile Benchmark Met – National 50th percentile
Quality Compass Percentile Benchmark Met – Regional 75th percentile
ADD Continuation and Maintenance Phase: Analysis
The PA CHIP HEDIS 2016 Follow-Up Care for Children Prescribed ADHD Medication – Continuation
and Maintenance Phase weighted average at 57.47% was 1.82 percentage points above the HEDIS
2015 rate of 55.65%. Ten PA CHIP contractors reported rates for this measure. Four contractors
reported increased rates and two contractors reported decreased rates from HEDIS 2015 to HEDIS
2016. Four contractors did not report in 2015, and so there is no comparison rate for these
contractors. ADHD follow-up continuation and maintenance phase rates ranged from a low of 20.00%
to a high of 76.00%.
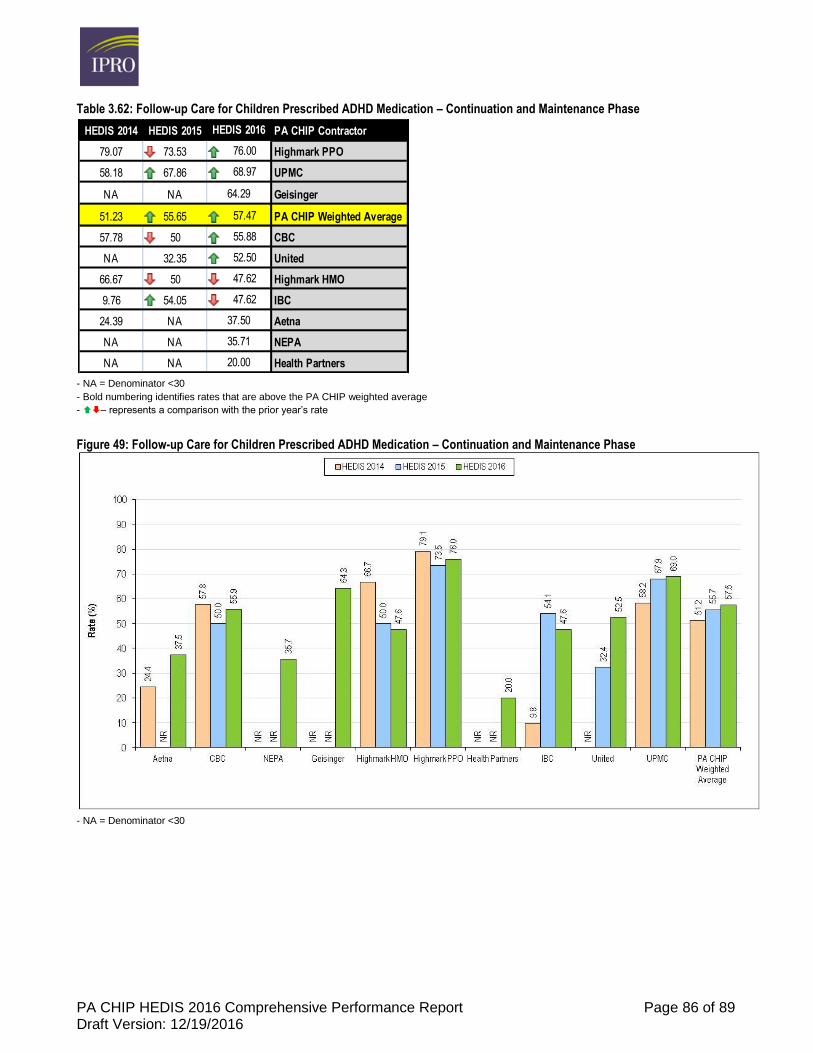
PA CHIP HEDIS 2016 Comprehensive Performance Report Page 86 of 89 Draft Version: 12/19/2016
Table 3.62: Follow-up Care for Children Prescribed ADHD Medication – Continuation and Maintenance Phase
- NA = Denominator <30
- Bold numbering identifies rates that are above the PA CHIP weighted average
- – represents a comparison with the prior year’s rate
Figure 49: Follow-up Care for Children Prescribed ADHD Medication – Continuation and Maintenance Phase
- NA = Denominator <30
HEDIS 2014 HEDIS 2015 HEDIS 2016 PA CHIP Contractor
79.07 73.53 76.00 Highmark PPO
58.18 67.86 68.97 UPMC
NA NA 64.29 Geisinger
51.23 55.65 57.47 PA CHIP Weighted Average
57.78 50 55.88 CBC
NA 32.35 52.50 United
66.67 50 47.62 Highmark HMO
9.76 54.05 47.62 IBC
24.39 NA 37.50 Aetna
NA NA 35.71 NEPA
NA NA 20.00 Health Partners
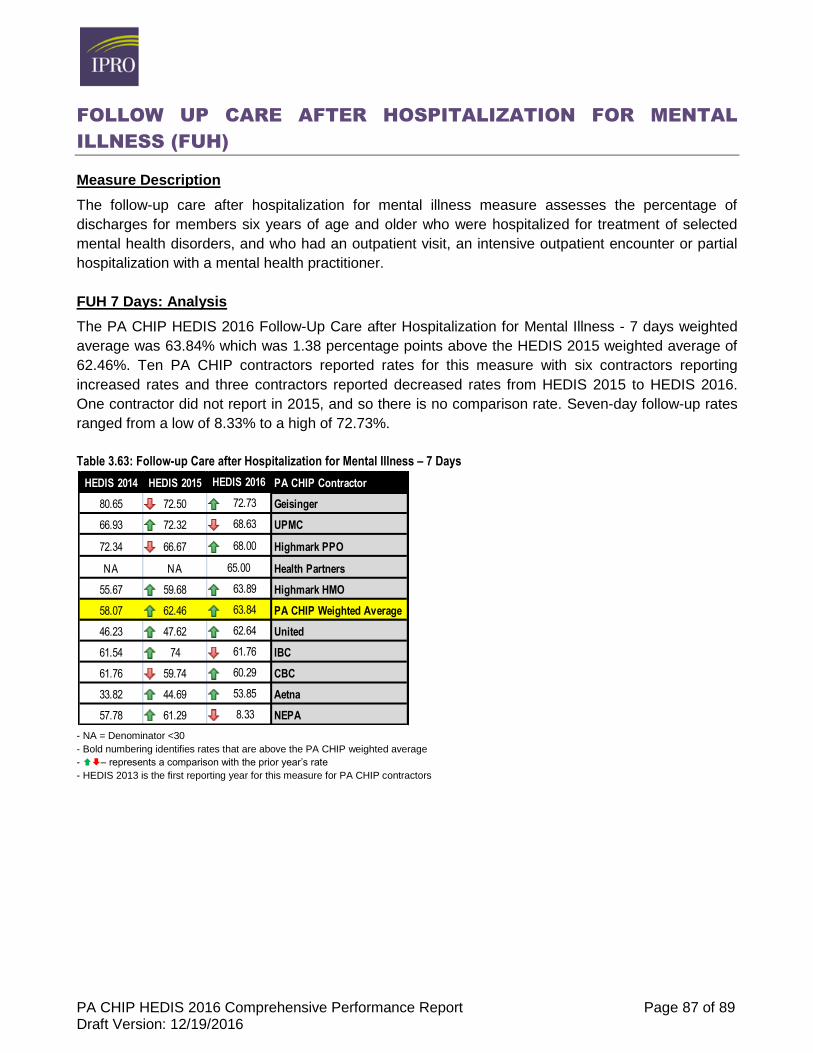
PA CHIP HEDIS 2016 Comprehensive Performance Report Page 87 of 89 Draft Version: 12/19/2016
FOLLOW UP CARE AFTER HOSPITALIZATION FOR MENTAL
ILLNESS (FUH)
Measure Description
The follow-up care after hospitalization for mental illness measure assesses the percentage of
discharges for members six years of age and older who were hospitalized for treatment of selected
mental health disorders, and who had an outpatient visit, an intensive outpatient encounter or partial
hospitalization with a mental health practitioner.
FUH 7 Days: Analysis
The PA CHIP HEDIS 2016 Follow-Up Care after Hospitalization for Mental Illness - 7 days weighted
average was 63.84% which was 1.38 percentage points above the HEDIS 2015 weighted average of
62.46%. Ten PA CHIP contractors reported rates for this measure with six contractors reporting
increased rates and three contractors reported decreased rates from HEDIS 2015 to HEDIS 2016.
One contractor did not report in 2015, and so there is no comparison rate. Seven-day follow-up rates
ranged from a low of 8.33% to a high of 72.73%.
Table 3.63: Follow-up Care after Hospitalization for Mental Illness – 7 Days
- NA = Denominator <30
- Bold numbering identifies rates that are above the PA CHIP weighted average
- – represents a comparison with the prior year’s rate
- HEDIS 2013 is the first reporting year for this measure for PA CHIP contractors
HEDIS 2014 HEDIS 2015 HEDIS 2016 PA CHIP Contractor
80.65 72.50 72.73 Geisinger
66.93 72.32 68.63 UPMC
72.34 66.67 68.00 Highmark PPO
NA NA 65.00 Health Partners
55.67 59.68 63.89 Highmark HMO
58.07 62.46 63.84 PA CHIP Weighted Average
46.23 47.62 62.64 United
61.54 74 61.76 IBC
61.76 59.74 60.29 CBC
33.82 44.69 53.85 Aetna
57.78 61.29 8.33 NEPA
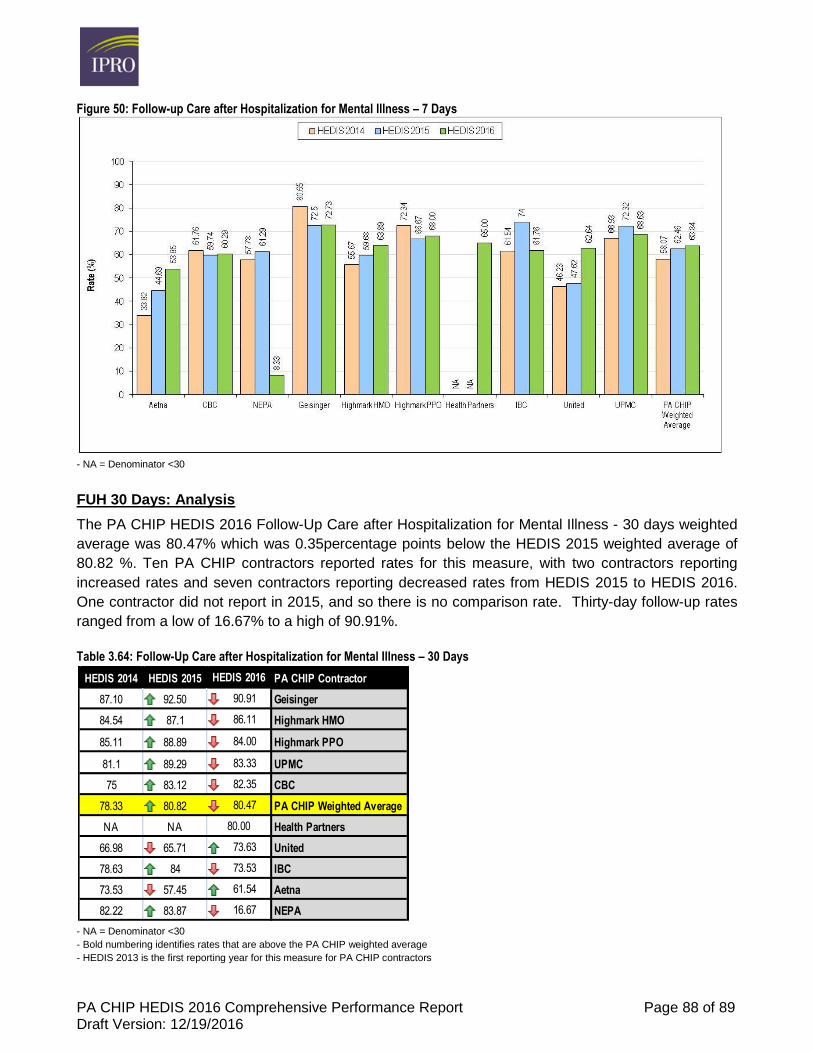
PA CHIP HEDIS 2016 Comprehensive Performance Report Page 88 of 89 Draft Version: 12/19/2016
Figure 50: Follow-up Care after Hospitalization for Mental Illness – 7 Days
- NA = Denominator <30
FUH 30 Days: Analysis
The PA CHIP HEDIS 2016 Follow-Up Care after Hospitalization for Mental Illness - 30 days weighted
average was 80.47% which was 0.35percentage points below the HEDIS 2015 weighted average of
80.82 %. Ten PA CHIP contractors reported rates for this measure, with two contractors reporting
increased rates and seven contractors reporting decreased rates from HEDIS 2015 to HEDIS 2016.
One contractor did not report in 2015, and so there is no comparison rate. Thirty-day follow-up rates
ranged from a low of 16.67% to a high of 90.91%.
Table 3.64: Follow-Up Care after Hospitalization for Mental Illness – 30 Days
- NA = Denominator <30
- Bold numbering identifies rates that are above the PA CHIP weighted average
- HEDIS 2013 is the first reporting year for this measure for PA CHIP contractors
HEDIS 2014 HEDIS 2015 HEDIS 2016 PA CHIP Contractor
87.10 92.50 90.91 Geisinger
84.54 87.1 86.11 Highmark HMO
85.11 88.89 84.00 Highmark PPO
81.1 89.29 83.33 UPMC
75 83.12 82.35 CBC
78.33 80.82 80.47 PA CHIP Weighted Average
NA NA 80.00 Health Partners
66.98 65.71 73.63 United
78.63 84 73.53 IBC
73.53 57.45 61.54 Aetna
82.22 83.87 16.67 NEPA
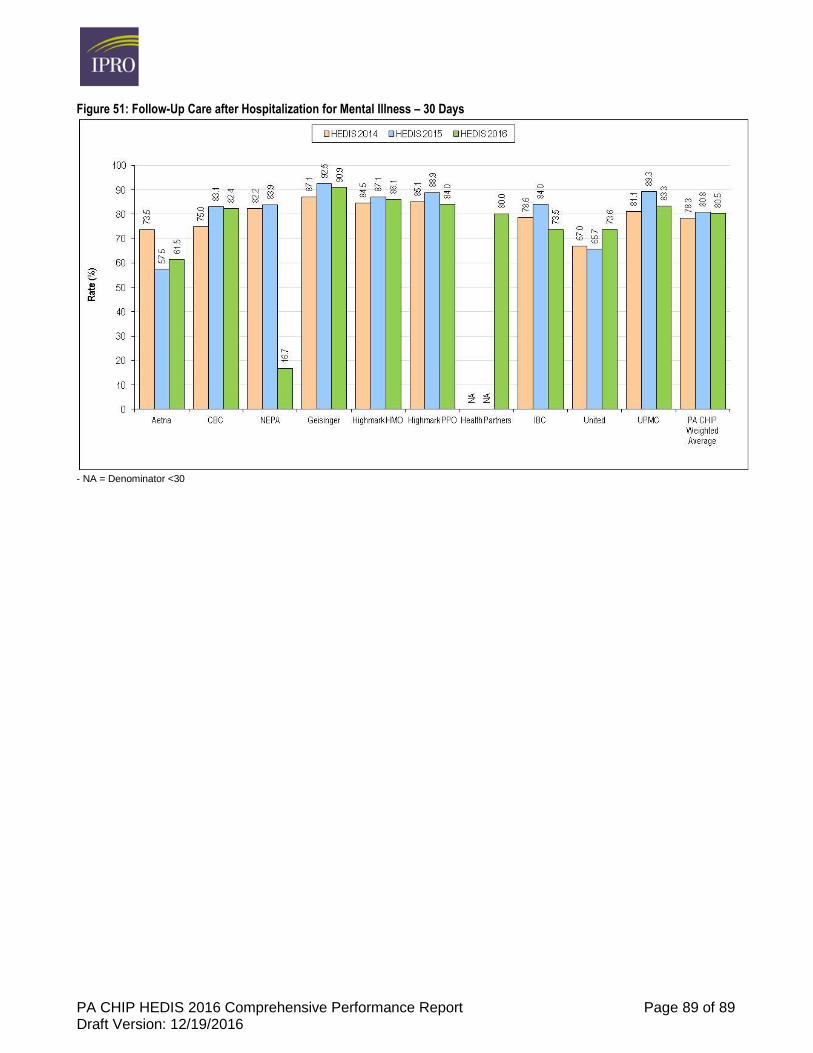
PA CHIP HEDIS 2016 Comprehensive Performance Report Page 89 of 89 Draft Version: 12/19/2016
Figure 51: Follow-Up Care after Hospitalization for Mental Illness – 30 Days
- NA = Denominator <30