Embed Size (px)
Citation preview
Access to Electricity, Food Security and Poverty Reduction in Rural
South-western Nigeria
Awotide, B.A., T.T. Awoyemi, and A.O. Obayelu
A paper prepared for Presentation at the Nigerian Association for Energy Economics
Conference, Sheraton Hotel, Lagos, Nigeria.
April 22-23, 2013

PRESENTATION OUTLINE
• Introduction/Problem Statement• Research Questions• Objectives of the Study• Justification of the Study• Estimation Techniques• Results and Discussion• Summary, Conclusion and Policy
Recommendation

INTRODUCTION/PROBLEM STATEMENT
• The use of electricity in rural areas is basically for household lighting. :This is due to the fact that electric light is much brighter than that provided by kerosene lamps, and can be hundreds of time cheaper
• Rural electrification can boost and smooth agricultural output in most developing countries, thereby increasing farm-income by inducing farmers to use irrigation equipment, tools and high yielding farm practices.
• in Bangladesh and India, rural electrification enhance the use of irrigation, thereby significantly reducing poverty incidence ( Songco, 2002)
• average annual income of households with electricity was 64.5% higher than that in the non electrified villages, and 126.1 % higher than that in the households without access to electricity in electrified villages (Barkat et al., 2002).
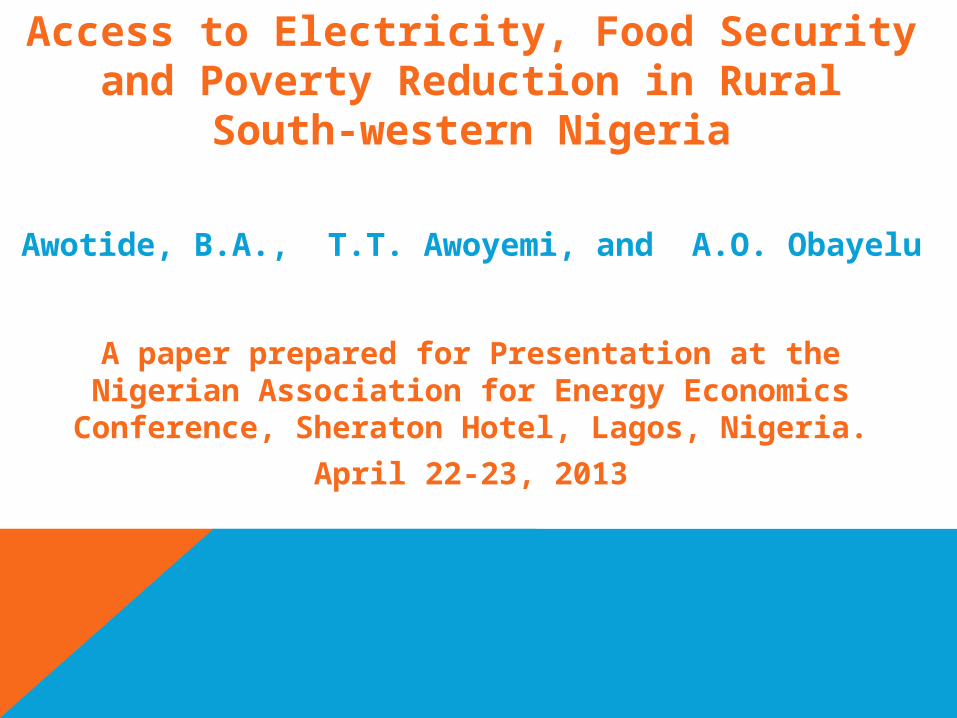
GLOBAL ACCESS TO ELECTRICITYRegion Total Urban Rural
Africa 37.8 67.9 19.0
North Africa 95.5 98.7 91.8
Sub-Saharan Africa 25.9 58.3 8.0
Developing Asia 72.8 86.4 65.1
China and East Asia 88.5 94.9 84.0
South Asia 51.8 69.7 44.7
Latin America 90.0 98.0 65.6
Middle Easta 78.1 86.7 61.8
Developing countries 68.3 85.2 56.4
Transition economiesa and OECDb 99.5 100 98.1
World total 75.6 90.4 61.7
Source: IEA, 2006
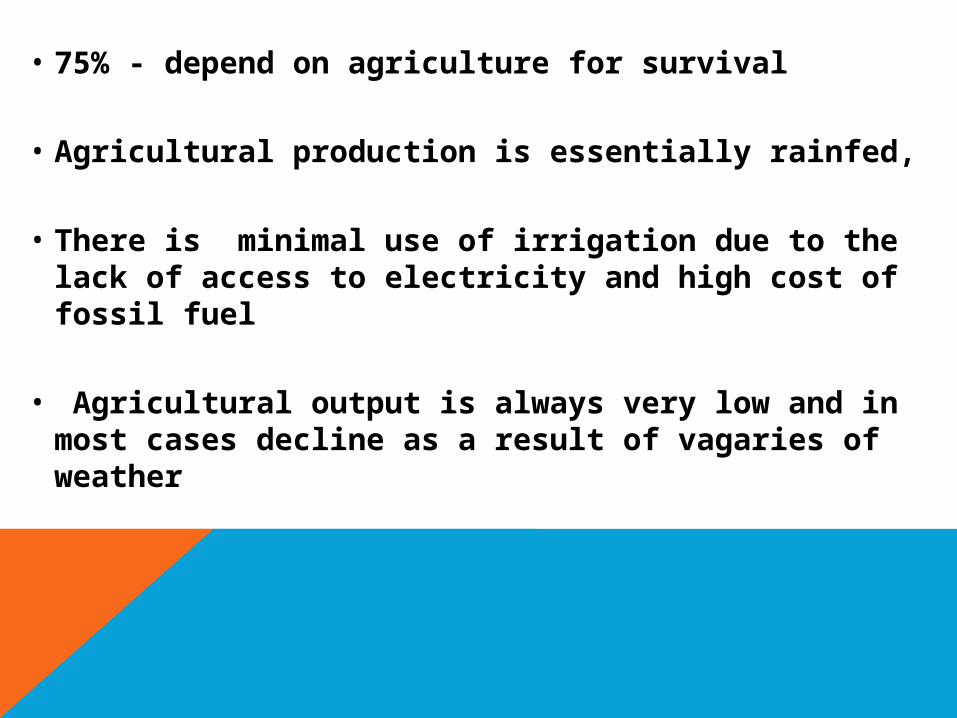
• 75% - depend on agriculture for survival
• Agricultural production is essentially rainfed,
• There is minimal use of irrigation due to the lack of access to electricity and high cost of fossil fuel
• Agricultural output is always very low and in most cases decline as a result of vagaries of weather
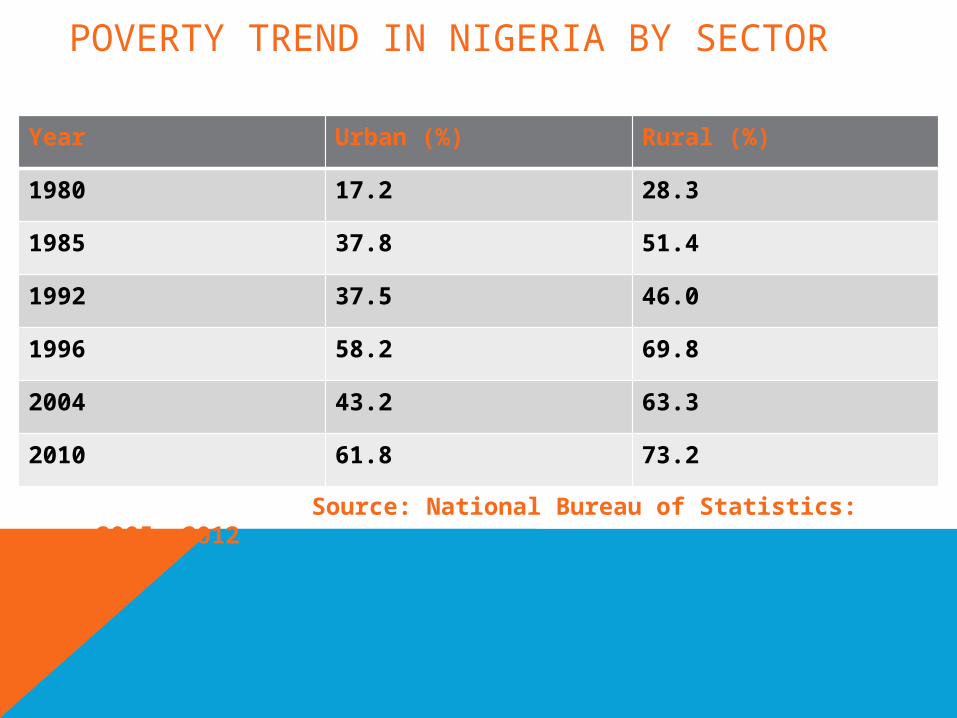
POVERTY TREND IN NIGERIA BY SECTOR
Year Urban (%) Rural (%)
1980 17.2 28.3
1985 37.8 51.4
1992 37.5 46.0
1996 58.2 69.8
2004 43.2 63.3
2010 61.8 73.2
Source: National Bureau of Statistics: 2005; 2012

RESEARCH QUESTIONS
• What are the factors that determine rural households access to electricity
• What is the food security and poverty status among the households with and without access to electricity
• What is the impact of access to electricity on food security and poverty reduction among the respondents

OBJECTIVES OF THE STUDY
Impact of access to electricity on food security and poverty reduction
Specifically:• Investigate the determinants of access to
electricity
• Assess food security and poverty status among the respondents
• Empirically determine the impact of access to electricity on food security and poverty reduction
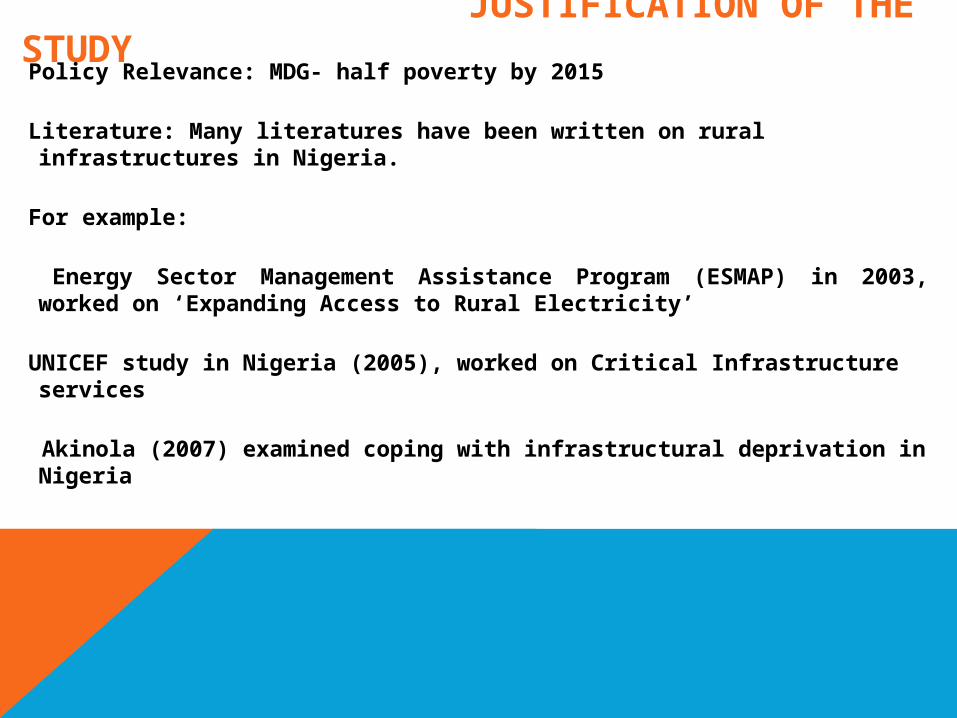
JUSTIFICATION OF THE STUDYPolicy Relevance: MDG- half poverty by 2015
Literature: Many literatures have been written on rural infrastructures in Nigeria.
For example:
Energy Sector Management Assistance Program (ESMAP) in 2003, worked on ‘Expanding Access to Rural Electricity’
UNICEF study in Nigeria (2005), worked on Critical Infrastructure services
Akinola (2007) examined coping with infrastructural deprivation in Nigeria

• Santosh and Ganesh (2011), conducted a study to investigate the income and educational impacts of a large village-based electrification program in rural Bhutan
• Khandker et al. (2008) assessed the welfare impact of rural electrification in Vietnam using panel surveys conducted in 2002 and 2005 for some 1100 households in rural Vietnam.
• Khandker,et al. (2009) investigated the welfare impact of rural electrification using a cross-sectional survey conducted in 2005 of some 20,000 households in rural Bangladesh.
• Awotide et al., (2012) assessed the impact of rural electrification on household welfare in Nigeria
• No study on food security and poverty reduction: Gap

ANALYTICAL TECHNIQUES
• Determinants of Access to Electricity: Logit Model
• Measurement of Food Security
Z=food security line (2/3 mean per capita food expenditure)q is the number of households below the food security line,N is the total number of households in the total populationis the per capita food expenditure of household iP is the extent at which a household is food insecure
1
m
i i i ii
Z X U
1
1 q
ii
P GiN
Z Yi
GiZ

• Measurement of Poverty Indices
z is the poverty line,
is the per capita consumption expenditure of farmer
n- is the total number of farmers.
• Average Treatment Effect (ATE) Estimation
ATE1=
ATE1 = is the treatment effect on the treated
1
1( ) max ,0
mi
i
z cp
n z
ic
( | 1, ) ( ) .t C T Ci i iE Y T X E X

DATA COLLECTION • Multistage random sampling technique:
• First stage: Osun and Ekiti states were randomly selected from the six states in South-West, Nigeria.
• Second stage: 3 Local Government Areas (LGA) with and without access to electricity were randomly selected from each of the state.
• Third stage,: 2 villages were randomly selected from each of the LGAs.
• Last stage : random selection of 20 households from each of the selected villages. In total, 240 rural households were randomly selected for the analysis.
• Data collected: socio-economic/demographic characteristics, income, expenditure, etc. However, after through data cleaning and management only 219 respondents, representing about 91% were utilised for the analysis.

Results and Discussion
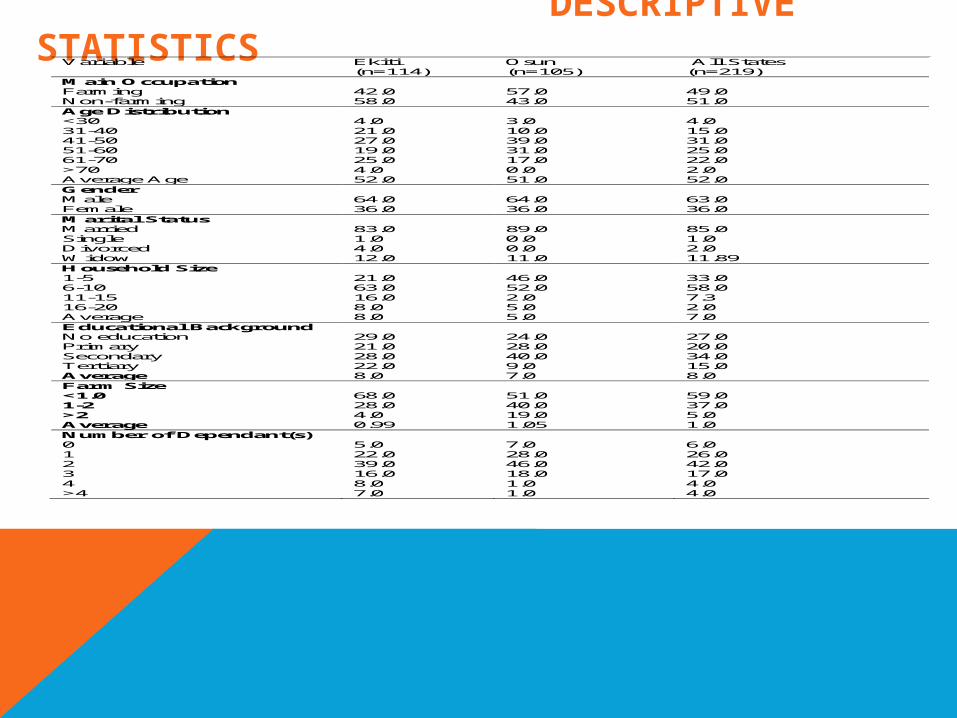
DESCRIPTIVE STATISTICSVariable Ekiti
(n=114) Osun (n=105)
All States (n=219)
Main Occupation Farming Non-farming
42.0 58.0
57.0 43.0
49.0 51.0
Age Distribution <30 31-40 41-50 51-60 61-70 >70 Average Age
4.0 21.0 27.0 19.0 25.0 4.0 52.0
3.0 10.0 39.0 31.0 17.0 0.0 51.0
4.0 15.0 31.0 25.0 22.0 2.0 52.0
Gender Male Female
64.0 36.0
64.0 36.0
63.0 36.0
Marital Status Married Single Divorced Widow
83.0 1.0 4.0 12.0
89.0 0.0 0.0 11.0
85.0 1.0 2.0 11.89
Household Size 1-5 6-10 11-15 16-20 Average
21.0 63.0 16.0 8.0 8.0
46.0 52.0 2.0 5.0 5.0
33.0 58.0 7.3 2.0 7.0
Educational Background No education Primary Secondary Tertiary Average
29.0 21.0 28.0 22.0 8.0
24.0 28.0 40.0 9.0 7.0
27.0 20.0 34.0 15.0 8.0
Farm Size <1.0 1-2 >2 Average
68.0 28.0 4.0 0.99
51.0 40.0 19.0 1.05
59.0 37.0 5.0 1.0
Number of Dependant(s) 0 1 2 3 4 >4
5.0 22.0 39.0 16.0 8.0 7.0
7.0 28.0 46.0 18.0 1.0 1.0
6.0 26.0 42.0 17.0 4.0 4.0
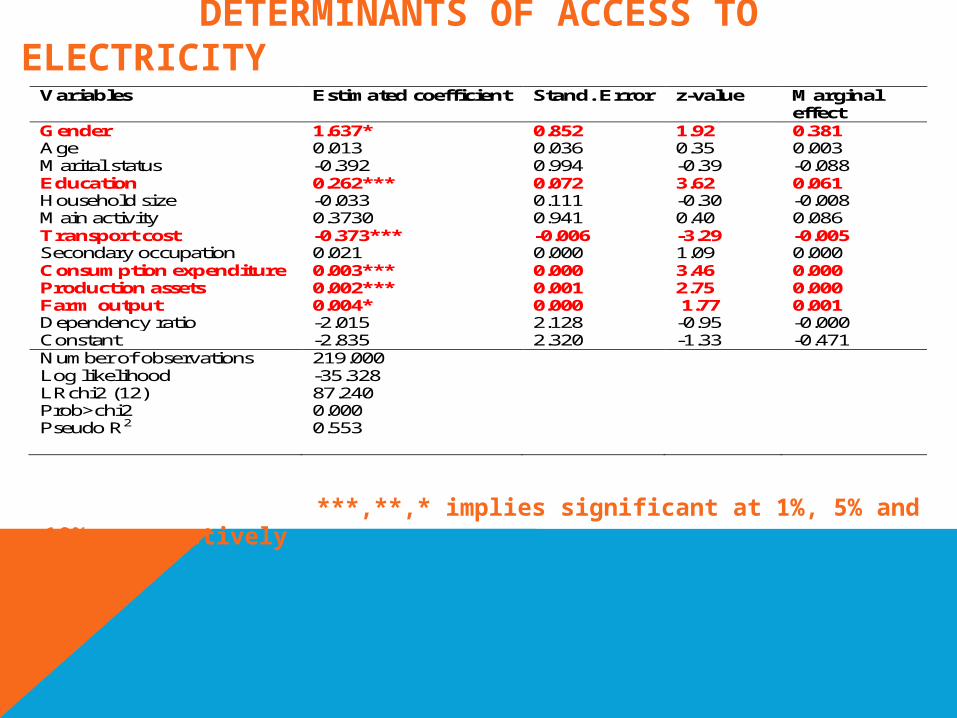
DETERMINANTS OF ACCESS TO ELECTRICITY
Variables Estimated coefficient Stand. Error z-value Marginal effect
Gender 1.637* 0.852 1.92 0.381 Age 0.013 0.036 0.35 0.003 Marital status -0.392 0.994 -0.39 -0.088 Education 0.262*** 0.072 3.62 0.061 Household size -0.033 0.111 -0.30 -0.008 Main activity 0.3730 0.941 0.40 0.086 Transport cost -0.373*** -0.006 -3.29 -0.005 Secondary occupation 0.021 0.000 1.09 0.000 Consumption expenditure 0.003*** 0.000 3.46 0.000 Production assets 0.002*** 0.001 2.75 0.000 Farm output 0.004* 0.000 1.77 0.001 Dependency ratio -2.015 2.128 -0.95 -0.000 Constant -2.835 2.320 -1.33 -0.471 Number of observations Log likelihood LRchi2 (12) Prob>chi2 Pseudo R2
219.000 -35.328 87.240 0.000 0.553
***,**,* implies significant at 1%, 5% and 10%, respectively

POVERTY INDICES BY ACCESS TO ELECTRICITY
Poverty Indices Access to Electricity
0P 1P 2P
Ekiti State Access 30.51 6.24 1.98 No Access 47.27 16.17 7.58 Total 38.59 11.03 4.68 Percentage Difference -34.46 -61.41 -73.88
Osun State Access 6.89 0.86 0.13 No Access 59.57 13.84 5.44 Total 30.48 6.66 2.50 Percentage Difference -88.43 -93.79 -97.61
All State Access 18.80 3.34 0.96 No Access 52.94 15.36 6.60 Total 34.70 8.94 3.59 Percentage Difference -64.49 -78.26 -85.45
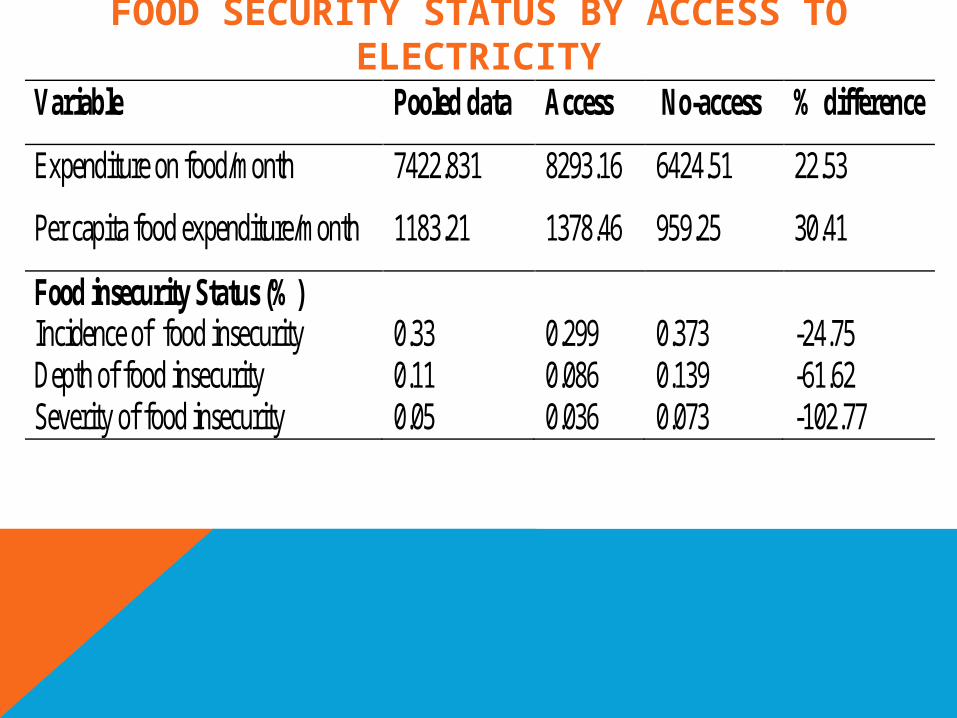
FOOD SECURITY STATUS BY ACCESS TO ELECTRICITY
Variable Pooled data Access No-access % difference
Expenditure on food/month 7422.831 8293.16 6424.51 22.53
Per capita food expenditure/month 1183.21 1378.46 959.25 30.41
Food insecurity Status (%) Incidence of food insecurity Depth of food insecurity Severity of food insecurity
0.33 0.11 0.05
0.299 0.086 0.036
0.373 0.139 0.073
-24.75 -61.62 -102.77
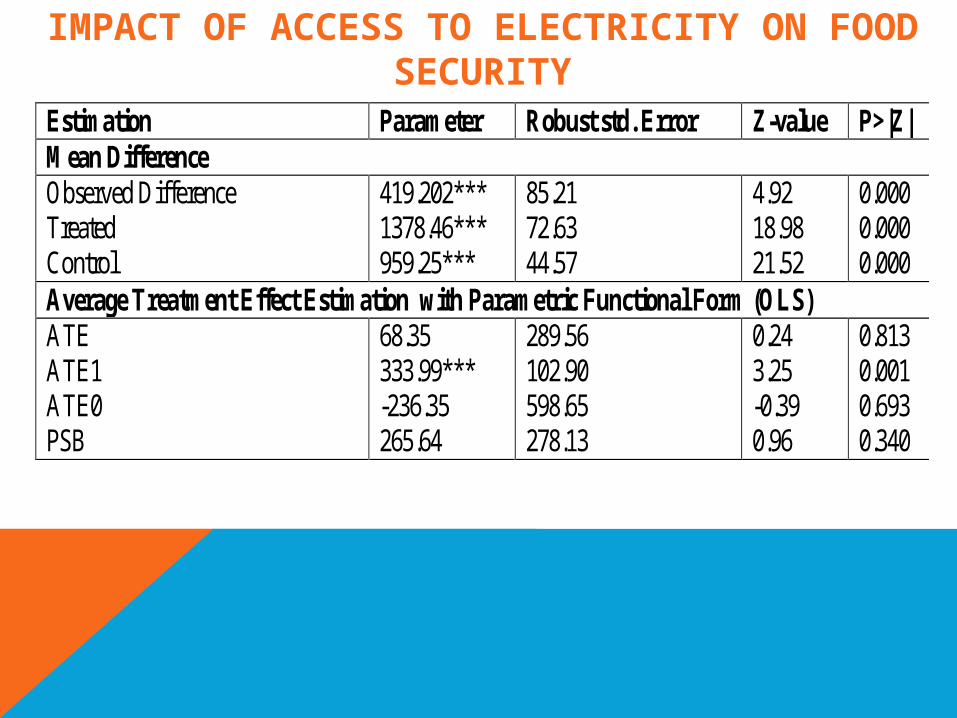
IMPACT OF ACCESS TO ELECTRICITY ON FOOD SECURITY
Estimation Parameter Robust std. Error Z-value P>|Z| Mean Difference Observed Difference Treated Control
419.202*** 1378.46*** 959.25***
85.21 72.63 44.57
4.92 18.98 21.52
0.000 0.000 0.000
Average Treatment Effect Estimation with Parametric Functional Form (OLS) ATE ATE1 ATE0 PSB
68.35 333.99*** -236.35 265.64
289.56 102.90 598.65 278.13
0.24 3.25 -0.39 0.96
0.813 0.001 0.693 0.340

IMPACT OF ACCESS TO ELECTRICITY ON PER CAPITA INCOME
Estimation Parameter Robust std. Error Z-value P>|Z| Mean Difference Observed Difference Treated Control
28434.21 67279.66*** 38845***
18385.96 17896.23 4215.26
1.55 3.76 9.22
0.122 0.000 0.000
Average Treatment Effect Estimation with Parametric Functional Form (OLS) ATE ATE1 ATE0 PSB
30415.41 131871.16*** 51695.56*** -17244.26
8844.23 2041.22 18908.83 8256.51
3.44 6.45 2.73 -2.09
0.001 0.000 0.006 0.037

SUMMARY• The logistic regression, which was used to assess the
determinants of access to electricity among the rural households, showed that even when electricity is supplied to any locality, increase in years of education, improvement in consumption expenditure, which is sign of increase in welfare, increase in production assets and farm output will play a significant role in determining whether a household would connect to the electricity supply or not
• The analysis further revealed that all the poverty indices reduced among the households that had access to electricity. Similarly, access to electricity also improves households’ food security among the rural households in the study area. The result of the empirical impact model showed that access to electricity significantly impacted both per capita food expenditure and households’ income significantly.

CONCLUSION AND POLICY RECOMMENDATIONS Conclusion: • access to electricity is a vital component in achieving food
security and poverty reduction in rural Nigeria
Recommendation: • access to electricity should be incorporated in all the efforts
geared toward achieving sustainable food security and poverty reduction in Nigeria in general and the rural areas in particular.
• Programs and policies that will lead to increase in education, improve rural households’ welfare and increase in farm output are important to influence rural households access to electricity.

Thank
you