Embed Size (px)
Citation preview

Access to Eligibility Support Services for Health, Nutrition, And Child CareUsage and Eligibility Results Report
As of May 31, 2013
2 Usage and Eligibility Results Report
Am I Eligible1
• Self Assessments– Started to date: 1,012,204
– Average started per month: 9,9282
– Completed to date: 946,782
– Average completed per month: 9,2842
• Households– Number of households found potentially eligible for at least one program: 926,993
– Percentage of households who completed the screener that were found potentially eligible for at least one program: 98%
• Am I Eligible at a Glance– Of the percentage of households found potentially eligible for FoodShare, the average FoodShare
value is: $200.14
– On average, it took between 15 to 20 minutes to complete a self assessment
• Check My Benefits3
– Number of MyACCESS accounts created: 802,049 (525,904 unique accounts)
ACCESS Report Summary
Source data: ACCESS1. Cumulative total from August 2004 to present month.2. Average over the last 3 months.3. Cumulative total from September 2005 to present month.
3 Usage and Eligibility Results Report
Apply For Benefits1 (AFB)
• Applications– Started to date: 1,982,281
– Average started per month: 31,2872
– Submitted to date: 1,341,613
– Average completed per month: 21,8192
– Full applications: 1,303,306
– Applications with just filing date: 38,307
– Priority Service Eligible: 32%
• Applications by Program– FoodShare: 1,011,076
• Priority Service Eligible: 419,323
• Not Priority Service Eligible: 591,753
– Health Care: 606,394
– Family Planning Waiver: 301,161
– Child Care: 2,236
ACCESS Report Summary (cont.)
Report My Changes3 (RMC)
• Reports– Started this month: 11,597
– Submitted this month: 8,154
Renew My Benefits
• Renewals– FoodShare: 9,463
– Health Care: 4,052
– Family Planning Waiver: 1,430
– Child Care: 1,124
Six Month Report Forms (SMRFs)
• Submissions– FoodShare Only: 6,687
– Child Care Only: 951
– Both FoodShare and Child Care: 7,638Source data: ACCESS and CARES1. Cumulative totals from June 2006 to present.2. Average over the last 3 months.3. Cumulative totals from September 2006 to present
4 Usage and Eligibility Results Report
ACCESS Usage Statistics
• Login– Total number of times users logged in to ACCESS: 192,372
• Percentage of ACCESS logins in Spanish: 0.39%
– Total number of times users logged in to CMB: 172,481
• Total number of distinct users who logged in to CMB: 69,218
• Total number of repetitive CMB logins by users: 103,263
• Expired Applications– Total applications that expired this month: 6,509
• Percentage of expired applications that were Spanish applications: 0.95%
• Spanish– Households who completed AFB application in Spanish: 2.50%
– Households who completed the change report in Spanish: 0.43%
– Households who completed Screener in Spanish: 0.17%
ACCESS Report Summary (cont.)
Source Data: ACCESS and CARES1. Due to recent system changes, this number is currently unavailable.
Am I Eligible? (AIE)Usage and Eligibility Results ReportAs of May 31, 2013

6 Usage and Eligibility Results Report
AIE Self Assessment Statistics
Notes:August 2004 through November 2004 totals include the Family Medicaid and FoodShare Programs only.Beginning in December 2004, totals include the addition of Family Planning Waiver, Medicaid (EBD), MPA, Long Term Care, SeniorCare, WIC, School Meals/Summer food, TEFAP, and Tax Credits.Beginning in late January 2007, totals include the addition of WHEAP (Wisconsin Home Energy Assistance Program.)As of January 2008, Family Medicaid and BadgerCare changed to BadgerCare Plus, Family Planning Waiver changed to Family Planning Waiver and EBD Medicaid changed to Medicaid.Beginning January 23, 2010, totals include the addition of Child Care.
Average self assessments started per month: 9,928
Average self assessments completed per month: 9,284
Jan-09 Jul-09 Jan-10 Jul-10 Jan-11 Jul-11 Jan-12 Jul-12 Jan-130
4,000
8,000
12,000
16,000
20,000
24,000
9,423
8,8378,853
Total Self Assessments by Month
Started Self-Assessments (Cumulative: 955,604) Total Completed Self-Assessments (Cumulative: 893,554)
Households Found Potentially Eligible (Cumulative: 873,673)
7 Usage and Eligibility Results Report
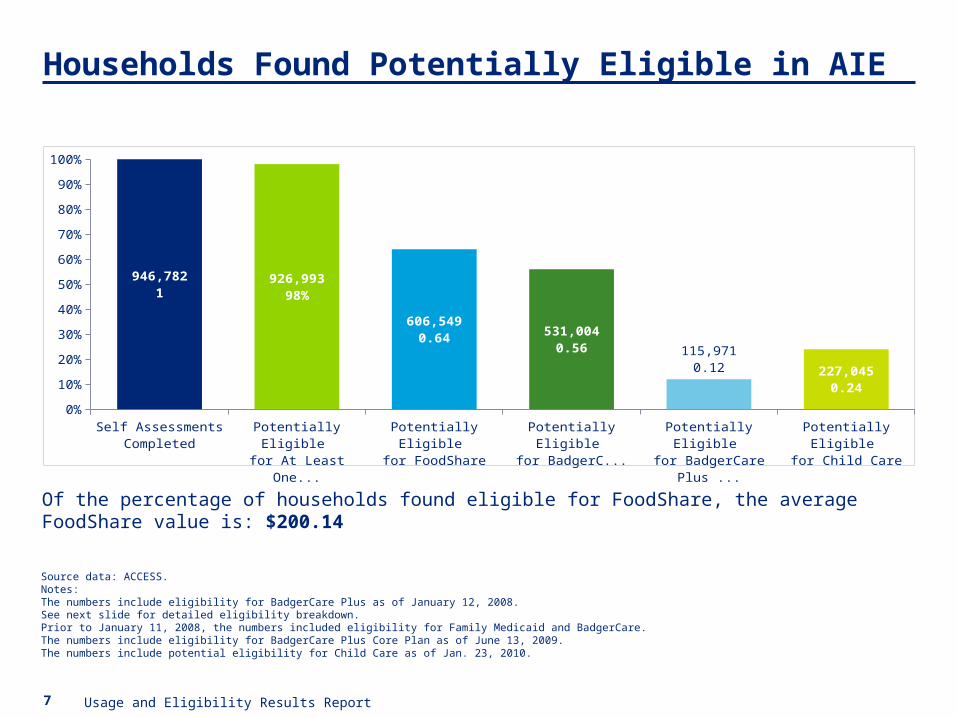
Households Found Potentially Eligible in AIE
Source data: ACCESS.Notes:The numbers include eligibility for BadgerCare Plus as of January 12, 2008.See next slide for detailed eligibility breakdown.Prior to January 11, 2008, the numbers included eligibility for Family Medicaid and BadgerCare.The numbers include eligibility for BadgerCare Plus Core Plan as of June 13, 2009.The numbers include potential eligibility for Child Care as of Jan. 23, 2010.
Of the percentage of households found eligible for FoodShare, the average FoodShare value is: $200.14
Self Assessments Completed
Potentially Eligible for At Least One
Program
Potentially Eligible for FoodShare
Potentially Eligible for BadgerCare Plus
Potentially Eligible for BadgerCare Plus
Core Plan
Potentially Eligible for Child Care
0%
10%
20%
30%
40%
50%
60%
70%
80%
90%
100%
946,7821
926,99398%
606,5490.64 531,004
0.56115,971
0.12 227,0450.24
8 Usage and Eligibility Results Report
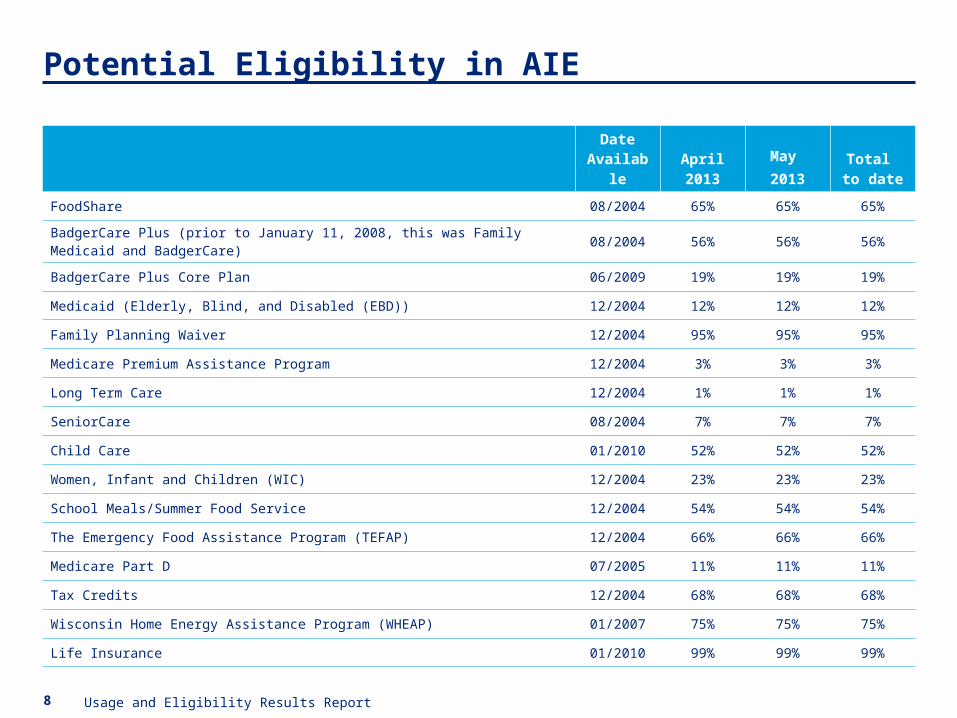
DateAvailable
April 2013
May 2013
Total to date
FoodShare 08/2004 65% 65% 65%
BadgerCare Plus (prior to January 11, 2008, this was Family Medicaid and BadgerCare) 08/2004 56% 56% 56%
BadgerCare Plus Core Plan 06/2009 19% 19% 19%
Medicaid (Elderly, Blind, and Disabled (EBD)) 12/2004 12% 12% 12%
Family Planning Waiver 12/2004 95% 95% 95%
Medicare Premium Assistance Program 12/2004 3% 3% 3%
Long Term Care 12/2004 1% 1% 1%
SeniorCare 08/2004 7% 7% 7%
Child Care 01/2010 52% 52% 52%
Women, Infant and Children (WIC) 12/2004 23% 23% 23%
School Meals/Summer Food Service 12/2004 54% 54% 54%
The Emergency Food Assistance Program (TEFAP) 12/2004 66% 66% 66%
Medicare Part D 07/2005 11% 11% 11%
Tax Credits 12/2004 68% 68% 68%
Wisconsin Home Energy Assistance Program (WHEAP) 01/2007 75% 75% 75%
Life Insurance 01/2010 99% 99% 99%
Potential Eligibility in AIE
9 Usage and Eligibility Results Report
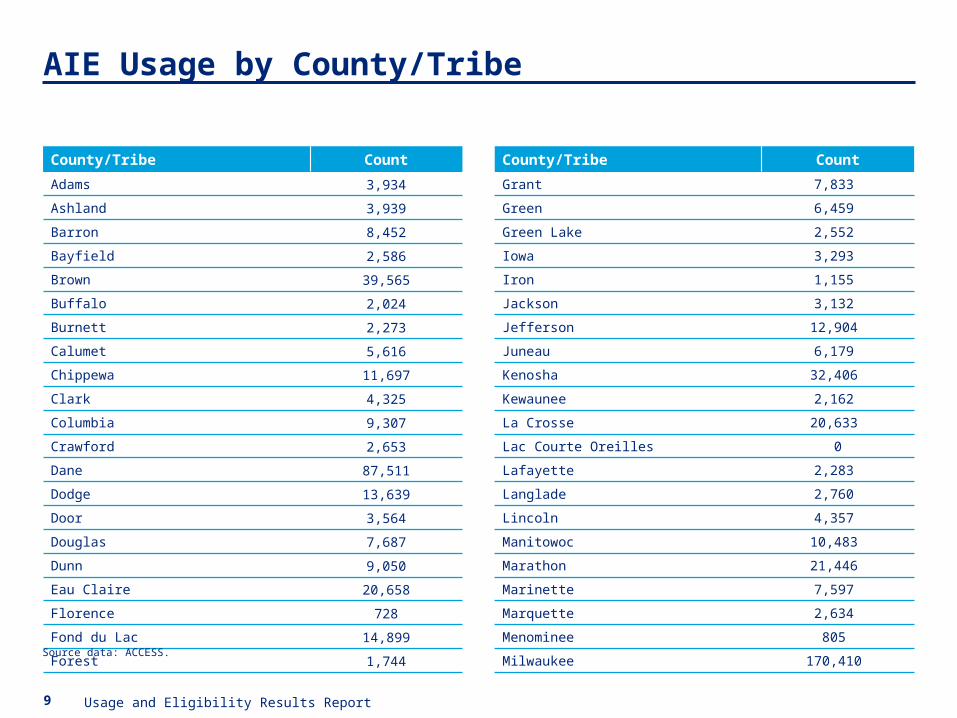
AIE Usage by County/Tribe
County/Tribe Count
Adams 3,934
Ashland 3,939
Barron 8,452
Bayfield 2,586
Brown 39,565
Buffalo 2,024
Burnett 2,273
Calumet 5,616
Chippewa 11,697
Clark 4,325
Columbia 9,307
Crawford 2,653
Dane 87,511
Dodge 13,639
Door 3,564
Douglas 7,687
Dunn 9,050
Eau Claire 20,658
Florence 728
Fond du Lac 14,899
Forest 1,744
County/Tribe Count
Grant 7,833
Green 6,459
Green Lake 2,552
Iowa 3,293
Iron 1,155
Jackson 3,132
Jefferson 12,904
Juneau 6,179
Kenosha 32,406
Kewaunee 2,162
La Crosse 20,633
Lac Courte Oreilles 0
Lafayette 2,283
Langlade 2,760
Lincoln 4,357
Manitowoc 10,483
Marathon 21,446
Marinette 7,597
Marquette 2,634
Menominee 805
Milwaukee 170,410
Source data: ACCESS.

10 Usage and Eligibility Results Report
AIE Usage by County/Tribe (cont.)
County/Tribe Count
Monroe 8,702
Oconto 9,624
Oneida 7,179
Outagamie 30,106
Ozaukee 9,924
Pepin 1,147
Pierce 5,802
Polk 7,856
Portage 12,312
Price 2,199
Racine 30,878
Richland 3,131
Rock 36,044
Rusk 2,753
Sauk 11,129
Sawyer 2,501
County/Tribe Count
Shawano 6,683
Sheboygan 17,842
St. Croix 14,353
Taylor 2,532
Trempealeau 4,056
Vernon 4,371
Vilas 3,617
Walworth 17,793
Washburn 2,857
Washington 17,022
Waukesha 45,746
Waupaca 7,856
Waushara 3,751
Winnebago 26,653
Wood 14,293
Unknown 64,158
Source data: ACCESS.

Apply for Benefits (AFB)Usage and Eligibility Results ReportAs of May 31, 2013
12 Usage and Eligibility Results Report
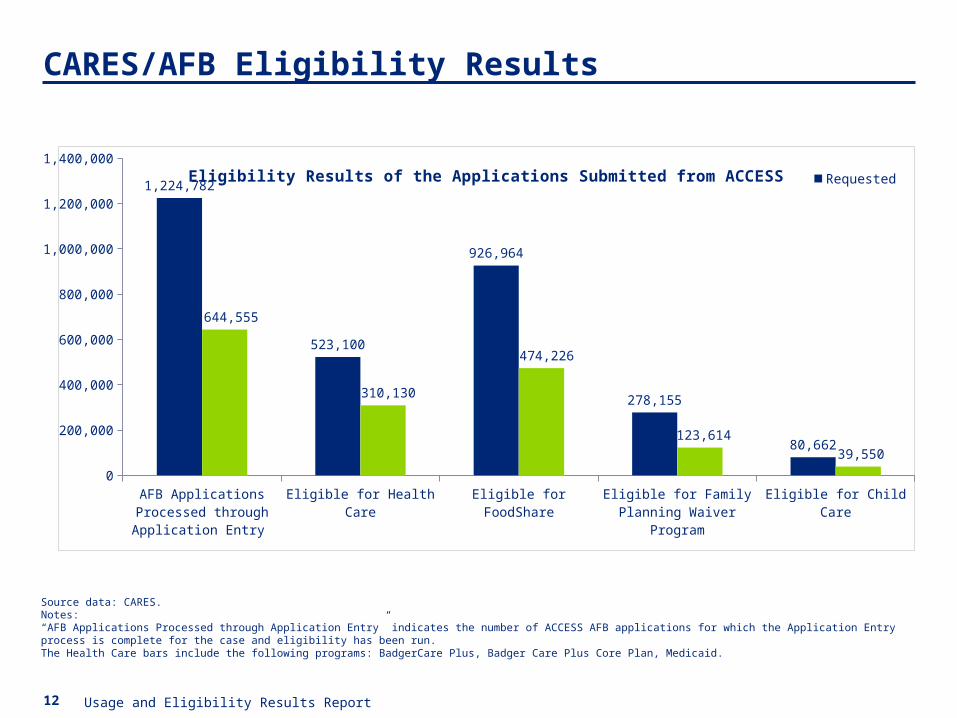
CARES/AFB Eligibility Results
0
200,000
400,000
600,000
800,000
1,000,000
1,200,000
1,400,000
1,224,782
523,100
926,964
278,155
80,662
644,555
310,130
474,226
123,614
39,550
Eligibility Results of the Applications Submitted from ACCESS Requested
Found Eligible
Source data: CARES.Notes:“AFB Applications Processed through Application Entry” indicates the number of ACCESS AFB applications for which the Application Entry process is complete for the case and eligibility has been run.The Health Care bars include the following programs: BadgerCare Plus, Badger Care Plus Core Plan, Medicaid.

13 Usage and Eligibility Results Report
CARES RFA Information
Source data: CARES.
Apr
-06
Jul-0
6
Oct
-06
Jan-
07
Apr
-07
Jul-0
7
Oct
-07
Jan-
08
Apr
-08
Jul-0
8
Oct
-08
Jan-
09
Apr
-09
Jul-0
9
Oct
-09
Jan-
10
Apr
-10
Jul-1
0
Oct
-10
Jan-
11
Apr
-11
Jul-1
1
Oct
-11
Jan-
12
Apr
-12
Jul-1
2
Oct
-12
Jan-
13
Apr
-13
0
5,000
10,000
15,000
20,000
25,000
30,000
35,000
40,000
29,610
2,652
17869
6,319
2,770
Health Care, FoodShare and Family Planning Services Program Request For Assistance (RFA) Counts by Contact Method
Total In Person ACCESS Mail-In Phone
14 Usage and Eligibility Results Report
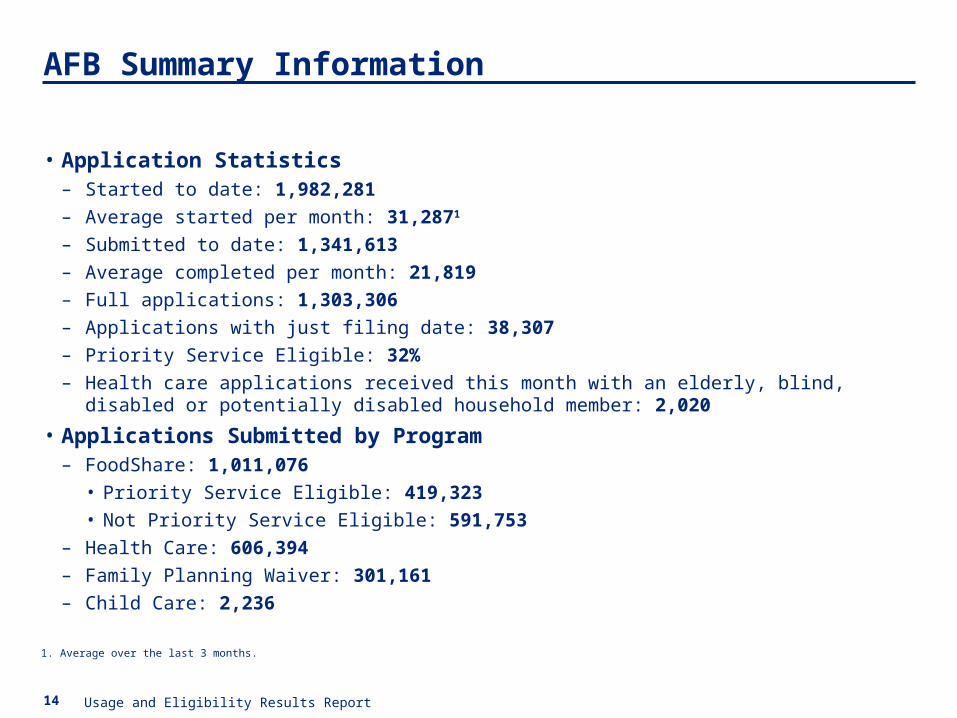
• Application Statistics– Started to date: 1,982,281
– Average started per month: 31,2871
– Submitted to date: 1,341,613
– Average completed per month: 21,819
– Full applications: 1,303,306
– Applications with just filing date: 38,307
– Priority Service Eligible: 32%
– Health care applications received this month with an elderly, blind, disabled or potentially disabled household member: 2,020
• Applications Submitted by Program– FoodShare: 1,011,076
• Priority Service Eligible: 419,323
• Not Priority Service Eligible: 591,753
– Health Care: 606,394
– Family Planning Waiver: 301,161
– Child Care: 2,236
AFB Summary Information
1. Average over the last 3 months.
15 Usage and Eligibility Results Report
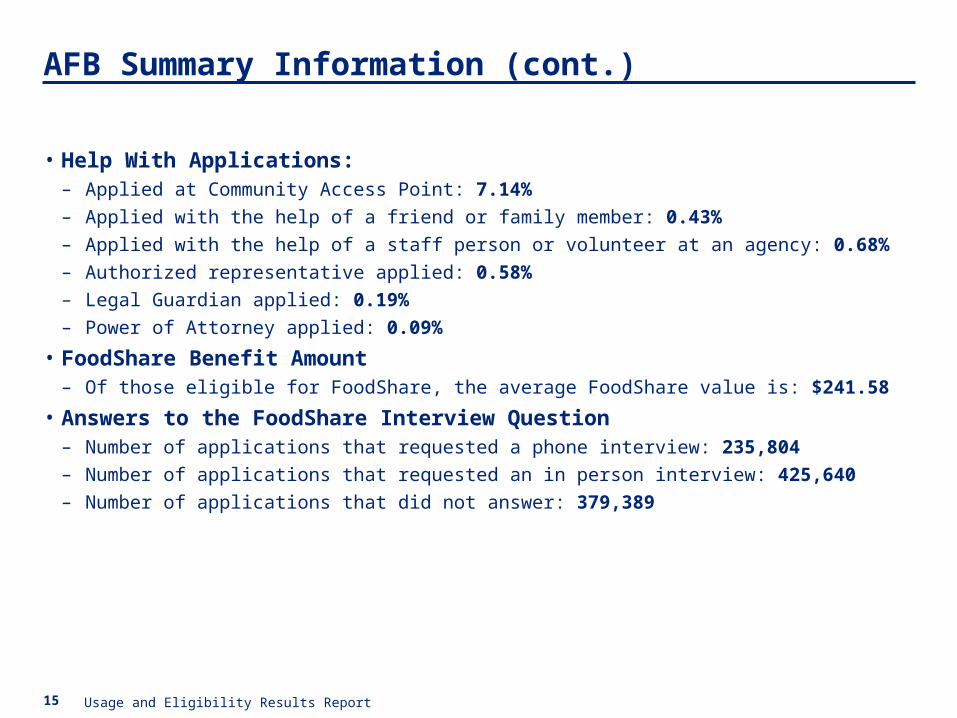
• Help With Applications:– Applied at Community Access Point: 7.14%
– Applied with the help of a friend or family member: 0.43%
– Applied with the help of a staff person or volunteer at an agency: 0.68%
– Authorized representative applied: 0.58%
– Legal Guardian applied: 0.19%
– Power of Attorney applied: 0.09%
• FoodShare Benefit Amount– Of those eligible for FoodShare, the average FoodShare value is: $241.58
• Answers to the FoodShare Interview Question– Number of applications that requested a phone interview: 235,804
– Number of applications that requested an in person interview: 425,640
– Number of applications that did not answer: 379,389
AFB Summary Information (cont.)
16 Usage and Eligibility Results Report
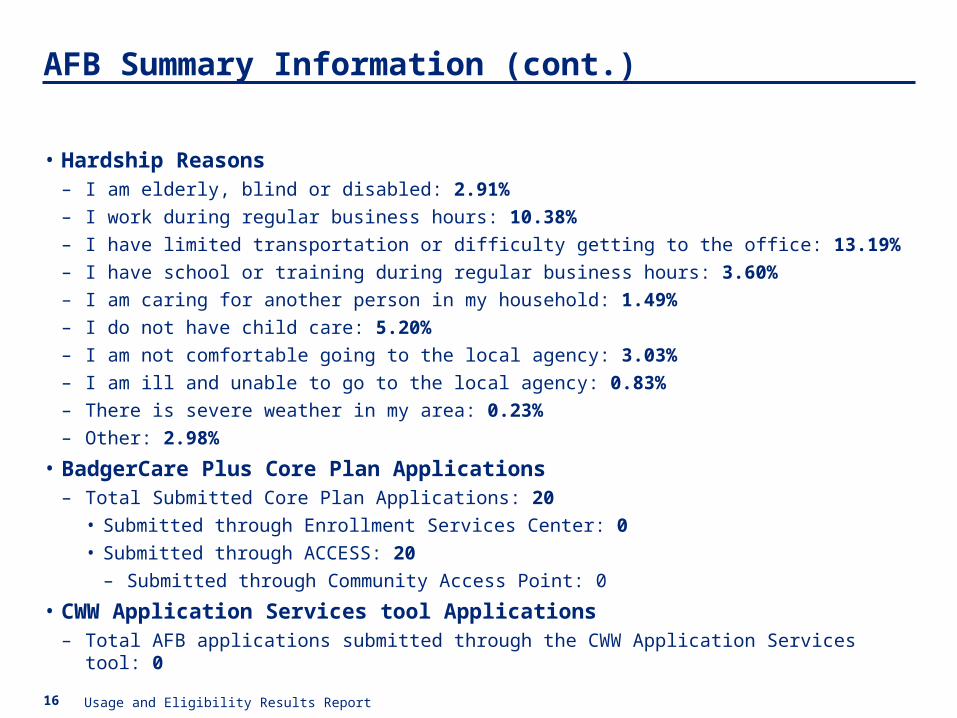
• Hardship Reasons– I am elderly, blind or disabled: 2.91%
– I work during regular business hours: 10.38%
– I have limited transportation or difficulty getting to the office: 13.19%
– I have school or training during regular business hours: 3.60%
– I am caring for another person in my household: 1.49%
– I do not have child care: 5.20%
– I am not comfortable going to the local agency: 3.03%
– I am ill and unable to go to the local agency: 0.83%
– There is severe weather in my area: 0.23%
– Other: 2.98%
• BadgerCare Plus Core Plan Applications – Total Submitted Core Plan Applications: 20
• Submitted through Enrollment Services Center: 0
• Submitted through ACCESS: 20
– Submitted through Community Access Point: 0
• CWW Application Services tool Applications– Total AFB applications submitted through the CWW Application Services tool: 0
AFB Summary Information (cont.)
17 Usage and Eligibility Results Report
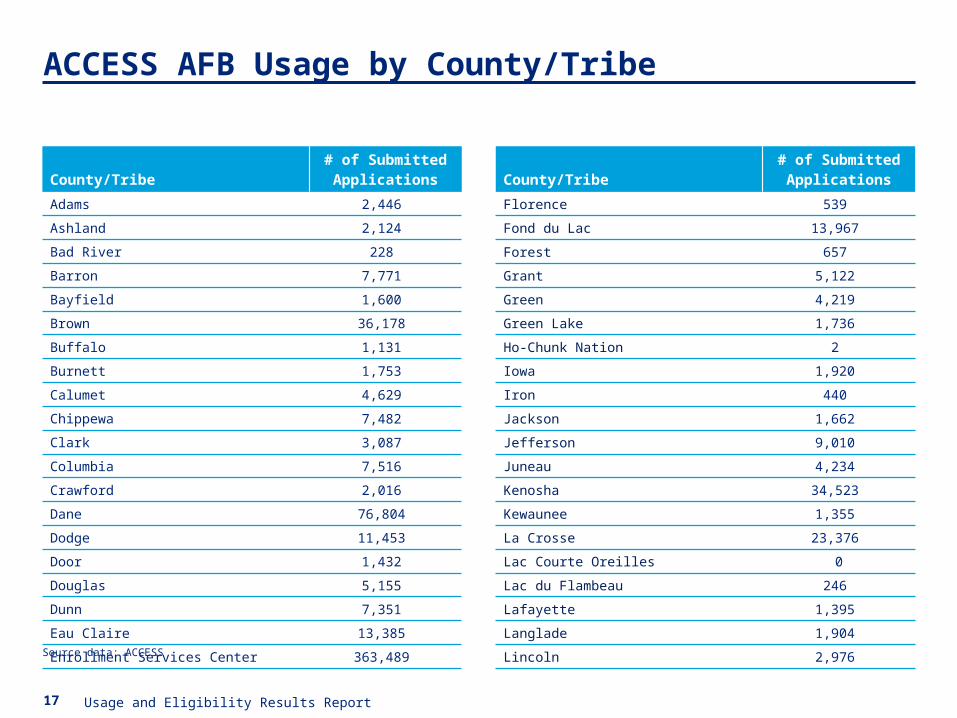
ACCESS AFB Usage by County/Tribe
County/Tribe# of SubmittedApplications
Adams 2,446
Ashland 2,124
Bad River 228
Barron 7,771
Bayfield 1,600
Brown 36,178
Buffalo 1,131
Burnett 1,753
Calumet 4,629
Chippewa 7,482
Clark 3,087
Columbia 7,516
Crawford 2,016
Dane 76,804
Dodge 11,453
Door 1,432
Douglas 5,155
Dunn 7,351
Eau Claire 13,385
Enrollment Services Center 363,489
County/Tribe# of SubmittedApplications
Florence 539
Fond du Lac 13,967
Forest 657
Grant 5,122
Green 4,219
Green Lake 1,736
Ho-Chunk Nation 2
Iowa 1,920
Iron 440
Jackson 1,662
Jefferson 9,010
Juneau 4,234
Kenosha 34,523
Kewaunee 1,355
La Crosse 23,376
Lac Courte Oreilles 0
Lac du Flambeau 246
Lafayette 1,395
Langlade 1,904
Lincoln 2,976
Source data: ACCESS
18 Usage and Eligibility Results Report
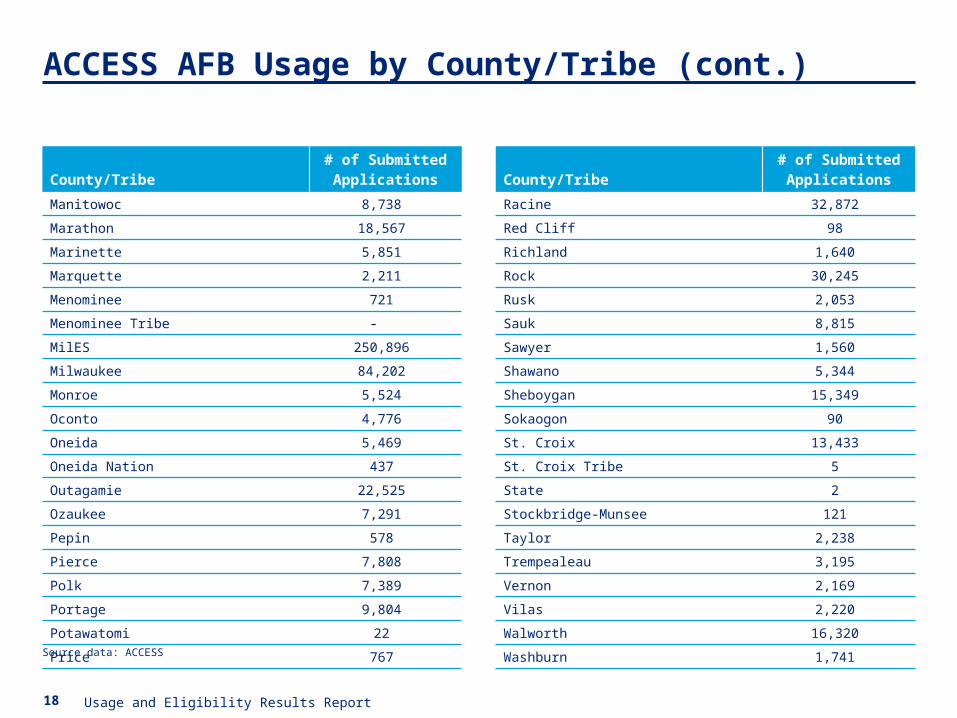
ACCESS AFB Usage by County/Tribe (cont.)
County/Tribe# of SubmittedApplications
Manitowoc 8,738
Marathon 18,567
Marinette 5,851
Marquette 2,211
Menominee 721
Menominee Tribe -
MilES 250,896
Milwaukee 84,202
Monroe 5,524
Oconto 4,776
Oneida 5,469
Oneida Nation 437
Outagamie 22,525
Ozaukee 7,291
Pepin 578
Pierce 7,808
Polk 7,389
Portage 9,804
Potawatomi 22
Price 767
County/Tribe# of SubmittedApplications
Racine 32,872
Red Cliff 98
Richland 1,640
Rock 30,245
Rusk 2,053
Sauk 8,815
Sawyer 1,560
Shawano 5,344
Sheboygan 15,349
Sokaogon 90
St. Croix 13,433
St. Croix Tribe 5
State 2
Stockbridge-Munsee 121
Taylor 2,238
Trempealeau 3,195
Vernon 2,169
Vilas 2,220
Walworth 16,320
Washburn 1,741
Source data: ACCESS
19 Usage and Eligibility Results Report
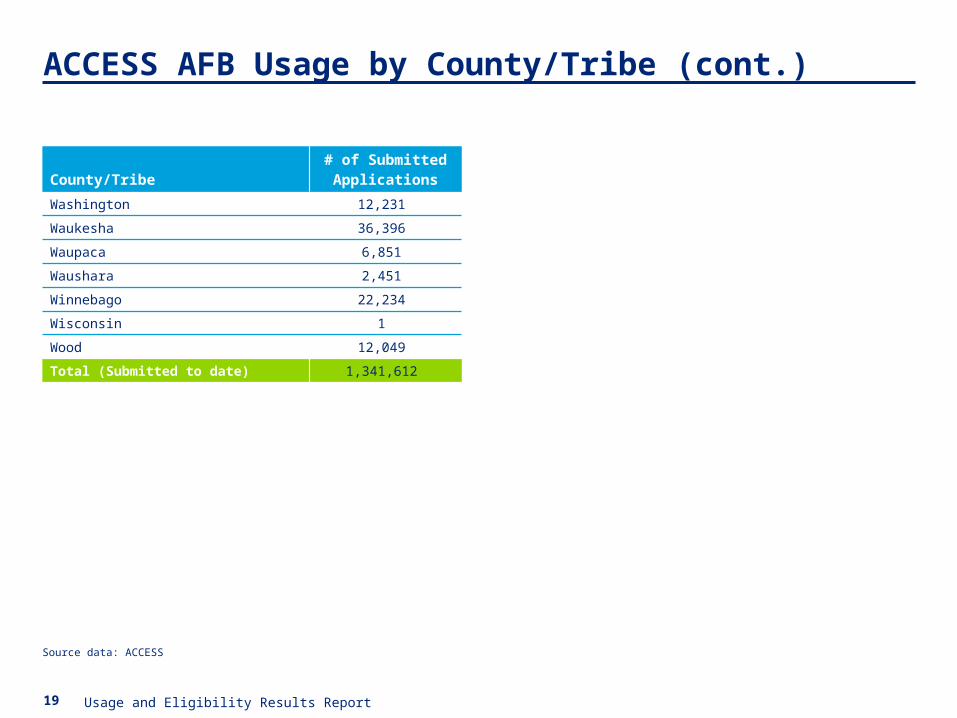
ACCESS AFB Usage by County/Tribe (cont.)
County/Tribe# of SubmittedApplications
Washington 12,231
Waukesha 36,396
Waupaca 6,851
Waushara 2,451
Winnebago 22,234
Wisconsin 1
Wood 12,049
Total (Submitted to date) 1,341,612
Source data: ACCESS
Check My Benefits (CMB)and Report My Changes (RMC)Usage and Eligibility Results ReportAs of May 31, 2013
21 Usage and Eligibility Results Report
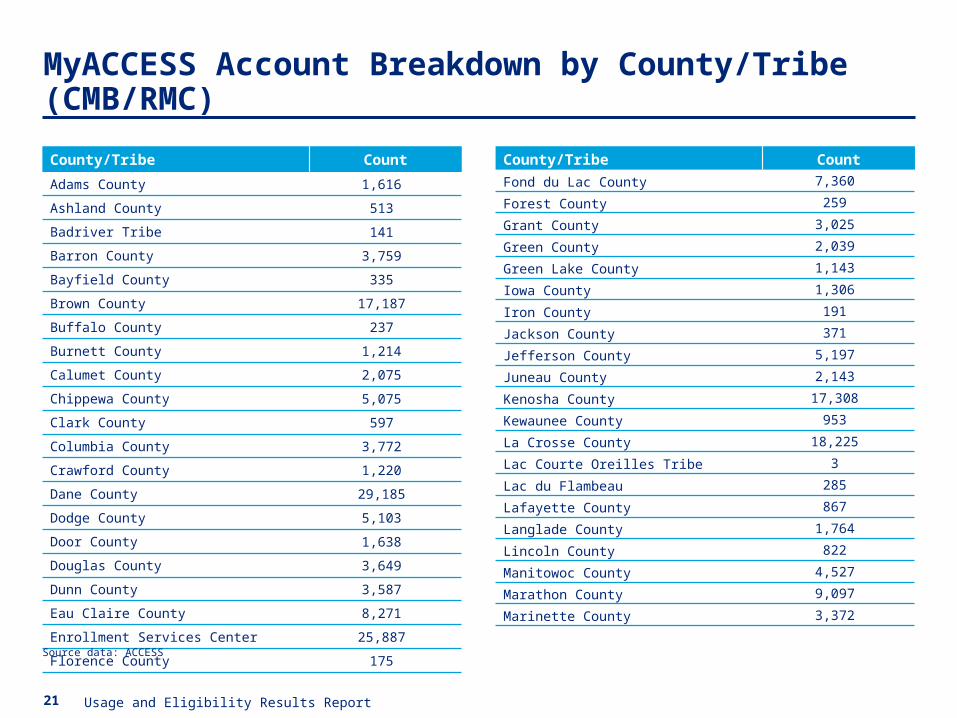
MyACCESS Account Breakdown by County/Tribe (CMB/RMC)
County/Tribe Count
Adams County 1,616
Ashland County 513
Badriver Tribe 141
Barron County 3,759
Bayfield County 335
Brown County 17,187
Buffalo County 237
Burnett County 1,214
Calumet County 2,075
Chippewa County 5,075
Clark County 597
Columbia County 3,772
Crawford County 1,220
Dane County 29,185
Dodge County 5,103
Door County 1,638
Douglas County 3,649
Dunn County 3,587
Eau Claire County 8,271
Enrollment Services Center 25,887
Florence County 175
Source data: ACCESS
County/Tribe Count
Fond du Lac County 7,360
Forest County 259
Grant County 3,025
Green County 2,039
Green Lake County 1,143
Iowa County 1,306
Iron County 191
Jackson County 371
Jefferson County 5,197
Juneau County 2,143
Kenosha County 17,308
Kewaunee County 953
La Crosse County 18,225
Lac Courte Oreilles Tribe 3
Lac du Flambeau 285
Lafayette County 867
Langlade County 1,764
Lincoln County 822
Manitowoc County 4,527
Marathon County 9,097
Marinette County 3,372
22 Usage and Eligibility Results Report
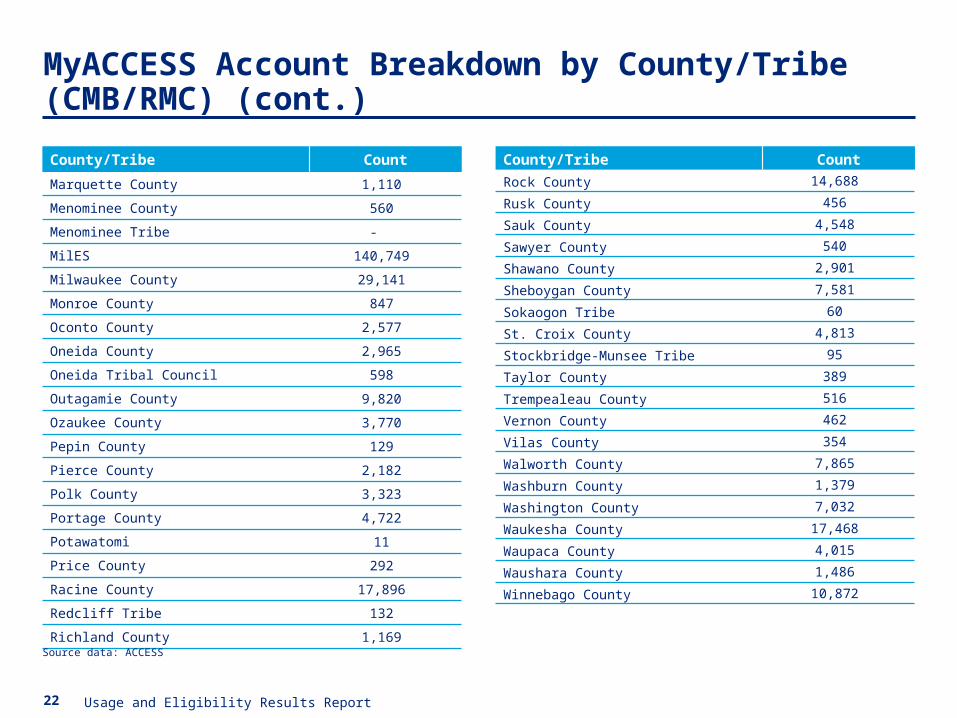
MyACCESS Account Breakdown by County/Tribe (CMB/RMC) (cont.)
County/Tribe Count
Marquette County 1,110
Menominee County 560
Menominee Tribe -
MilES 140,749
Milwaukee County 29,141
Monroe County 847
Oconto County 2,577
Oneida County 2,965
Oneida Tribal Council 598
Outagamie County 9,820
Ozaukee County 3,770
Pepin County 129
Pierce County 2,182
Polk County 3,323
Portage County 4,722
Potawatomi 11
Price County 292
Racine County 17,896
Redcliff Tribe 132
Richland County 1,169
Source data: ACCESS
County/Tribe Count
Rock County 14,688
Rusk County 456
Sauk County 4,548
Sawyer County 540
Shawano County 2,901
Sheboygan County 7,581
Sokaogon Tribe 60
St. Croix County 4,813
Stockbridge-Munsee Tribe 95
Taylor County 389
Trempealeau County 516
Vernon County 462
Vilas County 354
Walworth County 7,865
Washburn County 1,379
Washington County 7,032
Waukesha County 17,468
Waupaca County 4,015
Waushara County 1,486
Winnebago County 10,872
23 Usage and Eligibility Results Report
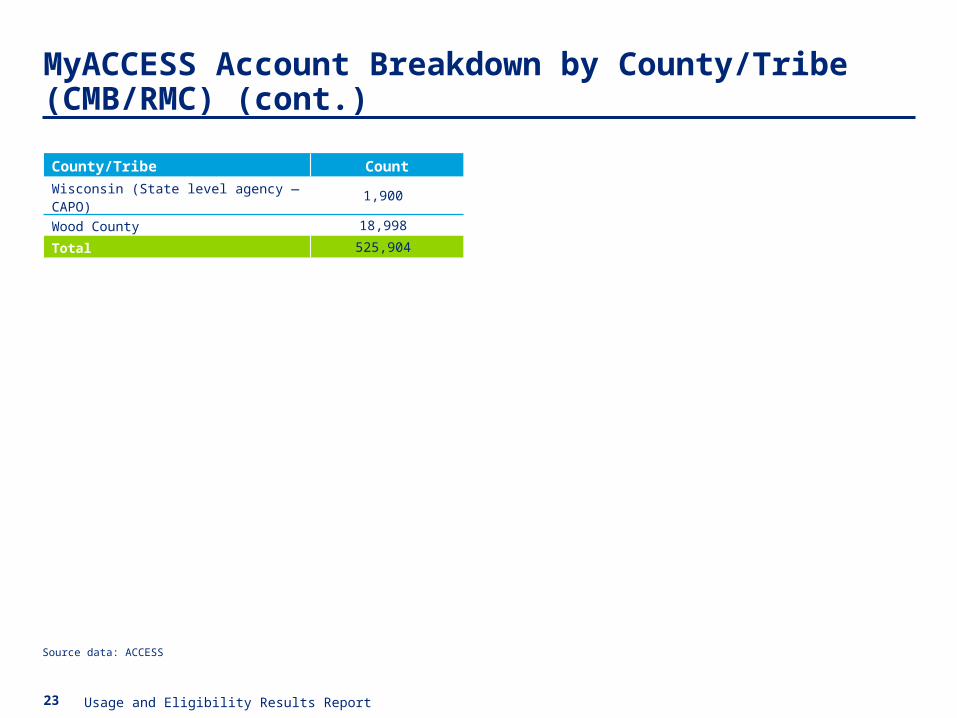
MyACCESS Account Breakdown by County/Tribe (CMB/RMC) (cont.)
Source data: ACCESS
County/Tribe Count
Wisconsin (State level agency — CAPO) 1,900
Wood County 18,998
Total 525,904
24 Usage and Eligibility Results Report
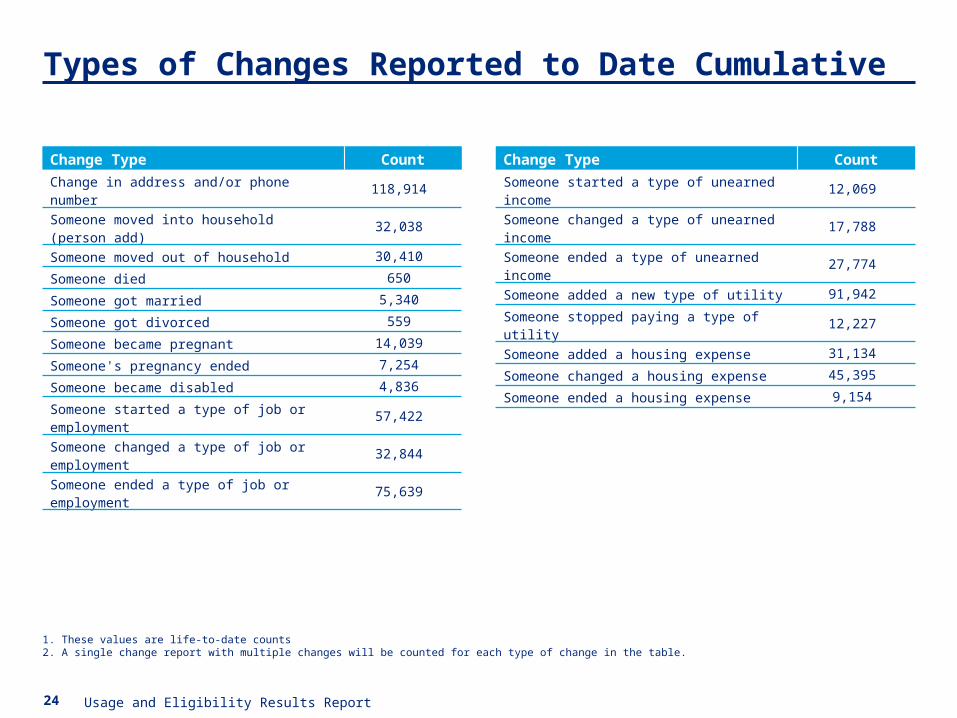
Types of Changes Reported to Date Cumulative
1. These values are life-to-date counts 2. A single change report with multiple changes will be counted for each type of change in the table.
Change Type Count
Change in address and/or phone number 118,914
Someone moved into household (person add) 32,038
Someone moved out of household 30,410
Someone died 650
Someone got married 5,340
Someone got divorced 559
Someone became pregnant 14,039
Someone's pregnancy ended 7,254
Someone became disabled 4,836
Someone started a type of job or employment 57,422
Someone changed a type of job or employment 32,844
Someone ended a type of job or employment 75,639
Change Type Count
Someone started a type of unearned income 12,069
Someone changed a type of unearned income 17,788
Someone ended a type of unearned income 27,774
Someone added a new type of utility 91,942
Someone stopped paying a type of utility 12,227
Someone added a housing expense 31,134
Someone changed a housing expense 45,395
Someone ended a housing expense 9,154
25 Usage and Eligibility Results Report
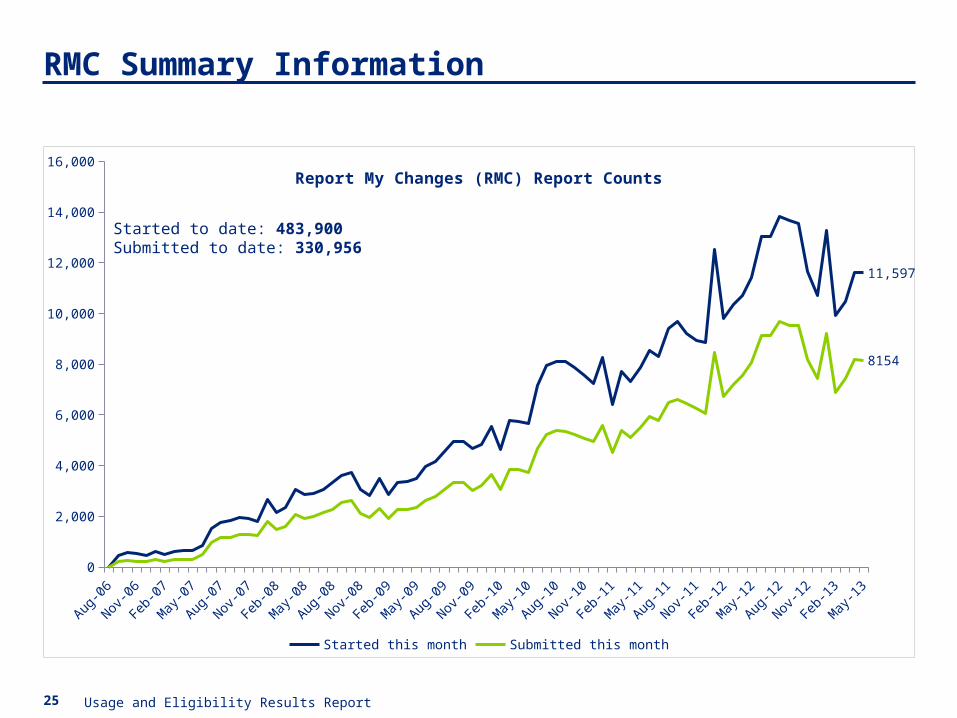
RMC Summary Information
Jan-
07
Apr-0
7
Jul-0
7
Oct-0
7
Jan-
08
Apr-0
8
Jul-0
8
Oct-0
8
Jan-
09
Apr-0
9
Jul-0
9
Oct-0
9
Jan-
10
Apr-1
0
Jul-1
0
Oct-1
0
Jan-
11
Apr-1
1
Jul-1
1
Oct-1
1
Jan-
12
Apr-1
2
Jul-1
2
Oct-1
2
Jan-
13
Apr-1
30
2,000
4,000
6,000
8,000
10,000
12,000
14,000
16,000
11,597
8154
Report My Changes (RMC) Report Counts
Started this month Submitted this month
Started to date: 483,900Submitted to date: 330,956
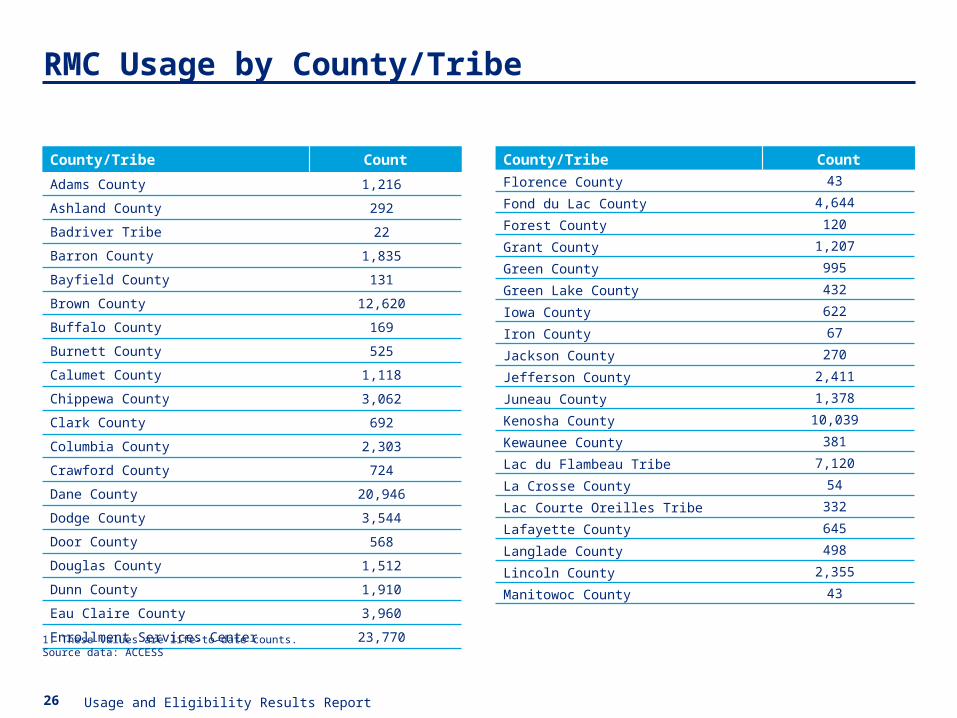
26 Usage and Eligibility Results Report
RMC Usage by County/Tribe
County/Tribe Count
Adams County 1,216
Ashland County 292
Badriver Tribe 22
Barron County 1,835
Bayfield County 131
Brown County 12,620
Buffalo County 169
Burnett County 525
Calumet County 1,118
Chippewa County 3,062
Clark County 692
Columbia County 2,303
Crawford County 724
Dane County 20,946
Dodge County 3,544
Door County 568
Douglas County 1,512
Dunn County 1,910
Eau Claire County 3,960
Enrollment Services Center 23,770
1. These values are life-to-date counts.Source data: ACCESS
County/Tribe Count
Florence County 43
Fond du Lac County 4,644
Forest County 120
Grant County 1,207
Green County 995
Green Lake County 432
Iowa County 622
Iron County 67
Jackson County 270
Jefferson County 2,411
Juneau County 1,378
Kenosha County 10,039
Kewaunee County 381
Lac du Flambeau Tribe 7,120
La Crosse County 54
Lac Courte Oreilles Tribe 332
Lafayette County 645
Langlade County 498
Lincoln County 2,355
Manitowoc County 43
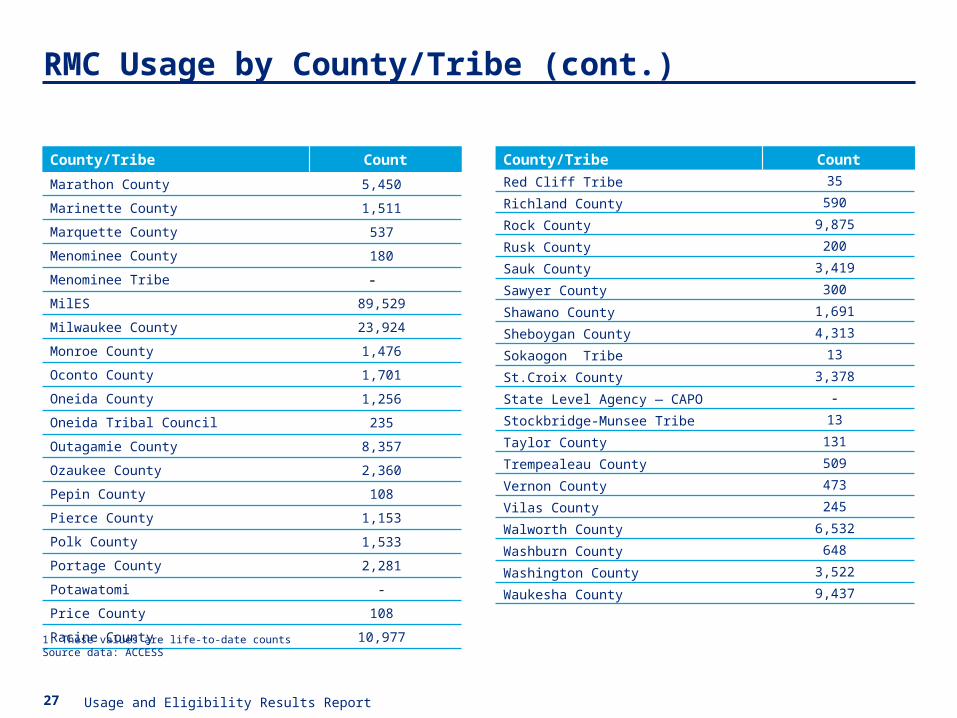
27 Usage and Eligibility Results Report
RMC Usage by County/Tribe (cont.)
County/Tribe Count
Marathon County 5,450
Marinette County 1,511
Marquette County 537
Menominee County 180
Menominee Tribe - MilES 89,529
Milwaukee County 23,924
Monroe County 1,476
Oconto County 1,701
Oneida County 1,256
Oneida Tribal Council 235
Outagamie County 8,357
Ozaukee County 2,360
Pepin County 108
Pierce County 1,153
Polk County 1,533
Portage County 2,281
Potawatomi -
Price County 108
Racine County 10,977
1. These values are life-to-date counts Source data: ACCESS
County/Tribe Count
Red Cliff Tribe 35
Richland County 590
Rock County 9,875
Rusk County 200
Sauk County 3,419
Sawyer County 300
Shawano County 1,691
Sheboygan County 4,313
Sokaogon Tribe 13
St.Croix County 3,378
State Level Agency — CAPO -
Stockbridge-Munsee Tribe 13
Taylor County 131
Trempealeau County 509
Vernon County 473
Vilas County 245
Walworth County 6,532
Washburn County 648
Washington County 3,522
Waukesha County 9,437
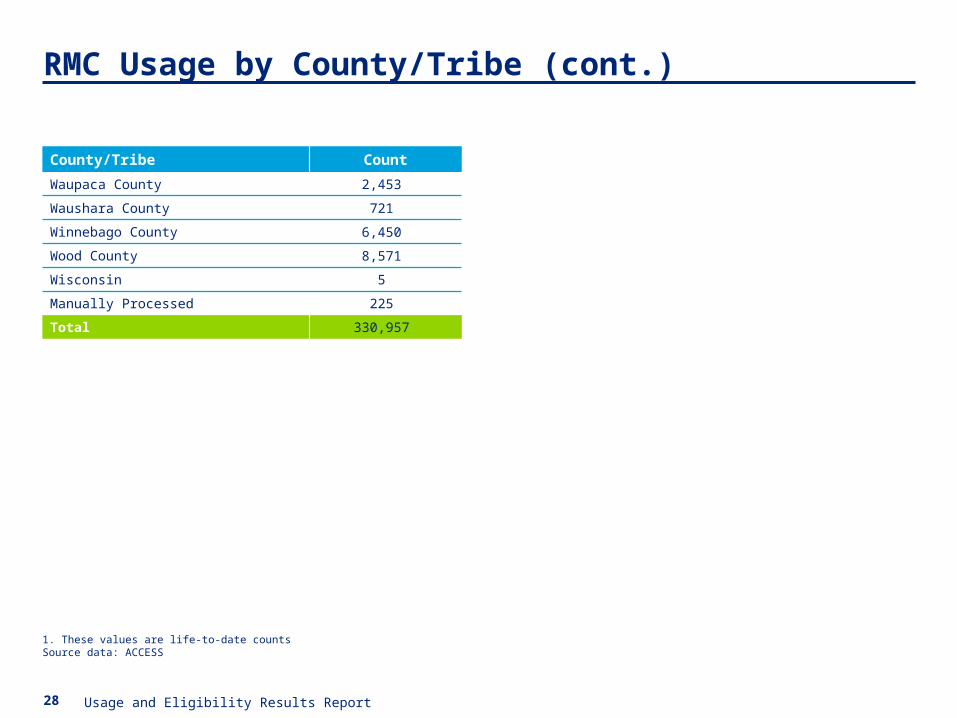
28 Usage and Eligibility Results Report
RMC Usage by County/Tribe (cont.)
County/Tribe Count
Waupaca County 2,453
Waushara County 721
Winnebago County 6,450
Wood County 8,571
Wisconsin 5
Manually Processed 225
Total 330,957
1. These values are life-to-date counts Source data: ACCESS

Renew My Benefits (RMB)Usage and Eligibility Results ReportAs of May 31, 2013
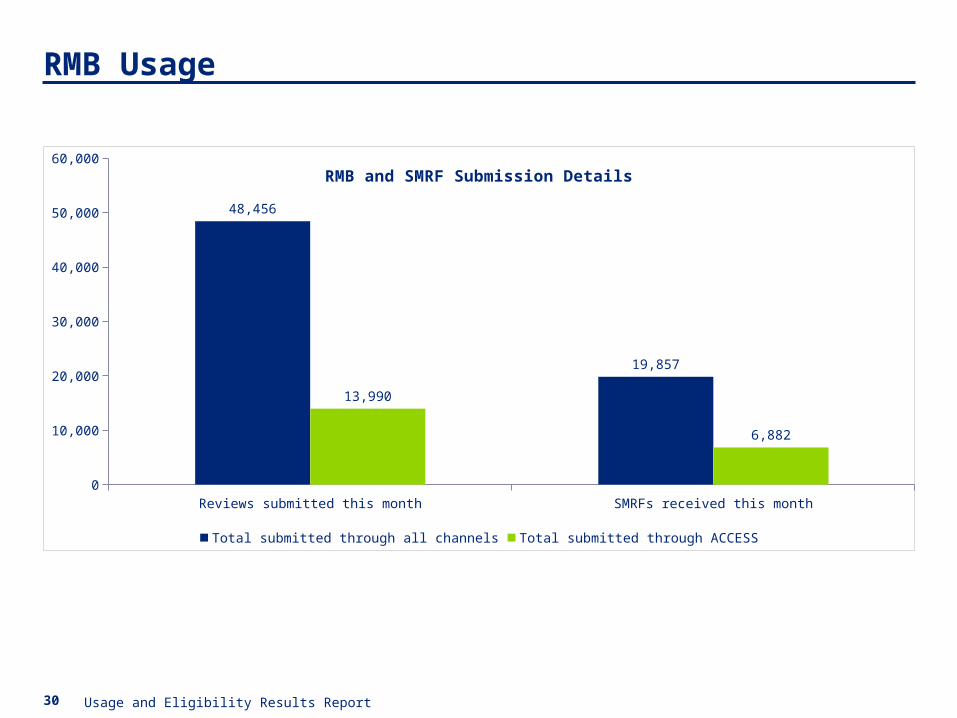
30 Usage and Eligibility Results Report
RMB Usage
Reviews submitted this month SMRFs received this month0
10,000
20,000
30,000
40,000
50,000
60,000
48,456
19,857
13,990
6,882
RMB and SMRF Submission Details
Total submitted through all channels Total submitted through ACCESS
31 Usage and Eligibility Results Report
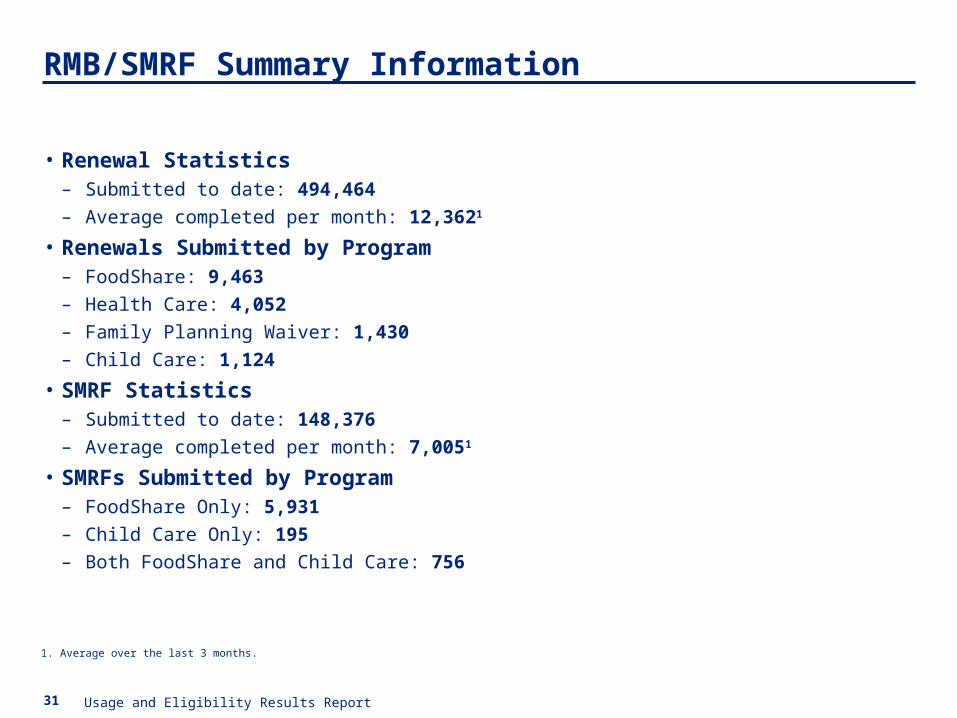
• Renewal Statistics– Submitted to date: 494,464
– Average completed per month: 12,3621
• Renewals Submitted by Program– FoodShare: 9,463
– Health Care: 4,052
– Family Planning Waiver: 1,430
– Child Care: 1,124
• SMRF Statistics– Submitted to date: 148,376
– Average completed per month: 7,0051
• SMRFs Submitted by Program– FoodShare Only: 5,931
– Child Care Only: 195
– Both FoodShare and Child Care: 756
RMB/SMRF Summary Information
1. Average over the last 3 months.
32 Usage and Eligibility Results Report
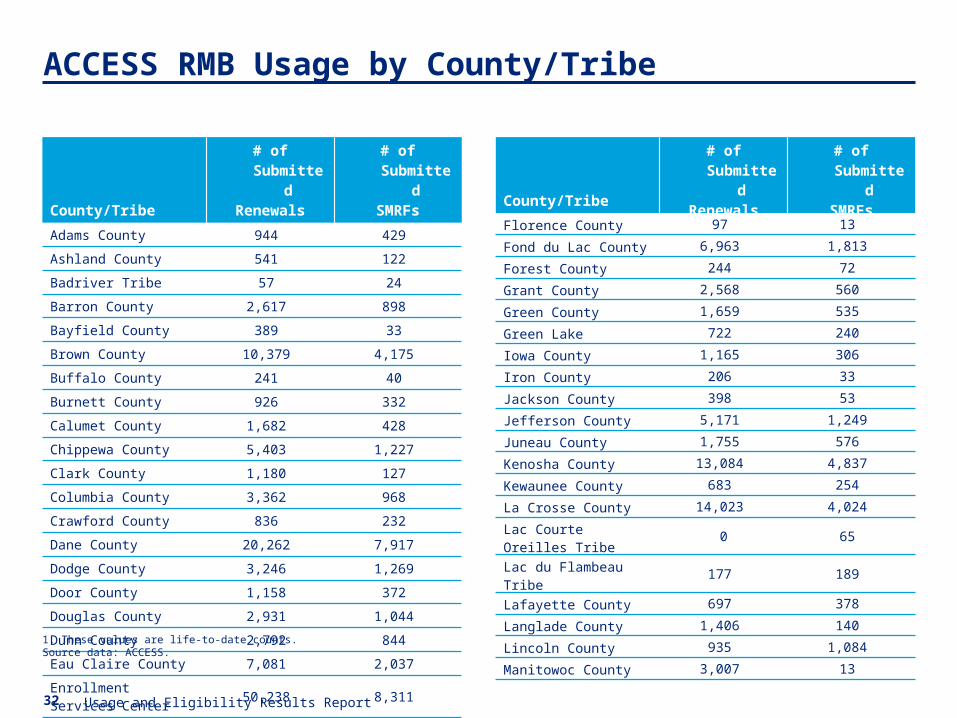
ACCESS RMB Usage by County/Tribe
County/Tribe# of Submitted
Renewals# of Submitted
SMRFs
Adams County 944 429
Ashland County 541 122
Badriver Tribe 57 24
Barron County 2,617 898
Bayfield County 389 33
Brown County 10,379 4,175
Buffalo County 241 40
Burnett County 926 332
Calumet County 1,682 428
Chippewa County 5,403 1,227
Clark County 1,180 127
Columbia County 3,362 968
Crawford County 836 232
Dane County 20,262 7,917
Dodge County 3,246 1,269
Door County 1,158 372
Douglas County 2,931 1,044
Dunn County 2,792 844
Eau Claire County 7,081 2,037
Enrollment Services Center
50,238 8,311
1. These values are life-to-date counts.Source data: ACCESS.
County/Tribe# of Submitted
Renewals# of Submitted
SMRFs
Florence County 97 13
Fond du Lac County 6,963 1,813
Forest County 244 72
Grant County 2,568 560
Green County 1,659 535
Green Lake 722 240
Iowa County 1,165 306
Iron County 206 33
Jackson County 398 53
Jefferson County 5,171 1,249
Juneau County 1,755 576
Kenosha County 13,084 4,837
Kewaunee County 683 254
La Crosse County 14,023 4,024
Lac Courte Oreilles Tribe 0 65
Lac du Flambeau Tribe 177 189
Lafayette County 697 378
Langlade County 1,406 140
Lincoln County 935 1,084
Manitowoc County 3,007 13
33 Usage and Eligibility Results Report
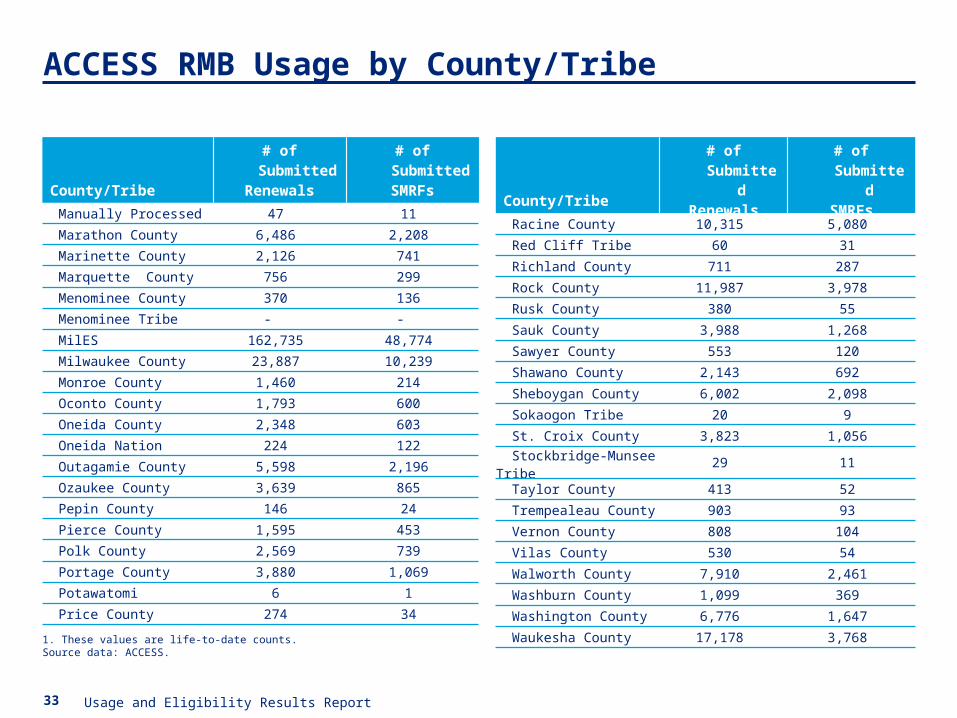
ACCESS RMB Usage by County/Tribe
County/Tribe# of Submitted
Renewals# of Submitted
SMRFs
Manually Processed 47 11
Marathon County 6,486 2,208
Marinette County 2,126 741
Marquette County 756 299
Menominee County 370 136
Menominee Tribe - -
MilES 162,735 48,774
Milwaukee County 23,887 10,239
Monroe County 1,460 214
Oconto County 1,793 600
Oneida County 2,348 603
Oneida Nation 224 122
Outagamie County 5,598 2,196
Ozaukee County 3,639 865
Pepin County 146 24
Pierce County 1,595 453
Polk County 2,569 739
Portage County 3,880 1,069
Potawatomi 6 1
Price County 274 34
1. These values are life-to-date counts.Source data: ACCESS.
County/Tribe# of Submitted
Renewals# of Submitted
SMRFs
Racine County 10,315 5,080
Red Cliff Tribe 60 31
Richland County 711 287
Rock County 11,987 3,978
Rusk County 380 55
Sauk County 3,988 1,268
Sawyer County 553 120
Shawano County 2,143 692
Sheboygan County 6,002 2,098
Sokaogon Tribe 20 9
St. Croix County 3,823 1,056
Stockbridge-Munsee Tribe 29 11
Taylor County 413 52
Trempealeau County 903 93
Vernon County 808 104
Vilas County 530 54
Walworth County 7,910 2,461
Washburn County 1,099 369
Washington County 6,776 1,647
Waukesha County 17,178 3,768
34 Usage and Eligibility Results Report
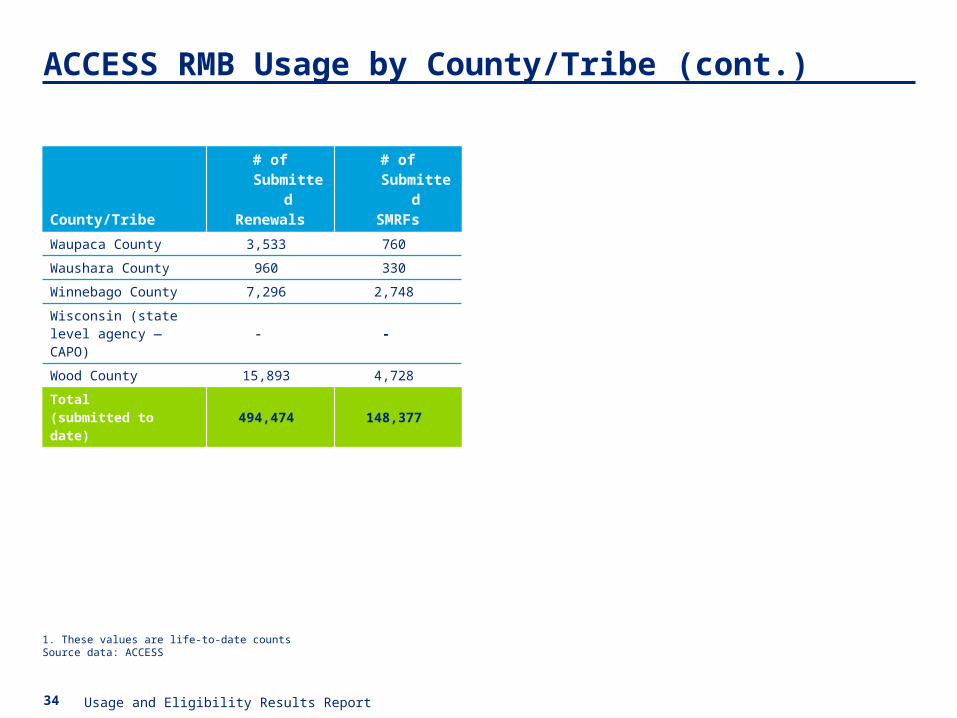
ACCESS RMB Usage by County/Tribe (cont.)
County/Tribe# of Submitted
Renewals# of Submitted
SMRFs
Waupaca County 3,533 760
Waushara County 960 330
Winnebago County 7,296 2,748
Wisconsin (state level agency — CAPO)
- -
Wood County 15,893 4,728
Total (submitted to date)
494,474 148,377
1. These values are life-to-date counts Source data: ACCESS