Embed Size (px)
Citation preview
Elsevier items and derived items © 2007, 2003 by Saunders, an imprint of Elsevier Inc.
Global Research in Chronic Health Issues
Access to Liver Transplantation:
Gender, Race and Geographic
Disparities…Policy Implications
Patricia Brennan PhD, RN, DFNAP
Associate Professor
Samuel Merritt University
School of Nursing
Oakland, California
UCSF School of Nursing
Betty Irene Moore Fellow
Health Policy
Elsevier items and derived items © 2007, 2003 by Saunders, an imprint of Elsevier Inc.
Learning Objectives
To explore the effect of race, gender and
geographical location on access to liver
transplantation in the United States
To explore the opportunities to influence
health care policy from a global perspective
Elsevier items and derived items © 2007, 2003 by Saunders, an imprint of Elsevier Inc.
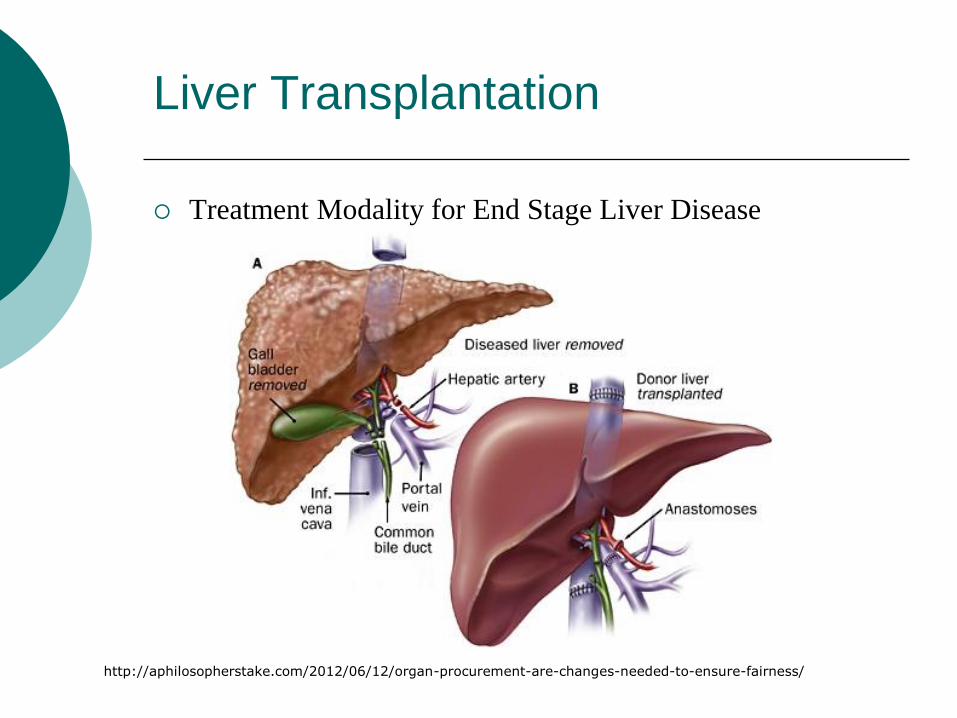
Liver Transplantation
Treatment Modality for End Stage Liver Disease
http://aphilosopherstake.com/2012/06/12/organ-procurement-are-changes-needed-to-ensure-fairness/
Elsevier items and derived items © 2007, 2003 by Saunders, an imprint of Elsevier Inc.
4 4
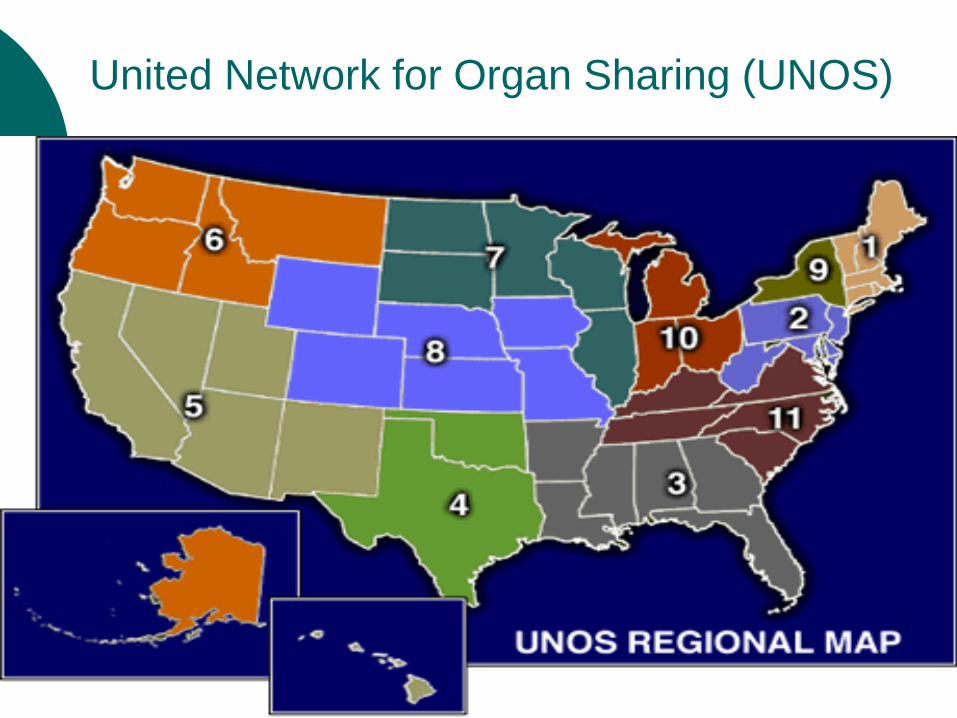
United Network for Organ Sharing (UNOS)
Elsevier items and derived items © 2007, 2003 by Saunders, an imprint of Elsevier Inc.
Background and Significance
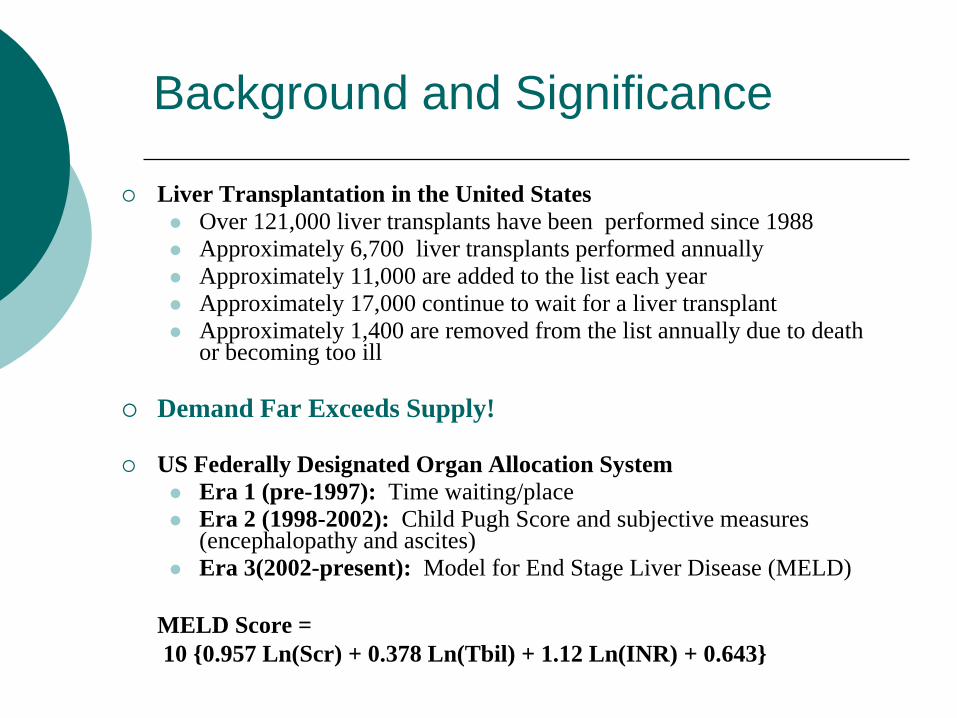
Liver Transplantation in the United States
Over 121,000 liver transplants have been performed since 1988
Approximately 6,700 liver transplants performed annually
Approximately 11,000 are added to the list each year
Approximately 17,000 continue to wait for a liver transplant
Approximately 1,400 are removed from the list annually due to death or becoming too ill
Demand Far Exceeds Supply!
US Federally Designated Organ Allocation System
Era 1 (pre-1997): Time waiting/place
Era 2 (1998-2002): Child Pugh Score and subjective measures (encephalopathy and ascites)
Era 3(2002-present): Model for End Stage Liver Disease (MELD)
MELD Score =
10 {0.957 Ln(Scr) + 0.378 Ln(Tbil) + 1.12 Ln(INR) + 0.643}
Elsevier items and derived items © 2007, 2003 by Saunders, an imprint of Elsevier Inc.
Progress Made & Problem Identification
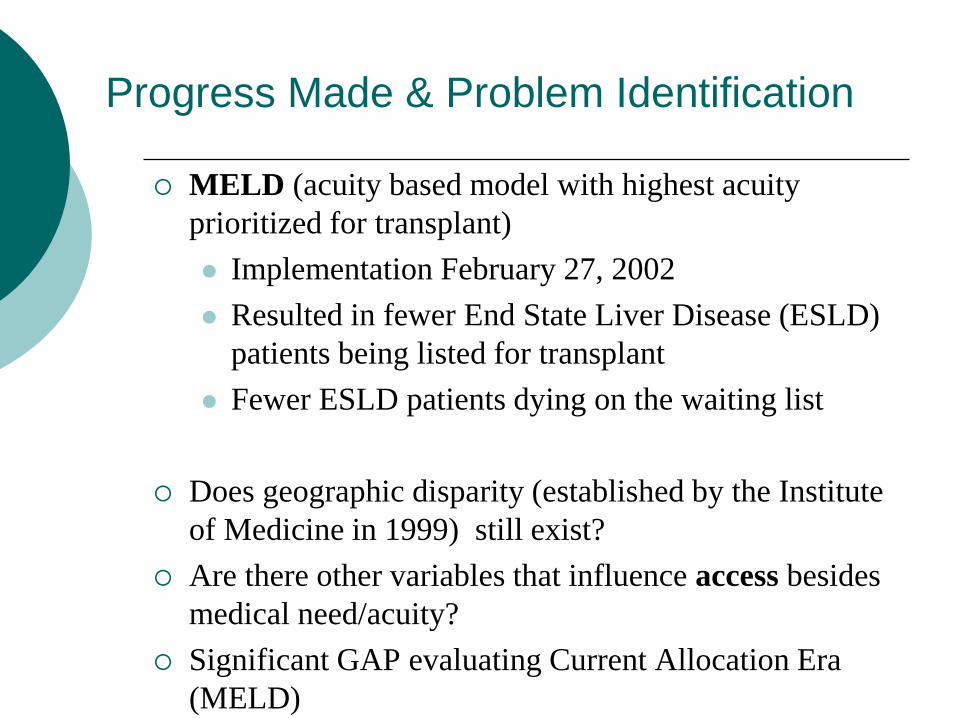
MELD (acuity based model with highest acuity
prioritized for transplant)
Implementation February 27, 2002
Resulted in fewer End State Liver Disease (ESLD)
patients being listed for transplant
Fewer ESLD patients dying on the waiting list
Does geographic disparity (established by the Institute
of Medicine in 1999) still exist?
Are there other variables that influence access besides
medical need/acuity?
Significant GAP evaluating Current Allocation Era
(MELD)
Elsevier items and derived items © 2007, 2003 by Saunders, an imprint of Elsevier Inc.
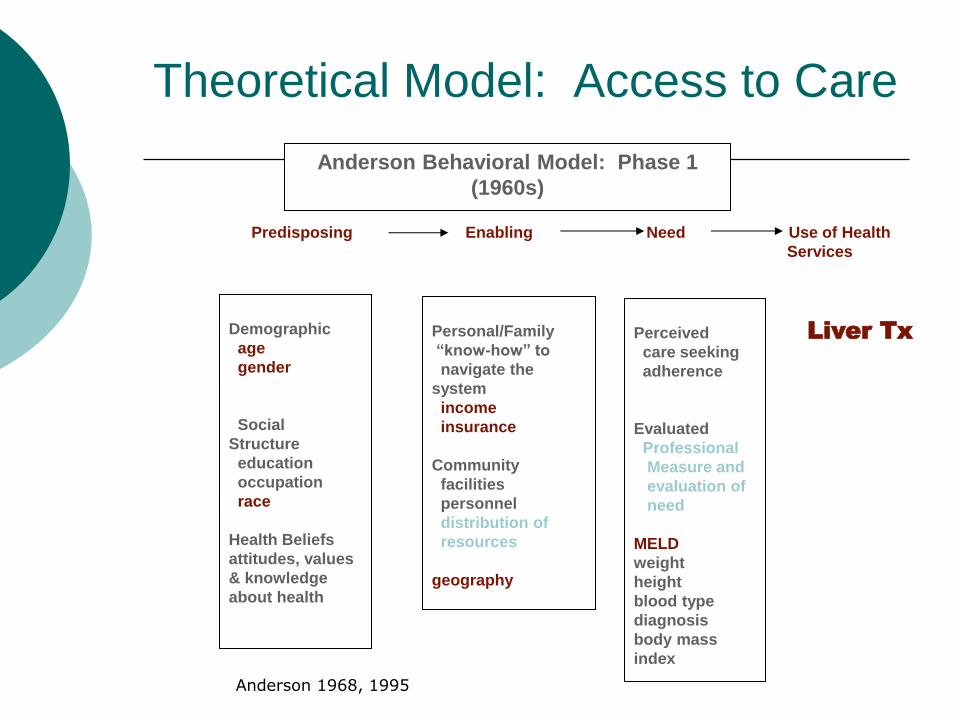
Theoretical Model: Access to Care
Demographic
age
gender
Social
Structure
education
occupation
race
Health Beliefs
attitudes, values
& knowledge
about health
Perceived
care seeking
adherence
Evaluated
Professional
Measure and
evaluation of
need
MELD
weight
height
blood type
diagnosis
body mass
index
Personal/Family
“know-how” to
navigate the
system
income
insurance
Community
facilities
personnel
distribution of
resources
geography
Anderson Behavioral Model: Phase 1
(1960s)
Predisposing Enabling Need Use of Health
Services
Liver Tx
Anderson 1968, 1995
Elsevier items and derived items © 2007, 2003 by Saunders, an imprint of Elsevier Inc.
Study Purpose
To increase the understanding and the
effect of specific predisposing, enabling and
need variables on access to liver
transplantation
Elsevier items and derived items © 2007, 2003 by Saunders, an imprint of Elsevier Inc.
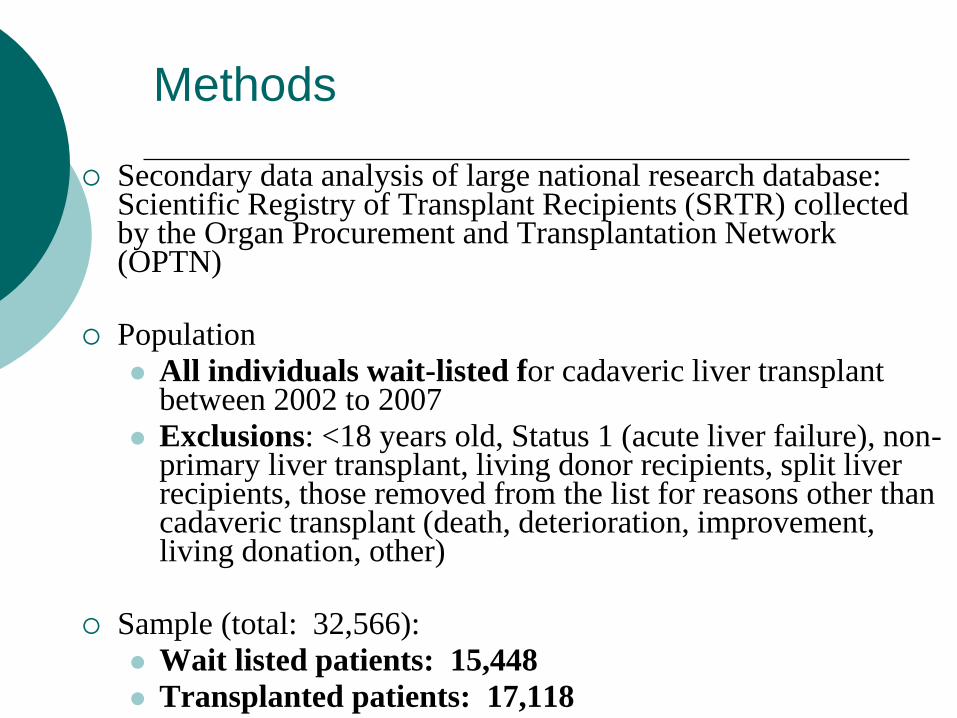
Methods
Secondary data analysis of large national research database: Scientific Registry of Transplant Recipients (SRTR) collected by the Organ Procurement and Transplantation Network (OPTN)
Population
All individuals wait-listed for cadaveric liver transplant between 2002 to 2007
Exclusions: <18 years old, Status 1 (acute liver failure), non-primary liver transplant, living donor recipients, split liver recipients, those removed from the list for reasons other than cadaveric transplant (death, deterioration, improvement, living donation, other)
Sample (total: 32,566):
Wait listed patients: 15,448
Transplanted patients: 17,118
Elsevier items and derived items © 2007, 2003 by Saunders, an imprint of Elsevier Inc.
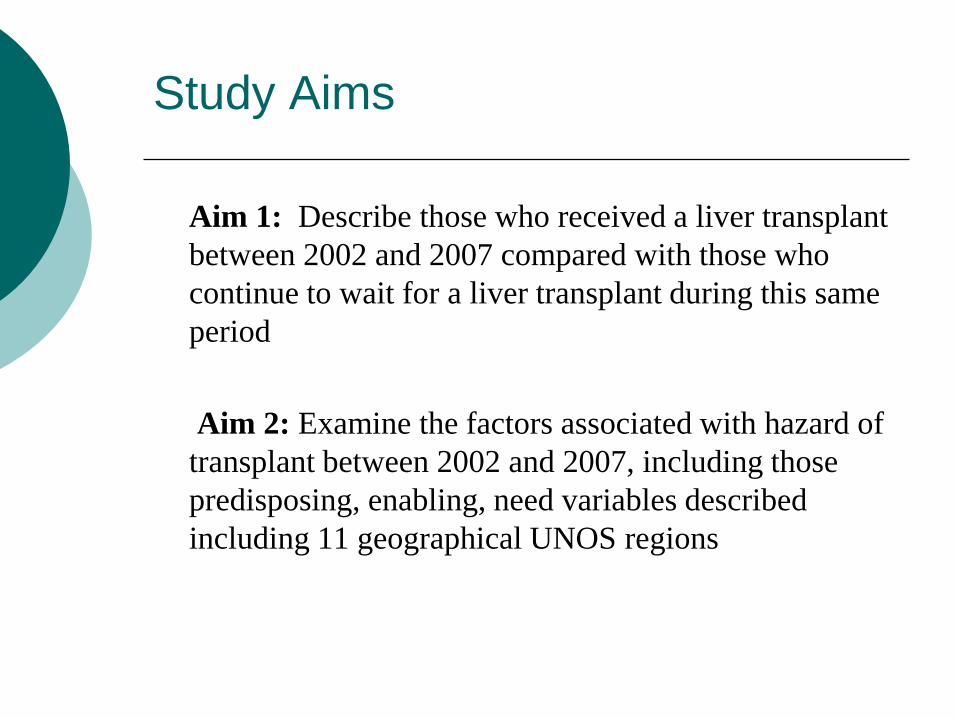
Study Aims
Aim 1: Describe those who received a liver transplant
between 2002 and 2007 compared with those who
continue to wait for a liver transplant during this same
period
Aim 2: Examine the factors associated with hazard of
transplant between 2002 and 2007, including those
predisposing, enabling, need variables described
including 11 geographical UNOS regions
Elsevier items and derived items © 2007, 2003 by Saunders, an imprint of Elsevier Inc.
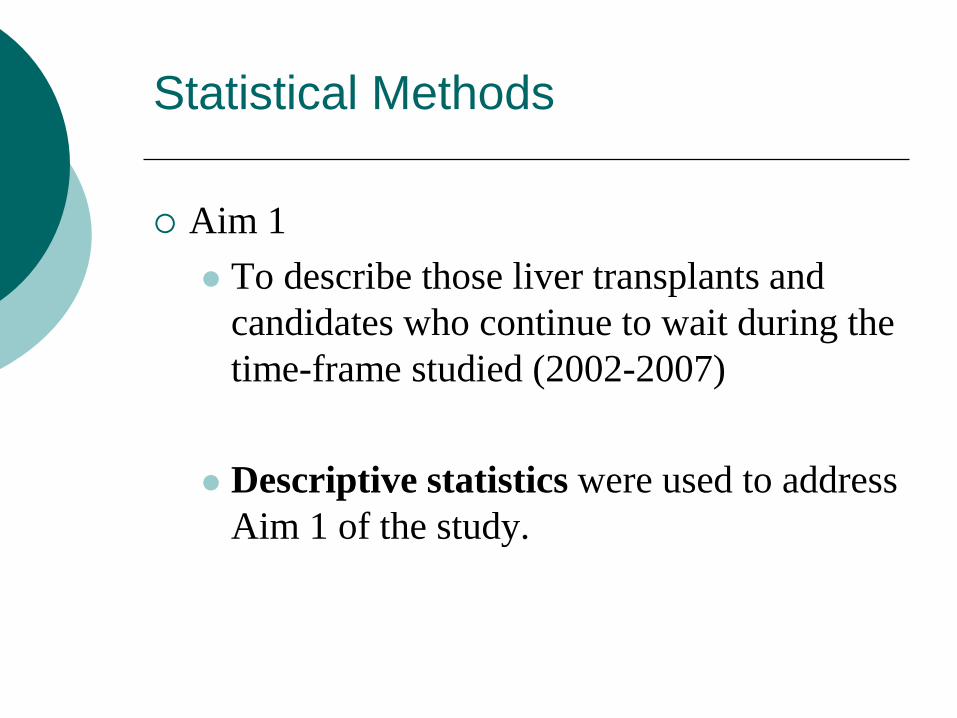
Statistical Methods
Aim 1
To describe those liver transplants and
candidates who continue to wait during the
time-frame studied (2002-2007)
Descriptive statistics were used to address
Aim 1 of the study.
Elsevier items and derived items © 2007, 2003 by Saunders, an imprint of Elsevier Inc.
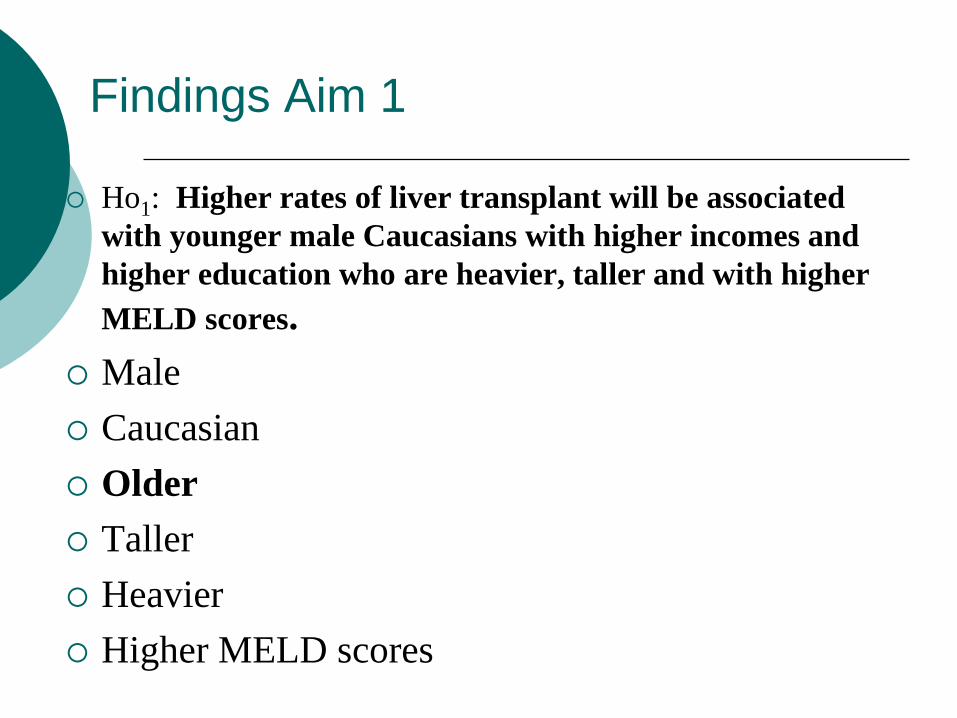
Findings Aim 1
Ho1: Higher rates of liver transplant will be associated
with younger male Caucasians with higher incomes and
higher education who are heavier, taller and with higher
MELD scores.
Male
Caucasian
Older
Taller
Heavier
Higher MELD scores
Elsevier items and derived items © 2007, 2003 by Saunders, an imprint of Elsevier Inc.
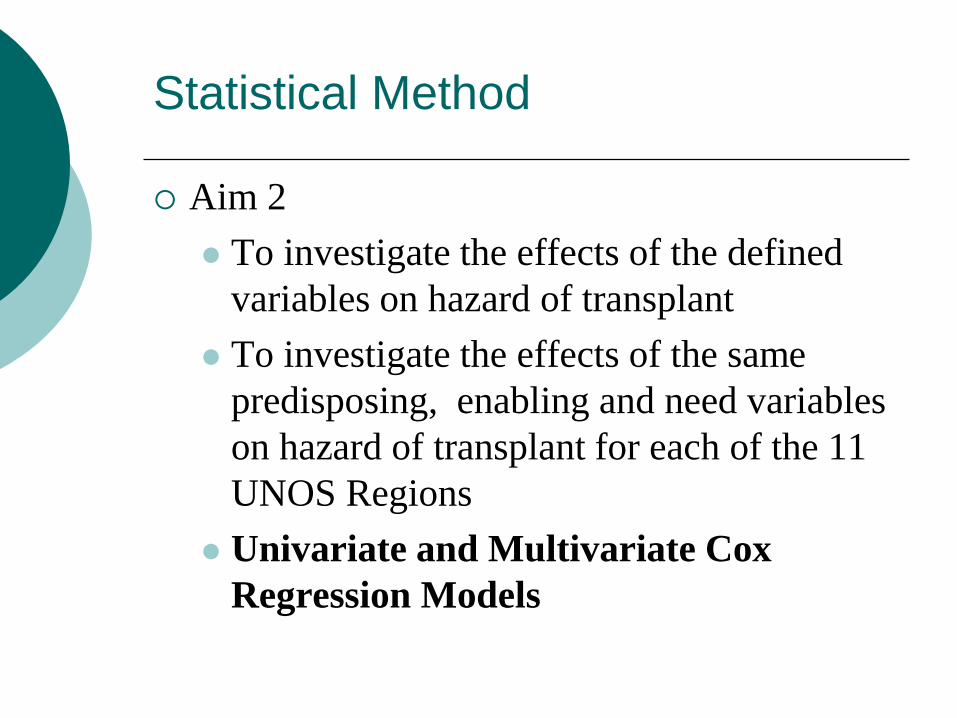
Statistical Method
Aim 2
To investigate the effects of the defined
variables on hazard of transplant
To investigate the effects of the same
predisposing, enabling and need variables
on hazard of transplant for each of the 11
UNOS Regions
Univariate and Multivariate Cox
Regression Models
Elsevier items and derived items © 2007, 2003 by Saunders, an imprint of Elsevier Inc.
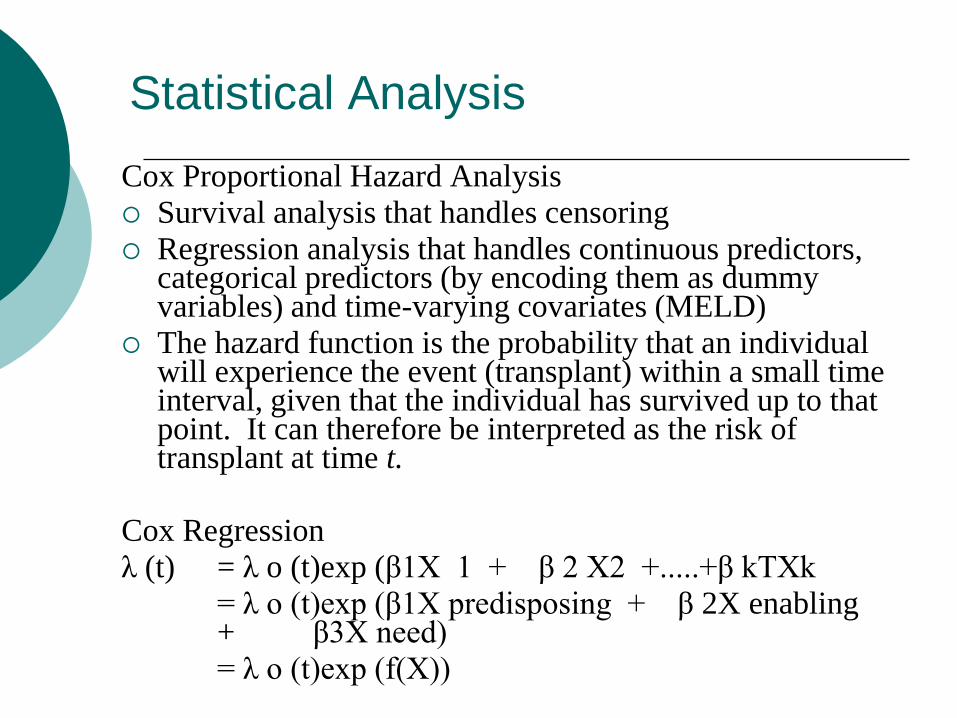
Statistical Analysis
Cox Proportional Hazard Analysis
Survival analysis that handles censoring
Regression analysis that handles continuous predictors, categorical predictors (by encoding them as dummy variables) and time-varying covariates (MELD)
The hazard function is the probability that an individual will experience the event (transplant) within a small time interval, given that the individual has survived up to that point. It can therefore be interpreted as the risk of transplant at time t.
Cox Regression
λ (t) = λ o (t)exp (β1X 1 + β 2 X2 +.....+β kTXk
= λ o (t)exp (β1X predisposing + β 2X enabling + β3X need)
= λ o (t)exp (f(X))
Elsevier items and derived items © 2007, 2003 by Saunders, an imprint of Elsevier Inc.
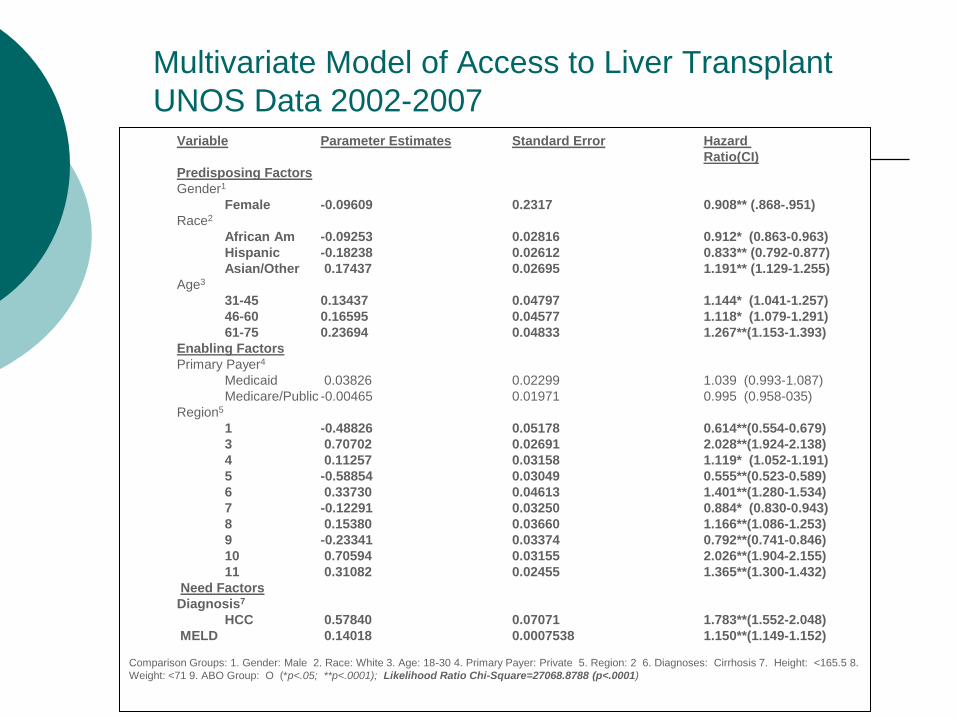
Variable Parameter Estimates Standard Error Hazard
Ratio(CI)
Predisposing Factors
Gender1
Female -0.09609 0.2317 0.908** (.868-.951)
Race2
African Am -0.09253 0.02816 0.912* (0.863-0.963)
Hispanic -0.18238 0.02612 0.833** (0.792-0.877)
Asian/Other 0.17437 0.02695 1.191** (1.129-1.255)
Age3
31-45 0.13437 0.04797 1.144* (1.041-1.257)
46-60 0.16595 0.04577 1.118* (1.079-1.291)
61-75 0.23694 0.04833 1.267**(1.153-1.393)
Enabling Factors
Primary Payer4
Medicaid 0.03826 0.02299 1.039 (0.993-1.087)
Medicare/Public -0.00465 0.01971 0.995 (0.958-035)
Region5
1 -0.48826 0.05178 0.614**(0.554-0.679)
3 0.70702 0.02691 2.028**(1.924-2.138)
4 0.11257 0.03158 1.119* (1.052-1.191)
5 -0.58854 0.03049 0.555**(0.523-0.589)
6 0.33730 0.04613 1.401**(1.280-1.534)
7 -0.12291 0.03250 0.884* (0.830-0.943)
8 0.15380 0.03660 1.166**(1.086-1.253)
9 -0.23341 0.03374 0.792**(0.741-0.846)
10 0.70594 0.03155 2.026**(1.904-2.155)
11 0.31082 0.02455 1.365**(1.300-1.432)
Need Factors
Diagnosis7
HCC 0.57840 0.07071 1.783**(1.552-2.048)
MELD 0.14018 0.0007538 1.150**(1.149-1.152)
Comparison Groups: 1. Gender: Male 2. Race: White 3. Age: 18-30 4. Primary Payer: Private 5. Region: 2 6. Diagnoses: Cirrhosis 7. Height: <165.5 8.
Weight: <71 9. ABO Group: O (*p<.05; **p<.0001); Likelihood Ratio Chi-Square=27068.8788 (p<.0001)
Multivariate Model of Access to Liver Transplant
UNOS Data 2002-2007
Elsevier items and derived items © 2007, 2003 by Saunders, an imprint of Elsevier Inc.
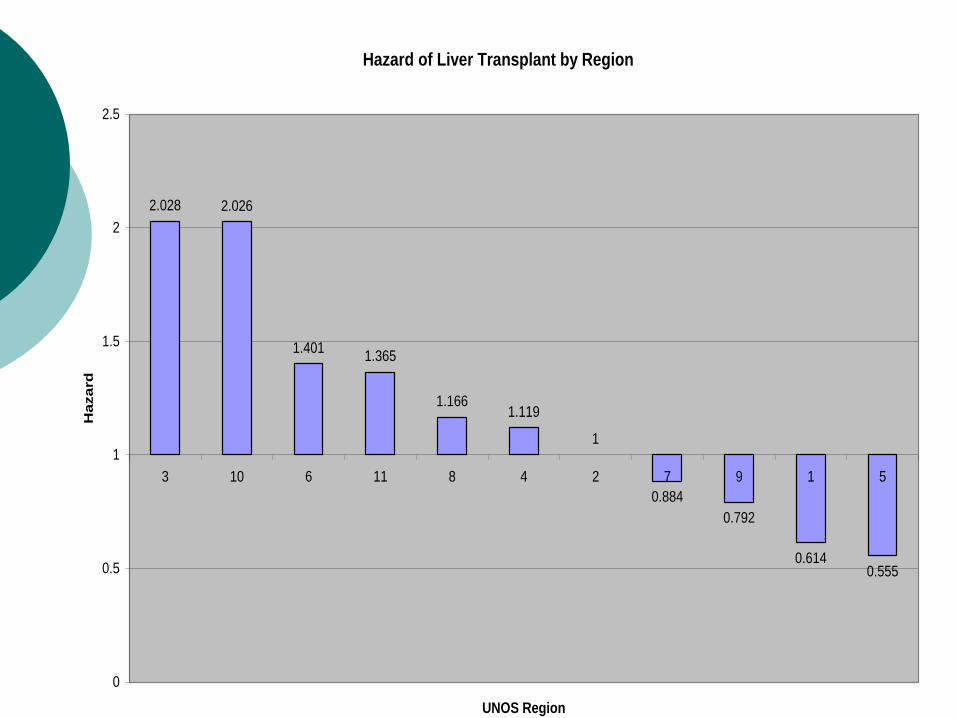
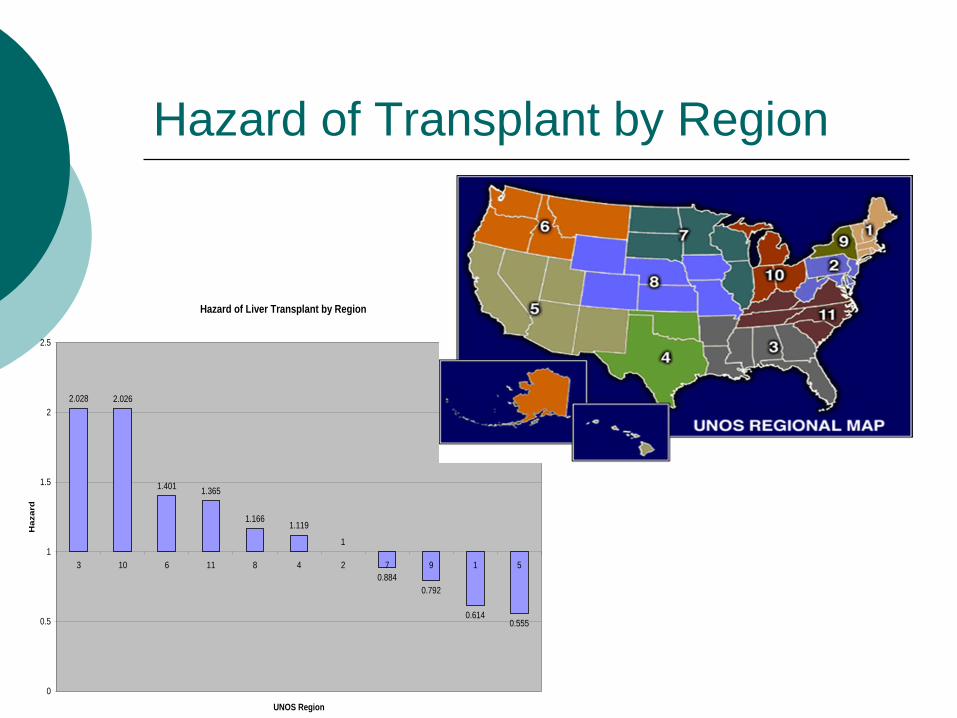
Hazard of Liver Transplant by Region
2.028 2.026
1.4011.365
1.1661.119
1
0.884
0.792
0.6140.555
0
0.5
1
1.5
2
2.5
3 10 6 11 8 4 2 7 9 1 5
UNOS Region
Hazard
Elsevier items and derived items © 2007, 2003 by Saunders, an imprint of Elsevier Inc.
Hazard of Liver Transplant by Region
2.028 2.026
1.4011.365
1.1661.119
1
0.884
0.792
0.6140.555
0
0.5
1
1.5
2
2.5
3 10 6 11 8 4 2 7 9 1 5
UNOS Region
Ha
za
rd
Hazard of Transplant by Region
Elsevier items and derived items © 2007, 2003 by Saunders, an imprint of Elsevier Inc.
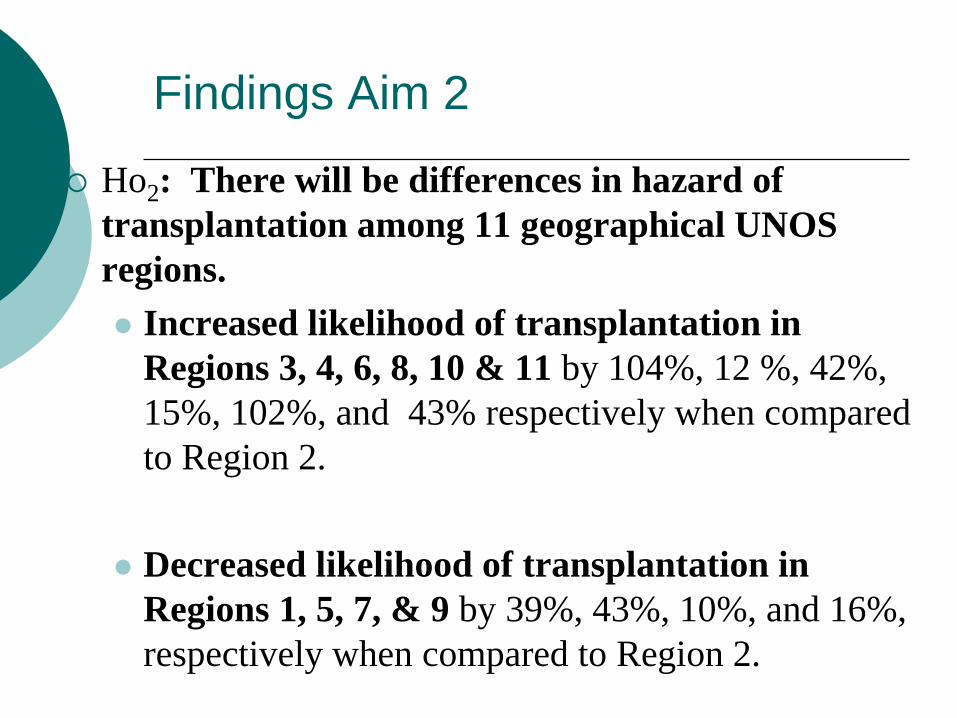
Findings Aim 2
Ho2: There will be differences in hazard of
transplantation among 11 geographical UNOS
regions.
Increased likelihood of transplantation in
Regions 3, 4, 6, 8, 10 & 11 by 104%, 12 %, 42%,
15%, 102%, and 43% respectively when compared
to Region 2.
Decreased likelihood of transplantation in
Regions 1, 5, 7, & 9 by 39%, 43%, 10%, and 16%,
respectively when compared to Region 2.
Elsevier items and derived items © 2007, 2003 by Saunders, an imprint of Elsevier Inc.
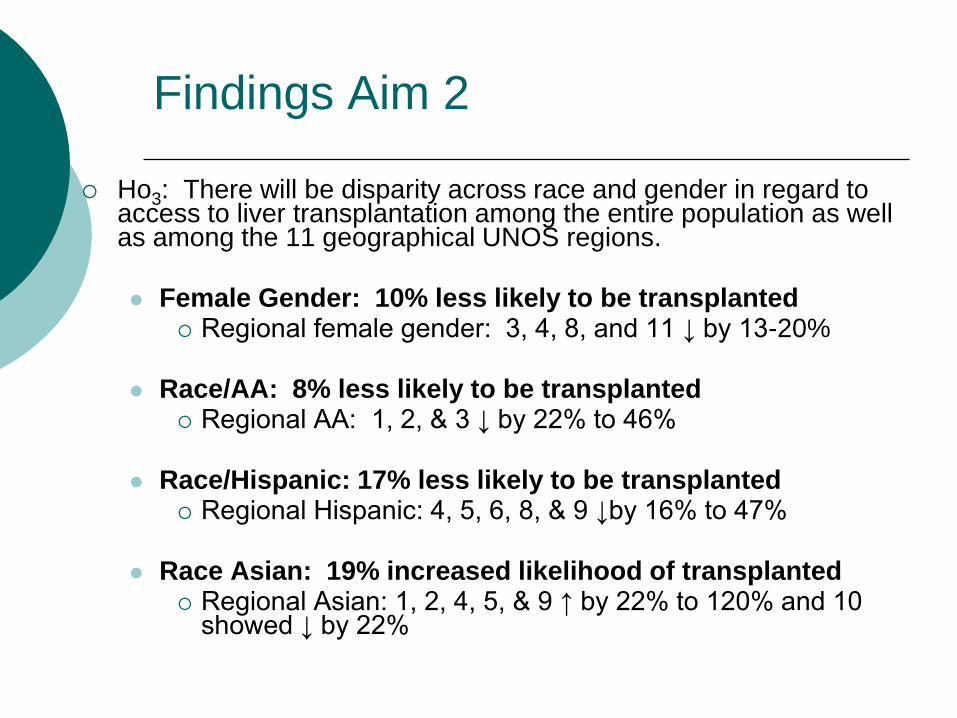
Findings Aim 2
Ho3: There will be disparity across race and gender in regard to access to liver transplantation among the entire population as well as among the 11 geographical UNOS regions.
Female Gender: 10% less likely to be transplanted
Regional female gender: 3, 4, 8, and 11 ↓ by 13-20%
Race/AA: 8% less likely to be transplanted Regional AA: 1, 2, & 3 ↓ by 22% to 46%
Race/Hispanic: 17% less likely to be transplanted Regional Hispanic: 4, 5, 6, 8, & 9 ↓by 16% to 47%
Race Asian: 19% increased likelihood of transplanted Regional Asian: 1, 2, 4, 5, & 9 ↑ by 22% to 120% and 10
showed ↓ by 22%
Elsevier items and derived items © 2007, 2003 by Saunders, an imprint of Elsevier Inc.
Discussion
Gender Disparity
Current study showed differences in risk of transplant due to gender, when controlling for all other variables including acuity
Supported potential systematic bias due to influence of creatinine in MELD acuity scale (Cholongitas, 2007)
Possible provider-selection gender bias
Organ Size Mis-match
Educational Level
Socioeconomic Status
Elsevier items and derived items © 2007, 2003 by Saunders, an imprint of Elsevier Inc.
Discussion
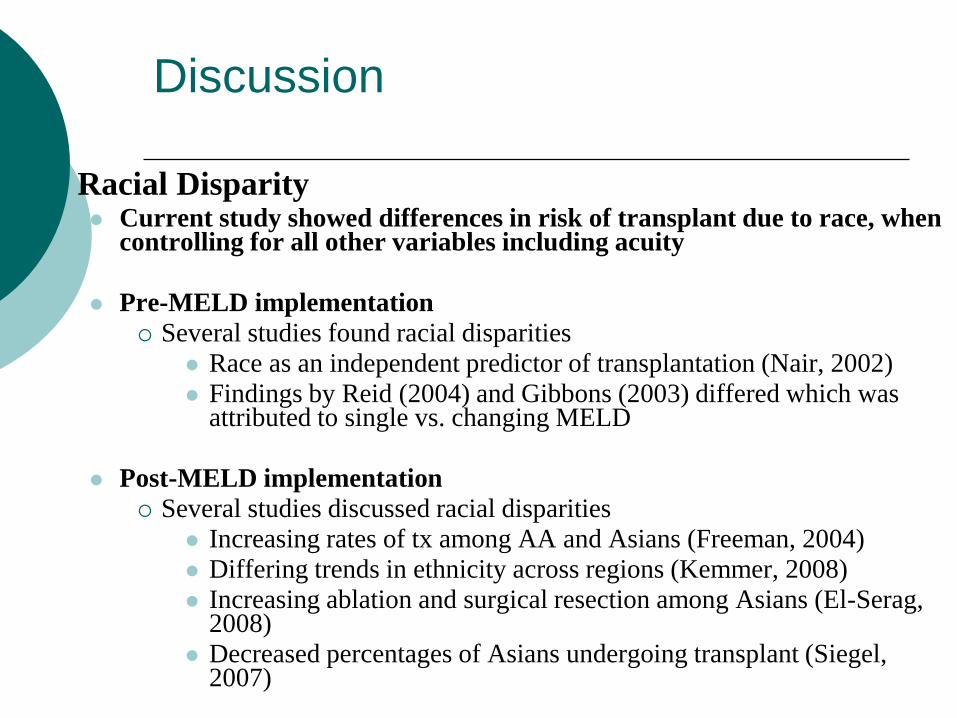
Racial Disparity Current study showed differences in risk of transplant due to race, when
controlling for all other variables including acuity
Pre-MELD implementation
Several studies found racial disparities
Race as an independent predictor of transplantation (Nair, 2002)
Findings by Reid (2004) and Gibbons (2003) differed which was attributed to single vs. changing MELD
Post-MELD implementation
Several studies discussed racial disparities
Increasing rates of tx among AA and Asians (Freeman, 2004)
Differing trends in ethnicity across regions (Kemmer, 2008)
Increasing ablation and surgical resection among Asians (El-Serag, 2008)
Decreased percentages of Asians undergoing transplant (Siegel, 2007)
Elsevier items and derived items © 2007, 2003 by Saunders, an imprint of Elsevier Inc.
Discussion
Racial Disparity
Racial Bias
Possible Provider-Selection Bias
Immunological Influence
Other
Socioeconomic Status
Educational Level (decreased and/or
increased)
Language Literacy Issues
Elsevier items and derived items © 2007, 2003 by Saunders, an imprint of Elsevier Inc.
Discussion
Regional Disparity
Current study reports geographic disparity associated with specific predictor variables by region
Regional Disparity existed pre-MELD
IOM Report of 1999 (Gibbons, 2003)
Differences in waiting times across regions and based on size of OPO
Regional Redistribution Recommendations never adopted
Post-MELD Studies
Differences in acuity at transplant between large and small centers (Trotter, 2004)
Center Selection and Allocation differences (Schaffer, 2003)
Other Studies (Stahl, 2005; Roberts, 2006 etc.)
Elsevier items and derived items © 2007, 2003 by Saunders, an imprint of Elsevier Inc.
Discussion
Limited change in regional distribution
Exception: MELD Share 15 Rule
Increase in population of transplant programs
Increase in numbers of transplant candidates (not
evenly distributed)
Differing ratios of transplant centers/donor service
areas
Differing ratios of donor service areas/region
Existing System of Allocation not based on
“geographic need” but rather historical convention
Never been a study of “geographic need”
Elsevier items and derived items © 2007, 2003 by Saunders, an imprint of Elsevier Inc.
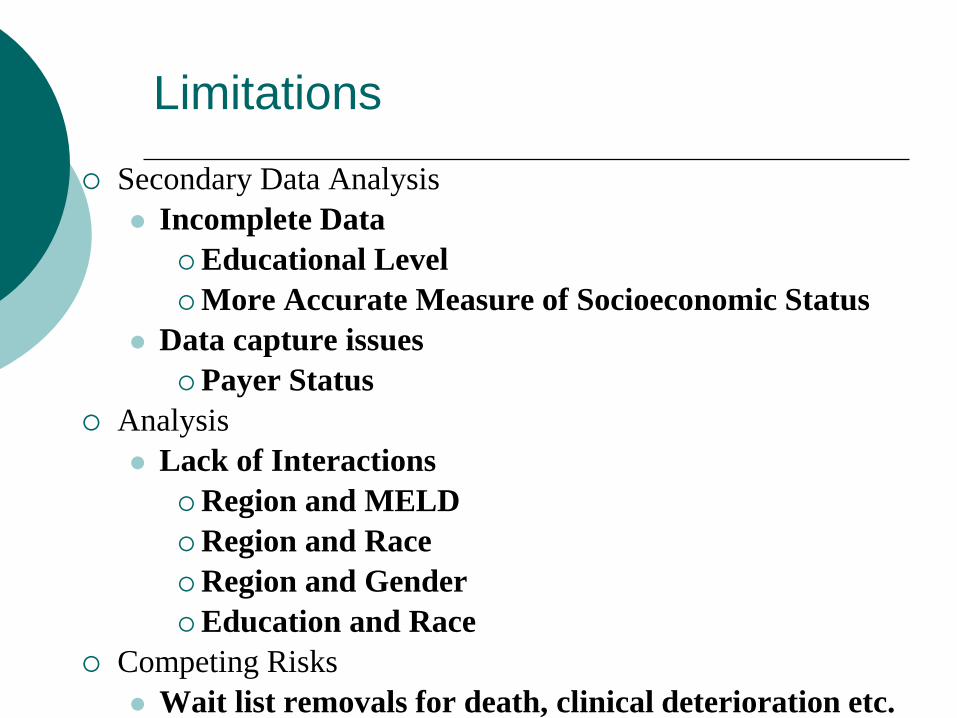
Limitations
Secondary Data Analysis
Incomplete Data
Educational Level
More Accurate Measure of Socioeconomic Status
Data capture issues
Payer Status
Analysis
Lack of Interactions
Region and MELD
Region and Race
Region and Gender
Education and Race
Competing Risks
Wait list removals for death, clinical deterioration etc.
Elsevier items and derived items © 2007, 2003 by Saunders, an imprint of Elsevier Inc.
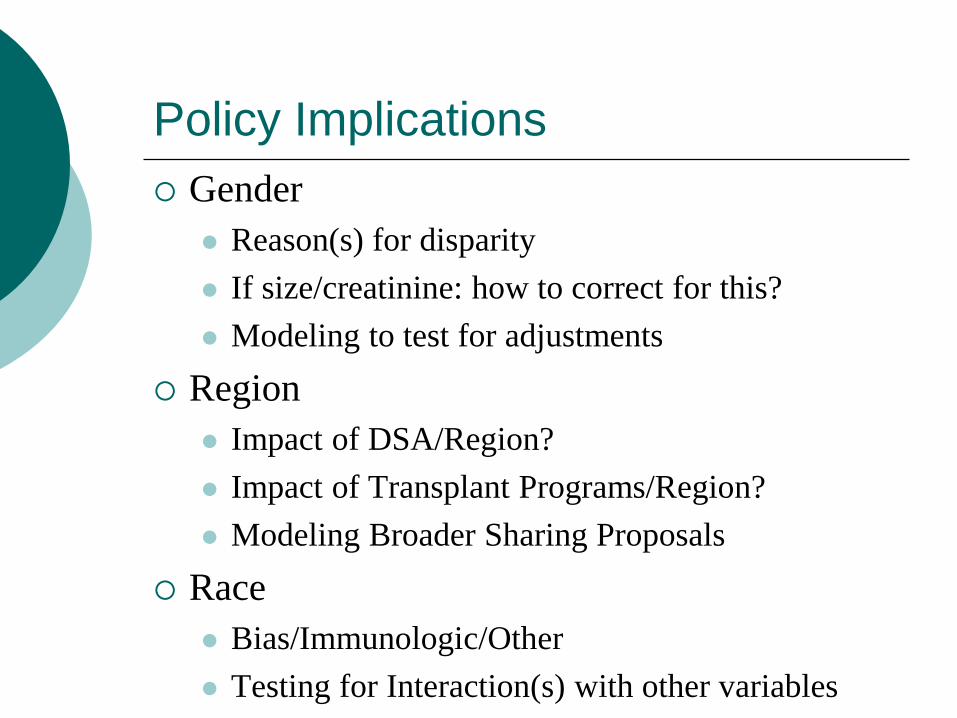
Policy Implications
Gender
Reason(s) for disparity
If size/creatinine: how to correct for this?
Modeling to test for adjustments
Region
Impact of DSA/Region?
Impact of Transplant Programs/Region?
Modeling Broader Sharing Proposals
Race
Bias/Immunologic/Other
Testing for Interaction(s) with other variables
Elsevier items and derived items © 2007, 2003 by Saunders, an imprint of Elsevier Inc.
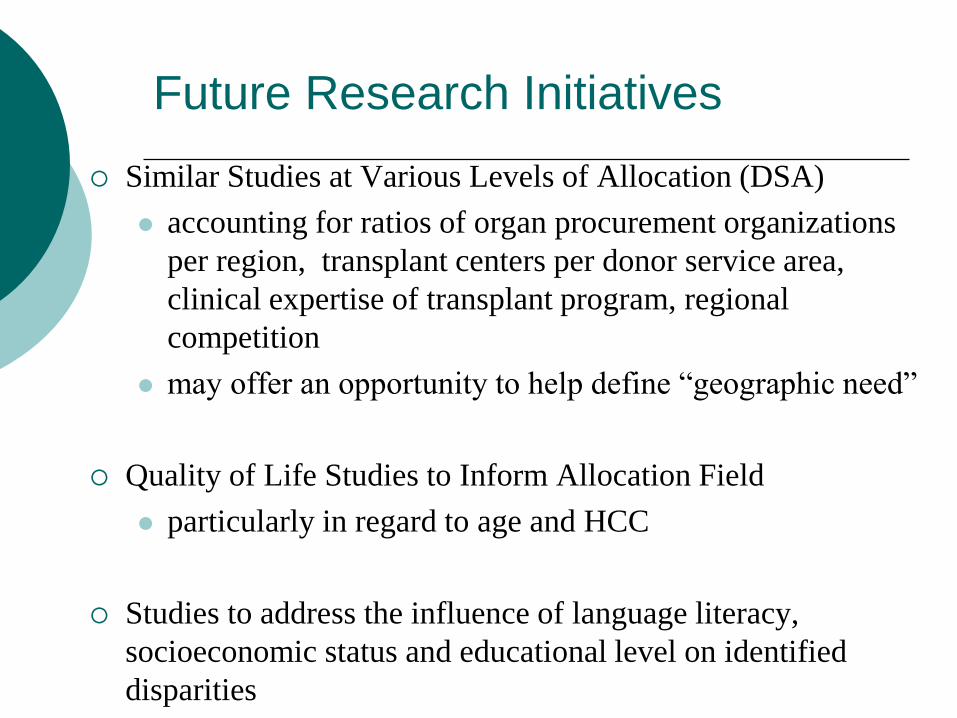
Future Research Initiatives
Similar Studies at Various Levels of Allocation (DSA)
accounting for ratios of organ procurement organizations
per region, transplant centers per donor service area,
clinical expertise of transplant program, regional
competition
may offer an opportunity to help define “geographic need”
Quality of Life Studies to Inform Allocation Field
particularly in regard to age and HCC
Studies to address the influence of language literacy,
socioeconomic status and educational level on identified
disparities
Elsevier items and derived items © 2007, 2003 by Saunders, an imprint of Elsevier Inc.
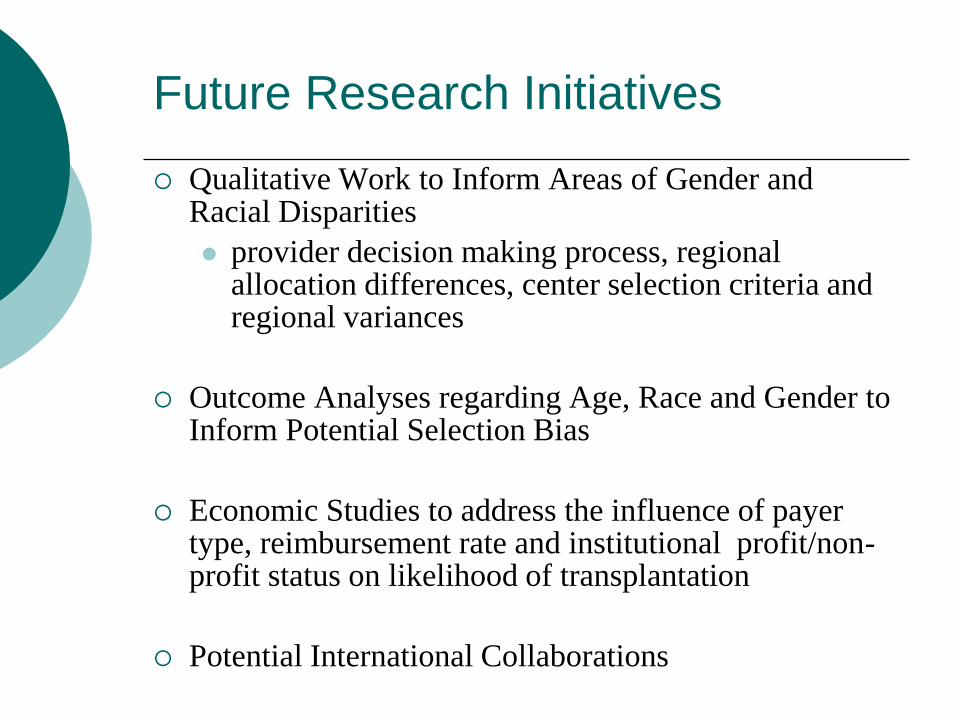
Future Research Initiatives
Qualitative Work to Inform Areas of Gender and Racial Disparities
provider decision making process, regional allocation differences, center selection criteria and regional variances
Outcome Analyses regarding Age, Race and Gender to Inform Potential Selection Bias
Economic Studies to address the influence of payer type, reimbursement rate and institutional profit/non-profit status on likelihood of transplantation
Potential International Collaborations
Elsevier items and derived items © 2007, 2003 by Saunders, an imprint of Elsevier Inc.
In Appreciation
Sigma Theta Tau International
Gordon and Betty Moore Foundation
UCSF Graduate Student Research Award
UCSF Century Club Award
Samuel Merritt University
Nu Xi Chapter of Sigma Theta Tau
Inter Professional Mentors
Robert Newcomer PhD
Joe Mullan PhD
Peter Stock MD, PhD
Charlene Harrington PhD, RN
Family and “Village” of Colleagues and Friends
Eric, Erin and Emily Fieberling
Past and Future Patients
Amy (the 4 year old heart transplant recipient)
Joe (the 20-something kidney transplant recipient)
Wendy (the 30-something islet/pancreas transplant recipient)
Donor Families (known and unknown)
Elsevier items and derived items © 2007, 2003 by Saunders, an imprint of Elsevier Inc.
The moral test of any society is how it cares for
the people in the dawn of life: the children; the
twilight of life: the elderly; and the shadows of
life: the sick and disenfranchised.
Hubert H. Humphrey
Elsevier items and derived items © 2007, 2003 by Saunders, an imprint of Elsevier Inc.
Questions