Embed Size (px)
Citation preview
Inter-American Development Bank
Banco Interamericano de Desarrollo Latin American Research Network Red de Centros de Investigación
Research Network Working paper #R-460
Access to Long Term Debt and Effects on Firms’ Performance: Lessons from Ecuador
by
Fidel Jaramillo* Fabio Schiantarelli**
*Corporación Andina de Fomento **Boston College and Institute for the Study of Labor (IZA)
July 2002
brought to you by COREView metadata, citation and similar papers at core.ac.uk
provided by Research Papers in Economics
Cataloging-in-Publication data provided by the Inter-American Development Bank Felipe Herrera Library Jaramillo, Fidel.
Access to long term debt and effects on firms’ performance : lessons from Ecuador / by Fidel Jaramillo, Fabio Schiantarelli.
p. cm. (Research Network working paper ; R-460) Includes bibliographical references.
1. Corporations--Ecuador. 2. Investments, Ecuadorian. I. Schiantarelli, Fabio. II. Inter-American Development Bank. Research Dept. III. Latin American Research Network. IV. Title. V. Series.
338.74 J862--dc21 ©2002 Inter-American Development Bank 1300 New York Avenue, N.W.
Washington, DC 20577 The views and interpretations in this document are those of the authors and should not be attributed to the Inter-American Development Bank, or to any individual acting on its behalf.
The Research Department (RES) produces the Latin American Economic Policies Newsletter, as well as working papers and books, on diverse economic issues. To obtain a complete list of RES publications, and read or download them please visit our web site at: http://www.iadb.org/res
2
Abstract*
In this paper we document the maturity structure of firms’ debt in Ecuador and we discuss how it has been affected by government intervention in credit markets and by financial liberalization. Using firm-level panel data, we then investigate the determinants of access to long-term debt. Finally, we provide evidence on the impact of the maturity structure of debt on firms’ performance, in particular on productivity and capital accumulation.
* An earlier version of this paper was prepared for the conference “Term Finance: Theory and Evidence”, Finance and Private Sector Development Division, Policy Research Department, the World Bank, Washington, DC, June 14, 1996. We would like to thank C. Calomiris, G. Caprio Jr., A. Demirgüc-Kunt, M. Giugale, S. Claessens, R. Levine, V. Maksimovic, S. Ospina and other conference participants for useful comments and suggestions. The views expressed here are solely those of the authors.
3

4
1. Introduction The theoretical and empirical analysis of firm financing has mainly emphasized the choice of
debt versus (internal or external) equity.1 Although the idea of debt as a homogeneous source of
funds is a powerful theoretical construct and a useful first step, one must go beyond the leverage
decision and investigate other dimensions of the debt choice. In particular, the nature of debt and
its incentive properties can differ according, for instance, to its maturity (long and short) and to
the providers (banks or markets).2
This paper addresses the issue of the maturity structure of firms’ debt and provides some
empirical evidence for Ecuador.3 Although the issue of the maturity structure of debt is
important for both developed and developing countries, there are some aspects of the problem
that have been more often (although not exclusively) raised with respect to the latter. In
particular, there has been a widespread perception both by domestic and international
policymakers that asymmetric information and contract enforcement problems may lead to a
shortage of long-term finance. This shortage is thought to have a cost in terms of productivity
growth and capital accumulation and it may justify some form of government intervention. The
setting up in most developing countries of long-term credit institutions (development banks)
and/or of programs to foster the provision of long-term credit was indeed the policy response to
this problem. The emphasis on long-term finance and on the potentially adverse consequences
when it is in short supply is somewhat at odds with recent theoretical contributions that
emphasize the fact that the use of short-term debt may be associated with higher-quality firms
and may have better incentive properties. In particular, the possibility of premature liquidation
may act as a discipline device that improves firms’ performance. A re-thinking of the role of
long-term debt, particularly when heavily subsidized, has also been prompted by the problems
encountered in many countries by development banks in terms of non-performing loans and by
doubts about the selection criteria used in allocating funds.
This paper has three goals. The first is to document the maturity structure of debt for
Ecuadorian firms in the 1980s and early 1990s, also discussing how the maturity structure has
1 See Harris and Raviv (1990) for a comprehensive critical review. 2 On the maturity choice see Myers (1977), Diamond (1991), Diamond (1993), Kale and Noe (1990), Hart and Moore (1994), and Barclay and Smith (1995). On the role of intermediated debt see Diamond (1984), Calomiris and Kahn (1991), and Rajan (1992). 3 See also Schiantarelli and Sembenelli (1996) for a parallel analysis for the UK and Italy and Schiantarelli and Srivastava (1996) for India.
5
been affected by government interventions in credit markets and by the process of financial
liberalization that started in the mid 1980s. The paper will not, however, have anything to say
about the more recent period of financial turmoil in the latter part of the 1990s, since the data do
not cover that period. Second, using firm-level panel data, the paper analyzes how access to
long-term debt is related to various firms’ characteristics. Third, the paper provides empirical
evidence on the impact of access to long-term debt on firms’ productivity and on capital
accumulation. The empirical work contained in this paper is based both on aggregate financial
data and on micro-level data (especially the latter). The micro data consists of accounting data
for several hundred firms collected by the Superintendencia de Compañías.
Although the empirical analysis provided constitutes a useful preliminary step, it must be
emphasized that the paper does not answer the ultimate question of whether the provision of
long-term finance should be subsidized (directly or indirectly) and, if so, which is the best way to
provide these subsidies. The issue is very complex because the consequences of the distortions
generated by programs of subsidized or directed credit must be compared to the imperfections in
the capital market due to information problems that would exist even in the absence of
administrative controls.4 Moreover, government intervention in promoting the supply of long-
term resources often has multiple objectives, such as redressing regional discrepancies or
promoting greater equality in income distribution, that are not addressed in this paper. Finally, in
spite of this paper’s narrow focus, the data available fall short of giving definitive answers
concerning the effects of government-supported long-term credit. In particular one would
optimally need detailed information at the firm level on the amount of long (and short-term)
credit that is subsidized, together with information of terms and conditions of each loan and on
repayment rates by type of program. All this said, the empirical analysis of determinants and
consequences of the maturity structure of debt provided in this paper is a useful first step that
highlights some interesting problems and issues in the allocation of long-term debt that are
relevant for many LDCs.
The structure of the paper is as follows. Section 2 provides a macroeconomic overview of
the financial developments in Ecuador and of the maturity structure of debt, using aggregate
data. Section 3 uses two different panel data sets to provide some evidence on the issue of firms’
4 See Jaramillo, Schiantarelli and Weiss (1993) and (1996) on the relationship between credit allocation and firm characteristics and on the effects of financial constraints on investment pre and post financial liberalization. See also Calomiris and Himmelberg (1995) on subsidized credit in Japan.
6

access to credit and how it relates to firms’ characteristics. Section 4 estimates both a production
function and an investment equation to assess the impact of the maturity structure of debt on
firms’ productivity and capital accumulation. Section 5 concludes.
2. Maturity Structure and the Role of Subsidized Credit Until the first half of the 1980s, the Ecuadorian financial system was characterized by
widespread regulation, including interest rate controls, directed credit programs and other
government interference in the allocation of finance. As a result, Ecuador exhibited very poor
measures of financial depth. For instance, the M2 to GDP ratio was low and even declined from
20 percent in 1976 to 17 percent in 1983. One of the most important determinants of the
weakness in mobilizing resources through the financial system was the interest rate policy
followed in the 1970s and in the early 1980s. During this period, interest rates were fixed by the
Government at levels at or below the inflation rate. Zero or negative real interest rates
discouraged financial savings and limited the ability of banks to mobilize private funds.
However, directed credit programs from public institutions, in particular the Central
Bank, compensated the inability of the financial system to generate funds for investment. In
1984, these credit programs represented approximately 50 percent of the total credit in the
economy. This explains why, despite the situation of financial repression, total credit in the
economy increased during the 1970s and early 1980s, and peaked in 1983, when total credit
reached 23 percent of GDP (see Figure 1 and the first two columns of Table l, reporting credit as
a percentage of GDP and real credit growth rates).
Beginning in 1984, Ecuador introduced a set of reforms that gradually liberalized the
financial market. These reforms eliminated or scaled down directed credit programs and
removed administrative controls on interest rates. These reforms lead to an increase in real
interest rates and improved the ability of the financial system to mobilize resources (see Figure
2). As a result the M2 to GDP ratio increased from 17 percent in 1983 to 23 percent in 1987,
mainly due to the introduction of the “polizas de acumulación.” However, the supply of credit
was drastically reduced due to the contraction of government-provided loanable funds. As
Figure 1 shows, total credit in the economy decreased steadily during the second half of the
1980s and was as low as 9 percent of GDP in 1990. The main explanation for this behavior was
the reduction of directed credit programs from public sector institutions that decreased their
7
share in total credit from 52.7 percent in 1984 to 9 percent in 1992, as shown in Table 2. In 1988
there was a similar setback in the process of financial deepening, reflected in a decline of M2 to
GDP ratio. This was followed, however, by a continuation of previous improvements in the early
1990s.
If one looks at the term structure of debt (see Table 1, last five columns), long-term debt
is quantitatively much less important than short-term debt. In the early 1980s, long-term credit
(with maturity greater than a year) accounted for 12 percent of total debt. During the second half
of the 1980s, its share of total debt increased to 17 percent in 1989, but dropped to 8 percent in
1992. Real growth rate of long-term credit was negative for most years, although short-term
debt declined even faster.
It is difficult to assess exactly the role of directed credit programs in the availability of
long-term credit. However, most programs of the Corporación Financiera Nacional (CFN) and
Banco Nacional de Fomento (BNF), supported sectors and activities like exports (FOPEX), small
industry (FOPINAR) and agriculture, with long-term lines of credit for the purchase of
machinery and fixed assets. The programs financed by rediscount lines that commercial banks
could use with the Central Bank, were instead typically short term, although it was a common
practice to renew credit lines extended to firms. The programs financed directly by the Central
Bank were very important in the first half of the 1980s (89 percent of total directed credit) and
decreased in importance throughout the 1980s and early 1990s (representing 32 percent of total
directed credit in 1992), as shown in Table 4. The last two lines of Table 3 report the proportion
of directed long-term credit relative to total long-term credit and the proportion of directed short-
term credit relative to total short-term credit. The data confirm that the percentage of directed
credit is much higher for longer maturities. This percentage decreases from 59.3 percent in 1985
to 35.9 percent in 1990. It then increases to 63.4 percent and 78.7 percent in the following two
years, in spite of the real decline in directed long-term credit, since market-provided long-term
credit declines even faster. The percentage of directed short-term credit decreases from 31.1
percent in 1985 to 3.3 percent in 1992. It should be kept in mind that the last two years real total
short-term credit expanded, following the real credit crunch at the end of the 1980s.
As mentioned above, at the beginning of the 1980s real (ex post) “market” lending rates
were negative, even in the absence of subsidies. They became positive, on average, until 1987,
and negative again in the following two years, following the earthquake and a period of fiscal
8
laxity, resulting in a fall in the M2 to GDP ratio. In the first half of the 1990s real rates have
been mostly positive and increasing (see Figure 2). Interest on directed credit programs like
FOPEX and others administered by CFN was significantly lower than lending market rates, as
Table 4 shows. Market rates were 1.58 times subsidized rates in 1983, 1.94 in 1988, and only
1.19 in 1991. The spread between the two was 21.57 percentage points in 1988 and 8.82
percentage points in 1991.
3. Firm-Level Evidence on Access to Long-Term Term Debt and on Debt Maturity This section discusses the micro-level evidence on the maturity structure of firms’ financing.
Two samples are used in the analysis,5 both based on accounting data collected by the
Superintendencia de Compañias. The first (unbalanced) sample (hereafter SC1) includes 731
Ecuadorian manufacturing companies during the period 1984-1988 and contains more detailed
information on firms’ real and financial variables. Moreover, for the companies in this sample it
has been possible to identify whether they belong to an industrial group associated with a bank.
This sample includes separate figures for short-term (non-trade) debt, long-term debt, and trade
debt, so that the measure of length of maturity equals long-term debt divided by the sum of long-
term debt, short-term debt and trade debt.
The second sample, which unfortunately cannot be linked to the first, is also derived
from the data of the Superintendencia de Compañias, includes 850 companies and covers the
period 1984-1992 (hereafter SC2). The period covered by this sample is longer, making it
possible to investigate more convincingly changes in the allocation mechanism of long term
credit, both before and after financial liberalization. This data set, however, contains fewer and
much more aggregate variables. In this case there is available only data on total long-term
liabilities; this also includes shareholders’ debt, which is quite important in smaller companies,
and other deferred liabilities unrelated to financial or trade debt. In this case the measure of
length of maturity is total long-term liabilities divided by total liabilities.
5 See the Data Appendix for a description of the data.
9
3.1. Descriptive Statistics for the Two Panels For the firms in the SC1 sample, in 1984 long-term financial debt represented 11.5 percent of
total debt (see Table 5). This figure is of the same order of magnitude as the one obtained from
aggregate financial data. The share of long-term debt in total debt increased until 1987, reflecting
the faster decline in short term debt during that period. In the SC2 sample, after 1987 there is a
decrease in the length of maturity, as a result of the real decline in long term debt and of the real
expansion in short term debt we have already observed at the aggregate level.
One striking fact regarding maturity structure is that a large number of firms appear to be
cut-off altogether from any access to long-term debt. In the SC1 sample, which is the one to be
used to draw inferences about access given the more detailed figures on debt, 214 firms (29.3
percent of the total) never received long-term financial credit, 311 firms (42.5 percent of the
total) had long-term debt during some years, while only 211 firms (28.2 percent of the total)
always had long-term debt (see Table 6, Part I). In the SC2 sample, which, because of the more
aggregate nature of the debt variables is bound to present a rosier picture, 25 firms (2.9 percent
of the total) never had long-term liabilities, 538 firms (63.3 percent) had long-term liabilities
during some years, and 287 (33.8 percent of the total) had them during the whole period.
It is interesting to note that according to the SC1 sample, access to long-term financing
improves over time (see Table 6, Part II). In 1984, only 37 percent of firms had long-term debt.
This number increases to 59.2 percent in 1987 and decreases slightly to 58.9 percent in 1988.
Unfortunately, the question of access in more recent years cannot be tracked because the SC2
sample is less informative in this sense.
If the SC1 sample is split by size, it can be seen that access to long-term credit varies
positively with size (see Table 7, Part I). Among the largest group of companies, 58 percent had
long-term debt in every year of the period. Conversely, only 11 percent of the micro firms and 17
percent of the small firms had similar access to long-term financing. Half of the micro firms and
44 percent of the small firms never had long-term debt, while only 1.9 percent of large firms
never had long-term debt. Similar conclusions concerning the correlation between access to
long- term debt and size are derived from sample SC2.
Access to long-term credit also has a positive (simple) correlation with age: older firms
have better access to this type of financing than younger firms, as shown in Table 7, Part II. For
10
instance, 35.7 percent of the youngest firms have never received long-term debt, while the figure
is 22.7 percent for the oldest firms.
The relationship between access to long-term credit and bank association has also been
explored.6 Almost half of the firms associated with banks had long-term loans during the whole
period. In contrast, only 25 percent of the firms with no bank association had regular access to
long-term financing (see Table 7, Part III). It is important to mention that older firms and
companies with bank association are usually the larger ones.
Finally, Table 8 investigates the association between the maturity structure of liabilities
and other firms’ characteristics, for the SC1 and the SC2 sample respectively. The first three
columns of the table continue to divide firms among those who never, sometimes, and always
had access to long-term debt. The last three columns divide the firm-year observations according
to whether maturity is below the median, between the median and the third quartile, and above
the third quartile. Obviously, the share of long-term credit to total credit is higher in companies
that always had long-term financing compared to the rest. Firms that always had long term debt,
are larger, judging by their mean or median real capital stock or real sales, more leveraged, with
a higher proportion of fixed assets to total assets, more profitable and more dynamic, judging by
the real sales growth rate. However, the investment rate (the ratio of investment to the capital
stock) is lower for this group of firms. The ratio of liquid assets to total capital is no different for
firms that never had access to long-term credit and those that always had it, although it is higher
for companies that have had long term financing during some years. The results obtained when
firms are divided according to quartiles are similar with two interesting exceptions. First, the
(operating) profit rate is the lowest for the group with a maturity length in the top quartile
relative to the other firms. Second, the liquid asset to total asset ratio seems to be monotonically
decreasing with maturity. The results for the SC1 and the SC2 sample are very similar. The only
difference is that profit is always positively correlated both to the access and length of maturity.
3.2. Econometric Evidence on Access and Maturity
This subsection discusses some of the econometric evidence on access to long-term debt. Table 9
reports in the first two columns the results obtained using probit and logit models for the
6 Bank association was defined whenever management or important shareholders of manufacturing firms were also members of the Board of Directors of a financial institution.
11
probability of obtaining long term credit for the SC1 sample. In order to take into account the
panel data nature of the data, the last two columns also report the results for the probit random
effects model (see Butler and Moffit, 1982) and for the fixed effect logit model (see
Chamberlain, 1980). In order to minimize endogeneity problems, at least in the logit models with
fixed effects, all regressors have been included as beginning of period (if stocks) or last period
values (if flows). All equations in this subsection include also sector and year dummies (not
reported here for the sake of brevity), with the exception of the logit model with fixed effects,
which includes only year dummies. Although the significance of the coefficient varies across
estimators, the direction of the effects of the various variables is in most cases consistent across
estimators. One of the clearest results is that size (proxied here by the logarithm of the real
capital stock at the beginning of the period, LRKAP1) is very important in determining access to
long-term credit. More specifically, the probability of obtaining long-term credit is greater for
larger firms. This result is consistent with one of the predictions in the model by Diamond
(1991), which shows that for firms with low credit ratings (presumably the small firms in this
case), an increase in quality is associated with gaining access to long-term debt.7 In his model the
basic trade-off is between the benefits of short-term debt, because it allows firms to take
advantage of favorable news certain, and the liquidation risk they have to bear, since
opportunistic lenders may try to appropriate the surplus by forcing the firm into bankruptcy.
However, great caution is needed before linking the empirical results for Ecuador to the
theoretical models that have been proposed in the literature. One problem is that lenders are
assumed to be profit maximizing in the model, which may or may not be an accurate assumption
for Ecuadorian intermediaries in their role of providers of directed credit.
Since the real value of fixed assets has been used as a proxy for size, the positive effect of
size also reflects the fact that the availability of collateral is a prerequisite to obtain long-term
debt. Finally, the positive effect of the size variable could capture the greater economic and
political bargaining power by large firms in obtaining long-term directed credit.
Other than size, no other firm characteristic has a statistically significant coefficient at
conventional levels in the fixed effect logit equation, although the direction of the effects is
identical to that in the other models. The lack of precision in the coefficient estimates in the fixed
7 See Schiantarelli and Sembenelli (1996) for a more detailed discussion of the theoretical models of maturity choice.
12
effect logit model should not be too surprising; estimation of the conditional likelihood function
implies a loss of efficiency, since many observations drop out from the (conditional) likelihood
(see Chamberlain, 1980 for details).
Given size, past operating profits as a proportion of total assets (fixed capital plus
inventories plus liquid assets), CFK1 does not have a statistically significant effect on access to
long-term debt in any equation (actually the point estimate is always negative). One has to
remember that the larger firms in the panel are more profitable than smaller ones. However, it is
somewhat worrisome from the point of view of the allocation of directed credit that, conditional
on size, profits do not matter in determining access to long-term credit.
Association with a business group with bank links, captured by the dummy variable
BAND, is not a significant determinant of access, either. This is somewhat surprising, since
members of business groups may be thought to have superior clout in accessing financial
resources, in addition to being informationally less disadvantaged. Similarly, all else being
equal, the age of the firm (summarized by the AGE2 to AGE4 dummies in deviation from the
youngest firms) is not a significant determinant of access. The explanation for both these results
may be that the effect of bank association or age is basically subsumed by the size variable,
given the high probability that larger firms are group members and, at the same time, older.
The overall past degree of leverage, LEV1, is positively related to access to long-term
debt. Past access to both short term and long term debt may work here as a predictor of the
ability to obtain long-term debt (more on the role of leverage below). The initial stock of liquid
assets, LASK1, does not play, instead, a statistically significant role.
Table 10 reports the results for the SC1 sample from estimating a sample selection model
for the length of debt maturity, using standard two-step procedures. The dependent variable is
long-term debt as a proportion of total debt, including trade debt, MAT. The results reported are
those obtained when either a probit model or a logit model is used in the first step. The
coefficient of cash flow in the maturity equation is negative, which emphasizes the concerns
expressed above regarding criteria for the allocation of long-term directed credit in Ecuador.
Paralleling the results for the access, the length of maturity is positively and significantly related
to lagged leverage. As explained above, this latter result may reflect the fact that having obtained
debt in the past is an indication of the ability to obtain long-term debt in the future. It is also
consistent with the idea that higher leverage increases the risk of liquidation and makes long-
13
term debt more attractive for firms. The length of maturity is also positively associated with size,
but the association is not very significant.
There is also evidence of a very strong and positive association between lagged asset
maturity (proxied here by the ratio between fixed capital and the sum of fixed capital (estimated)
inventories and liquid assets, ASS1). This is consistent with the idea that firms tend to match the
maturity structure of assets and liabilities, as implied by the conventional wisdom and as
predicted by the more formal model by Hart and More (1994). It is also consistent with the
hypothesis that fixed assets may be a better form of collateral for long term debt, so that their
availability is associated with longer maturity of debt. Finally the growth of real sales,
GYREAL1, has a positive but not significant effect on maturity.
One important issue that deserves to be investigated is whether changes have occurred
over time in the determinants of access to long-term credit and, conditional on having access, on
the maturity structure of debt. In particular, it would be useful to know whether financial
liberalization has introduced any change in the allocation mechanism of long-term debt. The
longer SC2 sample has been used to obtain some evidence on this issue.8 Table 11 reports the
results obtained estimating the sample selection model for the SC1 sample. After some
experimentation, the coefficients on lagged operating profits as a proportion of total assets
(PROF1) and on the lagged value of the logarithm of real assets (LRTA1) have been allowed to
vary before and after liberalization, both in the access and maturity equation (in Table 12 LD is a
dummy variable that equals one from 1989 onward).9 The results suggest that the probability of
having access to long term debt before financial liberalization is positively related to size and
leverage and negatively related to profits. These results are similar to those obtained for the SC1
sample. The main difference is that the profit variable is now negative and significant (it was not
significant for the SC1 sample), making even stronger the concerns on the criteria used to
allocate long term directed credit. The coefficient on profits increases significantly after
liberalization, but it remains negative. The increase in the value of the coefficient may reflect the
fact that financial intermediaries start paying more attention at accounting measures of firms’
credit rating after financial liberalization. This would also be confirmed by the fact that the 8 In order to investigate the effect of financial liberalization, it would have been desirable to be able to link the two samples in order to cover a longer data period, both pre and post liberalization. As explained above, this is not possible.
14
(positive) coefficient of the log of total real assets is significantly and substantially larger after
financial reform, which is consistent with a greater importance of collateral. The negativity of
the coefficient also in the post reform period could be explained by the fact that better (more
profitable) firms prefer to use short-term credit in order to take advantage of future disclosure of
positive information, as suggested by Diamond (1991) for the firms at the upper end of the
quality spectrum. However, there is also another possible explanation for this result. As
indicated above, although the real supply of long term directed credit continues to decrease in
1991 and 1992, market-provided long-term credit shrinks even faster. As a result the share of
directed credit in total long-term credit provided to firm increases, and it is possible that the
allocation of this portion of long-term credit remains problematic in more recent years.
The sign and magnitude of the profit coefficients in the second stage maturity equation
parallel those in the probit equation and, therefore, the arguments immediately above will not be
repeated. Size does not play a significant role in the maturity equation, while the maturity
composition of assets and the degree of leverage both have a significantly positive effect on the
length of the maturity structure of debt.
4. Maturity and Performance This section discusses the effect of the maturity structure of debt on firms’ performance. More
specifically, two main issues are addressed. The first is whether the availability of long-term
finance allows firms to improve their productivity. The second is whether the availability of
long- term finance stimulates capital accumulation by firms. There are at least two reasons why
access to long-term debt may improve firms’ productivity. On the one hand, it may allow firms
access to better and more productive technologies, which the firm may be reluctant to finance
with short-term debt because of fears of liquidation. On the other, lack of availability of long
term finance may put a squeeze on working capital, and this may have adverse consequences on
productivity. The other side of the coin is that short-term debt, if it entails more continuous
monitoring, may force firms to reduce inefficiencies and to increase productivity at each level of
measurable inputs (capital stock, number of workers, materials). Ultimately the issue is an
empirical one.
9 Although financial liberalization started in 1984, it is a lengthy process that has included setbacks. Similar results were obtained with different breaking points.
15
In Table 12 a standard Cobb-Douglas production function is estimated, with capital, labor
and materials, for the SC1 sample, the only one for which the necessary data are available. The
logarithm of the real value of sales, LRY, is used as a proxy for output. LRN denotes the log of
employment, LRK the log of the real value of fixed assets, and LRM the real value of material
used in production. In addition, total factor productivity to depends upon the maturity structure
of debt and also on the overall degree of leverage. One potential reason for the inclusion of
leverage is that financial pressure may force the firm and its managers to be more efficient.10
However, it is possible that with more leveraging, controlling shareholders may have a smaller
incentive to strive for efficiency, since they reap a smaller fraction of the rewards. Different
specifications of the equations are estimated in terms of their dynamic structure. All equations
are estimated by GMM after taking first differences (see Arellano and Bond, 1992).11 The first
difference transformation removes the firm-specific and time-invariant components of the error
term. Removal of the firm-specific component of the error term is important in order to prevent
the coefficient of maturity from merely capturing the fact that better firms may simply receive
more long-term debt. Lagged values (two or more periods) of the regressors and of the dependent
variable are used as instruments to account for potential endogeneity of the regressors, either
because the variables are decided jointly with production or because there are measurement
errors. The equations also contain year dummies. The table further reports the test of over-
identifying restrictions (denoted here as the Sargan test), distributed as chi-squared, and tests for
first and second-order serial correlation (m1 and m2 respectively), distributed as a standardized
normal.
The results suggest that, when beginning of period maturity together with beginning of
period leverage is added to the static version of the production function, there is no statistically
significant effect on productivity. When maturity and leverage are entered as end of period
variables, the effect of maturity is positive and almost significant, while the leverage effect is
virtually zero. When the leverage variable is excluded from the equation, the effect of maturity
becomes significant. Still the test of over-identifying restrictions of all the specifications
illustrated so far suggests that there is some form of mis-specification. One such form of mis-
specification, namely dynamic mis-specification, has been explored. The production function has
10 See also Nickell and Nicolitsas (1995) for an analysis using UK panel data. 11 The DPD program by Arellano and Bond (1988) is used for estimation.
16
therefore been re-estimated, including the lagged value of the dependent variable and
contemporaneous and lagged values of all the regressors (financial and real). This model can be
interpreted as the unrestricted version of a model in which the dynamics are generated by an
autoregressive error term of order one. The results are reported in the last column of the table.
Now the equation passes the test of over-identifying restrictions. Again, contemporaneous
maturity has a positive effect on productivity, while the leverage effects are insignificant.
What is the impact of the maturity structure of debt and fixed capital accumulation? This
issue is investigated by estimating an augmented accelerator type of investment function, where
the investment rate, IK, is a function of its own lagged value, of the contemporaneous and once
lagged rate of growth in real sales, GYR, past cash flow (net of interest rate payments), CFKN,
leverage, LEV, and maturity, MAT. All the coefficients have been allowed to differ across small
and large firms (S denotes small and L large in the variables’ definition).12 The results, obtained
using the GMM estimator, are reported in Table 13. As one would expect if capital market
imperfections are more important for smaller firms than for larger firms, the coefficient is greater
and more significant for the former. The other financial variables, leverage and maturity, do not
appear to play an important role, and are not significant at conventional levels, whether they are
included contemporaneously or once lagged. When their contemporaneous values are used as
regressors, there is some weak evidence of a positive association between maturity and
investment, but only for large firms (t = 1.58), while for small firms the association is actually
negative (with a t = -1.73).
5. Conclusions Several lessons emerge from the empirical analysis of the maturity structure of debt in Ecuador.
The most striking fact is the very unequal distribution of the maturity structure of debt. This is
summarized by the fact that, at one end of the spectrum, almost 30 percent of all firms never
have access to long-term credit during the period covered by the richer panel presented here. At
the other end of the spectrum, almost 30 percent of all firms always have some long-term debt
among their liabilities. The main determinant of the probability of obtaining long-term credit is a
firm’s size (proxied by the real value of the fixed assets). This positive association is consistent
with several explanations. One is simply that the availability of collateral is a prerequisite for
17
obtaining long-term credit. Moreover, since larger firms in Ecuador tend to be more profitable,
this result could also reflect the positive association between firm quality and access to long-term
credit. Finally, larger firms are likely to have better bargaining power and greater political
influence in obtaining long-term financial resources.
One disturbing additional result is that, conditional on size, operating profits either do not
increase the probability of receiving long-term credit or may actually decrease it. Moreover,
conditional on having obtained access, they are negatively correlated with the length of the
maturity structure of debt. This raises some questions on the mechanism used in allocating long-
term financial resources in Ecuador during the period under examination.
It is interesting to note that the negative effect of profits is greater before financial
liberalization, suggesting that the allocation problem was particularly severe for directed credit.
After financial liberalization, the coefficient on profit increases, but not quite enough to make it
positive. The increase is consistent with the presence of greater incentives for banks to pay more
attention to accounting measures of firms’ credit ratings. This would also be confirmed by the
fact that the (positive) coefficient of the log of total real assets is significantly and substantially
larger after financial reform, which is consistent with a greater importance of collateral. The
negativity of the profit coefficient also in the post-reform period could be explained by the fact
that better (more profitable) firms prefer to use short-term credit. Alternatively, it could be due to
the fact that allocation problems still remained in the early 1990s for long-term directed credit,
which, in spite of its real contraction, increased as a share of total long term credit in 1991 and
1992, due to the even faster real decrease in the supply of market provided credit.
The data also suggest that there is a strong positive association between asset maturity
and debt maturity. This matching of assets and liabilities confirms both the conventional wisdom
and the theoretical models that can be used to rationalize it.
Does the availability of long-term finance make a difference to a firm’s performance,
either in terms of productivity or of capital accumulation? With respect to productivity, does
long-term credit facilitate access to more productive technologies or does the less intense
monitoring and the lesser fear of liquidation associated with long term debt actually reduce
productivity? The results obtained from estimating an augmented production function are quite
unequivocal in suggesting that a shorter maturity is not conducive to greater productivity.
12 Firms are classified as large if their fixed capital stock exceeds $6 million at 1975 prices.
18

Moreover there is some evidence that long-term debt may actually lead to productivity
improvements. Although these results suggest that long-term debt may have a positive impact
on the quality of capital accumulation, estimation of an investment equation does not show a
large and significant impact of the maturity structure of debt on the amount of fixed investment.
19
References Arellano, M., and S. Bond. 1988. “Dynamic Panel Data Estimation Using DPD: A Guide for
Users.” Working Paper 88/15. London, United Kingdom: Institute for Fiscal Studies.
----. 1992. “Some Tests of Specification for Panel Data: Monte Carlo Evidence and an
Application to Employment Equations.” Review of Economic Studies 58: 277-297.
Barclay, M.J., and C.W. Smith, Jr. 1995. “The Maturity Structure of Corporate Debt.” Journal of
Finance 50: 609-631.
Butler, J., and R. Moffit. 1982. “A Computationally Efficient Quadrature Procedure for the One
Factor Multinomial Probit Model.” Econometrica 50(3): 761-764.
Calomiris, C.W., and C.M Kahn. 1991. “The Role of Demandable Debt in Structuring Optimal
Banking Arrangements.” American Economic Review 81: 497-513.
Calomiris, C.W., and C. Himmelberg. 1995. “Government Credit Policy and Industrial
Performance: Japanese Machine Tool Producers 1963-1991.” Policy Research Working
Papers No. 1434. Washington, DC, United States: World Bank.
Chamberlain, G. 1980. “Analysis of Covariance with Qualitative Data.” Review of Economic
Studies 47: 225-238.
Diamond, D.W. 1984. “Financial Intermediation and Delegated Monitoring.” Review of
Economic Studies 51: 393-414.
Diamond, D.W. 1991. “Debt Maturity Structure and Liquidity Risk.” Quarterly Journal of
Economics 106: 710-737.
Diamond, D.W. 1993. “Seniority and Maturity of Debt Contracts.” Journal of Financial
Economics 33: 341-368.
Fazzari, S.M., Hubbard, R.G. and B.C. Petersen. 1988 “Financing Constraints and Corporate
Investment.” Brooking Papers on Economic Activity 1: 141-95.
Hart, O., and J. Moore. 1994. “A Theory of Debt Based on the Inalienability of Human Capital.”
Quarterly Journal of Economics (November): 841-979.
----. 1995. “Debt and Seniority: An Analysis of the Role of Hard Claims in Constraining
Management.” American Economic Review (June): 567-585.
Kale, J. R., and T. H. Noe. 1990. “Risky Debt Maturity Choice in a Sequential Equilibrium.”
Journal of Financial Research 13: 155-165.
20
Harris, M., and A. Raviv. 1990. “Capital Structure and the Informational Role of Debt.” Journal
of Finance 45: 321-349.
Jaramillo, F., F. Schiantarelli and A. Weiss. 1993. “The Effect of Financial Liberalization on the
Allocation of Credit: Panel Data Evidence for Ecuador.” Policy Research Working Paper
No. 1092. Washington, DC, United States: World Bank.
----. 1996. “Capital Market Imperfections Before and After Financial Liberalization: An Euler
Equation Approach To Panel Data for Ecuadorian Firms.” Country Economics
Department Working Paper 1091. Washington, DC, United States: World Bank.
Myers, S.C. 1977. “Determinants of Corporate Borrowing.” Journal of Financial Economics 5:
147-175.
Nikell, S., and D. Nicolitsas. 1995. “How Does Financial Pressure Affect Firms?” Applied
Economics Discussion Paper Series 170. Oxford, United Kingdom: Oxford University.
Rajan, R. 1992. “Insiders and Outsiders: The Choice Between Relationsip and Arm’s-Length
Debt.” Journal of Finance 47: 1367-1400.
Schiantarelli, F., and V. Srivastava. 1996. “Debt Maturity and Firm Performance: A Panel Study
of Indian Public Limited Companies.” Washington, DC, United States: World Bank,
Policy Research Department.
Schiantarelli, F., and A. Sembenelli. 1996. “Determinants and Consequences of the Maturity
Structure of Firms’ Debt: The Case of the UK and Italy” Mimeographed document.
21
DATA APPENDIX The empirical research is based on information collected by the “Superintendencia de
Compañías”(SC) of Ecuador. The SC is a government agency that controls corporate activities.
By law, all firms have to submit balance sheet and profit and losses information to the SC in
order to do business in Ecuador and in order to obtain credit (official loans, as well as regular
credit), tax identification numbers, and other legal requirements.
The balance sheets also include, together with the standard items, information on
reevaluations of assets allowed by the Government to account for inflation and exchange rate
depreciation. The capital stock measure is the revalued one and it includes plant and machinery,
buildings and others (excluding land).
We use two samples in the analysis. Both of them are based on data accounting collected by the
SC.
The first (unbalanced) sample (SC1) includes 731 Ecuadorian manufacturing companies
during the period 1984 - 1988, out of which 366 firms have data for the full five year period. It
contains detailed information on firms’ real and financial variables. All the variables used in the
paper are the ones derived from the balance sheets or profit and loss account. The only exception
is the figure for the stock of inventories that has been computed by multiplying the firm level
sale figure by the industry wide inventory to sales ratio in each year.
The second sample (SC2), after eliminating firms with missing, unacceptable, or
inconsistent data, or firms not engaged in production activities, consists of 850 firms with
complete information available the period 1982-1992. Even though this sample is longer and
more recent, it contains more aggregate and therefore fewer variables.
22
The following table summarizes the structure of the sample.
Category SC1 sample Frequency
Percent
Cum. Freq.
Cum. Per.
SC2 sample Frequency
Percent
Cum. Freq.
Cum. Per.
By Size Micro 28 3.83% 28 3.83% 212 24.94% 212 24.94% Small 216 29.55% 244 33.38% 213 25.06% 425 50.00% Medium 355 48.56% 599 81.94% 213 25.06% 638 75.06% Large 132 18.06% 731 100.00% 212 24.94% 850 100.00%By Age Youngest 171 23.39% 171 23.39% 282 33.18% 282 33.18% Young 260 35.57% 431 58.96% 456 53.65% 738 86.82% Old 150 20.52% 581 79.48% 92 10.82% 830 97.65% Oldest 150 20.52% 731 100.00% 20 2.35% 850 100.00%By Sector 31: Food and Beverages
143 19.60% 143 19.60% 189 22.20% 189 22.20%
32: Textiles 111 15.18% 254 34.78% 132 15.50% 320 37.70% 33: Lumber 45 6.10% 299 40.88% 41 4.80% 361 42.50% 34: Paper and printing 73 9.99% 372 50.87% 78 9.20% 439 51.70% 35: Chemicals 139 19.02% 511 69.89% 170 20.00% 609 71.70% 36: Metallic minerals 43 5.88% 554 75.77% 49 5.80% 659 77.50% 37: Nonmetallic minerals
19 2.60% 573 78.37% 23 2.70% 682 80.20%
38: Machinery 144 19.70% 717 98.07% 145 17.00% 826 97.20% 39: Others 14 1.92% 731 99.98% 24 2.80% 850 100.00%
Notes for SC1: Definition of size by capital stock in the initial year: Micro US$ 2000 < K; Small: US$ 2000 < K < US$ 40000; Medium: US$ 40000< K < US$ 600000; Large K > US$ 600000. K : machinery, plant and equipment, other (excluding land); K is valued at 1975 US Dollars. Definition of age: youngest: born after 1980; young: born between 1970 and 1980; old born between 1960 and 1970; oldest: born before 1960. Notes for SC2: Definition of Size in initial year: Micro if real value of total assets < Sucres 2478 ; Small if Sucres 2478 < Real value of total assets < Sucres 9022; Medium if Sucres 9022 < real value of total assets< Sucres 32868; large if real value of total assets > Sucres 32868. All values at 1982 prices. Definition of age: youngest 15 years old, young born between 15 and 30 years of age; old born between 30 and 50 years of age; oldest: more than 50 years of age.
23
Figure 1. Total Debt/GDP
0.0%
5.0%
10.0%
15.0%
20.0%
25.0%
Source: Banco Central del Ecuador, Información Estadística Mensual, various issues.
Figure 2. Nominal and Real Lending Rates
-60.00
-40.00
-20.00
0.00
20.00
40.00
60.00
80.00
1980
1981
1982
1983
1984
1985
1986
1987
1988
1989
1990
1991
1992
1993
1994
1995
Nominal lending rate Real lending rate
Source: Banco Central del Ecuador, Información Estadística Mensual, various issues.
24
Table 1. Evolution of Aggregate Debt
Year Total debt Short term (< 1 year) Long term (> 1 year) Long term debt % of GDP Growth rate (real) % of GDP Growth rate (real) % of GDP Growth rate (real) Total debt 1980 14.6% - na - na - na1981 15.5% 10.7% na na na na na1982 18.2% 18.7% na na na na na1983 23.1% 23.4% na na na na na1984 21.2% -4.4% 18.5% na 2.7% na 12.6%1985 19.4% -4.7% 16.6% -6.3% 2.8% 6.9% 14.4%1986 18.3% -2.9% 16.1% -0.3% 2.2% -18.9% 12.1%1987 18.2% -6.0% 15.8% -7.0% 2.4% 1.8% 13.3%1988 12.5% -24.3% 10.5% -26.2% 2.0% -11.2% 16.0%1989 10.0% -20.0% 8.2% -22.5% 1.7% -5.4% 17.2%1990 9.1% -5.9% 7.6% -5.3% 1.5% -8.5% 16.8%1991 10.7% 22.9% 9.7% 33.8% 1.0% -31.1% 9.4%1992 10.9% 5.8% 10.0% 7.5% 0.9% -10.8% 7.9%1993 14.4% 35.0% na na na na na 1994 20.4% 47.1% na na na na na1995 25.0% 25.9% na na na na na Source: Source: Banco Central del Ecuador, Información Estadística Mensual, various issues and Superintendencia de Bancos, Memorias, several issues.
25

Table 2. Directed Credit Programs (aggregate figures)
Year Directed credit programs/Total credit
Directed credit programs (real growth rates)
1984 52.7% 1985 35.2% -37.1% 1986 29.0% -15.0% 1987 21.4% -26.3% 1988 27.7% 22.6% 1989 17.9% -41.4% 1990 16.1% -15.4% 1991 12.5% -8.3% 1992 9.2% -26.8%
Source: Superintendencia de Bancos, “Memorias,” several issues. Table 3. Directed Credit Programs (by type of program)
1984 1985 1986 1987 1988 1989 1990 1991 1992 CFN 5,932 11,223 18,236 17,349 30,772 37,089 56,212 81,031 Agriculture. na 764 1,218 2,424 2,940 5,735 3,960 10,423 9,529 Manufacture na 5,036 9,102 14,907 13,541 24,610 32,720 43,028 66,590 Construction na 20 24 Commerce na 109 546 642 646 283 283 733 4,317 Transport. na 23 195 85 35 35 1,727 109 Financial na 43 43 52 3 Services na 82 154 222 67 50 125 110 Others na 61 124 374 BNF 22,971 37,376 42,854 47,549 59,280 87,279 132,546 226,238 366,345 Agriculture 16,061 25,882 32,595 31,456 39,172 59,106 96,732 159,702 261,848 Small industry. 2,641 3,704 3,376 5,880 6,250 9,440 12,731 19,506 28,448 Fishery 599 523 611 1,286 1,303 3,196 2,831 7,241 10,261 Transportation 1,670 4,048 1,216 1,321 1,876 2,275 2,358 4,232 8,388 Tourism 98 323 249 312 242 418 476 1,110 1,176 Commerce 1,902 2,897 4,808 7,294 10,440 12,845 17,418 34,447 56,224 Central Bank 194,304 135,583 129,629 121,032 194,221 230,723 284,326 311,840 215,723 Total 217,276 178,890 183,706 186,817 270,850 348,774 453,961 594,290 663,098 % of CFN n.a 3.3% 6.1% 9.8% 6.4% 8.8% 8.2% 9.5% 12.2% % of BNF 10.6% 20.9% 23.3% 25.5% 21.9% 25.0% 29.2% 38.1% 55.2% % of BCE 89.4% 75.8% 70.6% 64.8% 71.7% 66.2% 62.6% 52.5% 32.5% (BNF+CFN) long term credit
59.3% 70.8% 56.7% 38.0% 35.0% 35.9% 63.4% 78.7%
BCE . short term credit
31.1% 23.3% 16.0% 18.4% 14.3% 12.1% 7.3% 3.3%
Source: Superintendencia de Bancos, Memorias, various issues.
26
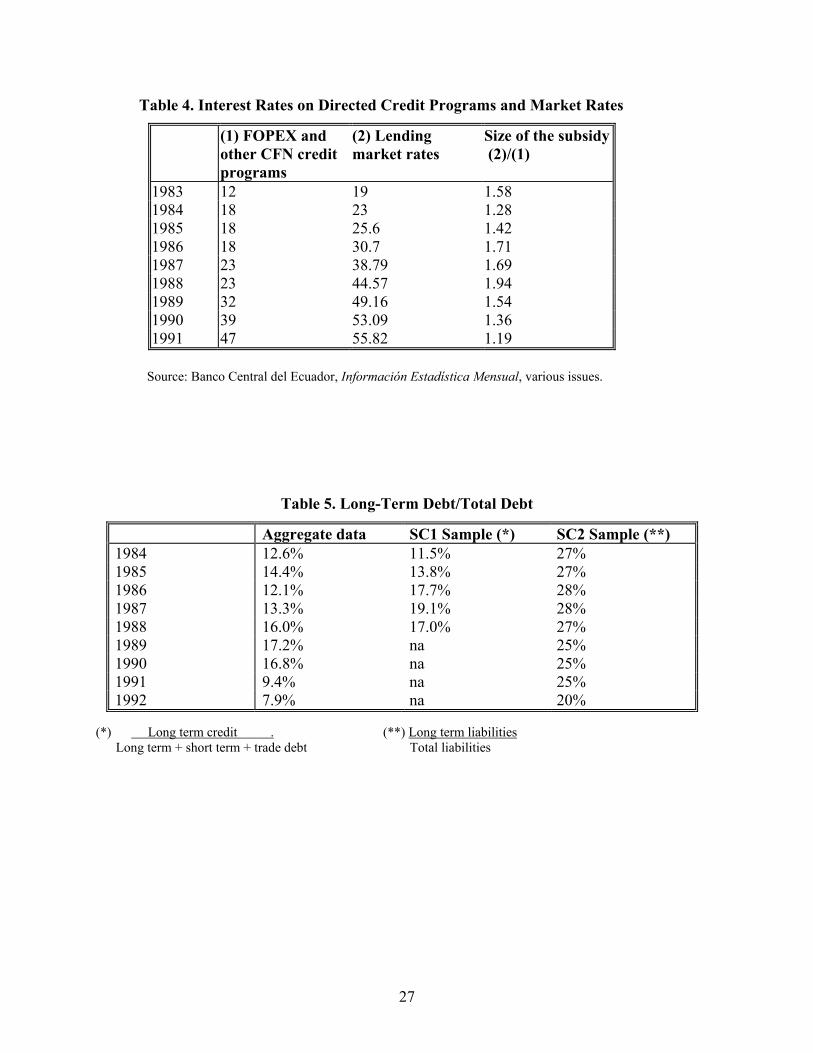
Table 4. Interest Rates on Directed Credit Programs and Market Rates
(1) FOPEX and other CFN credit programs
(2) Lending market rates
Size of the subsidy (2)/(1)
1983 12 19 1.58 1984 18 23 1.28 1985 18 25.6 1.42 1986 18 30.7 1.71 1987 23 38.79 1.69 1988 23 44.57 1.94 1989 32 49.16 1.54 1990 39 53.09 1.36 1991 47 55.82 1.19
Source: Banco Central del Ecuador, Información Estadística Mensual, various issues.
Table 5. Long-Term Debt/Total Debt
Aggregate data SC1 Sample (*) SC2 Sample (**) 1984 12.6% 11.5% 27% 1985 14.4% 13.8% 27% 1986 12.1% 17.7% 28% 1987 13.3% 19.1% 28% 1988 16.0% 17.0% 27% 1989 17.2% na 25% 1990 16.8% na 25% 1991 9.4% na 25% 1992 7.9% na 20%
(*) Long term credit . (**) Long term liabilities Long term + short term + trade debt Total liabilities
27
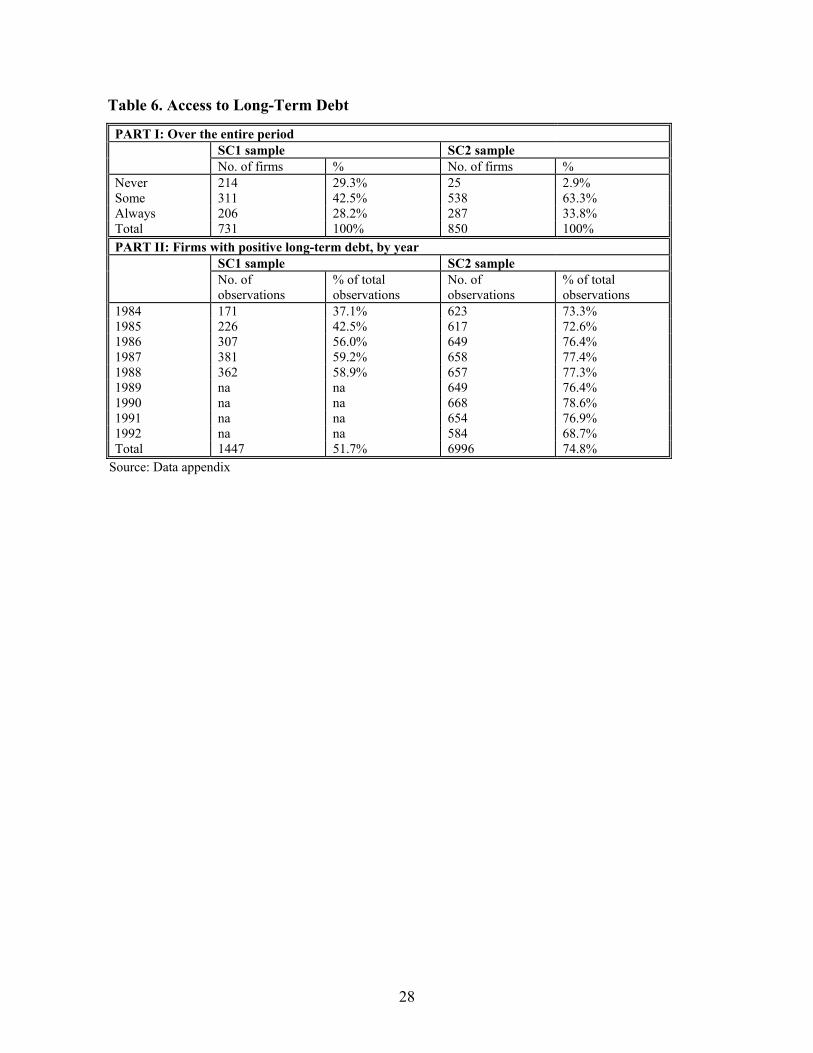
Table 6. Access to Long-Term Debt
PART I: Over the entire period SC1 sample SC2 sample No. of firms % No. of firms % Never 214 29.3% 25 2.9% Some 311 42.5% 538 63.3% Always 206 28.2% 287 33.8% Total 731 100% 850 100% PART II: Firms with positive long-term debt, by year SC1 sample SC2 sample No. of
observations % of total observations
No. of observations
% of total observations
1984 171 37.1% 623 73.3% 1985 226 42.5% 617 72.6% 1986 307 56.0% 649 76.4% 1987 381 59.2% 658 77.4% 1988 362 58.9% 657 77.3% 1989 na na 649 76.4% 1990 na na 668 78.6% 1991 na na 654 76.9% 1992 na na 584 68.7% Total 1447 51.7% 6996 74.8%
Source: Data appendix
28
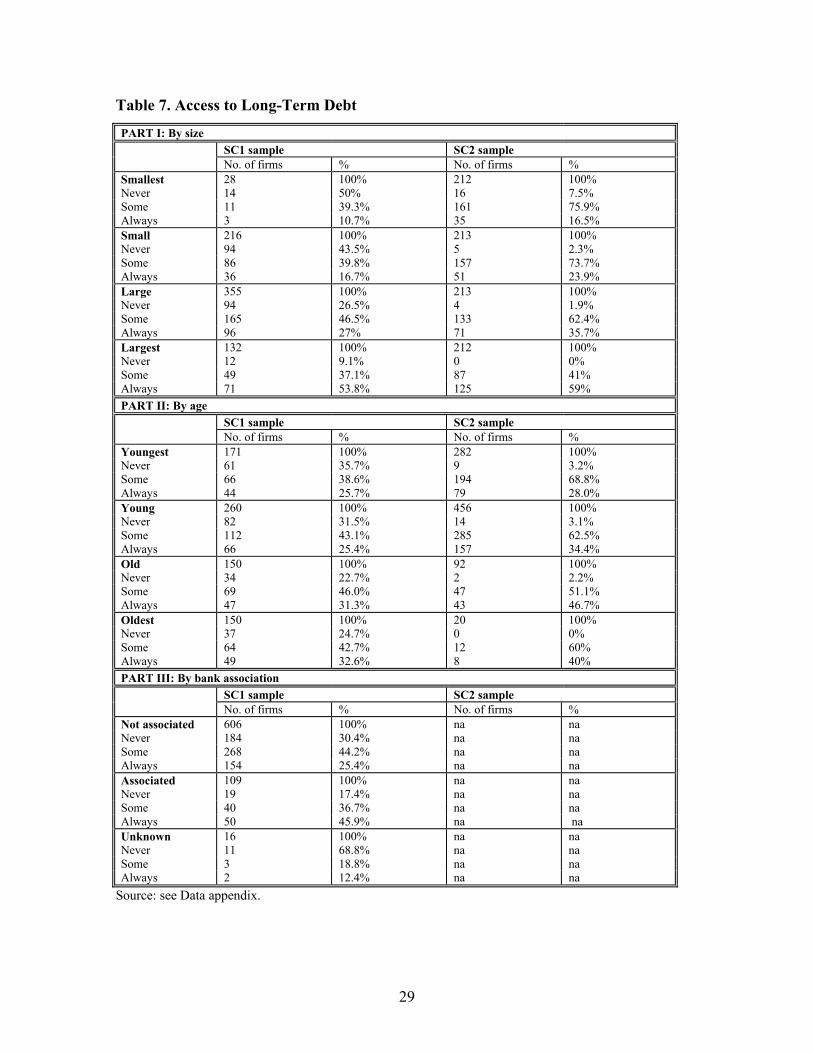
Table 7. Access to Long-Term Debt
PART I: By size SC1 sample SC2 sample No. of firms % No. of firms % Smallest 28 100% 212 100% Never 14 50% 16 7.5% Some 11 39.3% 161 75.9% Always 3 10.7% 35 16.5% Small 216 100% 213 100% Never 94 43.5% 5 2.3% Some 86 39.8% 157 73.7% Always 36 16.7% 51 23.9% Large 355 100% 213 100% Never 94 26.5% 4 1.9% Some 165 46.5% 133 62.4% Always 96 27% 71 35.7% Largest 132 100% 212 100% Never 12 9.1% 0 0% Some 49 37.1% 87 41% Always 71 53.8% 125 59% PART II: By age SC1 sample SC2 sample No. of firms % No. of firms % Youngest 171 100% 282 100% Never 61 35.7% 9 3.2% Some 66 38.6% 194 68.8% Always 44 25.7% 79 28.0% Young 260 100% 456 100% Never 82 31.5% 14 3.1% Some 112 43.1% 285 62.5% Always 66 25.4% 157 34.4% Old 150 100% 92 100% Never 34 22.7% 2 2.2% Some 69 46.0% 47 51.1% Always 47 31.3% 43 46.7% Oldest 150 100% 20 100% Never 37 24.7% 0 0% Some 64 42.7% 12 60% Always 49 32.6% 8 40% PART III: By bank association SC1 sample SC2 sample No. of firms % No. of firms % Not associated 606 100% na na Never 184 30.4% na na Some 268 44.2% na na Always 154 25.4% na na Associated 109 100% na na Never 19 17.4% na na Some 40 36.7% na na Always 50 45.9% na na Unknown 16 100% na na Never 11 68.8% na na Some 3 18.8% na na Always 2 12.4% na na
Source: see Data appendix.
29
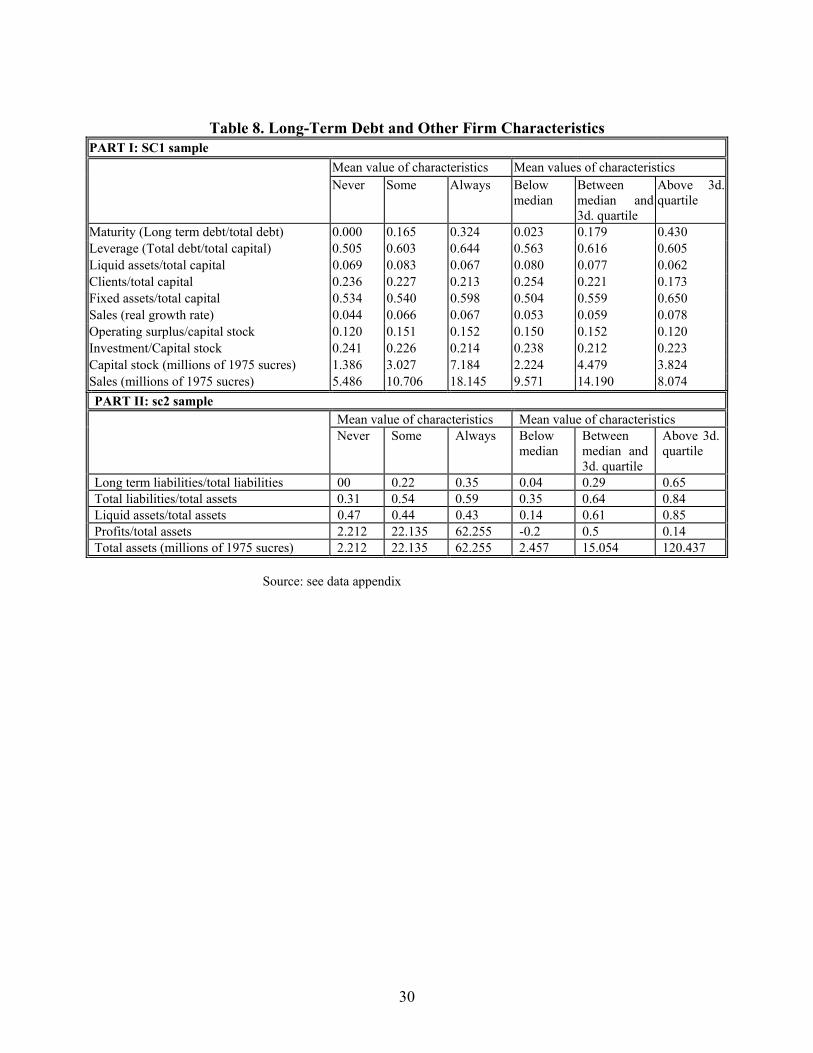
Table 8. Long-Term Debt and Other Firm Characteristics PART I: SC1 sample Mean value of characteristics Mean values of characteristics Never Some Always Below
median Between median and 3d. quartile
Above 3d. quartile
Maturity (Long term debt/total debt) 0.000 0.165 0.324 0.023 0.179 0.430 Leverage (Total debt/total capital) 0.505 0.603 0.644 0.563 0.616 0.605 Liquid assets/total capital 0.069 0.083 0.067 0.080 0.077 0.062 Clients/total capital 0.236 0.227 0.213 0.254 0.221 0.173 Fixed assets/total capital 0.534 0.540 0.598 0.504 0.559 0.650 Sales (real growth rate) 0.044 0.066 0.067 0.053 0.059 0.078 Operating surplus/capital stock 0.120 0.151 0.152 0.150 0.152 0.120 Investment/Capital stock 0.241 0.226 0.214 0.238 0.212 0.223 Capital stock (millions of 1975 sucres) 1.386 3.027 7.184 2.224 4.479 3.824 Sales (millions of 1975 sucres) 5.486 10.706 18.145 9.571 14.190 8.074 PART II: sc2 sample Mean value of characteristics Mean value of characteristics Never Some Always Below
median Between median and 3d. quartile
Above 3d. quartile
Long term liabilities/total liabilities 00 0.22 0.35 0.04 0.29 0.65 Total liabilities/total assets 0.31 0.54 0.59 0.35 0.64 0.84 Liquid assets/total assets 0.47 0.44 0.43 0.14 0.61 0.85 Profits/total assets 2.212 22.135 62.255 -0.2 0.5 0.14 Total assets (millions of 1975 sucres) 2.212 22.135 62.255 2.457 15.054 120.437 Source: see data appendix
30
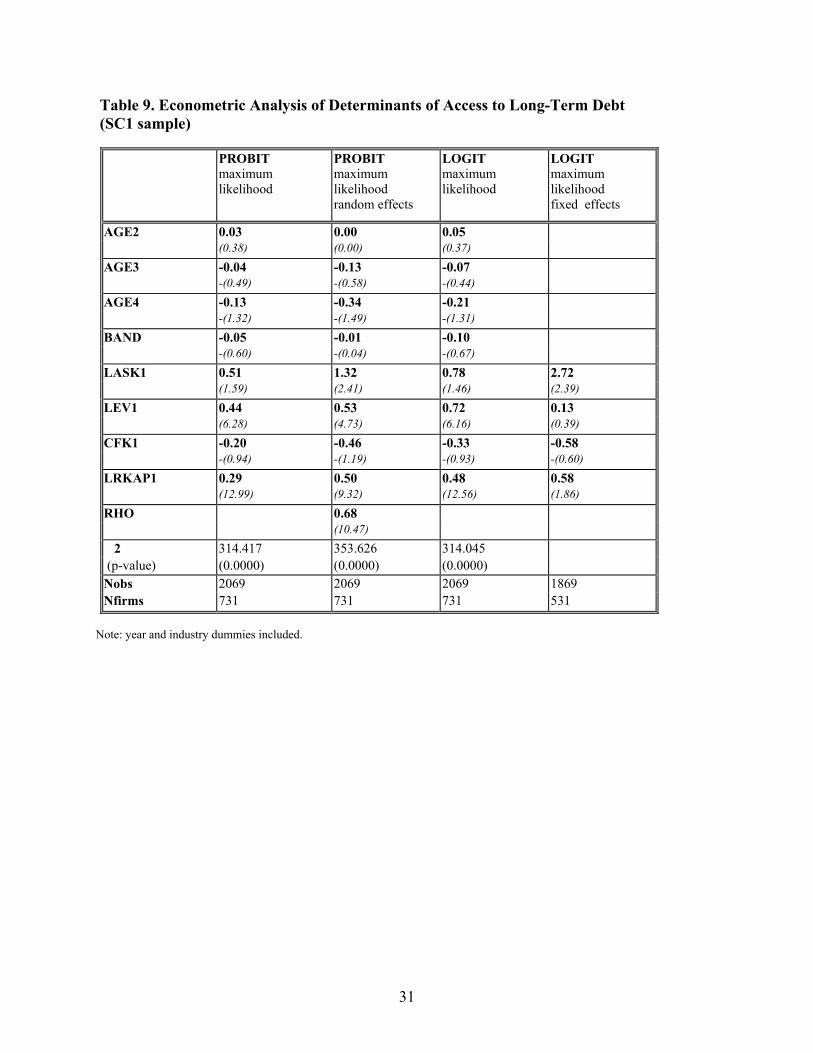
Table 9. Econometric Analysis of Determinants of Access to Long-Term Debt (SC1 sample)
PROBIT maximum likelihood
PROBIT maximum likelihood random effects
LOGIT maximum likelihood
LOGIT maximum likelihood fixed effects
AGE2 0.03 0.00 0.05 (0.38) (0.00) (0.37) AGE3 -0.04 -0.13 -0.07 -(0.49) -(0.58) -(0.44) AGE4 -0.13 -0.34 -0.21 -(1.32) -(1.49) -(1.31) BAND -0.05 -0.01 -0.10 -(0.60) -(0.04) -(0.67) LASK1 0.51 1.32 0.78 2.72 (1.59) (2.41) (1.46) (2.39) LEV1 0.44 0.53 0.72 0.13 (6.28) (4.73) (6.16) (0.39) CFK1 -0.20 -0.46 -0.33 -0.58 -(0.94) -(1.19) -(0.93) -(0.60) LRKAP1 0.29 0.50 0.48 0.58 (12.99) (9.32) (12.56) (1.86) RHO 0.68 (10.47) �2 314.417 353.626 314.045 (p-value) (0.0000) (0.0000) (0.0000) Nobs 2069 2069 2069 1869 Nfirms 731 731 731 531
Note: year and industry dummies included.
31
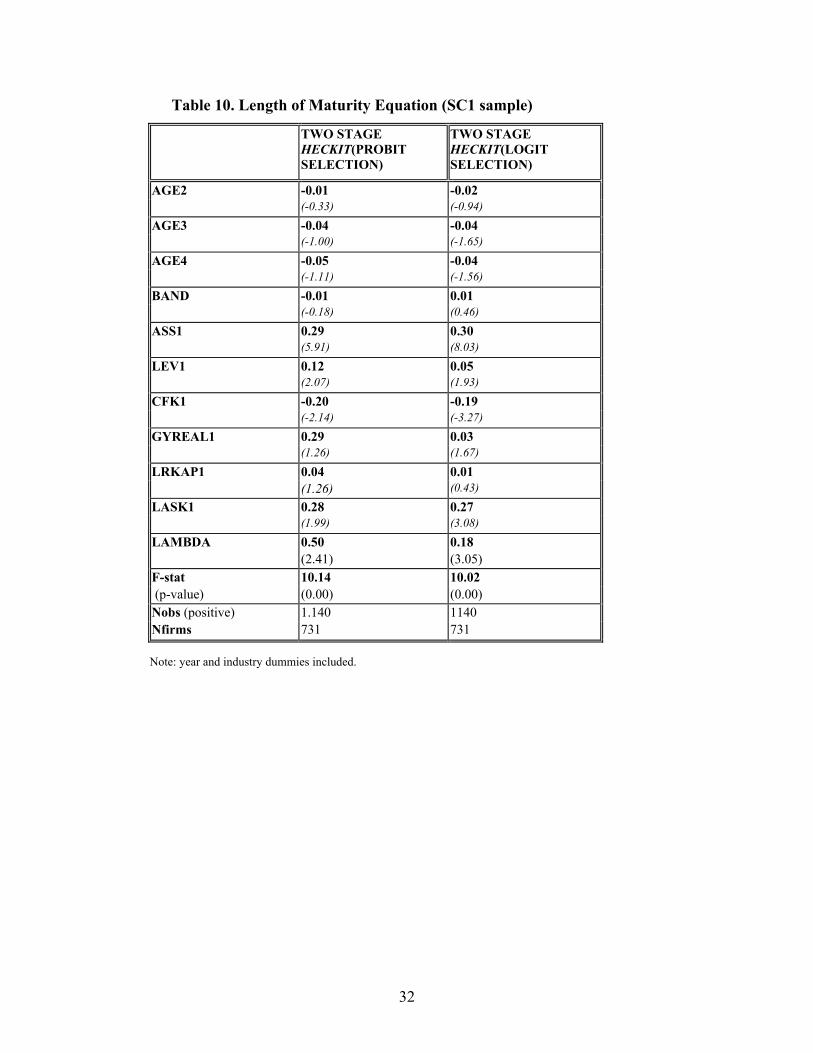
Table 10. Length of Maturity Equation (SC1 sample)
TWO STAGE HECKIT(PROBIT SELECTION)
TWO STAGE HECKIT(LOGIT SELECTION)
AGE2 -0.01 -0.02 (-0.33) (-0.94) AGE3 -0.04 -0.04 (-1.00) (-1.65) AGE4 -0.05 -0.04 (-1.11) (-1.56) BAND -0.01 0.01 (-0.18) (0.46) ASS1 0.29 0.30 (5.91) (8.03) LEV1 0.12 0.05 (2.07) (1.93) CFK1 -0.20 -0.19 (-2.14) (-3.27) GYREAL1 0.29 0.03 (1.26) (1.67) LRKAP1 0.04 0.01 (1.26) (0.43) LASK1 0.28 0.27 (1.99) (3.08) LAMBDA 0.50 0.18 (2.41) (3.05) F-stat 10.14 10.02 (p-value) (0.00) (0.00) Nobs (positive) 1.140 1140 Nfirms 731 731
Note: year and industry dummies included.
32
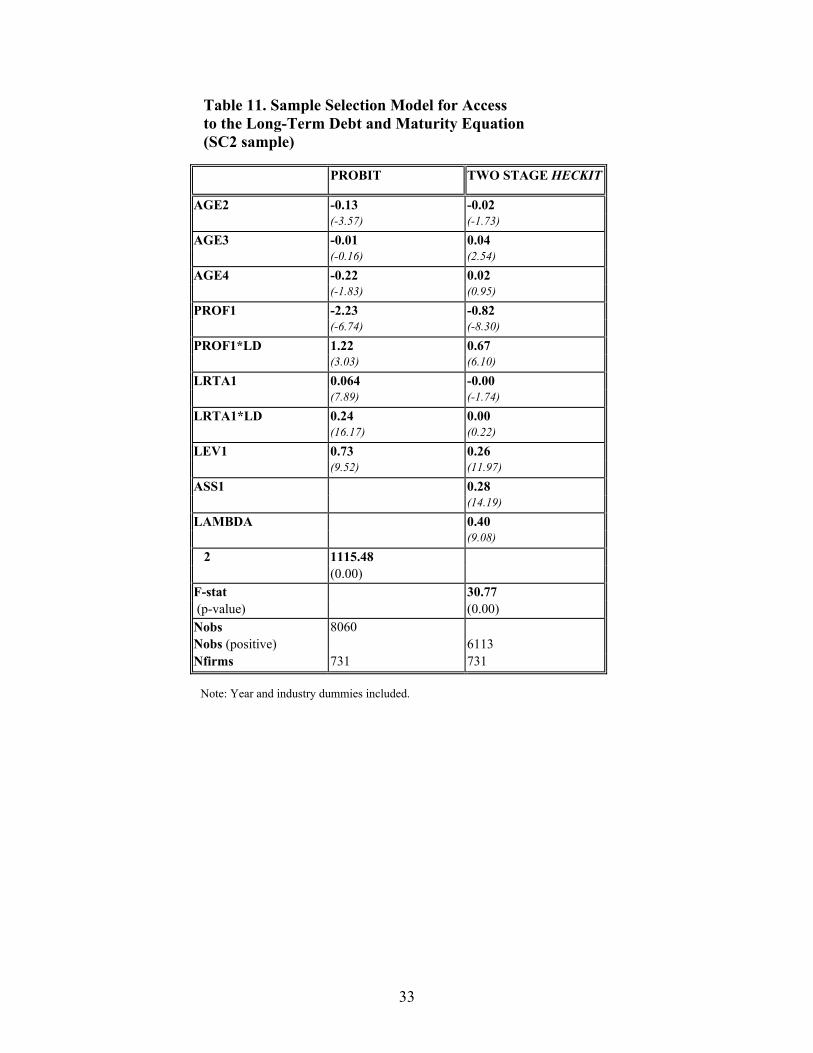
Table 11. Sample Selection Model for Access to the Long-Term Debt and Maturity Equation
(SC2 sample)
PROBIT TWO STAGE HECKIT
AGE2 -0.13 -0.02 (-3.57) (-1.73) AGE3 -0.01 0.04 (-0.16) (2.54) AGE4 -0.22 0.02 (-1.83) (0.95) PROF1 -2.23 -0.82 (-6.74) (-8.30) PROF1*LD 1.22 0.67 (3.03) (6.10) LRTA1 0.064 -0.00 (7.89) (-1.74) LRTA1*LD 0.24 0.00 (16.17) (0.22) LEV1 0.73 0.26 (9.52) (11.97) ASS1 0.28 (14.19) LAMBDA 0.40 (9.08) �2 1115.48 (0.00) F-stat 30.77 (p-value) (0.00) Nobs 8060 Nobs (positive) 6113 Nfirms 731 731
Note: Year and industry dummies included.
33
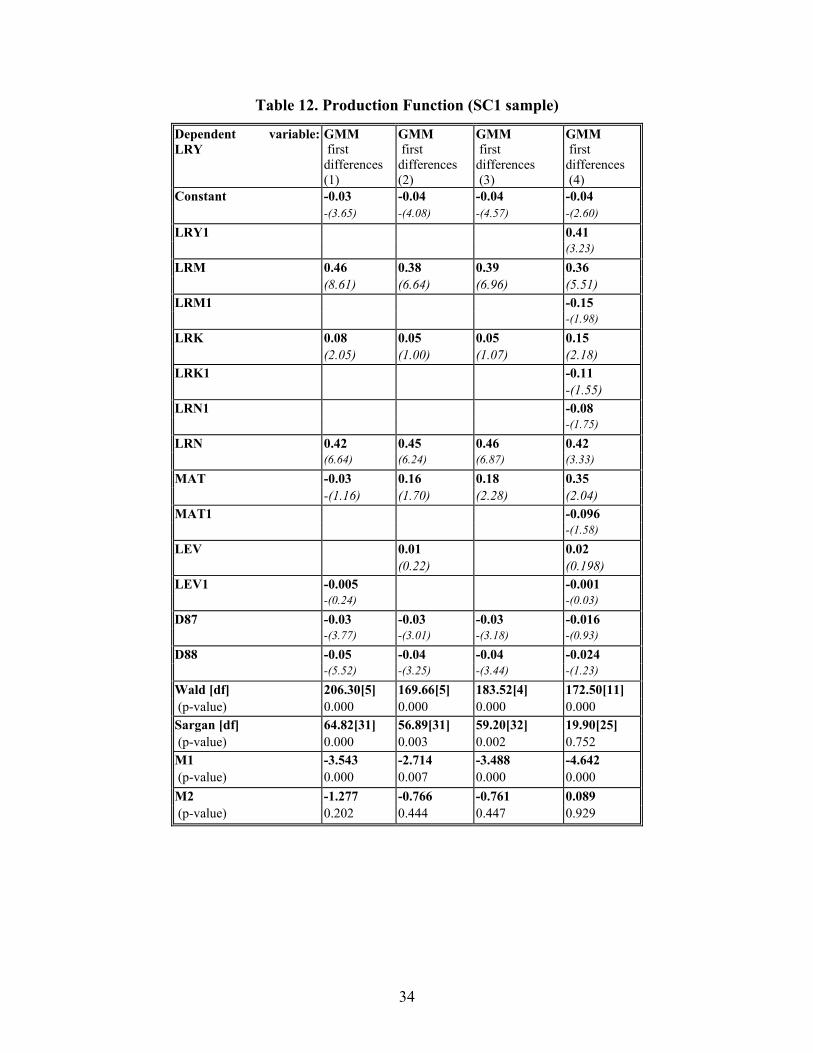
Table 12. Production Function (SC1 sample)
Dependent variable: LRY
GMM first differences (1)
GMM first differences (2)
GMM first differences (3)
GMM first differences (4)
Constant -0.03 -0.04 -0.04 -0.04 -(3.65) -(4.08) -(4.57) -(2.60) LRY1 0.41 (3.23) LRM 0.46 0.38 0.39 0.36 (8.61) (6.64) (6.96) (5.51) LRM1 -0.15 -(1.98) LRK 0.08 0.05 0.05 0.15 (2.05) (1.00) (1.07) (2.18) LRK1 -0.11 -(1.55) LRN1 -0.08 -(1.75) LRN 0.42 0.45 0.46 0.42 (6.64) (6.24) (6.87) (3.33) MAT -0.03 0.16 0.18 0.35 -(1.16) (1.70) (2.28) (2.04) MAT1 -0.096 -(1.58) LEV 0.01 0.02 (0.22) (0.198) LEV1 -0.005 -0.001 -(0.24) -(0.03) D87 -0.03 -0.03 -0.03 -0.016 -(3.77) -(3.01) -(3.18) -(0.93) D88 -0.05 -0.04 -0.04 -0.024 -(5.52) -(3.25) -(3.44) -(1.23) Wald [df] 206.30[5] 169.66[5] 183.52[4] 172.50[11] (p-value) 0.000 0.000 0.000 0.000 Sargan [df] 64.82[31] 56.89[31] 59.20[32] 19.90[25] (p-value) 0.000 0.003 0.002 0.752 M1 -3.543 -2.714 -3.488 -4.642 (p-value) 0.000 0.007 0.000 0.000 M2 -1.277 -0.766 -0.761 0.089 (p-value) 0.202 0.444 0.447 0.929
34
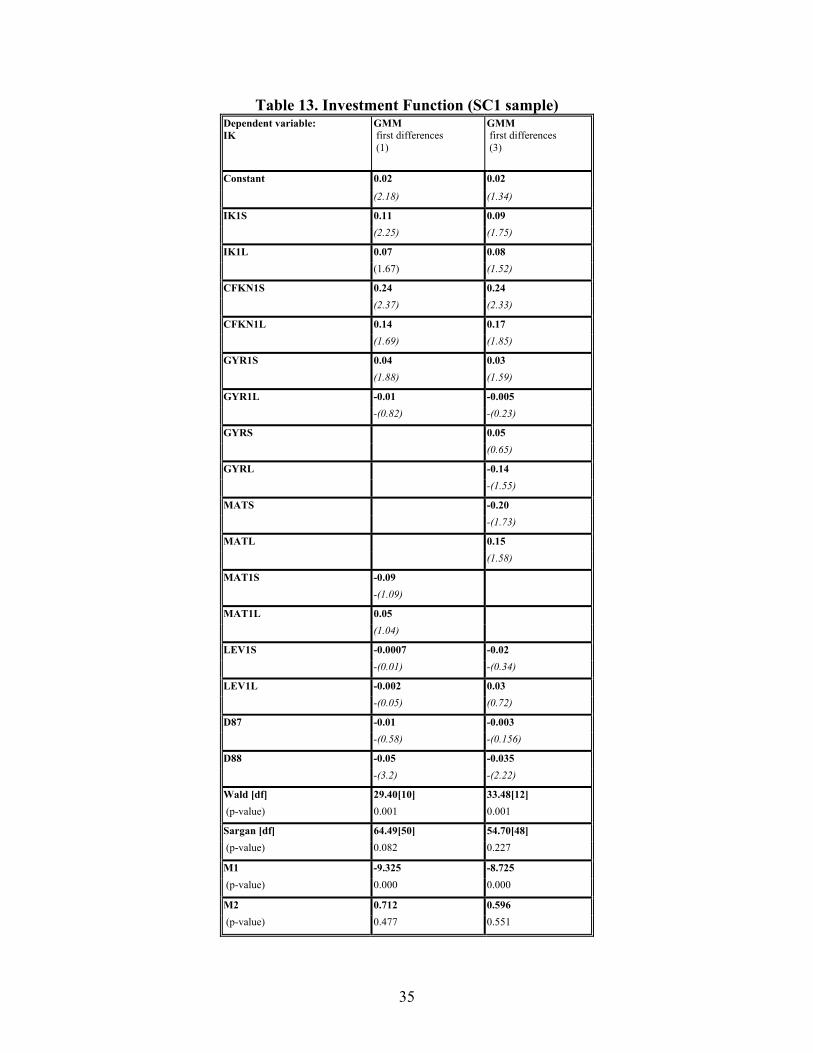
Table 13. Investment Function (SC1 sample) Dependent variable: IK
GMM first differences (1)
GMM first differences (3)
Constant 0.02 0.02
(2.18) (1.34)
IK1S 0.11 0.09 (2.25) (1.75)
IK1L 0.07 0.08 (1.67) (1.52)
CFKN1S 0.24 0.24 (2.37) (2.33)
CFKN1L 0.14 0.17 (1.69) (1.85)
GYR1S 0.04 0.03 (1.88) (1.59)
GYR1L -0.01 -0.005 -(0.82) -(0.23)
GYRS 0.05 (0.65)
GYRL -0.14 -(1.55)
MATS -0.20 -(1.73)
MATL 0.15 (1.58)
MAT1S -0.09 -(1.09)
MAT1L 0.05 (1.04)
LEV1S -0.0007 -0.02 -(0.01) -(0.34)
LEV1L -0.002 0.03 -(0.05) (0.72)
D87 -0.01 -0.003 -(0.58) -(0.156)
D88 -0.05 -0.035 -(3.2) -(2.22)
Wald [df] 29.40[10] 33.48[12] (p-value) 0.001 0.001
Sargan [df] 64.49[50] 54.70[48] (p-value) 0.082 0.227
M1 -9.325 -8.725 (p-value) 0.000 0.000
M2 0.712 0.596 (p-value) 0.477 0.551
35