Embed Size (px)
Citation preview
1
Access to Post-Secondary Education:
How does Québec Compare to the Rest of Canada?
Ross Finnie
Graduate School of Public and International Affairs, University of Ottawa
Education Policy Research Initiative, University of Ottawa
Richard E. Mueller
Department of Economics, University of Lethbridge
Education Policy Research Initiative, University of Ottawa
August 2016
Abstract
This research uses the Youth in Transition Survey, Reading Cohort (“YITS-A”) to
analyse access to post-secondary education (PSE) in Québec in comparison to other Canadian
provinces and regions. We begin by presenting access rates by region and show that university
participation rates in Québec are relatively low, while college rates are high in comparison to
other provinces, although these differences are presumably due in part to the cégep system in
Québec. We then undertake an econometric analysis which reveals that the effects of parental
education on access to PSE are much stronger than the effects of family income, and are
relatively uniform across the country. The substantially weaker family income effects (stronger
for females than males) figure most importantly for the Atlantic Provinces, but much less
elsewhere, including in Québec. We also find that the relationships between test scores from
the Programme for International Student Assessment (PISA), which measures academic
‘performance’ and ‘ability’ and even more so high school grades differ by province, and are
generally strongest in Ontario and weakest in Québec, again perhaps in part due to the cégep
2
system which represents a mediating influence between high school performance and university
attendance, in particular. Males are much less likely to attend university across the country, but
this gap is widest in Quebec. Our analysis of traditionally under-represented and minority
groups points to students from rural Québec actually being at no disadvantage in terms of PSE
participation, second-generation immigrants doing especially well in comparison to other
provinces, but more recent first-generation immigrants not faring nearly so well in Québec.
Finally, young Québecers who do not go on to PSE (especially the Francophone majority) are
much more likely than other Canadian youths to say that they simply have no aspirations to
attend PSE, and to otherwise say they face no barriers to attending PSE. Policy implications are
discussed using a fiscal lens.
Résumé
Cette recherche utilise l'Enquête auprès des jeunes en transition pour la cohorte lecture
(« EJET-A ») afin de comparer le taux de participation aux études postsecondaire (EPS) au
Québec à d'autres régions du Canada. En premier lieu, nous présentons les taux d'accès par
région et nous découvrons rapidement qu’il y a plusieurs différences importantes, notamment le
fait que les taux de participation aux études universitaires au Québec sont faibles, tandis que
les taux de participation aux études collégiales sont relativement élevés par rapport aux autres
provinces. Par la suite, nous complétons une analyse économétrique qui révèle que le revenu
parental à un effet important sur la participation aux EPS dans les provinces de l'Atlantique, par
contre semble avoir un effet beaucoup plus faible ailleurs, y compris au Québec. En revanche,
nous déterminons que le niveau d’éducation des parents à un effet puissant et uniforme sur la
participation aux EPS dans l’ensemble du pays. Nous constatons également que la relation
entre les notes du secondaire et les résultats aux tests du programme international pour le suivi
des acquis des élèves (PISA), qui mesure les connaissances académiques et les compétences
des élèves, diffère selon la région et est généralement la plus forte en Ontario et la plus faible
au Québec. Ainsi, le Québec semble avoir un système qui est relativement moins
« méritocratique » que l'Ontario, par exemple, puisque les connaissances et compétences (tel
que mesurées par PISA) sont des déterminants moins importants de la participation aux études
universitaires. Nous constatons également que certains groupes sous-représentés ne performe
pas aussi bien au Québec, cependant certains, tels que ceux provenant de zones rurales et les
immigrants de deuxième génération, performent mieux au Québec en ce qui attrait à la
3
participation aux études universitaires. Les jeunes Québécois sont beaucoup plus susceptibles
que les autres jeunes Canadiens à dire qu’ils n’ont pas d'aspirations à des études
postsecondaires, et ce particulièrement pour la majorité francophone dans de la province. En
somme, ces résultats pourraient être attribués à la présence de cégeps dans la province, propre
au système d’éducation québécois, ou à d'autres facteurs culturels qui n’ont pas encore été
découverts. Ces deux hypothèses, par contre, devront être explorées dans le cadre de
recherches futures.
Acknowledgements
This paper draws heavily on the previous work of the authors and their coauthors; in
particular Finnie, Childs and Wismer (2011a, 2011b), Finnie, Mueller and Sweetman (2014,
2016), and Finnie, Mueller and Wismer (2015). We would like to thank Stephen Childs, Michael
Dubois, and John Sergeant for their efforts on this paper, as well as an anonymous referee for
comments which have strengthened the final product. Finally, we are grateful to the editors for
including us in this project.
4
Access to Post-Secondary Education:
How does Québec Compare to the Rest of Canada?
I. Introduction
Research on access to post-secondary education (PSE) in Canada has made many
important discoveries in recent years, not the least of which is that access appears to be more
strongly related to parental education and other sociocultural factors than to family income and
other financial factors. Our own work, along with that of others, has also discovered that
academic preparation for PSE, as represented by high school grades and Programme for
International Student Assessment (PISA) test scores (which measure math, science, and
reading/writing when students are 15 years of age), is another important predictor of who will go
to college or university. These various influences are interconnected, rooted in the family and
start early in a young person’s life – certainly well before the final years of high school when
young people make their PSE choices. All this helps inform our understanding of PSE in
important ways, including from a policy perspective.1
In this paper we dig into these relationships at the provincial and regional level. This
should further enhance our understanding of these relationships, and help inform policy
formation in this area, with education largely falling under provincial jurisdiction.
We do this by using the wealth of information contained in the Youth in Transition
Survey, Cohort A (YITS-A) to present empirical evidence on access to PSE for Québec in
comparison to other provinces in Canada. We begin by looking at PSE access rates by
province, and then then carry out an econometric analysis of the determinants of access. We
then extend our analysis to focus on a set of traditionally under-represented and minority groups
such as those from low-income households, first-generation students, and those from single
parent households. We conclude the empirical analysis by presenting evidence on the self-
identified barriers to PSE for those who do not attend.
We find that by age 21, 70.3 percent of the Québecers in our sample have attended
1 See Finnie, Sweetman and Usher (2008) for a recent review, as well as various other papers in
Finnie, Mueller, Sweetman, and Usher (2008) and Finnie, Frenette, Mueller, and Sweetman (2010). See
also Mueller (2008a, 2008b) for a general literature review of the access literature.
5
some kind of PSE – either college or university. This is the second lowest rate in the country,
with only Western Canada lagging behind at 68.9 percent. Ontario leads the pack at 81.9
percent, with Atlantic Canada in second position at 75.7 percent.
Québec also lags the country in university participation rates specifically, at 30.3
percent, much lower than the 42.8 percent in Western Canada, the region with second lowest
participation rate. The Atlantic Provinces and Ontario have rates of 51.1 percent and 45.5
percent, respectively. While Québec’s university participation rate seems low, this may be due
at least in part to the cégep system that students enter after high school and before starting
university, which may delay some students’ ultimate university attendance.
Conversely, Québec leads the country in college participation at 40 percent, again
undoubtedly due in part to the cégep system. Ontario follows with a more conventionally defined
college participation rate of 36.4 percent.
In our regression analysis, we find that the effect of parental income on access to
university (once the other factors included in the models are taken into account) is very small in
almost all provinces, including Québec, with it mattering only in Atlantic Canada. That said,
when the models are estimated separately for females and males, it emerges that family income
matters more for females than males, including smallish effects for Québec.
Parental education is, in contrast, a much stronger determinant of university attendance,
and – interestingly – its effect is fairly uniform across the country, slightly higher for males than
females.
We also discover that the effects of high school grades and PISA test scores (roughly
interpretable as measures of academic performance and ability) on access to PSE are
considerably smaller in Québec than in other provinces, especially in the case of grades, once
again probably at least in part due to the cégep system, which presumably mediates some of
the high school influences with its own effects (such as performance while in cégep –
unfortunately not measured in our data). Within that general pattern, we find that high school
grades for Québec males are not only a much less important determinant of university access
compared to other provinces, but are also less important than for females in Québec.
Females attend university at much higher rates than males in all provinces, but nowhere
is this gap greater than in Quebec.
Our results for the under-represented and minority groups (URMGs) considered in the
analysis point to students from rural Québec actually being at no disadvantage in terms of PSE
participation (unlike other provinces), second-generation immigrants doing especially well in
6
comparison to those in other provinces, but more recent first-generation immigrants not faring
nearly so well in Québec. Other results are more or less in line with their effects in other
provinces.
Finally, young Québecers who do not go on to PSE (especially the Francophone
majority) are much more likely than other Canadian youths to say that they simply have no
aspirations to attend PSE, and otherwise say they face no barriers to attending PSE.
Taken together, these results identify substantial differences by province in the
determinants of who goes to university (in particular), and the barriers to PSE for those who do
not attend. Policy implications are discussed through a fiscal lens.
The paper is laid out as follows. The following section discusses the methodology and
data used in the analysis. Section III shows the proportion of students that attend university and
college, while Section IV reports the results of our multivariate analysis of the determinants of
access to PSE by province and access among historically under-represented groups, and
reports the barriers students say prevented them from attending. The final section discusses the
results and their related policy implications.
II. Methodology and Data
The Econometric Model
We use a multinomial logit model to estimate access to PSE, differentiating access to
college – including trade schools and cégep, access to university, or no PSE. For our main
estimates, the model may be expressed as follows:
Y = f(X1, X2)
Where Y represents the access outcomes of interest (i.e., no PSE, college, university), X1
represents a set of control variables including family type, an indicator of rural residence and so
on, and X2 are the key covariates that influence Y, including family income, parental education,
overall high school grades and PISA reading scores. The model is estimated separately for four
regions in Canada: Québec, Ontario, Atlantic Canada, and Western Canada.
This multinomial logit approach has been used previously in Finnie and Mueller (2008a,
2008b, 2009, and 2010) and in other studies, and treats the particular level of PSE as a jointly
7
determined process, along with the decision to go to PSE. We believe this model represents
both the conceptually and econometrically correct treatment (which various tests have further
verified).2 Furthermore, after the appropriate transformations, this model yields easily
interpretable estimates, which provide a full perspective of the effects of the explanatory
variables on access to college, access to university, and the net effects on the two PSE
outcomes relative to non-attendance.
The YITS Data, Sample Selection, and Definitions
The data used in the analysis are taken from the Youth in Transition Survey, Cohort A
(generally known as YITS-A). The YITS-A is highly suitable for our purposes since it follows all
young people born in 1984 (and thus age 15 as of December 31, 1999) through their high
school years and through to the decision to enter PSE. The YITS-A is rich in background data
and other important determinants of access to PSE. The provincial sampling structure of the
YITS-A further provides for representative samples at this level and adequate sample sizes for
carrying out analysis by province (or region).
The YITS-A data used here consist of four cycles, corresponding to the surveys and
interviews undertaken in 2000, 2002, 2004, and 2006. The first cycle (in 2000) includes not only
questionnaires that were completed by the 15-year-old student respondents, but also interviews
that were completed with their parents and high school officials. The YITS-A also contains the
youths’ Programme for International Student Assessment (PISA) test scores in the areas of
reading, mathematics, and science.
Follow-up telephone surveys were carried out with respondents (but not parents or
school officials) in 2002, 2004, 2006, 2008, and 2010.
We chose to use the respondents’ PSE status in the 2006 (Cycle 4) survey as the
optimal compromise between the ability to identify participation in PSE (which increases with
age) and sample size (decreasing over time).3 In this wave of the survey, the young people were
2 We have, for example, tested our model against other models such as an ordered
probit model and found that the multinomial logit is indeed appropriate.
3 An analysis carried out by the MESA Project indicates that the attrition from the YITS-A does
not appear to be a problem, at least for the analysis of access to PSE, since the sample weights appear
8
21 years of age, a point at which most had made their initial choices about entering PSE, which
is the basis of our analysis.4
The dependent variable in our study represents whether the individual ever enrolled in
college, enrolled in university, or did not enroll in either, at any point over the first four cycles of
YITS-A, regardless of whether or not they continued in their studies. This represents the
standard definition of access to PSE used in the literature. Continuing on to graduation and
other aspects of “persistence” are normally thought of as being a separate process and are
therefore outside the scope of this paper.
All results shown below were generated using the weights constructed by Statistics
Canada for the YITS-A, which are designed so that the samples, and any analysis based on
them, would reflect the underlying population of youth born in 1984 and thus age 15 and living in
Canada in December 1999.
III. University and College Participation Rates
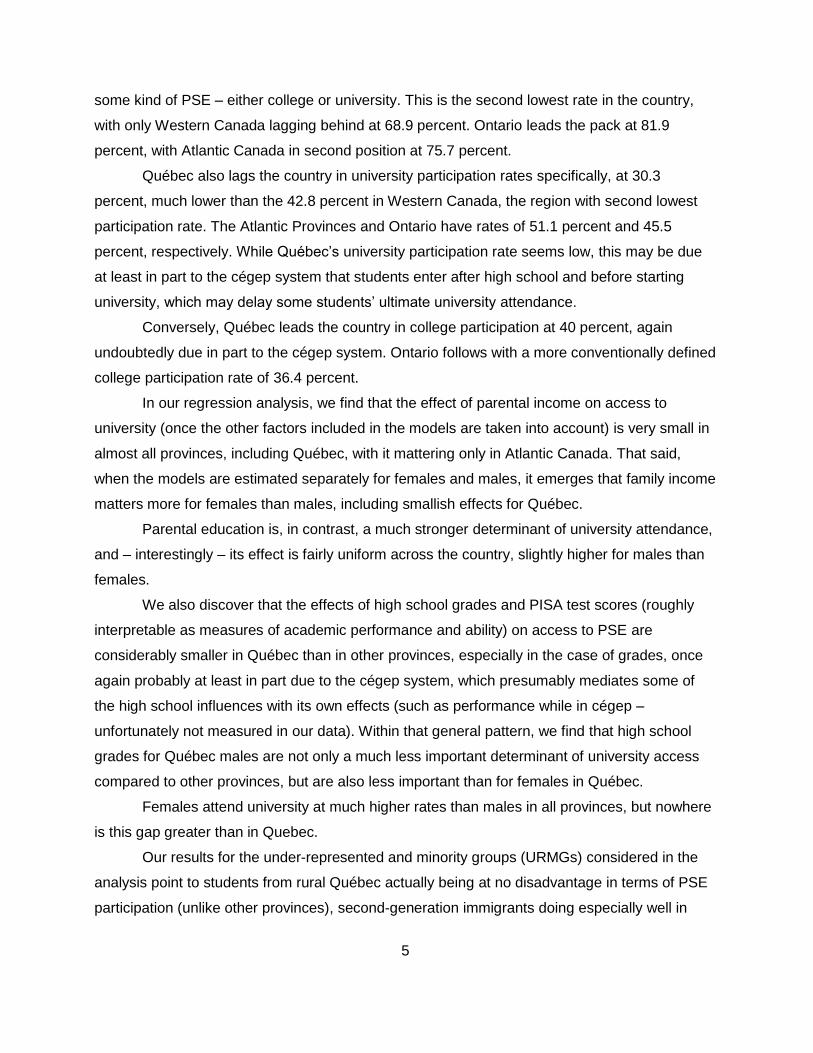
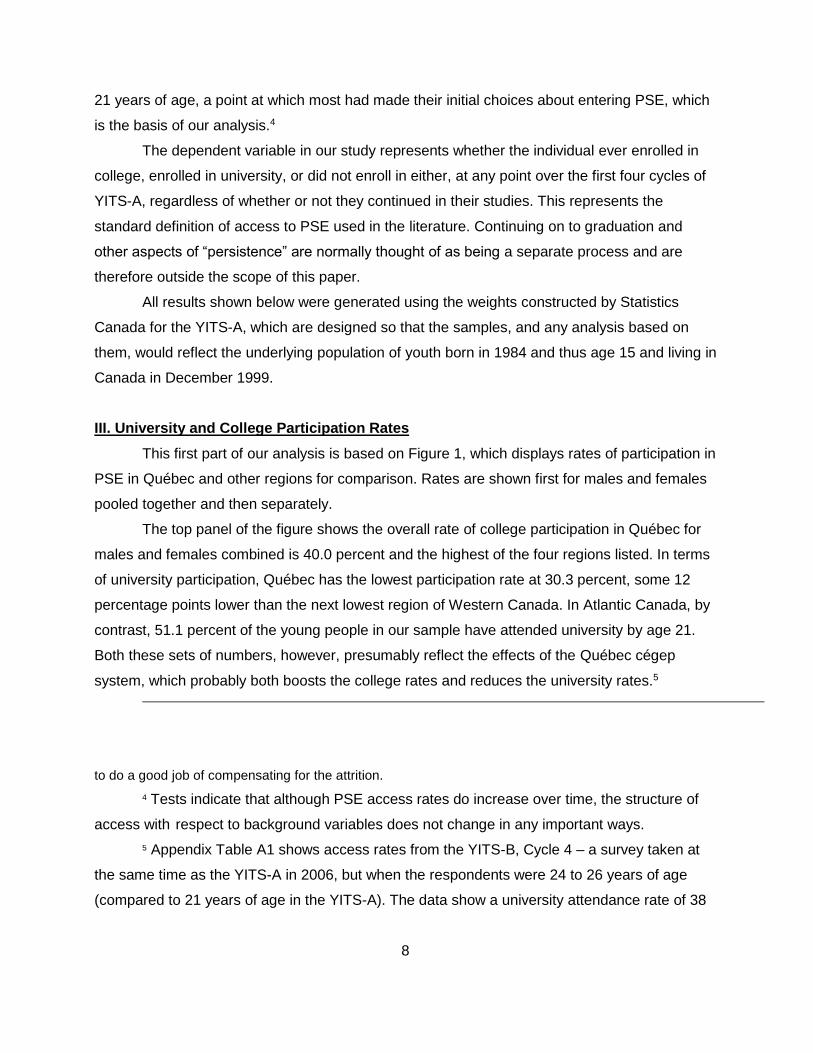
This first part of our analysis is based on Figure 1, which displays rates of participation in
PSE in Québec and other regions for comparison. Rates are shown first for males and females
pooled together and then separately.
The top panel of the figure shows the overall rate of college participation in Québec for
males and females combined is 40.0 percent and the highest of the four regions listed. In terms
of university participation, Québec has the lowest participation rate at 30.3 percent, some 12
percentage points lower than the next lowest region of Western Canada. In Atlantic Canada, by
contrast, 51.1 percent of the young people in our sample have attended university by age 21.
Both these sets of numbers, however, presumably reflect the effects of the Québec cégep
system, which probably both boosts the college rates and reduces the university rates.5
to do a good job of compensating for the attrition.
4 Tests indicate that although PSE access rates do increase over time, the structure of
access with respect to background variables does not change in any important ways.
5 Appendix Table A1 shows access rates from the YITS-B, Cycle 4 – a survey taken at
the same time as the YITS-A in 2006, but when the respondents were 24 to 26 years of age
(compared to 21 years of age in the YITS-A). The data show a university attendance rate of 38
9
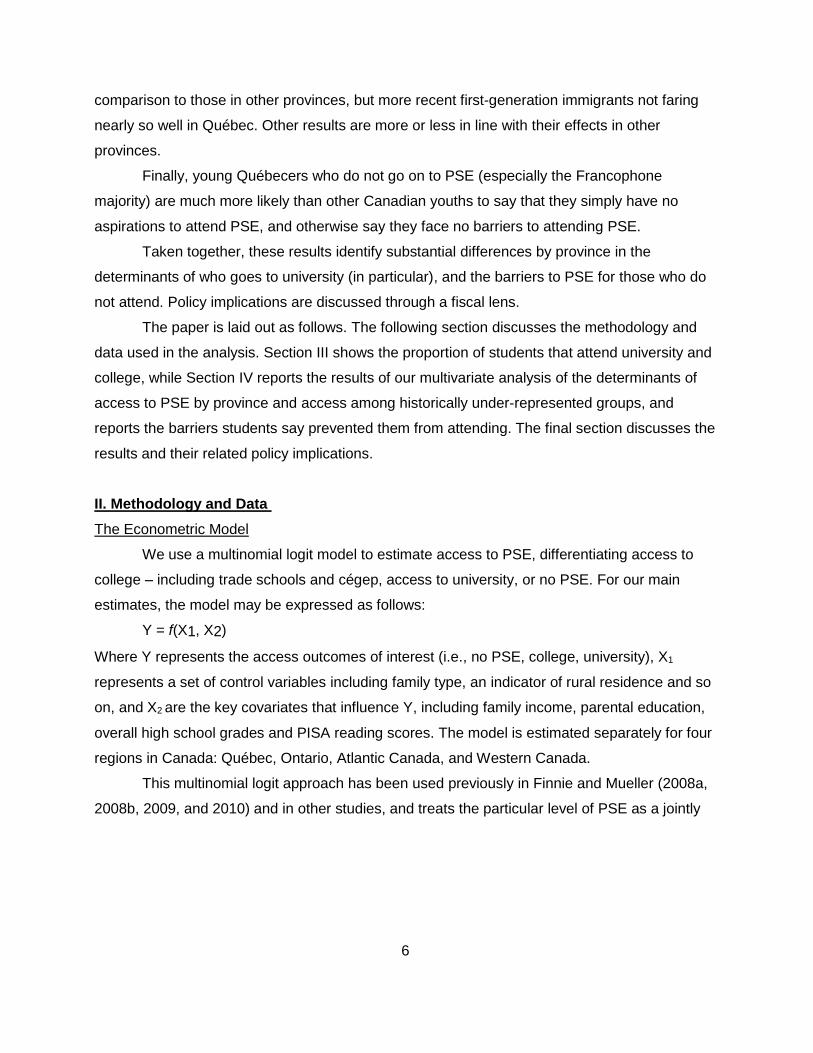
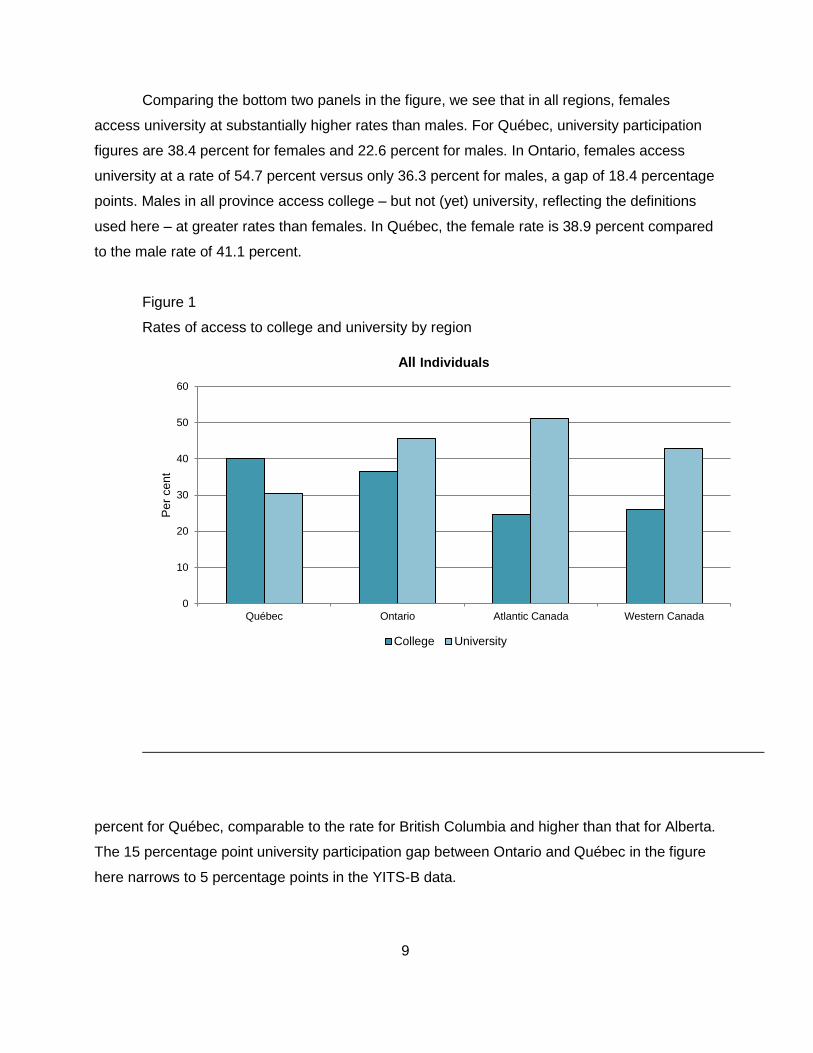
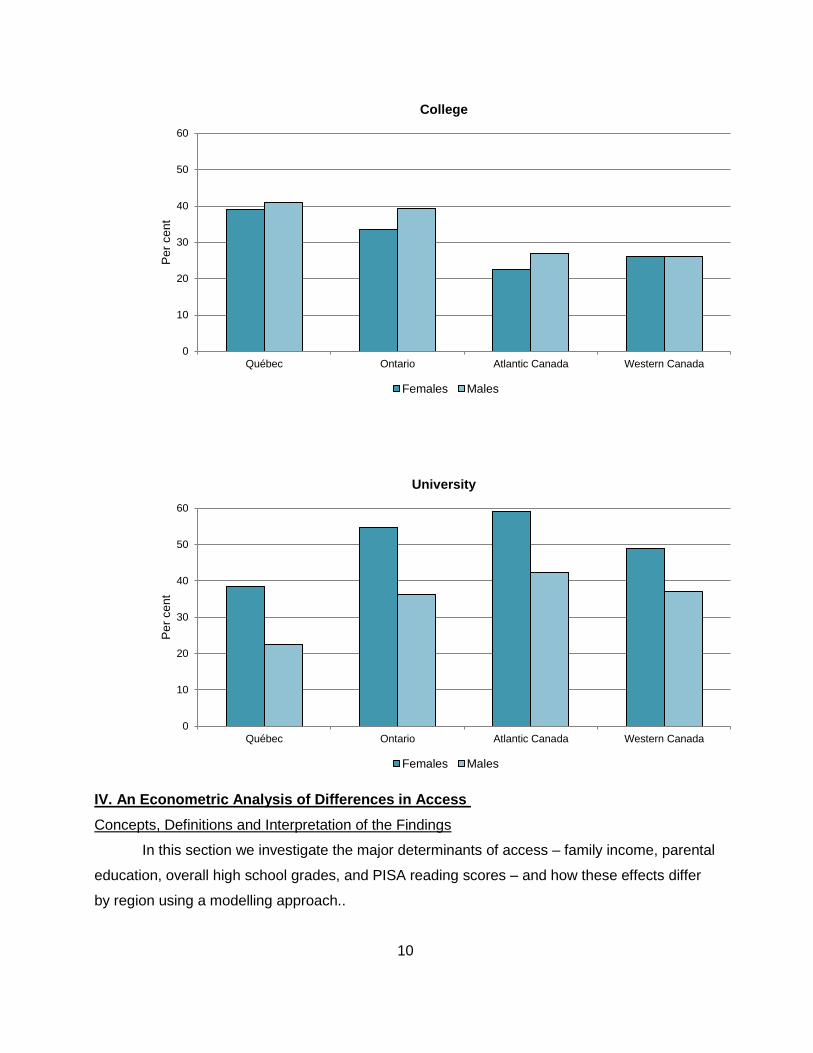
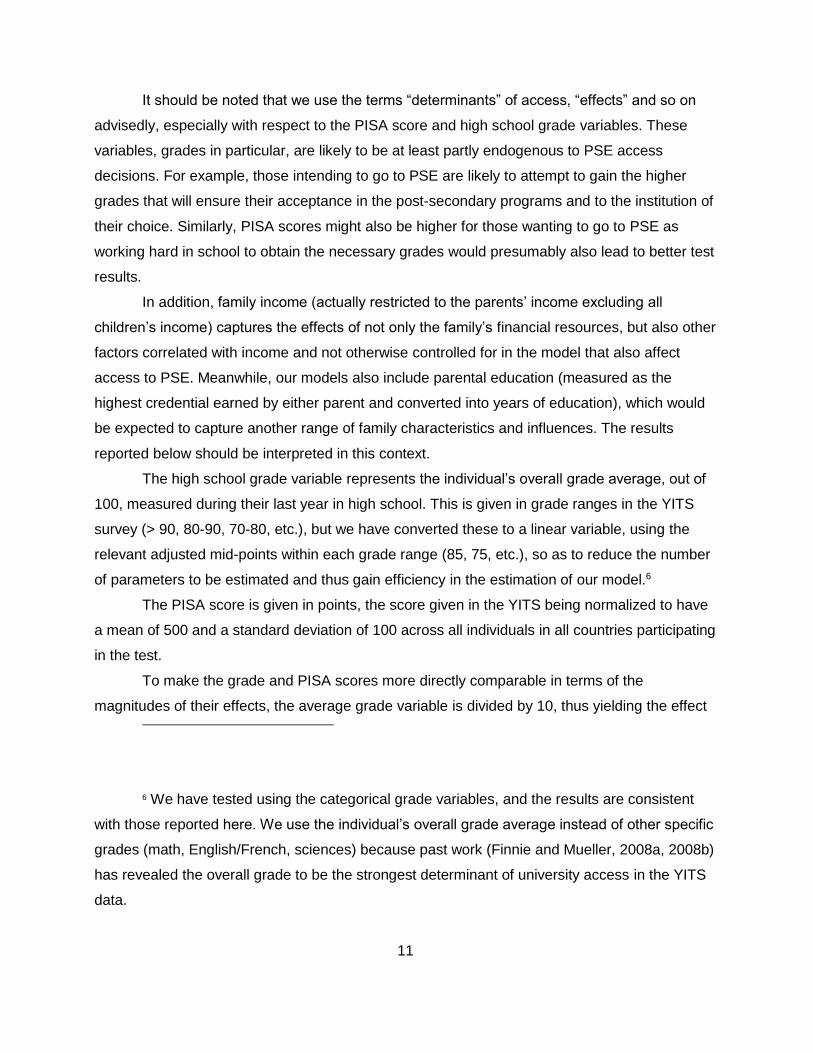
Comparing the bottom two panels in the figure, we see that in all regions, females
access university at substantially higher rates than males. For Québec, university participation
figures are 38.4 percent for females and 22.6 percent for males. In Ontario, females access
university at a rate of 54.7 percent versus only 36.3 percent for males, a gap of 18.4 percentage
points. Males in all province access college – but not (yet) university, reflecting the definitions
used here – at greater rates than females. In Québec, the female rate is 38.9 percent compared
to the male rate of 41.1 percent.
Figure 1
Rates of access to college and university by region
percent for Québec, comparable to the rate for British Columbia and higher than that for Alberta.
The 15 percentage point university participation gap between Ontario and Québec in the figure
here narrows to 5 percentage points in the YITS-B data.
0
10
20
30
40
50
60
Québec Ontario Atlantic Canada Western Canada
Pe
r ce
nt
All Individuals
College University
10
IV. An Econometric Analysis of Differences in Access
Concepts, Definitions and Interpretation of the Findings
In this section we investigate the major determinants of access – family income, parental
education, overall high school grades, and PISA reading scores – and how these effects differ
by region using a modelling approach..
0
10
20
30
40
50
60
Québec Ontario Atlantic Canada Western Canada
Pe
r ce
nt
College
Females Males
0
10
20
30
40
50
60
Québec Ontario Atlantic Canada Western Canada
Pe
r ce
nt
University
Females Males
11
It should be noted that we use the terms “determinants” of access, “effects” and so on
advisedly, especially with respect to the PISA score and high school grade variables. These
variables, grades in particular, are likely to be at least partly endogenous to PSE access
decisions. For example, those intending to go to PSE are likely to attempt to gain the higher
grades that will ensure their acceptance in the post-secondary programs and to the institution of
their choice. Similarly, PISA scores might also be higher for those wanting to go to PSE as
working hard in school to obtain the necessary grades would presumably also lead to better test
results.
In addition, family income (actually restricted to the parents’ income excluding all
children’s income) captures the effects of not only the family’s financial resources, but also other
factors correlated with income and not otherwise controlled for in the model that also affect
access to PSE. Meanwhile, our models also include parental education (measured as the
highest credential earned by either parent and converted into years of education), which would
be expected to capture another range of family characteristics and influences. The results
reported below should be interpreted in this context.
The high school grade variable represents the individual’s overall grade average, out of
100, measured during their last year in high school. This is given in grade ranges in the YITS
survey (> 90, 80-90, 70-80, etc.), but we have converted these to a linear variable, using the
relevant adjusted mid-points within each grade range (85, 75, etc.), so as to reduce the number
of parameters to be estimated and thus gain efficiency in the estimation of our model.6
The PISA score is given in points, the score given in the YITS being normalized to have
a mean of 500 and a standard deviation of 100 across all individuals in all countries participating
in the test.
To make the grade and PISA scores more directly comparable in terms of the
magnitudes of their effects, the average grade variable is divided by 10, thus yielding the effect
6 We have tested using the categorical grade variables, and the results are consistent
with those reported here. We use the individual’s overall grade average instead of other specific
grades (math, English/French, sciences) because past work (Finnie and Mueller, 2008a, 2008b)
has revealed the overall grade to be the strongest determinant of university access in the YITS
data.
12
of a 10-point difference in grades, while the PISA scores are divided by 100, meaning the effect
we report captures a difference of that much (i.e., one standard deviation). Finally, family
income is scaled to represent a $10,000 difference in income. These scale adjustments do not
affect the actual estimation, but make interpretation of the results easier.
All regressions in our analysis also include a set of controls that have been found to be
significant in earlier work: gender, urban-rural location (high school), language, family type (two
parents, single parent, etc.), parental education, and visible minority and immigrant status.
These controls are not interacted with region.7
Our discussions mostly focus on the effects on university attendance because the
effects of the variables of interest tend to be more evident on university attendance. This is
essentially because the main variables we are looking at in this analysis – family income,
parental education, high school grades, and PISA scores – tend to have strongly positive effects
on university access, but smaller or in many cases actually negative (net) effects on college
attendance. Intuitively, this makes sense: coming from a family with a higher income, having at
least one better educated parent, having higher grades in high school, or having a higher PISA
score tend not only to increase the probability that an individual will go on to PSE at some level
(i.e., to either college or university), but also that, among those that attend PSE, a person will go
to university rather than college. Hence, the overall effects on university attendance will be
strongly positive because the two effects run in the same direction, whereas the net effects on
college is the outcome of these two offsetting influences, so sometimes it is (usually weakly)
positive, sometimes negative, and often not statistically distinguishable from zero.
The General Models
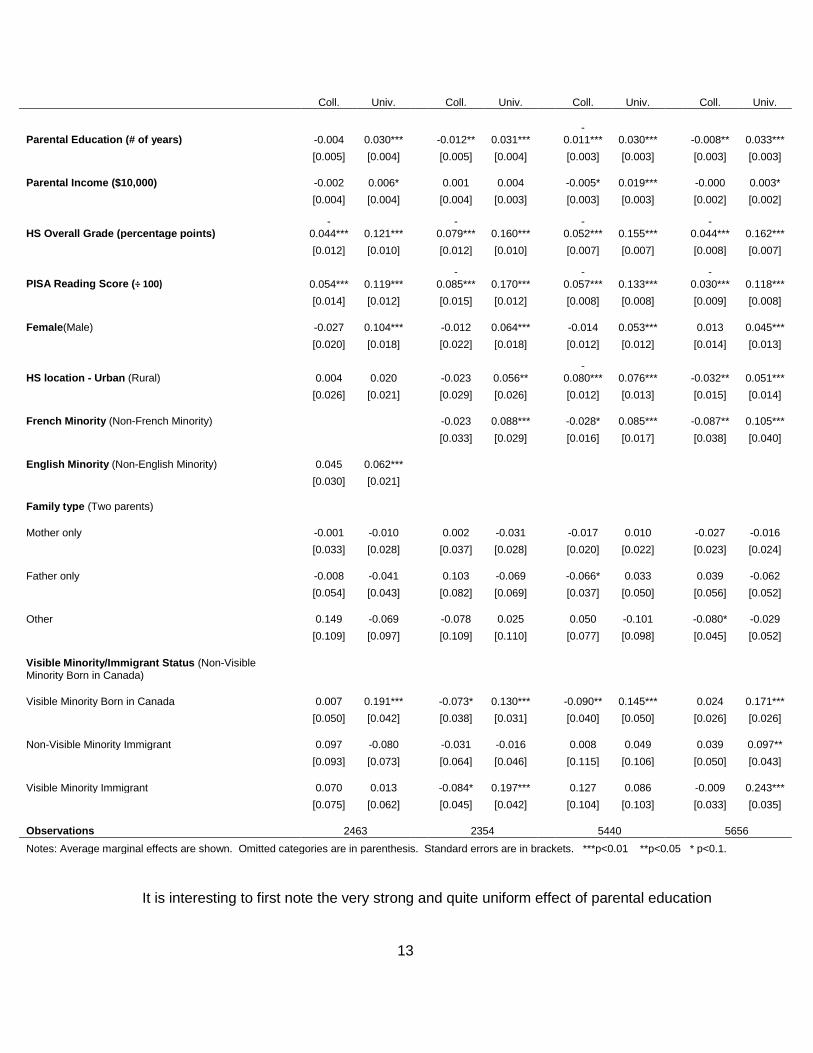
Table 1a shows the estimation results for each region. The effects of parental education,
family income, overall high school grades and PISA reading scores are shown, along with the
effects of the other control variables.
Table 1a: Multinomial Estimates of Access to College
and University
Québec Ontario Atlantic Canada Western Canada
7 See Finnie, Childs and Wismer (2011a) for models with interaction terms.
13
Coll. Univ.
Coll. Univ.
Coll. Univ.
Coll. Univ.
Parental Education (# of years) -0.004 0.030***
-0.012** 0.031***
-0.011*** 0.030***
-0.008** 0.033***
[0.005] [0.004]
[0.005] [0.004]
[0.003] [0.003]
[0.003] [0.003]
Parental Income ($10,000) -0.002 0.006*
0.001 0.004
-0.005* 0.019***
-0.000 0.003*
[0.004] [0.004]
[0.004] [0.003]
[0.003] [0.003]
[0.002] [0.002]
HS Overall Grade (percentage points)
-0.044*** 0.121***
-0.079*** 0.160***
-0.052*** 0.155***
-0.044*** 0.162***
[0.012] [0.010]
[0.012] [0.010]
[0.007] [0.007]
[0.008] [0.007]
PISA Reading Score (÷ 100) 0.054*** 0.119***
-0.085*** 0.170***
-0.057*** 0.133***
-0.030*** 0.118***
[0.014] [0.012]
[0.015] [0.012]
[0.008] [0.008]
[0.009] [0.008]
Female(Male) -0.027 0.104***
-0.012 0.064***
-0.014 0.053***
0.013 0.045***
[0.020] [0.018]
[0.022] [0.018]
[0.012] [0.012]
[0.014] [0.013]
HS location - Urban (Rural) 0.004 0.020
-0.023 0.056**
-0.080*** 0.076***
-0.032** 0.051***
[0.026] [0.021]
[0.029] [0.026]
[0.012] [0.013]
[0.015] [0.014]
French Minority (Non-French Minority)
-0.023 0.088***
-0.028* 0.085***
-0.087** 0.105***
[0.033] [0.029]
[0.016] [0.017]
[0.038] [0.040]
English Minority (Non-English Minority) 0.045 0.062***
[0.030] [0.021]
Family type (Two parents)
Mother only -0.001 -0.010
0.002 -0.031
-0.017 0.010
-0.027 -0.016
[0.033] [0.028]
[0.037] [0.028]
[0.020] [0.022]
[0.023] [0.024]
Father only -0.008 -0.041
0.103 -0.069
-0.066* 0.033
0.039 -0.062
[0.054] [0.043]
[0.082] [0.069]
[0.037] [0.050]
[0.056] [0.052]
Other 0.149 -0.069
-0.078 0.025
0.050 -0.101
-0.080* -0.029
[0.109] [0.097]
[0.109] [0.110]
[0.077] [0.098]
[0.045] [0.052]
Visible Minority/Immigrant Status (Non-Visible Minority Born in Canada)
Visible Minority Born in Canada 0.007 0.191***
-0.073* 0.130***
-0.090** 0.145***
0.024 0.171***
[0.050] [0.042]
[0.038] [0.031]
[0.040] [0.050]
[0.026] [0.026]
Non-Visible Minority Immigrant 0.097 -0.080
-0.031 -0.016
0.008 0.049
0.039 0.097**
[0.093] [0.073]
[0.064] [0.046]
[0.115] [0.106]
[0.050] [0.043]
Visible Minority Immigrant 0.070 0.013
-0.084* 0.197***
0.127 0.086
-0.009 0.243***
[0.075] [0.062]
[0.045] [0.042]
[0.104] [0.103]
[0.033] [0.035]
Observations 2463 2354 5440 5656
Notes: Average marginal effects are shown. Omitted categories are in parenthesis. Standard errors are in brackets. ***p<0.01 **p<0.05 * p<0.1.
It is interesting to first note the very strong and quite uniform effect of parental education
14
in all regions, varying only between 0.030 and 0.033. This means that a young person whose
highest-educated parent has a university degree (16 years of education) will have a 12-13
percentage point higher probability of attending university compared to a student whose best-
educated parent has only a high school diploma (12 years of education), all else being equal.
Given that the raw probability of young Québecers attending university by the age of 21 is 30
percent (Figure 1), this is a large effect.
By contrast, the estimates on the income coefficients indicate much weaker effects, and
vary by region. In Québec, the average marginal effect of income is small and only marginally
significant (at the 10 percent level). The .003 point estimate means that a $50,000 difference in
family income translates into a difference of just 1.5 percentage points in university attendance
– the same effect as about half a year of parental education.The effects of family income is also
small and not statistically in Ontario, while it is stronger in Atlantic Canada.
Grade and PISA reading score effects are significant in all regions, but the effects are
generally smaller for Québec, especially in the case of grades. This could again be because
Québec students attend cégep before university, with those cégep experiences presumably
cutting into the high school effects.
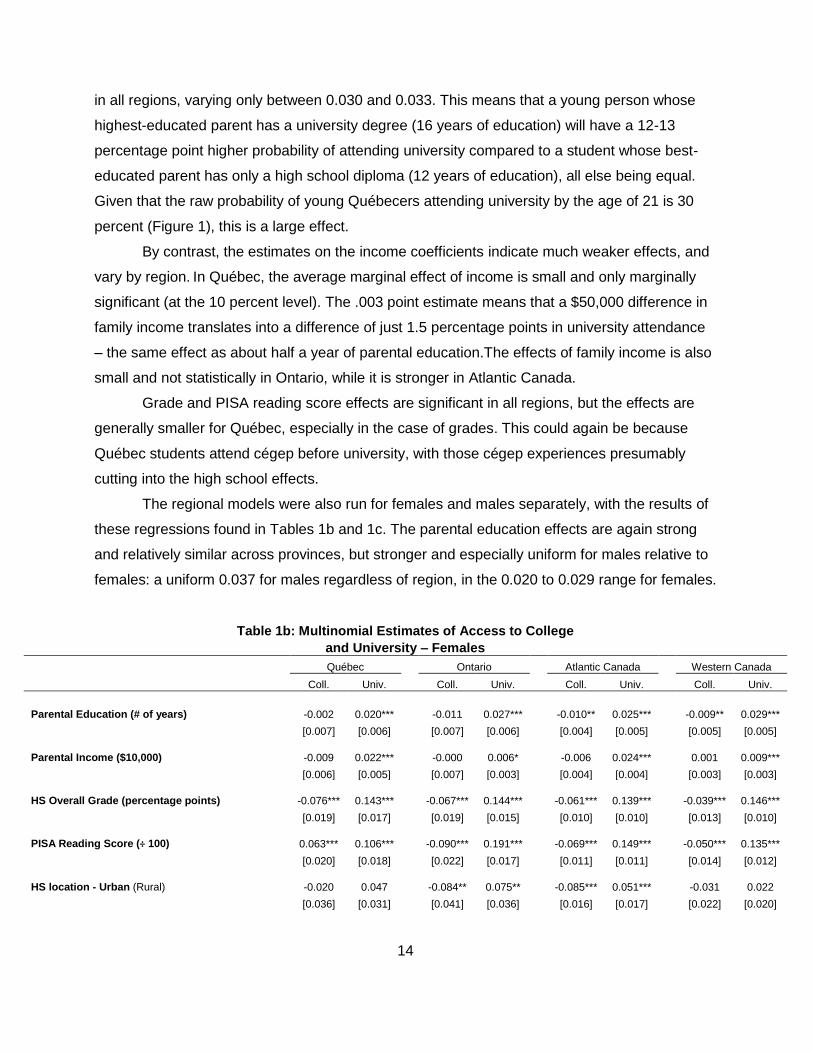
The regional models were also run for females and males separately, with the results of
these regressions found in Tables 1b and 1c. The parental education effects are again strong
and relatively similar across provinces, but stronger and especially uniform for males relative to
females: a uniform 0.037 for males regardless of region, in the 0.020 to 0.029 range for females.
Table 1b: Multinomial Estimates of Access to College
and University – Females
Québec Ontario Atlantic Canada Western Canada
Coll. Univ.
Coll. Univ.
Coll. Univ.
Coll. Univ.
Parental Education (# of years) -0.002 0.020***
-0.011 0.027***
-0.010** 0.025***
-0.009** 0.029***
[0.007] [0.006]
[0.007] [0.006]
[0.004] [0.005]
[0.005] [0.005]
Parental Income ($10,000) -0.009 0.022***
-0.000 0.006*
-0.006 0.024***
0.001 0.009***
[0.006] [0.005]
[0.007] [0.003]
[0.004] [0.004]
[0.003] [0.003]
HS Overall Grade (percentage points) -0.076*** 0.143***
-0.067*** 0.144***
-0.061*** 0.139***
-0.039*** 0.146***
[0.019] [0.017]
[0.019] [0.015]
[0.010] [0.010]
[0.013] [0.010]
PISA Reading Score (÷ 100) 0.063*** 0.106***
-0.090*** 0.191***
-0.069*** 0.149***
-0.050*** 0.135***
[0.020] [0.018]
[0.022] [0.017]
[0.011] [0.011]
[0.014] [0.012]
HS location - Urban (Rural) -0.020 0.047
-0.084** 0.075**
-0.085*** 0.051***
-0.031 0.022
[0.036] [0.031]
[0.041] [0.036]
[0.016] [0.017]
[0.022] [0.020]
15
French Minority (Non-French Minority)
0.001 0.070*
-0.050** 0.123***
-0.105** 0.138**
[0.045] [0.037]
[0.021] [0.021]
[0.050] [0.055]
English Minority (Non-English Minority) 0.003 0.080**
[0.046] [0.034]
Family type (Two parents)
Mother only -0.008 0.015
0.056 -0.044
-0.008 0.032
-0.032 -0.006
[0.044] [0.039]
[0.052] [0.038]
[0.027] [0.028]
[0.034] [0.034]
Father only -0.050 0.015
0.088 -0.008
-0.069 -0.013
0.174** -0.130*
[0.075] [0.071]
[0.105] [0.085]
[0.054] [0.072]
[0.088] [0.075]
Other 0.218 -0.090
0.014 -0.151
0.015 -0.016
-0.049 -0.035
[0.150] [0.148]
[0.165] [0.107]
[0.093] [0.118]
[0.069] [0.070]
Visible Minority/Immigrant Status (Non-Visible Minority Born in Canada)
Visible Minority Born in Canada -0.072 0.199***
-0.044 0.160***
-0.088* 0.195***
0.005 0.172***
[0.069] [0.060]
[0.050] [0.045]
[0.053] [0.063]
[0.038] [0.037]
Non-Visible Minority Immigrant 0.111 0.027
-0.154* 0.070
-0.006 0.199
0.038 0.036
[0.162] [0.144]
[0.082] [0.062]
[0.147] [0.146]
[0.071] [0.057]
Visible Minority Immigrant 0.048 0.010
-0.077 0.218***
0.104 0.089
-0.053 0.296***
[0.118] [0.113]
[0.059] [0.057]
[0.114] [0.112]
[0.048] [0.053]
Observations 1216 1208 2897 2833
Notes: Average marginal effects are shown. Omitted categories are in parenthesis. Standard errors are in brackets. ***p<0.01 **p<0.05 * p<0.1.
Table 1c: Multinomial Estimates of Access to College
and University – Males
Québec Ontario Atlantic Canada Western Canada
Coll. Univ.
Coll. Univ.
Coll. Univ.
Coll. Univ.
Parental Education (# of years) -0.005 0.037***
-0.015** 0.037***
-0.014*** 0.037***
-0.007 0.037***
[0.006] [0.006]
[0.007] [0.006]
[0.004] [0.005]
[0.004] [0.004]
Parental Income ($10,000) 0.001 0.001
0.001 0.004
-0.004 0.015***
-0.000 0.001
[0.003] [0.002]
[0.004] [0.003]
[0.003] [0.003]
[0.001] [0.001]
HS Overall Grade (percentage points) -0.018 0.102***
-0.086*** 0.177***
-0.046*** 0.171***
-0.047*** 0.181***
[0.017] [0.014]
[0.016] [0.014]
[0.010] [0.011]
[0.010] [0.010]
PISA Reading Score (÷ 100) 0.051*** 0.131***
-0.069*** 0.153***
-0.046*** 0.119***
-0.014 0.101***
[0.019] [0.014]
[0.019] [0.017]
[0.010] [0.011]
[0.012] [0.012]
HS location - Urban (Rural) 0.028 -0.008
0.033 0.030
-0.081*** 0.101***
-0.042** 0.085***
[0.036] [0.029]
[0.040] [0.034]
[0.017] [0.019]
[0.020] [0.021]
French Minority (Non-French Minority)
-0.047 0.122***
0.008 0.028
-0.052 0.038
[0.048] [0.046]
[0.025] [0.027]
[0.060] [0.049]
16
English Minority (Non-English Minority) 0.085** 0.043
[0.040] [0.027]
Family type (Two parents)
Mother only -0.008 -0.004
-0.065 -0.009
-0.022 -0.019
-0.022 0.001
[0.046] [0.038]
[0.049] [0.038]
[0.030] [0.034]
[0.032] [0.033]
Father only 0.024 -0.076*
0.110 -0.123
-0.073 0.091
-0.095 0.042
[0.074] [0.045]
[0.112] [0.091]
[0.049] [0.060]
[0.060] [0.061]
Other 0.100 -0.056
-0.195** 0.203*
0.182 -0.338***
-0.105* 0.005
[0.141] [0.098]
[0.087] [0.106]
[0.125] [0.114]
[0.061] [0.079]
Visible Minority/Immigrant Status (Non-Visible Minority Born in Canada)
Visible Minority Born in Canada 0.064 0.198***
-0.092 0.083*
-0.093* 0.094
0.041 0.173***
[0.070] [0.060]
[0.057] [0.045]
[0.055] [0.072]
[0.037] [0.035]
Non-Visible Minority Immigrant 0.098 -0.116
0.070 -0.126*
0.000 -0.096
0.048 0.169***
[0.116] [0.087]
[0.095] [0.070]
[0.166] [0.097]
[0.072] [0.063]
Visible Minority Immigrant 0.082 0.025
-0.095 0.181***
0.166 0.063
0.030 0.204***
[0.095] [0.066]
[0.068] [0.058]
[0.156] [0.154]
[0.044] [0.046]
Observations 1247 1146 2543 2823
Notes: Average marginal effects are shown. Omitted categories are in parenthesis. Standard errors are in brackets. ***p<0.01 **p<0.05 * p<0.1.
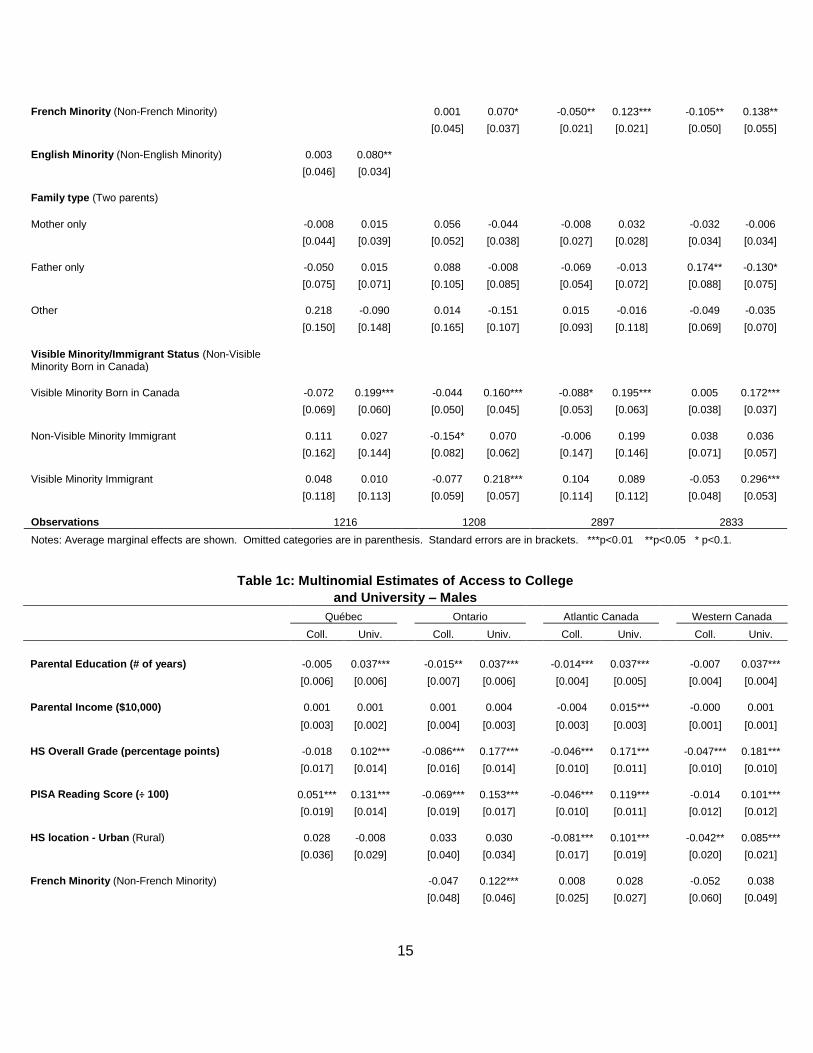
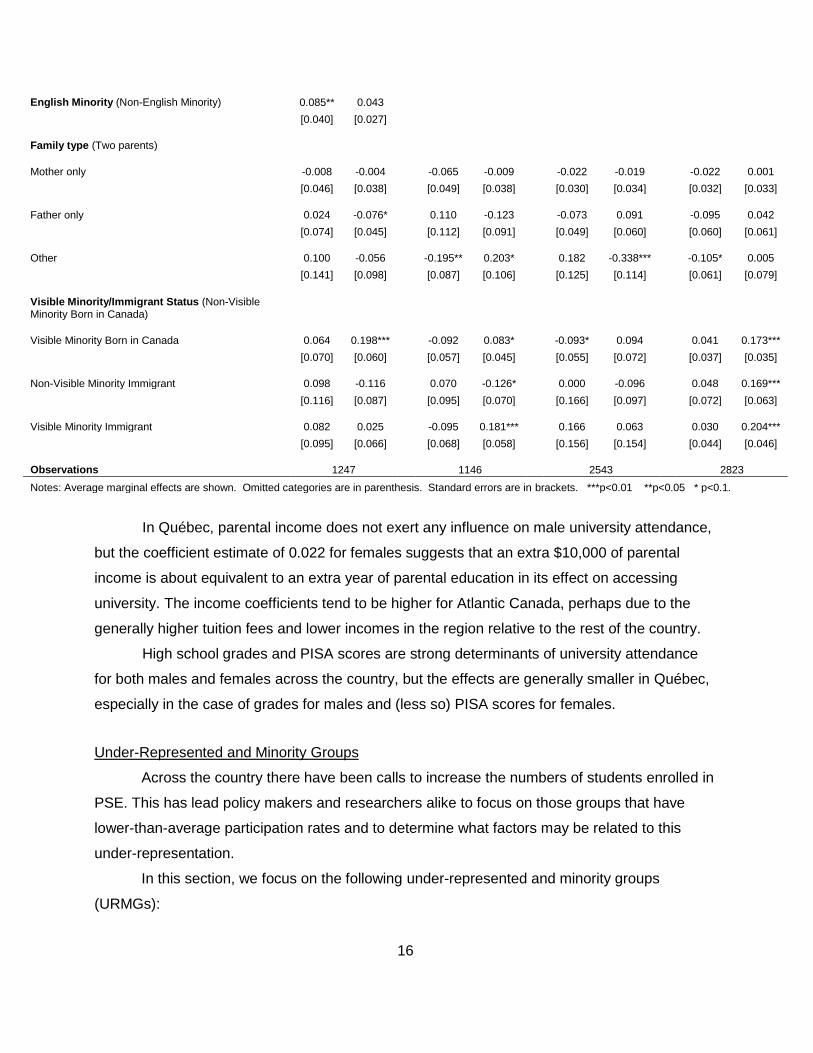
In Québec, parental income does not exert any influence on male university attendance,
but the coefficient estimate of 0.022 for females suggests that an extra $10,000 of parental
income is about equivalent to an extra year of parental education in its effect on accessing
university. The income coefficients tend to be higher for Atlantic Canada, perhaps due to the
generally higher tuition fees and lower incomes in the region relative to the rest of the country.
High school grades and PISA scores are strong determinants of university attendance
for both males and females across the country, but the effects are generally smaller in Québec,
especially in the case of grades for males and (less so) PISA scores for females.
Under-Represented and Minority Groups
Across the country there have been calls to increase the numbers of students enrolled in
PSE. This has lead policy makers and researchers alike to focus on those groups that have
lower-than-average participation rates and to determine what factors may be related to this
under-representation.
In this section, we focus on the following under-represented and minority groups
(URMGs):
17
• those from low-income families;
• those from families with no history of attending PSE (i.e., “first-generation”
students);
• those living in rural areas and others who live far from college or university
campuses;
• those whose mother tongue is French;
• first- and second-generation immigrants;
• those from single-parent (or other “non-traditional”) families;
• those of Aboriginal or First Nations ancestry; and
• those with disabilities.
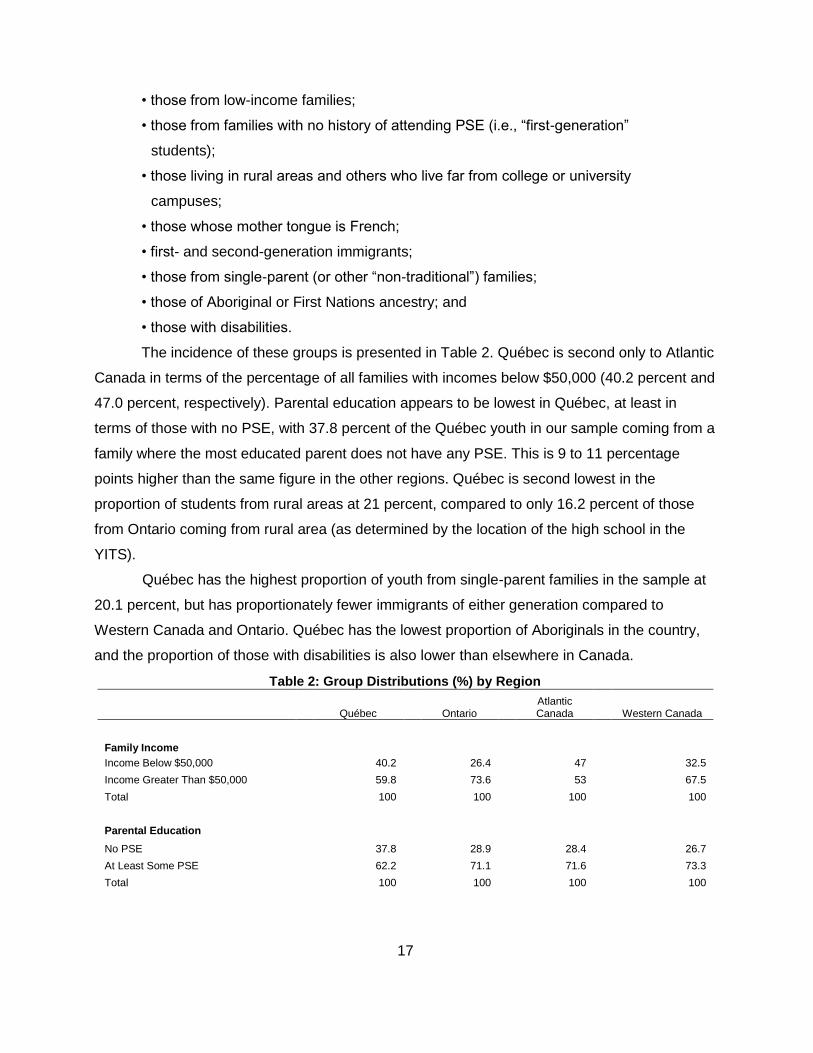
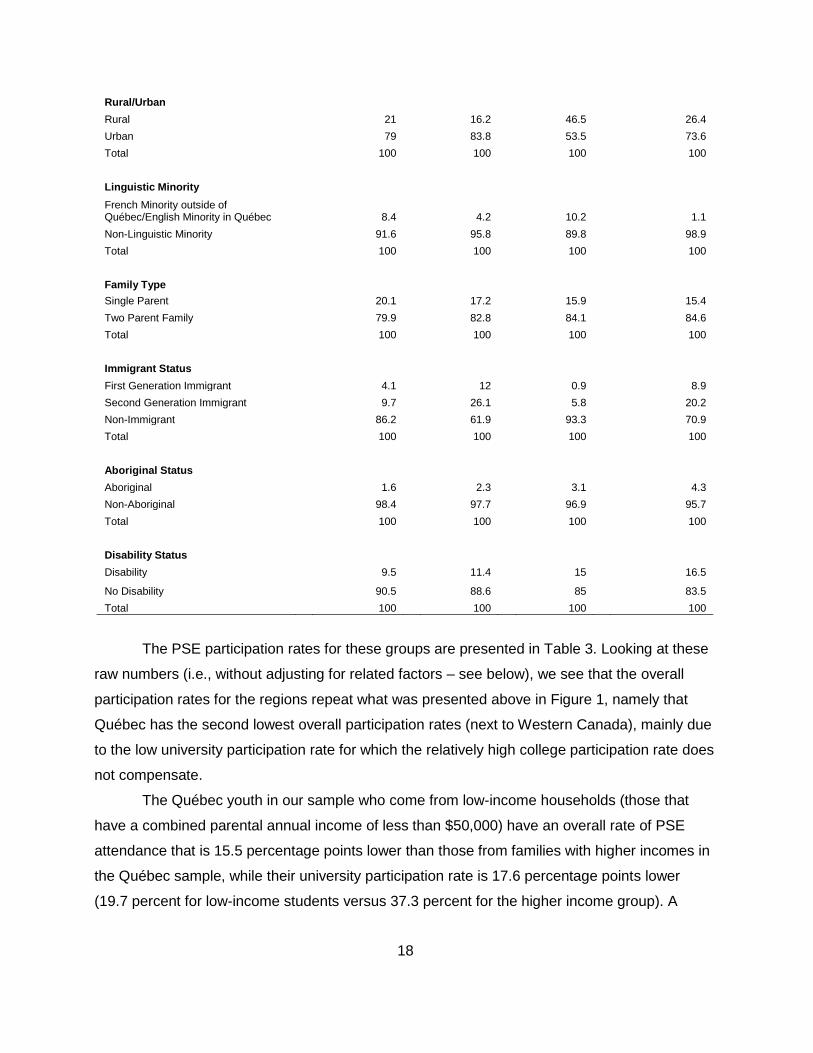
The incidence of these groups is presented in Table 2. Québec is second only to Atlantic
Canada in terms of the percentage of all families with incomes below $50,000 (40.2 percent and
47.0 percent, respectively). Parental education appears to be lowest in Québec, at least in
terms of those with no PSE, with 37.8 percent of the Québec youth in our sample coming from a
family where the most educated parent does not have any PSE. This is 9 to 11 percentage
points higher than the same figure in the other regions. Québec is second lowest in the
proportion of students from rural areas at 21 percent, compared to only 16.2 percent of those
from Ontario coming from rural area (as determined by the location of the high school in the
YITS).
Québec has the highest proportion of youth from single-parent families in the sample at
20.1 percent, but has proportionately fewer immigrants of either generation compared to
Western Canada and Ontario. Québec has the lowest proportion of Aboriginals in the country,
and the proportion of those with disabilities is also lower than elsewhere in Canada.
Table 2: Group Distributions (%) by Region
Québec Ontario Atlantic Canada Western Canada
Family Income Income Below $50,000
40.2
26.4
47
32.5
Income Greater Than $50,000
59.8
73.6
53
67.5
Total
100
100
100
100
Parental Education
No PSE
37.8
28.9
28.4
26.7
At Least Some PSE
62.2
71.1
71.6
73.3
Total
100
100
100
100
18
Rural/Urban Rural
21
16.2
46.5
26.4
Urban
79
83.8
53.5
73.6
Total
100
100
100
100
Linguistic Minority
French Minority outside of Québec/English Minority in Québec
8.4
4.2
10.2
1.1
Non-Linguistic Minority
91.6
95.8
89.8
98.9
Total
100
100
100
100
Family Type Single Parent
20.1
17.2
15.9
15.4
Two Parent Family
79.9
82.8
84.1
84.6
Total
100
100
100
100
Immigrant Status First Generation Immigrant
4.1
12
0.9
8.9
Second Generation Immigrant
9.7
26.1
5.8
20.2
Non-Immigrant
86.2
61.9
93.3
70.9
Total
100
100
100
100
Aboriginal Status Aboriginal
1.6
2.3
3.1
4.3
Non-Aboriginal
98.4
97.7
96.9
95.7
Total
100
100
100
100
Disability Status Disability
9.5
11.4
15
16.5
No Disability
90.5
88.6
85
83.5
Total 100 100 100 100
The PSE participation rates for these groups are presented in Table 3. Looking at these
raw numbers (i.e., without adjusting for related factors – see below), we see that the overall
participation rates for the regions repeat what was presented above in Figure 1, namely that
Québec has the second lowest overall participation rates (next to Western Canada), mainly due
to the low university participation rate for which the relatively high college participation rate does
not compensate.
The Québec youth in our sample who come from low-income households (those that
have a combined parental annual income of less than $50,000) have an overall rate of PSE
attendance that is 15.5 percentage points lower than those from families with higher incomes in
the Québec sample, while their university participation rate is 17.6 percentage points lower
(19.7 percent for low-income students versus 37.3 percent for the higher income group). A
19
similar pattern holds for the other regions, with some variation. In particular, in Atlantic Canada,
where university participation rates are generally high, there is an even greater difference
between lower-income students’ and higher-income students’ university access rates (36.1
percent versus 64.4 percent). Ontario, meanwhile, has a much higher overall university
participation rate, and a somewhat smaller gap in relative participation between low-income
students and higher-income students (14.3 percentage points).
In Québec, students with no family background of PSE attendance have an overall PSE
participation rate that is an even greater 24.2 percentage points lower than that of students with
at least one parent who attended PSE. This gap is the widest in the country. More dramatically,
the university participation rate of first-generation PSE students is less than half that of non-first
generation PSE students, at 16.7 percent and 38.5 percent, respectively. Unlike the other
regions, this is not offset by higher college participation rates.
Rural Quebecers are also under-represented in PSE, with an overall PSE participation
rate that is nine percentage points lower than that of students from urban areas, all because of
lower university participation rates. This rural-urban university access rate gap is, however, the
smallest in the country. Furthermore, there is no gap in Québec for college participation
between the two groups, unlike in Ontario and the Atlantic provinces where the gap is about 10
percentage points. These results are presumably in part due to the cégep system in Québec as
well as the University of Québec system, both of which have campuses across the province,
including many remote areas, thus easing access for many rural students
Those respondents living out of Québec whose first language is French have a mixed
record relative to non-Francophones, in some cases having higher PSE access rates, in some
cases lower.
Within Québec, students from single-parent families access PSE at an overall rate that is
4.3 percentage points lower than that of students from two-parent families. Although college
rates are higher for those from single parent families, those from two-parent families are 6.7
percentage points more likely to attend university. The same pattern, with larger differences, is
observed in Ontario. In Atlantic Canada, students from single-parent families have a similar
college attendance rate to that of students from two-parent families, but the difference in the
university attendance rate is over 13 percentage points. In the West, the difference between the
university access rates is about 10 percentage points, while the college participation rate for
students from single-parent households is approximately 2 percentage points lower than the
rate for students from two-parent families.
20
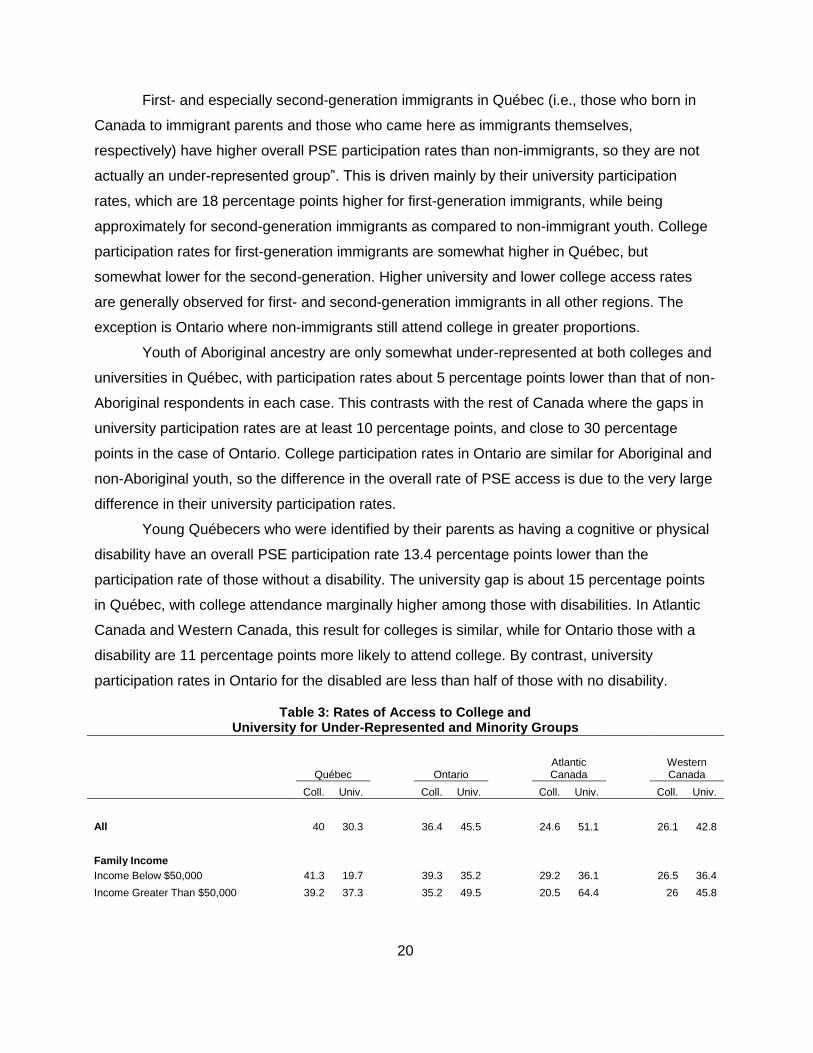
First- and especially second-generation immigrants in Québec (i.e., those who born in
Canada to immigrant parents and those who came here as immigrants themselves,
respectively) have higher overall PSE participation rates than non-immigrants, so they are not
actually an under-represented group”. This is driven mainly by their university participation
rates, which are 18 percentage points higher for first-generation immigrants, while being
approximately for second-generation immigrants as compared to non-immigrant youth. College
participation rates for first-generation immigrants are somewhat higher in Québec, but
somewhat lower for the second-generation. Higher university and lower college access rates
are generally observed for first- and second-generation immigrants in all other regions. The
exception is Ontario where non-immigrants still attend college in greater proportions.
Youth of Aboriginal ancestry are only somewhat under-represented at both colleges and
universities in Québec, with participation rates about 5 percentage points lower than that of non-
Aboriginal respondents in each case. This contrasts with the rest of Canada where the gaps in
university participation rates are at least 10 percentage points, and close to 30 percentage
points in the case of Ontario. College participation rates in Ontario are similar for Aboriginal and
non-Aboriginal youth, so the difference in the overall rate of PSE access is due to the very large
difference in their university participation rates.
Young Québecers who were identified by their parents as having a cognitive or physical
disability have an overall PSE participation rate 13.4 percentage points lower than the
participation rate of those without a disability. The university gap is about 15 percentage points
in Québec, with college attendance marginally higher among those with disabilities. In Atlantic
Canada and Western Canada, this result for colleges is similar, while for Ontario those with a
disability are 11 percentage points more likely to attend college. By contrast, university
participation rates in Ontario for the disabled are less than half of those with no disability.
Table 3: Rates of Access to College and University for Under-Represented and Minority Groups
Québec
Ontario
Atlantic Canada
Western Canada
Coll. Univ. Coll. Univ. Coll. Univ. Coll. Univ.
All 40 30.3
36.4 45.5
24.6 51.1
26.1 42.8
Family Income Income Below $50,000 41.3 19.7
39.3 35.2
29.2 36.1
26.5 36.4
Income Greater Than $50,000 39.2 37.3
35.2 49.5
20.5 64.4
26 45.8
21
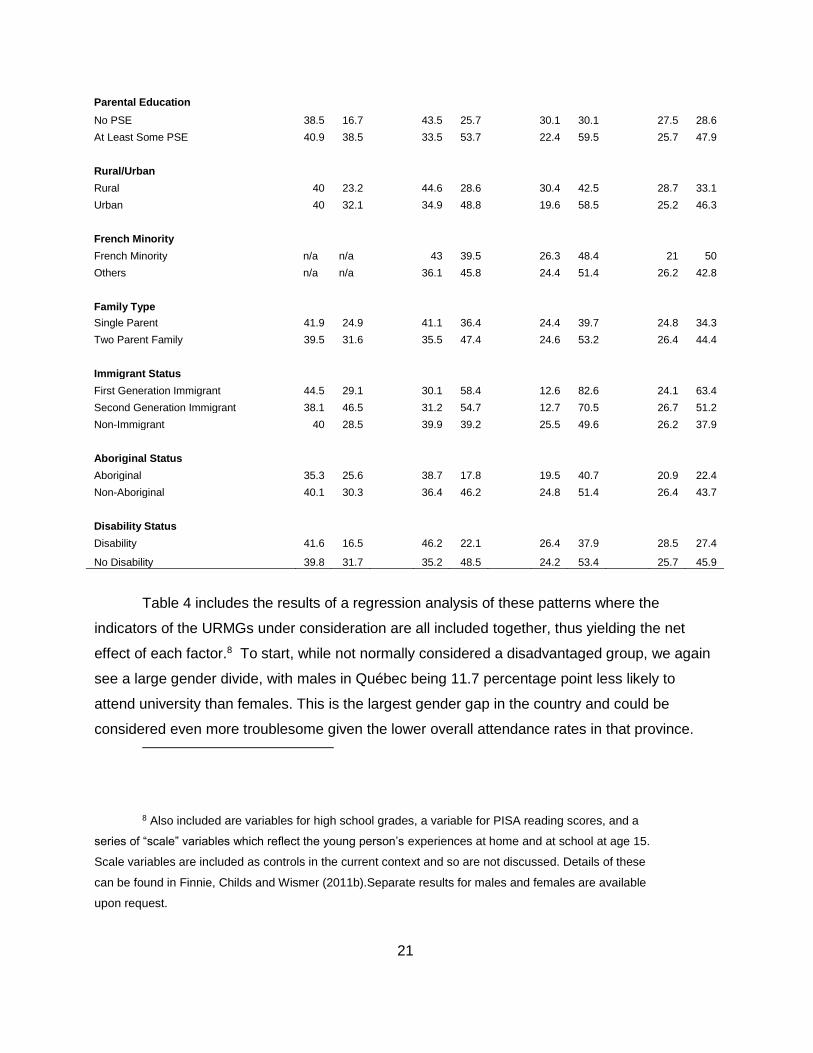
Parental Education
No PSE 38.5 16.7
43.5 25.7
30.1 30.1
27.5 28.6
At Least Some PSE 40.9 38.5
33.5 53.7
22.4 59.5
25.7 47.9
Rural/Urban Rural 40 23.2
44.6 28.6
30.4 42.5
28.7 33.1
Urban 40 32.1
34.9 48.8
19.6 58.5
25.2 46.3
French Minority French Minority n/a n/a
43 39.5
26.3 48.4
21 50
Others n/a n/a
36.1 45.8
24.4 51.4
26.2 42.8
Family Type Single Parent 41.9 24.9
41.1 36.4
24.4 39.7
24.8 34.3
Two Parent Family 39.5 31.6
35.5 47.4
24.6 53.2
26.4 44.4
Immigrant Status First Generation Immigrant 44.5 29.1
30.1 58.4
12.6 82.6
24.1 63.4
Second Generation Immigrant 38.1 46.5
31.2 54.7
12.7 70.5
26.7 51.2
Non-Immigrant 40 28.5
39.9 39.2
25.5 49.6
26.2 37.9
Aboriginal Status Aboriginal 35.3 25.6
38.7 17.8
19.5 40.7
20.9 22.4
Non-Aboriginal 40.1 30.3
36.4 46.2
24.8 51.4
26.4 43.7
Disability Status Disability 41.6 16.5
46.2 22.1
26.4 37.9
28.5 27.4
No Disability 39.8 31.7 35.2 48.5 24.2 53.4 25.7 45.9
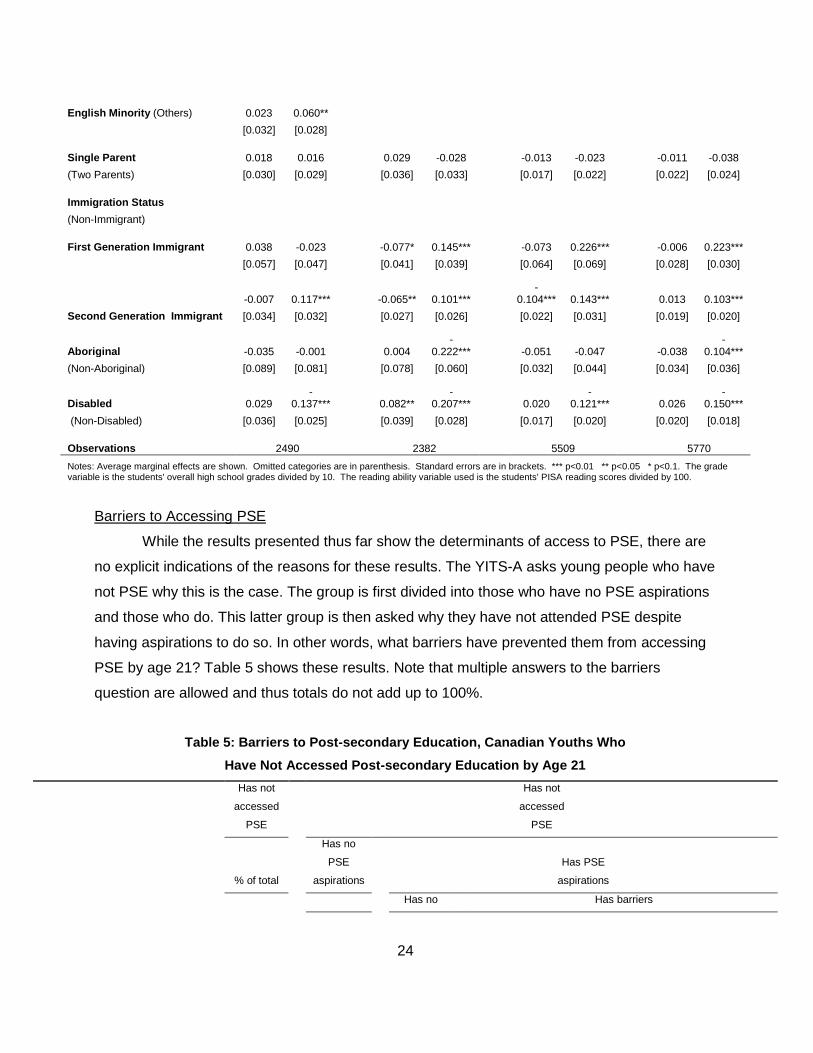
Table 4 includes the results of a regression analysis of these patterns where the
indicators of the URMGs under consideration are all included together, thus yielding the net
effect of each factor.8 To start, while not normally considered a disadvantaged group, we again
see a large gender divide, with males in Québec being 11.7 percentage point less likely to
attend university than females. This is the largest gender gap in the country and could be
considered even more troublesome given the lower overall attendance rates in that province.
8 Also included are variables for high school grades, a variable for PISA reading scores, and a
series of “scale” variables which reflect the young person’s experiences at home and at school at age 15.
Scale variables are included as controls in the current context and so are not discussed. Details of these
can be found in Finnie, Childs and Wismer (2011b).Separate results for males and females are available
upon request.
22
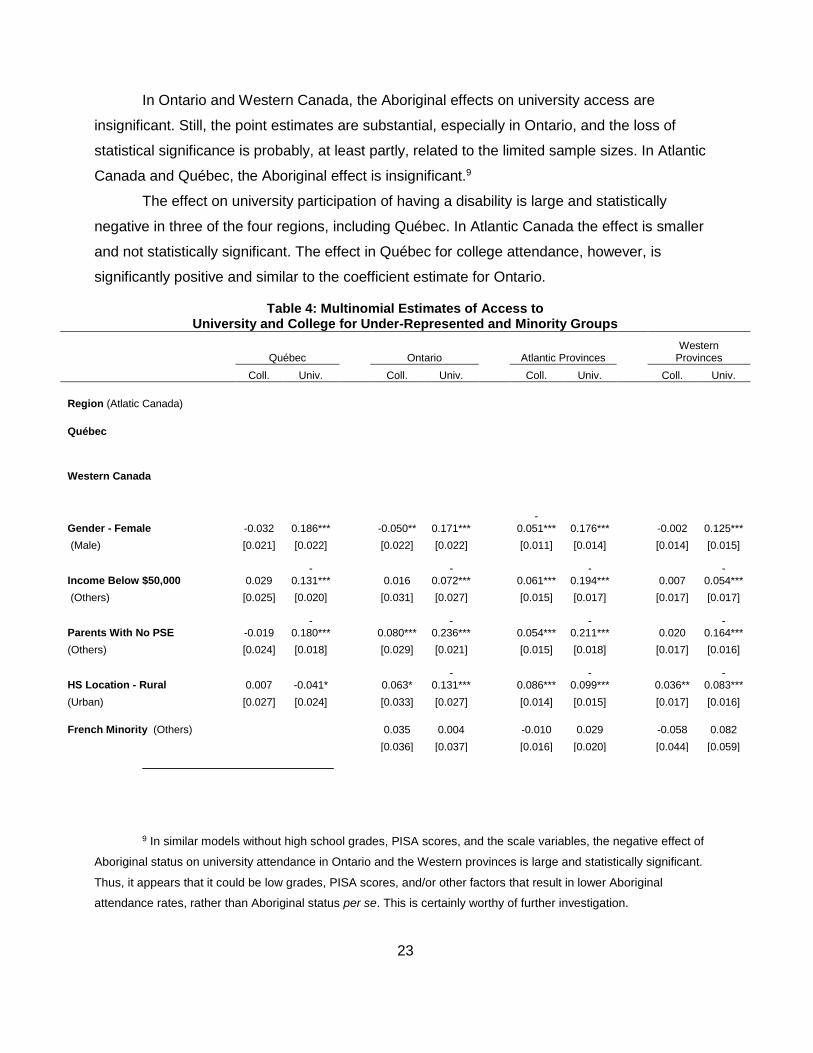
The low-income university access gap in Québec is some 6.7 percentage points. For the
Atlantic Provinces this gap is estimated to be 11.3 percentage points, with some of the gap
compensated for by higher college attendance. Both of these regions stand in stark contrast to
Ontario and the Western Provinces which have no statistically discernible gap for either college
or university.
In all regions, the effect of being a first-generation PSE student is strong, with those
whose parents have no PSE between 6 and 11 percentage points less likely to attend university
compared to those who have at least one parent with PSE. Québec youth stand at a 10
percentage point disadvantage. The effect on college attendance is statistically zero in all
regions, reflecting the fact that higher parental education pushes some young people from no
PSE into college, and an equivalent number from college into university.
These results also demonstrate the importance of the two different effects: family income
and parental education appear to be capturing two distinctly different sets of influences, with
different effects in different provinces. It is also interesting how the specific low income variable
included here seems to matter more than the general income variable considered earlier.
In all regions except Québec, the effect of being a rural student on university attendance
is fairly strong and statistically significant. In Québec the effect is nil. Those from rural areas in
Atlantic Canada and Western Canada have higher probabilities of attending college, whereas
the effects for Ontario and Québec are essentially zero.
In both Ontario and Western Canada, there is a positive effect of being French speaking.
In the former case, the effect is just for university attendance, with Francophones about 9
percentage points more likely to attend than non-Francophones, with no effect on college
attendance. In Western Canada, the 8.4 percentage point advantage of Francophones at
university is entirely offset by lower college participation rates. In Québec, the English minority
has higher university access rates compared to non-English language groups.
The single-parent effect on university access is small in size and statistically
insignificant. This result holds throughout the country.
In Ontario, Atlantic Canada and Western Canada, strong first- and second-generation
immigrant effects on university participation exist. In Québec, however, the effect of being a
first-generation immigrant is statistically insignificant, which may have important implications
regarding the integration of their immigrants and the future growth of their economy (Finnie &
and Mueller, 2009 and 2010). The second-generation immigrant effect is similar across all
provinces and regions, including Québec, which has the largest coefficient estimate.
23
In Ontario and Western Canada, the Aboriginal effects on university access are
insignificant. Still, the point estimates are substantial, especially in Ontario, and the loss of
statistical significance is probably, at least partly, related to the limited sample sizes. In Atlantic
Canada and Québec, the Aboriginal effect is insignificant.9
The effect on university participation of having a disability is large and statistically
negative in three of the four regions, including Québec. In Atlantic Canada the effect is smaller
and not statistically significant. The effect in Québec for college attendance, however, is
significantly positive and similar to the coefficient estimate for Ontario.
Table 4: Multinomial Estimates of Access to University and College for Under-Represented and Minority Groups
Québec
Ontario
Atlantic Provinces
Western Provinces
Coll. Univ. Coll. Univ. Coll. Univ. Coll. Univ.
Region (Atlatic Canada)
Québec
Western Canada
Gender - Female -0.032 0.186***
-0.050** 0.171***
-0.051*** 0.176***
-0.002 0.125***
(Male) [0.021] [0.022]
[0.022] [0.022]
[0.011] [0.014]
[0.014] [0.015]
Income Below $50,000 0.029
-0.131***
0.016
-0.072***
0.061***
-0.194***
0.007
-0.054***
(Others) [0.025] [0.020]
[0.031] [0.027]
[0.015] [0.017]
[0.017] [0.017]
Parents With No PSE -0.019
-0.180***
0.080***
-0.236***
0.054***
-0.211***
0.020
-0.164***
(Others) [0.024] [0.018]
[0.029] [0.021]
[0.015] [0.018]
[0.017] [0.016]
HS Location - Rural 0.007 -0.041*
0.063*
-0.131***
0.086***
-0.099***
0.036**
-0.083***
(Urban) [0.027] [0.024]
[0.033] [0.027]
[0.014] [0.015]
[0.017] [0.016]
French Minority (Others)
0.035 0.004
-0.010 0.029
-0.058 0.082
[0.036] [0.037]
[0.016] [0.020]
[0.044] [0.059]
9 In similar models without high school grades, PISA scores, and the scale variables, the negative effect of
Aboriginal status on university attendance in Ontario and the Western provinces is large and statistically significant.
Thus, it appears that it could be low grades, PISA scores, and/or other factors that result in lower Aboriginal
attendance rates, rather than Aboriginal status per se. This is certainly worthy of further investigation.
24
English Minority (Others) 0.023 0.060**
[0.032] [0.028]
Single Parent 0.018 0.016
0.029 -0.028
-0.013 -0.023
-0.011 -0.038
(Two Parents) [0.030] [0.029]
[0.036] [0.033]
[0.017] [0.022]
[0.022] [0.024]
Immigration Status (Non-Immigrant)
First Generation Immigrant 0.038 -0.023
-0.077* 0.145***
-0.073 0.226***
-0.006 0.223***
[0.057] [0.047]
[0.041] [0.039]
[0.064] [0.069]
[0.028] [0.030]
Second Generation Immigrant
-0.007 0.117***
-0.065** 0.101***
-0.104*** 0.143***
0.013 0.103***
[0.034] [0.032]
[0.027] [0.026]
[0.022] [0.031]
[0.019] [0.020]
Aboriginal -0.035 -0.001
0.004
-0.222***
-0.051 -0.047
-0.038
-0.104***
(Non-Aboriginal) [0.089] [0.081]
[0.078] [0.060]
[0.032] [0.044]
[0.034] [0.036]
Disabled 0.029
-0.137***
0.082**
-0.207***
0.020
-0.121***
0.026
-0.150***
(Non-Disabled) [0.036] [0.025]
[0.039] [0.028]
[0.017] [0.020]
[0.020] [0.018]
Observations 2490 2382 5509 5770
Notes: Average marginal effects are shown. Omitted categories are in parenthesis. Standard errors are in brackets. *** p<0.01 ** p<0.05 * p<0.1. The grade variable is the students' overall high school grades divided by 10. The reading ability variable used is the students' PISA reading scores divided by 100.
Barriers to Accessing PSE
While the results presented thus far show the determinants of access to PSE, there are
no explicit indications of the reasons for these results. The YITS-A asks young people who have
not PSE why this is the case. The group is first divided into those who have no PSE aspirations
and those who do. This latter group is then asked why they have not attended PSE despite
having aspirations to do so. In other words, what barriers have prevented them from accessing
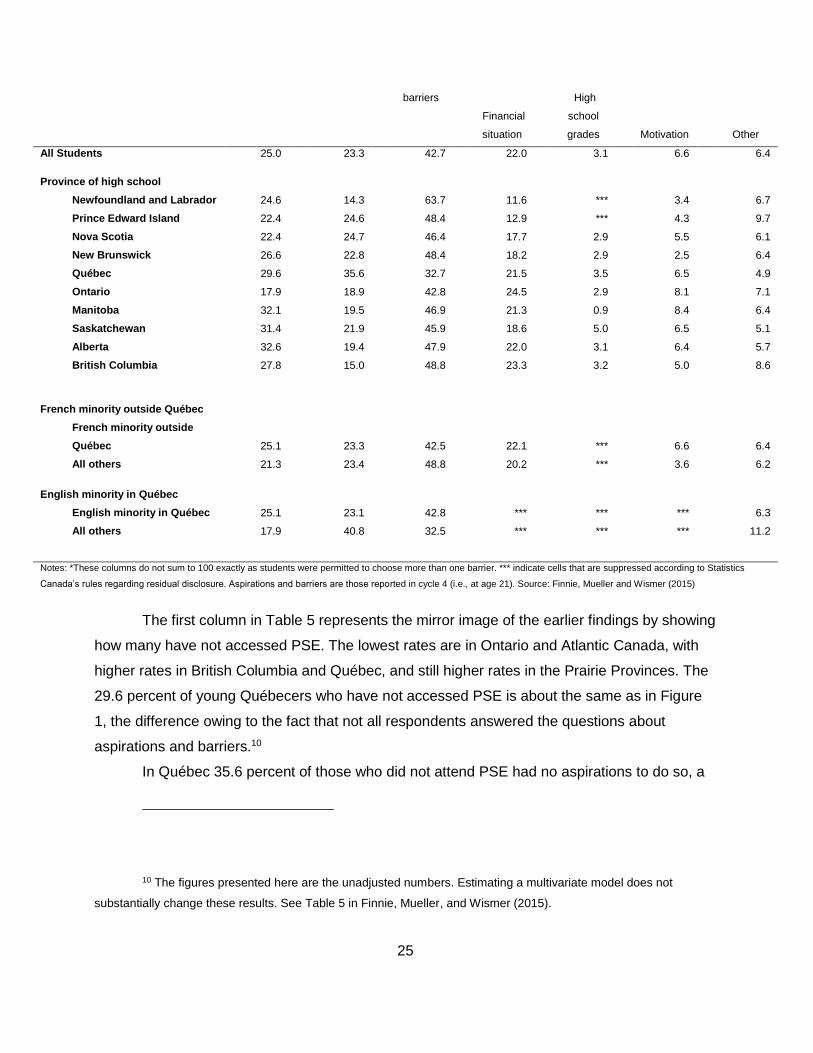
PSE by age 21? Table 5 shows these results. Note that multiple answers to the barriers
question are allowed and thus totals do not add up to 100%.
Table 5: Barriers to Post-secondary Education, Canadian Youths Who
Have Not Accessed Post-secondary Education by Age 21
Has not
accessed
PSE
Has not
accessed
PSE
% of total
Has no
PSE
aspirations
Has PSE
aspirations
Has no Has barriers
25
barriers
Financial
situation
High
school
grades Motivation Other
All Students 25.0
23.3
42.7
22.0
3.1
6.6
6.4
Province of high school
Newfoundland and Labrador 24.6
14.3
63.7
11.6
***
3.4
6.7
Prince Edward Island 22.4
24.6
48.4
12.9
***
4.3
9.7
Nova Scotia 22.4
24.7
46.4
17.7
2.9
5.5
6.1
New Brunswick 26.6
22.8
48.4
18.2
2.9
2.5
6.4
Québec 29.6
35.6
32.7
21.5
3.5
6.5
4.9
Ontario 17.9
18.9
42.8
24.5
2.9
8.1
7.1
Manitoba 32.1
19.5
46.9
21.3
0.9
8.4
6.4
Saskatchewan 31.4
21.9
45.9
18.6
5.0
6.5
5.1
Alberta 32.6
19.4
47.9
22.0
3.1
6.4
5.7
British Columbia 27.8
15.0
48.8
23.3
3.2
5.0
8.6
French minority outside Québec
French minority outside
Québec 25.1
23.3
42.5
22.1
***
6.6
6.4
All others 21.3
23.4
48.8
20.2
***
3.6
6.2
English minority in Québec
English minority in Québec 25.1
23.1
42.8
***
***
***
6.3
All others 17.9
40.8
32.5
***
***
***
11.2
Notes: *These columns do not sum to 100 exactly as students were permitted to choose more than one barrier. *** indicate cells that are suppressed according to Statistics
Canada’s rules regarding residual disclosure. Aspirations and barriers are those reported in cycle 4 (i.e., at age 21). Source: Finnie, Mueller and Wismer (2015)
The first column in Table 5 represents the mirror image of the earlier findings by showing
how many have not accessed PSE. The lowest rates are in Ontario and Atlantic Canada, with
higher rates in British Columbia and Québec, and still higher rates in the Prairie Provinces. The
29.6 percent of young Québecers who have not accessed PSE is about the same as in Figure
1, the difference owing to the fact that not all respondents answered the questions about
aspirations and barriers.10
In Québec 35.6 percent of those who did not attend PSE had no aspirations to do so, a
10 The figures presented here are the unadjusted numbers. Estimating a multivariate model does not
substantially change these results. See Table 5 in Finnie, Mueller, and Wismer (2015).
26
figure that is about 50 percent higher than the 23.3 percent for all provinces taken together.
Conversely, only 32.7 percent claim no barriers, compared to a national average of 42.7
percent. Curiously, when asked specifically about the barriers they faced, young Québecers
gave responses similar to the national averages. For example, of the 29.6 percent of young
Québecers who have not attended PSE, 21.5 percent selected financial barriers as one reason
for not attending. A simple calculation (21.5 percent x 29.6 percent) reveals that only 6.5
percent of the young people surveyed were not attending PSE because of a financial barrier.
This is only modestly higher than the Canadian average of 5.5 percent (i.e., 25.0 percent who
have not attended x 22.0 percent who claim a financial barrier).
Also of note for Québec is that only 25.1 percent of the English minority have not
attended PSE by the age of 21. Of these, 23.1 percent had no aspirations to attend PSE.
Another 42.8 percent of Anglophones in Québec who had not attended, stated they did have
PSE aspirations and no barriers to attending. All of these figures are very close to the national
averages. Similarly, Francophones residing outside of Québec also placed close to the national
average in each of these three metrics.
IV. Conclusion
This analysis has used the uniquely rich Canadian YITS-A dataset to provide a new and
original perspective on PSE participation patterns in Québec compared to other regions in
Canada. Consistent with other recent work by the authors and others, the results generally point
to the importance of cultural, rather than financial, factors in determining whether a young
person attends PSE, perhaps best illustrated by the much stronger effect of parental education
on access to PSE as compared to family income, and how immigrant children go to PSE at
much higher rates than non-immigrant children (although the breakdown in this pattern for more
recent immigrants to Québec is noted).
These cultural factors can be difficult to define, hard to measure, and are often
questioned by economists who favour the standard human capital model. While the human
capital model has much to offer in terms of our understanding of access to PSE, it is not all-
encompassing and should not be viewed as such. This is not to say that money is not important,
and drastically raising tuition fees, for example, especially for those at lower income levels, or
cutting student financial aid, would almost certainly have a profound effect on attendance.
But as a recent Senate of Canada (2011:1) concludes:
Our knowledge of the key factors that influence participation and achievement
27
in PSE has also grown considerably. It is now acknowledged that non-financial
obstacles such as preparation for school, student motivation, and parental
influence are as significant as cost. In fact, the cost of PSE becomes an issue
only if these non-financial barriers are overcome in the first place.
The policy implications of these findings are important.
Our findings thus have important policy implications, including from a fiscal perspective.
They point to new opportunities and challenges alike for policy makers wanting to increase, and
make more equal, opportunities for going on to PSE, especially for disadvantaged youth.
The policy challenge becomes identifying how PSE access opportunities can be
improved when cultural influences appear to be so important, and implementing policies that
accomplish this.
The opportunity is that the fiscal room needed to put such programs into place could be
found by shifting from the total focus on keeping tuition effectively frozen at the (then) already
low 1990 levels for all students. For example, moderate fee increases could be gradually
implemented for students from higher income families even while retaining low fees (or even
cutting further) for youth from low income families who need the assistance, and ploughing the
additional revenue into new, more effective access programs.
The other side of this opportunity is that some of the most effective ways of increasing
PSE participation rates, especially at the university level, might not be all that costly. Perhaps,
for example, programs could be put into place whereby youth – especially disadvantaged youth
– are taken for visits to college and (particularly) university campuses starting early, possibly in
primary school, so that these institutions and the PSE opportunities they represent become
something they know and are brought into their effective choice sets in a way that does not
currently happen.
At the same time, those currently attending PSE could go back to their old schools to
talk about their experiences and further breathe life into the possibilities of PSE.
Academic support programs – again at an early age – may also play a key role. Better
career counselling services could be put in place. Peer group/mentoring programs could
possibly be initiated. Helping students prepare application forms for PSE when the time
approaches may be part of a solution.
Gandara, 2001 has provided a typology for classifying and ordering policies of this type,
while Orders and Duquette, 2010 have provided a review of policies that have been attempted
to these ends in a number of OECD countries. While we have much to learn, what we do know

28
is that equalising PSE opportunities is central to equalising life chances for children in care, that
“culture” is probably critical to this, and policy has to follow in this vein. The result could be
policies that are both more equitable and more effective.
29
References
Coelli, M. 2009. “Tuition Fees and Equality of University Enrolment”, Canadian Journal of
Economics, 42(3).
Finnie, R. 2005. “Access and Capacity in the Canadian Post-Secondary Education System: A
Policy Discussion Framework”, in Anisef, P. & R. Sweet, Eds. Preparing for Post-
Secondary Education: New Roles for Governments and Families. Montreal and
Kingston: McGill-Queen’s University Press, 2005, pp. 17-54.
Finnie, R., Childs, S., & Wismer, A. 2011a. Access to Postsecondary Education: How Ontario
Compares. Toronto: Higher Education Quality Council of Ontario.
Finnie, R., Childs, S., & Wismer, A. 2011b. Under-Represented Groups in Postsecondary
Education in Ontario: Evidence from the Youth in Transition Survey. Toronto: Higher
Education Quality Council of Ontario.
Finnie, R., Frenette, M., Mueller, R.E., & Sweetman A. Eds. 2010. Pursuing Higher Education in
Canada: Economic, Social and Policy Dimensions. Montreal and Kingston: McGill-
Queen’s University Press and School of Policy Studies, Queen’s University.
Finnie, R., & Mueller, R.E. 2008a. “The Effects of Family Income, Parental Education and Other
Background Factors on Access to Post-Secondary Education in Canada: Evidence from
the YITS”, A MESA Project Research Paper. Toronto: Educational Policy Institute.
Finnie, R., & Mueller, R.E. 2008b. “The Backgrounds of Canadian Youth and Access to Post-
Secondary Education: New Evidence from the Youth in Transition Survey”, in Who
Goes? Who Stays? What Matters? Accessing and Persisting in Post-Secondary
Education in Canada. Ed. Finnie, R., Mueller, R.E., Sweetman, A., & Usher, A. Montreal
and Kingston: McGill-Queen’s University Press, 79-107.
Finnie, R., & Mueller, R.E. 2009. Access to post-secondary education in Canada among the
children of Canadian immigrants. A MESA Project Research Paper. Toronto:
Educational Policy Institute.
Finnie, R., & Mueller, R.E. 2010. They came, they saw, they enrolled: Access to post-secondary
education by the children of Canadian immigrants. In R. Finnie, M. Frenette, R.E.
Mueller, and A. Sweetman (Eds.), Pursuing higher education in Canada: Economic,
social and policy dimensions (pp. 191-216). Montreal and Kingston: McGill–Queen’s
University Press.
Finnie, R., Mueller, R.E., & Sweetman A. 2014. “Beyond Financial Considerations: Culture and
30
Access to Canadian Post-Secondary Education”, Public Sector Digest, June.
Finnie, R., Mueller, R.E., & Sweetman, A. 2016. “The Cultural Determinants of Access to Post-
Secondary (Higher) Education in Canada: Empirical Evidence and Policy Implications”,
in B. Jongbloed & Vossensteyn, H., Eds. Access and Expansion Post-Massification:
Opportunities and Barriers to Further Growth in Higher Education Participation. London
and New York: Routledge, 150-178.
Finnie, R., Mueller, R.E., Sweetman, A., & Usher, A., Eds. 2008. Who Goes? Who Stays? What
Matters? Accessing and Persisting in Post-Secondary Education in Canada. Montreal
and Kingston: McGill-Queen’s University Press.
Finnie, R., Mueller, R.E., & Wismer A. 2015. “Access and Barriers to Post-secondary Education
in Canada: Evidence from the YITS”, Canadian Journal of Higher Education 45(2), 229-
62.
Finnie, R., Sweetman, A., & Usher, A. 2008. “Introduction: A Framework for Thinking about
Participation in Post-Secondary Education”, in Who Goes? Who Stays? What Matters?
Accessing and Persisting in Post-Secondary Education in Canada. Ed. Finnie, R.,
Mueller, R.E., Sweetman, A., & Usher, A.. Montreal and Kingston: McGill-Queen’s
University Press, 3-32.
Gándara, P. (2001). “Paving the Way to Post-Secondary Education: K-12 Intervention Programs
for Underrepresented Youth”. Report of the National Post-Secondary Education
Cooperative Working Group on Access to Post-Secondary Education. Washington, DC,
National Center for Education Statistics.
Mueller, R.E. 2008a. “Access and Persistence of Students from Low income Backgrounds in
Canadian Post-Secondary Education: What We Know, What We Don’t Know, and Why it
Matters”, in Who Goes? Who Stays? What Matters? Accessing and Persisting in Post-
Secondary Education in Canada. Ed. Finnie, R., Mueller, R.E., Sweetman, A., & Usher,
A.. Montreal and Kingston: McGill-Queen’s University Press, 33-62.
Mueller, R.E. 2008b. “Access and Persistence of Students from Low income Backgrounds in
Canadian Post-Secondary Education: A Review of the Literature”. MESA Project
Research Paper 2008-1. Toronto, ON: Canadian Education Project.
Neill, C. 2009. “Tuition fees and the demand for university places”. Economics of Education
Review 28, 561-570.
31
Orders, Shari and Cheryll Duquette (2010), “Enhancing Access to Post-Secondary Education in
Canada: An Exploration of Early Intervention Initiatives in Selected Countries”, CPRN
Research Report, Ottawa.
Senate of Canada. 2011. Opening the Door: Reducing the Barriers to Post-Secondary
Education in Canada. Ottawa: Standing Senate Committee on Social Affairs, Science
and Technology.
Shaienks, D., Gluszynski, T., & Bayard, J. 2008. “Postsecondary Education – Participation and
Dropping Out: Differences Across University, College and Other Types of Postsecondary
Institutions”. Culture, Tourism and the Centre for Education Statistics Research Papers,
Statistics Canada Catalogue no. 81-595-M — No. 070
Appendix
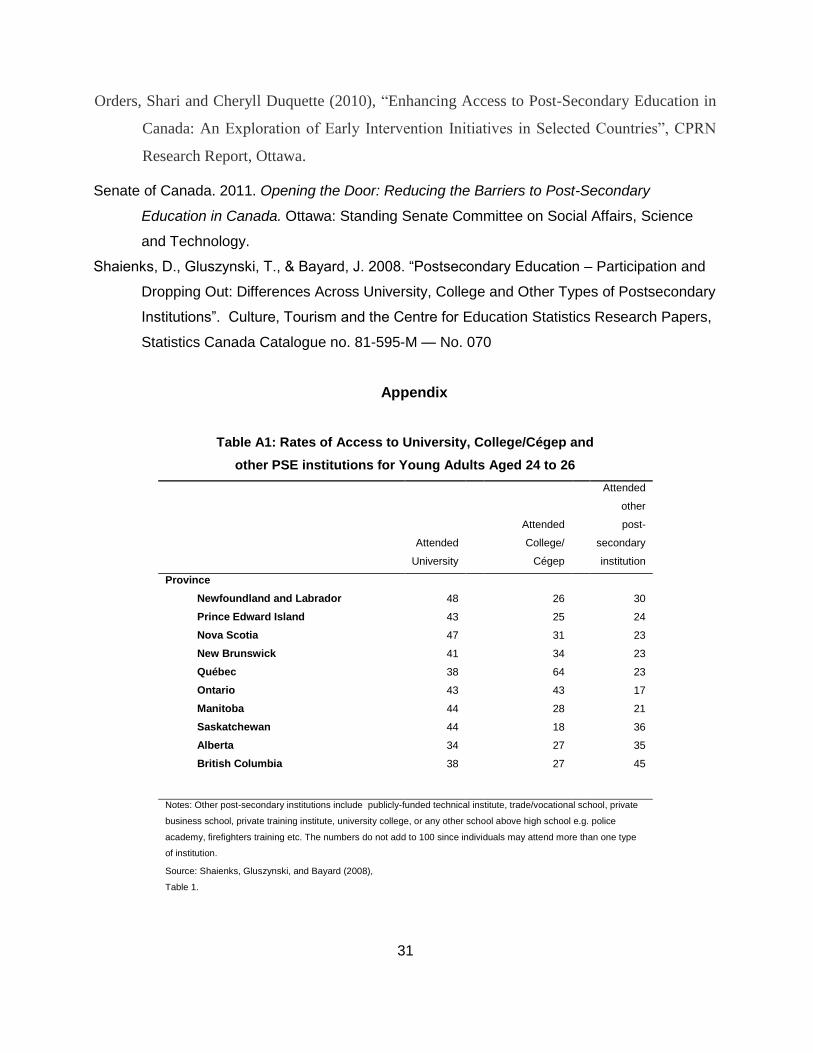
Table A1: Rates of Access to University, College/Cégep and
other PSE institutions for Young Adults Aged 24 to 26
Attended
University
Attended
College/
Cégep
Attended
other
post-
secondary
institution
Province
Newfoundland and Labrador 48
26
30
Prince Edward Island 43
25
24
Nova Scotia 47
31
23
New Brunswick 41
34
23
Québec 38
64
23
Ontario 43
43
17
Manitoba 44
28
21
Saskatchewan 44
18
36
Alberta 34
27
35
British Columbia 38
27
45
Notes: Other post-secondary institutions include publicly-funded technical institute, trade/vocational school, private
business school, private training institute, university college, or any other school above high school e.g. police
academy, firefighters training etc. The numbers do not add to 100 since individuals may attend more than one type
of institution.
Source: Shaienks, Gluszynski, and Bayard (2008),
Table 1.