Embed Size (px)
Citation preview

1
Accessible Surface Area from NMR Chemical Shifts
(Supplementary Information)
Noor E. Hafsa1, David Arndt1, David S. Wishart1, 2*
1Department of Computing Science, University of Alberta, Edmonton, Canada
2Department of Biological Sciences, University of Alberta, Edmonton, Canada
Keywords: nuclear magnetic resonance; chemical-‐shifts; machine learning; accessible surface area
2
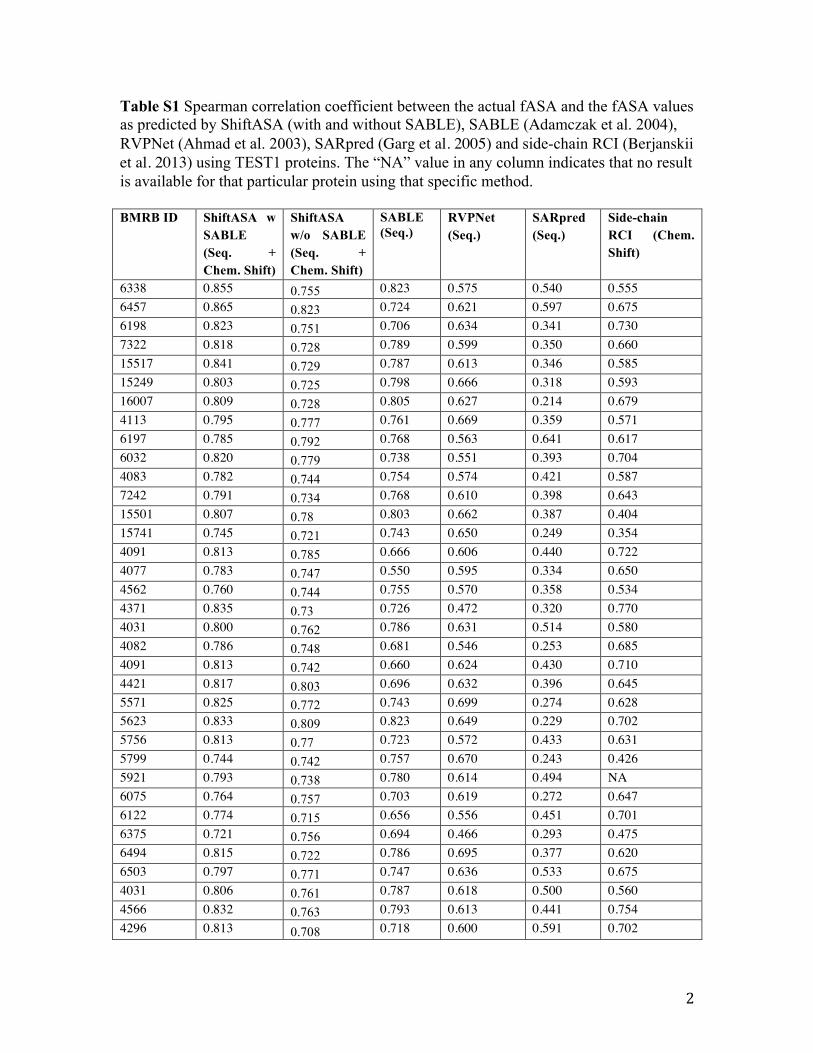
Table S1 Spearman correlation coefficient between the actual fASA and the fASA values as predicted by ShiftASA (with and without SABLE), SABLE (Adamczak et al. 2004), RVPNet (Ahmad et al. 2003), SARpred (Garg et al. 2005) and side-chain RCI (Berjanskii et al. 2013) using TEST1 proteins. The “NA” value in any column indicates that no result is available for that particular protein using that specific method.
BMRB ID ShiftASA w SABLE (Seq. + Chem. Shift)
ShiftASA w/o SABLE (Seq. + Chem. Shift)
SABLE (Seq.)
RVPNet (Seq.)
SARpred (Seq.)
Side-chain RCI (Chem. Shift)
6338 0.855 0.755 0.823 0.575 0.540 0.555 6457 0.865 0.823 0.724 0.621 0.597 0.675 6198 0.823 0.751 0.706 0.634 0.341 0.730 7322 0.818 0.728 0.789 0.599 0.350 0.660 15517 0.841 0.729 0.787 0.613 0.346 0.585 15249 0.803 0.725 0.798 0.666 0.318 0.593 16007 0.809 0.728 0.805 0.627 0.214 0.679 4113 0.795 0.777 0.761 0.669 0.359 0.571 6197 0.785 0.792 0.768 0.563 0.641 0.617 6032 0.820 0.779 0.738 0.551 0.393 0.704 4083 0.782 0.744 0.754 0.574 0.421 0.587 7242 0.791 0.734 0.768 0.610 0.398 0.643 15501 0.807 0.78 0.803 0.662 0.387 0.404 15741 0.745 0.721 0.743 0.650 0.249 0.354 4091 0.813 0.785 0.666 0.606 0.440 0.722 4077 0.783 0.747 0.550 0.595 0.334 0.650 4562 0.760 0.744 0.755 0.570 0.358 0.534 4371 0.835 0.73 0.726 0.472 0.320 0.770 4031 0.800 0.762 0.786 0.631 0.514 0.580 4082 0.786 0.748 0.681 0.546 0.253 0.685 4091 0.813 0.742 0.660 0.624 0.430 0.710 4421 0.817 0.803 0.696 0.632 0.396 0.645 5571 0.825 0.772 0.743 0.699 0.274 0.628 5623 0.833 0.809 0.823 0.649 0.229 0.702 5756 0.813 0.77 0.723 0.572 0.433 0.631 5799 0.744 0.742 0.757 0.670 0.243 0.426 5921 0.793 0.738 0.780 0.614 0.494 NA 6075 0.764 0.757 0.703 0.619 0.272 0.647 6122 0.774 0.715 0.656 0.556 0.451 0.701 6375 0.721 0.756 0.694 0.466 0.293 0.475 6494 0.815 0.722 0.786 0.695 0.377 0.620 6503 0.797 0.771 0.747 0.636 0.533 0.675 4031 0.806 0.761 0.787 0.618 0.500 0.560 4566 0.832 0.763 0.793 0.613 0.441 0.754 4296 0.813 0.708 0.718 0.600 0.591 0.702

3
Table S1 cont’d
BMRB ID ShiftASA w SABLE (Seq. + Chem. Shift)
ShiftASA w/o SABLE (Seq. + Chem. Shift)
SABLE (Seq.)
RVPNet (Seq.)
SARpred (Seq.)
Side-chain RCI (Chem. Shift)
4094 0.740 0.715 0.653 0.508 0.329 0.594 4019 0.778 0.746 0.653 0.639 0.315 0.551 5211 0.811 0.776 0.775 0.548 0.489 0.514 1062 0.805 0.746 0.757 0.581 0.524 0.684 6776 0.815 0.773 0.755 0.560 0.471 0.589 6575 0.851 0.789 0.781 0.544 0.430 0.657 7086 0.833 0.758 0.802 0.644 -0.464 0.663 4077 0.779 0.743 0.704 0.602 0.317 0.652 10096 0.742 0.754 0.763 0.574 0.214 0.246 4717 0.745 0.69 0.682 0.584 0.223 0.602 7086 0.832 0.746 0.821 0.648 0.323 0.649 6122 0.772 0.75 0.634 0.505 0.450 0.694 4717 0.786 0.735 0.753 0.568 0.284 0.643 5540 0.802 0.803 0.707 0.676 0.263 0.654 5571 0.797 0.786 0.707 0.676 0.263 0.613 5529 0.703 0.747 0.575 0.561 0.362 0.522 4039 0.772 0.747 0.708 0.523 0.350 0.605 4041 0.781 0.76 0.708 0.523 0.350 0.595 4554 0.781 0.769 0.822 0.654 0.371 0.318 5740 0.808 0.777 0.832 0.657 0.372 0.516 15084 0.822 0.774 0.667 0.643 0.352 0.607 15854 0.789 0.76 0.667 0.598 0.352 0.570 5387 0.734 0.734 0.548 0.507 0.642 0.523 6779 0.746 0.746 0.558 0.630 0.380 0.555 5226 0.764 0.777 0.678 0.660 0.561 0.633 6019 0.836 0.826 0.788 0.663 0.533 0.701 5286 0.741 0.784 0.737 0.657 0.519 0.248 6541 0.75 0.752 0.737 0.657 0.519 0.580 15650 0.731 0.743 0.756 0.624 0.464 0.223 15852 0.722 0.754 0.740 0.615 0.455 0.287 Average
0.79 0.76 0.73 0.60 0.38 0.59

4
Table S2 Normalized weighting coefficients (|w|) of chemical-shift and sequence-derived features are listed. (i-1) and (i+1) in parentheses represents the neighbor residue locations, whereas (i) indicates the central residue. The feature name abbreviations are as follows: ProbBCS = β-strand probability using chemical shift, ProbHCS = α-helix probability using chemical shift, ProbCCS = coil probability using chemical shift, hydro = residue-specific hydrophobicity, scon = residue conservation score, BackBoneRCI = Random Coil Index (protein flexibility) from backbone chemical shifts, SideChainRCI = Random Coil Index from side-chain chemical shifts, and sable = SABLE predicted real-value solvent accessibility.
Feature Weighting coefficient, |w| ProbBCS(i-1) 1.114 ProbBCS(i) 2.465
ProbBCS(i+1) 0.849 ProbHCS(i-1) 0.860 ProbHCS(i) 2.541
ProbHCS(i+1) 1.692 ProbCCS(i-1) 1.089 ProbCCS(i) 1.577
ProbCCS(i+1) 2.294 hydro(i-1) 0.651 hydro(i) 3.557
hydro(i+1) 0.579 scon(i-1) 1.063 scon(i) 1.355
scon(i+1) 1.316 BackBoneRCI(i-1) 3.164 BackBoneRCI(i) 5.381
BackBoneRCI(i+1) 1.947 SideChainRCI(i-1) 1.124 SideChainRCI(i) 27.482
SideChainRCI(i+1) 0.839 sable(i-1) 0.560 sable(i) 35.991
sable(i+1) 0.505

5
Figure Legend
Figure S1 Spearman correlation between observed and predicted ASA for TEST1
proteins using both sequence and chemical shift features [Hydrophobicity, RCI,
secondary structure probability and conservation score and SABLE] (blue circles),
sequence only [Hydrophobicity, conservation score and SABLE predicted ASA] (red
triangles) and chemical shift only [RCI (backbone and side-chain) and secondary
structure probability] (green diamonds). The average correlation between observed and
predicted ASA using combined features is 0.79 over all TEST1 proteins, whereas the
average correlation using sequence-only features is 0.60 and 0.46 when using chemical-
shift-only features. As seen in Fig. S2, the low correlation when using only chemical
shifts is attributable to incomplete chemical shift assignments.
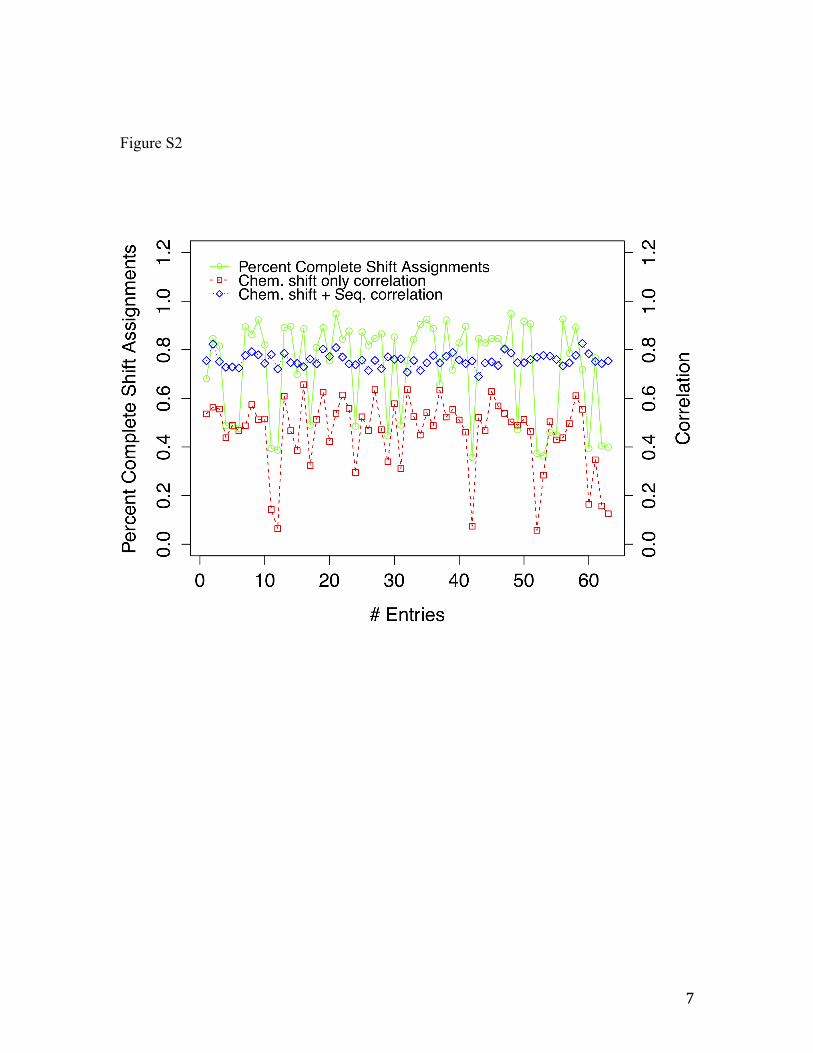
Figure S2 Percent complete chemical shift assignments, scaled in 0.0-1.0 (green circles)
vs. Spearman’s rank correlation coefficients (red diamonds and blue triangles) for the
TEST1 set. This graph indicates that the chemical shift and sequence-based estimation
error is relatively insensitive to complete shift assignments, whereas only chemical shift-
based correlation shows a relatively high sensitivity (Pearson correlation coefficient of
0.75) to the shift assignment completeness.
Figure S3 Standard deviation of ASA values in the test set for 20 different amino acids
(blue circles) and prediction error (MAE) (red triangles) are shown. A strong correlation
(Pearson correlation coefficient =0.92) is observed between the variance of observed
ASA in the test data and the associated ASA prediction error for different amino acids.
Figure S4 The relationship between fASA range vs. prediction error (MAE) (blue
triangles) and ASA range vs. sample training size (red circle) is depicted. The prediction
error increases (red line), as the number of observations (blue line) decreases in the
training data.

6
Figure S1
7
Figure S2

8
Figure S3

9
Figure S4
ASA Range
MAE
0−0.1 0.2−0.3 0.4−0.5 0.6−0.7 0.8−0.9
0.00
0.05
0.10
0.15
0.20
0.25
0.30
0.35
0.00
0.05
0.10
0.15
0.20
0.25
0.30
0.35
Trai
ning
Fra
ctio
ns
MAETraining Fractions