Embed Size (px)
Citation preview
Ia
ASa
b
c
a
ARR2AA
KTSTEC
1
dwltuv(2
aS
h00
Accident Analysis and Prevention 98 (2017) 46–56
Contents lists available at ScienceDirect
Accident Analysis and Prevention
jou rn al hom ep age: www.elsev ier .com/ locate /aap
n search of the severity dimension of traffic events: Extended Delta-Vs a traffic conflict indicator
liaksei Laureshyna,b,∗, Tim De Ceunyncka,c, Christoffer Karlssona, Åse Svenssona,tijn Danielsc
Transport and Roads, Department of Technology and Society,Faculty of Engineering, LTH Lund University, Box 118,SE-22100 Lund, SwedenInstitute of Transport Economics, Gaustadalléen 21,NO-0349 Oslo, NorwayTransportation Research Institute, Hasselt University, Wetenschapspark 5, bus 6,BE-3590 Diepenbeek, Belgium
r t i c l e i n f o
rticle history:eceived 18 February 2016eceived in revised form2 September 2016ccepted 23 September 2016vailable online 28 September 2016
eywords:raffic safetyurrogate safety measuresraffic conflictsxtended delta-Vrash severity
a b s t r a c t
Most existing traffic conflict indicators do not sufficiently take into account the severity of the injuriesresulting from a collision had it occurred. Thus far, most of the indicators that have been developedexpress the severity of a traffic encounter as their proximity to a collision in terms of time or space.
This paper presents the theoretical framework and the first implementation of Extended Delta-V as ameasure of traffic conflict severity in site-based observations. It is derived from the concept of Delta-V asit is applied in crash reconstructions, which refers to the change of velocity experienced by a road userduring a crash. The concept of Delta-V is recognised as an important predictor of crash outcome severity.
The paper explains how the measure is operationalised within the context of traffic conflict observa-tions. The Extended Delta-V traffic conflict measure integrates the proximity to a crash as well as theoutcome severity in the event a crash would have taken place, which are both important dimensions indefining the severity of a traffic event. The results from a case study are presented in which a number oftraffic conflict indicators are calculated for interactions between left turning vehicles and vehicles driv-
ing straight through a signalised intersection. The results suggest that the Extended Delta-V indicatorseems to perform well at selecting the most severe traffic events. The paper discusses how the indicatorovercomes a number of limitations of traditional measures of conflict severity. While this is a promisingfirst step towards operationalising an improved measure of traffic conflict severity, additional researchis needed to further develop and validate the indicator.© 2016 The Author(s). Published by Elsevier Ltd. This is an open access article under the CC BY-NC-ND
. Introduction
Traditionally, road safety analyses have relied mostly on crashata as their primary data source. Crash data, however, have someell-known limitations from an analytical point of view. These
imitations include their relatively low frequency, leading to sta-istical issues related to small data samples, (unevenly distributed)nder-reporting of crashes and the limited information they pro-ide on behavioural and environmental aspects of the crashes
Laureshyn et al., 2010; Svensson and Hydén, 2006; Tarko et al.,009). These issues limit the possibilities for drawing inferences∗ Corresponding author at: Transport and Roads, Department of Technologynd Society,Faculty of Engineering, LTH Lund University, Box 118,SE-22100 Lund,weden.
E-mail address: [email protected] (A. Laureshyn).
ttp://dx.doi.org/10.1016/j.aap.2016.09.026001-4575/© 2016 The Author(s). Published by Elsevier Ltd. This is an open access article/).
license (http://creativecommons.org/licenses/by-nc-nd/4.0/).
about the causality of the crashes and how they can be preventedin the future (Davis, 2004; Elvik, 2007; Hauer, 2010; Tarko, 2012).
Therefore, a number of researchers argue that road safetyanalyses can strongly benefit from reliable methods that utiliseobservable non-crash events as a surrogate or a complement tocrashes (Laureshyn et al., 2010; Tarko et al., 2009). The idea behindthis is that traffic can be seen as a number of elementary eventsthat differ in their degree of severity (unsafety), and that a rela-tionship exists between the frequency and the severity of the events(Svensson and Hydén, 2006). Different concepts describing this ideahave emerged over the years. Hydén (1987) describes this rela-tionship with a ‘safety pyramid’, where the base of the pyramidis formed by normal traffic encounters that are quite safe and fre-quent, while the tip of the pyramid contains the most severe events,
such as crashes resulting in injuries or fatalities, that are highlyinfrequent. Other researchers, such as Glauz and Migletz (1980)and Svensson (1998), also consider the events of the lowest severity(‘perfectly safe’ events) to be quite rare, too. They state that it is theunder the CC BY-NC-ND license (http://creativecommons.org/licenses/by-nc-nd/4.

lysis and Prevention 98 (2017) 46–56 47
euaethtoitaflcL
c1MiiHirtsiiisottttaw1cq1utpc
t
12
3
s
2
2
soott
A. Laureshyn et al. / Accident Ana
vents of moderate severity that are most frequent, because roadsers aim at optimising their behaviour in respect to both safetynd mobility. This explains the preference for encounters of mod-rate severity because accepting smaller gaps can lead to gains inravel time (Svensson, 1998). A common ground of all concepts is,owever, that the less severe traffic events: i) are more frequenthan crashes; and ii) have an interdependency with crashes that,nce it is sufficiently understood, can be used to estimate risk andnfer causes of traffic crashes without having to observe crasheshemselves. There is, indeed, a bulk of literature suggesting that
strong correlation exists between the frequency of ‘serious con-icts’ (though defined in a variety of ways) and the frequency ofrashes (Brown, 1994; El-Basyouny and Sayed, 2013; Hydén, 1987;ord, 1996; Migletz et al., 1985; Sacchi et al., 2013).
The literature reveals that dozens of traffic conflict severity indi-ators have been developed over the past decades (Allen et al.,978; Hayward, 1972; Kraay et al., 1986; Laureshyn et al., 2010;inderhoud and Bovy, 2001; Zheng et al., 2014). Most of these
ndicators express the severity of a traffic encounter as its prox-mity to a crash in terms of time or space (Zheng et al., 2014).owever, proximity to a crash is only one dimension of ‘sever-
ty’. Intuitively, getting close to a collision that would likely haveesulted in a slight touch should not be considered as severe as get-ing equally close to a collision that would likely have resulted in aevere injury. Therefore, the potential severity of the consequencesn the event that a crash would have taken place needs to be takennto account in some way (Laureshyn et al., 2010). According tonitiatives such as Vision Zero, policymakers and road designershould strive towards a traffic system without fatalities or seri-us injuries (Johansson, 2009). The primary goal of Vision Zero is,herefore, to avoid severe crashes, rather than all crashes. Thus, theraffic conflict severity calculated from an indicator should expresshe proximity to a serious/fatal injury rather than the proximityo a crash alone. Very few of the existing traffic conflict indicatorsnd techniques take the outcome severity into account in someay. For example, the Swedish Traffic Conflict Technique (Hydén,
987) uses both the proximity in time and the speed at which theonflict takes place, which indirectly reflects the possible conse-uences. The Dutch technique, DOCTOR (van der Horst and Kraay,986), and the Canadian Traffic Conflict Technique (Brown, 1994)se a subjective score for potential consequences that is added tohe objective nearness-in-time indicator(s). However, these exam-les are exceptions and the ways they combine the probability of aollision and its consequences are not completely problem-free.
In order to develop a traffic conflict severity indicator that meetshis suggested definition, three questions need to be addressed:
) How can we measure the proximity of an encounter to a crash?) How can we measure the consequences in the event a crash
would have taken place?) How can we weigh both elements together?
These three questions will be addressed in the following sub-ections.
. Extended delta-V as a measure of traffic conflict severity
.1. How to measure nearness-to-collision?
As indicated, the nearness to a collision has been studied exten-ively, since most traffic conflict indicators are exclusively based
n some measure of proximity in time or space. From a method-logical perspective, the time-based measures are preferred, sincehey are the result of a combination of road users’ speeds and dis-ances (Laureshyn et al., 2010). One of the most frequently usedFig. 1. Simplified illustration of the T2 concept. Detailed calculations that take intoaccount the dimensions of the road users can be found in Laureshyn et al. (2010).
indicators in traffic conflict studies is Time-to-Collision (TTC). TTCis defined as ‘the time until a collision between the vehicles wouldoccur if they continued on their present course at their presentrates’ (Hayward, 1972). In the Swedish traffic conflict technique,the TTC value at the moment of the evasive action start (TA, Time-to-Accident) together with the driving speed define the severity ofa traffic conflict (Hydén, 1987), while the minimum value of theTime-to-Collision (TTCmin) during an encounter is used as a part ofthe DOCTOR technique (van der Horst and Kraay, 1986). In manyrecent studies using automated traffic conflict observations (Auteyet al., 2012; Ismail et al., 2010; Sayed et al., 2013), TTCmin has alsobeen commonly used as a traffic conflict indicator.
Post-encroachment time (PET) is applicable in situations wheretwo road users pass the ‘conflict zone’ with a time margin (Allenet al., 1978). It is defined as the time between the first road userleaving the ‘conflict zone’ and the second one arriving at it. A PETvalue equal to zero indicates no margin, i.e. a crash.
In order for a crash to take place, a collision course of the tworoad users is a pre-condition; without it, a collision is not possi-ble. However, encounters without a collision course might havecrash potential as well, since even minor changes in the spatial ortemporal relationships between the road users can lead to a colli-sion course. This means that the use of TTC alone is not sufficientfor detecting all potentially dangerous situations. This is also sup-ported by the observations of the actual conflicts in traffic (van derHorst, 1990). Svensson (1998) noticed that in situations where twovehicle drivers were about to miss each other by a very short timemargin, their evasive behaviour was the same as if they were ona collision course. In other words, even though there was strictlyspeaking no collision course, the drivers perceived and acted asif they were on a collision course. Laureshyn et al. (2010), in anattempt of studying in detail the process of traffic conflicts, notedthat an interaction between two road users could smoothly switchfrom being a collision course event to being a non-collision courseevent, and vice versa. Since this was a result of very minor (andreversible) speed changes, it appears counter-intuitive if the dan-gerousness of the situation would change dramatically from onetime instance to the next. Also, it was noted that in fact the major-ity of the situations that a trained conflict observer would selectas conflicts and having a collision course had in fact small timemargins revealed if more accurate tools for speed and positionmeasurements were used (Laureshyn et al., 2016).
Therefore, measures used to describe the severity of any inter-action should be flexible enough to include both the collisioncourse and non-collision course state, and allow a smooth trans-fer between both. The indicator T2 suggested by Laureshyn et al.(2010) is an attempt to fill this gap. T2 describes the expected timefor the second (latest) road user to arrive at the conflict point, given
unchanged speeds and ‘planned’ trajectories (see Fig. 1). If the roadusers are on a collision course, T2 equals TTC. In the event that thetwo road users pass the conflict point with a time margin, T2 reflectsthe maximum time available to take evasive actions and alleviate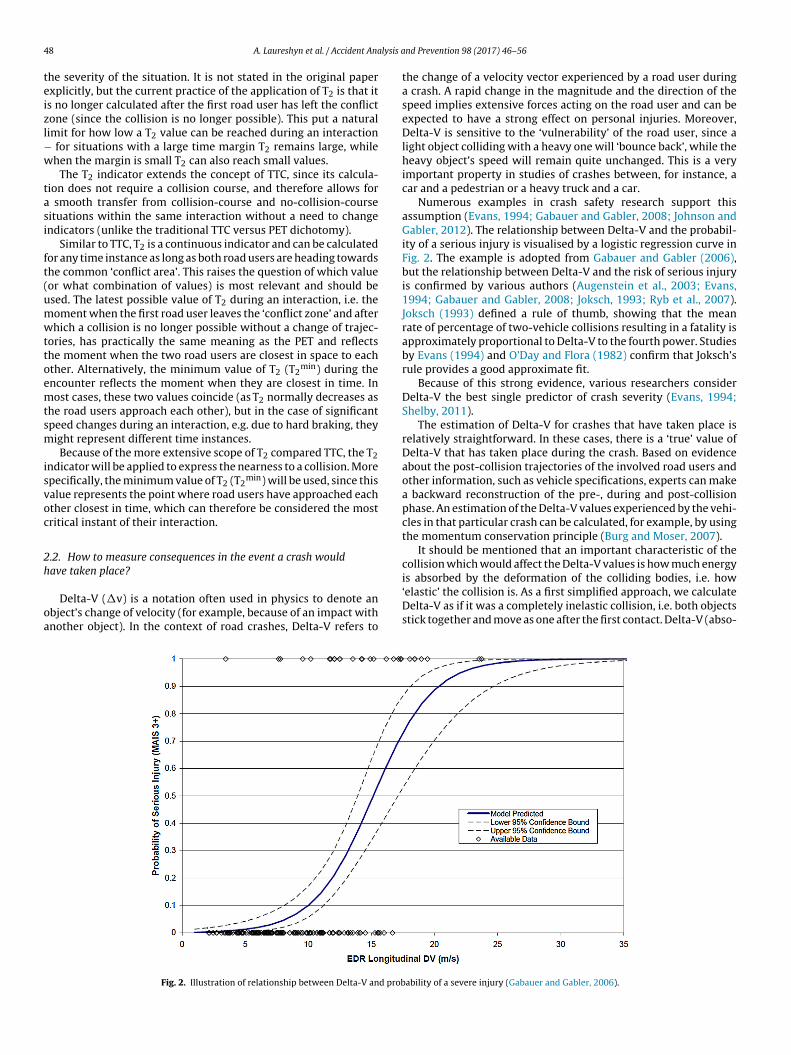
4 lysis a
teizl−w
tasi
ft(umwttoemtsm
isvoc
2h
oa
8 A. Laureshyn et al. / Accident Ana
he severity of the situation. It is not stated in the original paperxplicitly, but the current practice of the application of T2 is that its no longer calculated after the first road user has left the conflictone (since the collision is no longer possible). This put a naturalimit for how low a T2 value can be reached during an interaction
for situations with a large time margin T2 remains large, whilehen the margin is small T2 can also reach small values.
The T2 indicator extends the concept of TTC, since its calcula-ion does not require a collision course, and therefore allows for
smooth transfer from collision-course and no-collision-courseituations within the same interaction without a need to changendicators (unlike the traditional TTC versus PET dichotomy).
Similar to TTC, T2 is a continuous indicator and can be calculatedor any time instance as long as both road users are heading towardshe common ‘conflict area’. This raises the question of which valueor what combination of values) is most relevant and should besed. The latest possible value of T2 during an interaction, i.e. theoment when the first road user leaves the ‘conflict zone’ and afterhich a collision is no longer possible without a change of trajec-
ories, has practically the same meaning as the PET and reflectshe moment when the two road users are closest in space to eachther. Alternatively, the minimum value of T2 (T2
min) during thencounter reflects the moment when they are closest in time. Inost cases, these two values coincide (as T2 normally decreases as
he road users approach each other), but in the case of significantpeed changes during an interaction, e.g. due to hard braking, theyight represent different time instances.Because of the more extensive scope of T2 compared TTC, the T2
ndicator will be applied to express the nearness to a collision. Morepecifically, the minimum value of T2 (T2
min) will be used, since thisalue represents the point where road users have approached eachther closest in time, which can therefore be considered the mostritical instant of their interaction.
.2. How to measure consequences in the event a crash wouldave taken place?
Delta-V (�v) is a notation often used in physics to denote anbject’s change of velocity (for example, because of an impact withnother object). In the context of road crashes, Delta-V refers to
Fig. 2. Illustration of relationship between Delta-V and prob
nd Prevention 98 (2017) 46–56
the change of a velocity vector experienced by a road user duringa crash. A rapid change in the magnitude and the direction of thespeed implies extensive forces acting on the road user and can beexpected to have a strong effect on personal injuries. Moreover,Delta-V is sensitive to the ‘vulnerability’ of the road user, since alight object colliding with a heavy one will ‘bounce back’, while theheavy object’s speed will remain quite unchanged. This is a veryimportant property in studies of crashes between, for instance, acar and a pedestrian or a heavy truck and a car.
Numerous examples in crash safety research support thisassumption (Evans, 1994; Gabauer and Gabler, 2008; Johnson andGabler, 2012). The relationship between Delta-V and the probabil-ity of a serious injury is visualised by a logistic regression curve inFig. 2. The example is adopted from Gabauer and Gabler (2006),but the relationship between Delta-V and the risk of serious injuryis confirmed by various authors (Augenstein et al., 2003; Evans,1994; Gabauer and Gabler, 2008; Joksch, 1993; Ryb et al., 2007).Joksch (1993) defined a rule of thumb, showing that the meanrate of percentage of two-vehicle collisions resulting in a fatality isapproximately proportional to Delta-V to the fourth power. Studiesby Evans (1994) and O’Day and Flora (1982) confirm that Joksch’srule provides a good approximate fit.
Because of this strong evidence, various researchers considerDelta-V the best single predictor of crash severity (Evans, 1994;Shelby, 2011).
The estimation of Delta-V for crashes that have taken place isrelatively straightforward. In these cases, there is a ‘true’ value ofDelta-V that has taken place during the crash. Based on evidenceabout the post-collision trajectories of the involved road users andother information, such as vehicle specifications, experts can makea backward reconstruction of the pre-, during and post-collisionphase. An estimation of the Delta-V values experienced by the vehi-cles in that particular crash can be calculated, for example, by usingthe momentum conservation principle (Burg and Moser, 2007).
It should be mentioned that an important characteristic of thecollision which would affect the Delta-V values is how much energy
is absorbed by the deformation of the colliding bodies, i.e. how‘elastic’ the collision is. As a first simplified approach, we calculateDelta-V as if it was a completely inelastic collision, i.e. both objectsstick together and move as one after the first contact. Delta-V (abso-ability of a severe injury (Gabauer and Gabler, 2006).

A. Laureshyn et al. / Accident Analysis and Prevention 98 (2017) 46–56 49
( + )
ΔΔ
le (inelastic collision, i.e. two objects “stick together” after the first contact).
lb
�
�
w
i
flHmDah‘aaidap
ry(tpthhtmiiec(tets
cons
eque
nces
'Exp
ecte
d' D
elta
-V, m
/s
T2min, sec.
severity levels
nearness to collision
Fig. 3. Calculation of Delta-V based on momentum conservation princip
ute values) for two road users involved in an inelastic collision cane calculated (see Fig. 3):
v1 = m2
m1 + m2·√
v21 + v2
2 − 2v1v2 cos ̨ and
v2 = m1
m1 + m2·√
v21 + v2
2 − 2v1v2 cos ˛
here m1, m2–the masses of the road users 1 and 2 respectively,v1, v2–their speeds,� − the approach angle.Since each road user has its own Delta-V value, to describe the
nteraction severity the highest value can be used.The problem in applying this concept of Delta-V for traffic con-
ict studies is that no ‘true’ Delta-V value has manifested itself.owever, when assumptions are made about the road users’ futureovements, it is possible to calculate a hypothetical or ‘expected’elta-V value that would have emerged from a crash. For example,ssuming that both vehicles will crash with the same speed as theyave at a certain moment during an interaction, their respective
expected’ Delta-V values can be estimated. This, however, creates number of issues to resolve: i) the ‘expected Delta-V’ becomes continuous variable that can be calculated for each instant dur-ng the interaction; and ii) for every instant during the interaction,ifferent values can be calculated based on the assumptions thatre made about how the interaction will develop (primarily, if thelanned paths and speed will stay the same or change).
Delta-V has not been applied as a traffic conflict indicator untilecently when it was incorporated into the automated conflict anal-sis algorithms of the Surrogate Safety Assessment Model (SSAM)Gettman et al., 2008; Shelby, 2011). It is measured by calculatinghe expected change in velocity between the pre- and post-crashhase of the road users involved in the conflict assuming a hypo-hetical collision of the two road users at the angle and velocity theyave at the moment TTCmin takes place. However, this approachas a number of limitations, particularly when applied on trajec-ory data observed in field rather than generated by a microscopic
odel. Firstly, the use of TTCmin as the time at which Delta-Vs estimated limits its application to interactions in which theres a collision course only. As mentioned in the previous section,xperience from field observation studies learns that many (evenlose) encounters in traffic do not have an actual collision courseLaureshyn et al., 2016; Svensson, 1998). Secondly, in this form,
he indicator only represents the potential outcome severity in thevent an accident would have taken place, but it does not includehe nearness to a collision. An event with a large TTCmin value ofeveral seconds can therefore have the same calculated value as aFig. 4. Conceptual illustration of the main dimensions of conflict severity.
very close interaction with a TTCmin less than one second. Becauseof this, it is less suitable as a stand-alone indicator to distinguishsevere from non-severe events in traffic. It has been acknowledgedthat the implementation of Delta-V in SSAM still needs substantialimprovements (Shelby, 2011) and leads to some counter-intuitiveresults in experiments (Zha et al., 2014).
A framework that extends to non-collision course events istherefore to be preferred. The use of T2
min instead of TTCmin asthe basis for expressing the nearness to a collision in our indicatorovercomes this limitation. To overcome the second limitation, thenearness to a collision and the estimated severity of the outcome inthe event an accident would have taken place should be weighedtogether into a single indicator.
2.3. Extended delta-V − an attempt to weigh nearness andpotential outcome severity
Fig. 4 conceptually plots the two main dimensions of trafficconflict severity that have been identified in the previous sections(T2
min and ‘expected’ Delta-V at the same time instant). Quite intu-itively, the severity of an encounter increases as the T2
min valuegoes down (as the road users are closer to a collision) and as the‘expected’ Delta-V value goes up (as the consequences can be moresevere). Encounters that combine a low T2
min value and a high‘expected’ Delta-V value can be considered very dangerous situ-
ations. The “severity level”-lines represent the events of “equalseverity”. How exactly the “severity” can be calculated requiresclarifications.
50 A. Laureshyn et al. / Accident Analysis and Prevention 98 (2017) 46–56
t (only
aiascta
v
w
suhITtt
ebwwsa
Fig. 5. Screenshot T-Analys
The problem of the ‘expected’ Delta-V is that it assumes a crasht the current speeds of the involved road users and does not takento account any available opportunity to take an evasive actionnd decrease the consequences of the hypothetical collision. Weuggest a new severity indicator − Extended Delta-V − that is cal-ulated with speeds that are reduced based on the assumption thathe two road users spent the time available to brake before arrivingt the collision point. The final speed, v, is then calculated as
={
v0 − at, if (v0 − at) ≥ 0;
0, if (v0 − at) < 0,
here v0 is the initial speed;a is the assumed deceleration rate;t − time remaining for the evasive manoeuvre.The definition of the time available is quite straightforward in
ituations with a collision course; here, the current TTC value can besed. If there is no strict collision course, the two road users actuallyave different times until they arrive at the potential collision point.
n this context, it is the time for the latest-to-arrive road user, i.e.2 indicator, that appears to be most relevant, as it is objectivelyhe maximal available time until a collision may happen (in casehe first road user would ‘freeze’ at the collision point).
One final point that needs to be addressed is the assumed decel-ration of the involved road users. First of all, it depends on theehaviour of the involved road users. Will they brake in a normal
ay, or will they apply maximum braking force? In this paper, weill test two simplified deceleration assumptions as a first casetudy. We will apply a deceleration of 4 m/s2 for normal braking,nd a deceleration of 8 m/s2 for emergency braking; the latter is a
one camera view shown).
conservative value for maximum deceleration that nearly all auto-mobiles can achieve (Burg and Moser, 2007). These traffic conflictmeasures will be referred to as Extended Delta-V4 and ExtendedDelta-V8, respectively. The base Delta-V values, assuming no brak-ing, will be referred to as Delta-V0.
3. The dataset used to illustrate the concept
As a first test case, an intersection in the city of Minsk (Belarus)was analysed for three full days (6 a.m. till 9 p.m.). The intersectionis a four-leg intersection equipped with classic two-phase trafficlights. Video footage of two cameras, installed at a rooftop close tothe intersection, was used for the analyses.
The videos were analysed using T-Analyst, a semi-automatedvideo analysis tool developed at Lund University (T-Analyst, 2016).The software allows for manually setting up 3D models of roadusers in video images and projecting their position on real-worldcoordinates. In this way, the software allows manual tracking ofroad users in one or more camera views and the calculation ofsome safety indicators such as TTC, Time Advantage, T2 and rel-ative speed (Laureshyn et al., 2010). It allows for dealing with largenumbers of detections in one database. Fig. 5 shows a screenshotof the programme.
For illustrative purposes, it was decided to focus only on situ-ations with a left-turning vehicle approaching from the left-hand
side in the camera view, and a straight-travelling vehicle comingfrom the right-hand side in the camera view. This provided a rela-tively large number of interactions for analysis, while most of theambiguity in defining the ‘planned’ trajectories was avoided.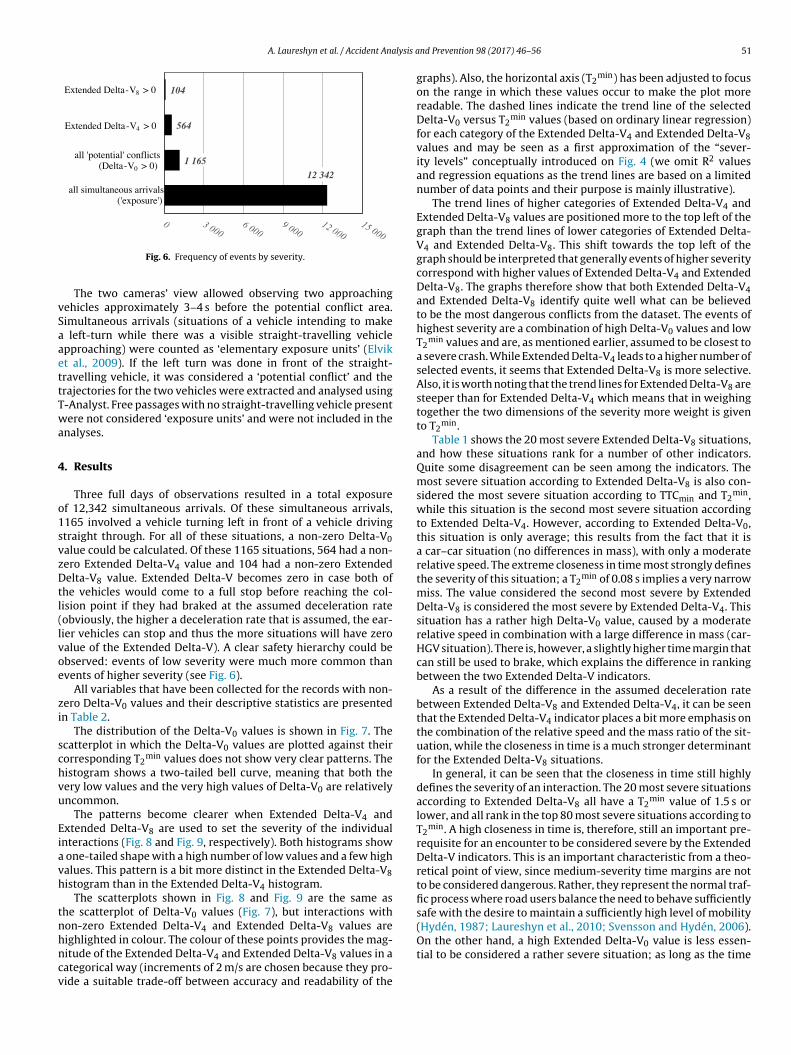
A. Laureshyn et al. / Accident Analysis a
12 342
1 165
564
104Extended Delta -V8 > 0
all simultaneous arrivals('exposure')
all 'potential' conflicts(Delta-V0 > 0)
Extended Delta -V4 > 0
vSaaettTwa
4
o1svzDtl(lvoe
zi
schvu
Eiavh
tnhncv
Fig. 6. Frequency of events by severity.
The two cameras’ view allowed observing two approachingehicles approximately 3–4 s before the potential conflict area.imultaneous arrivals (situations of a vehicle intending to make
left-turn while there was a visible straight-travelling vehiclepproaching) were counted as ‘elementary exposure units’ (Elvikt al., 2009). If the left turn was done in front of the straight-ravelling vehicle, it was considered a ‘potential conflict’ and therajectories for the two vehicles were extracted and analysed using-Analyst. Free passages with no straight-travelling vehicle presentere not considered ‘exposure units’ and were not included in the
nalyses.
. Results
Three full days of observations resulted in a total exposuref 12,342 simultaneous arrivals. Of these simultaneous arrivals,165 involved a vehicle turning left in front of a vehicle drivingtraight through. For all of these situations, a non-zero Delta-V0alue could be calculated. Of these 1165 situations, 564 had a non-ero Extended Delta-V4 value and 104 had a non-zero Extendedelta-V8 value. Extended Delta-V becomes zero in case both of
he vehicles would come to a full stop before reaching the col-ision point if they had braked at the assumed deceleration rateobviously, the higher a deceleration rate that is assumed, the ear-ier vehicles can stop and thus the more situations will have zeroalue of the Extended Delta-V). A clear safety hierarchy could bebserved: events of low severity were much more common thanvents of higher severity (see Fig. 6).
All variables that have been collected for the records with non-ero Delta-V0 values and their descriptive statistics are presentedn Table 2.
The distribution of the Delta-V0 values is shown in Fig. 7. Thecatterplot in which the Delta-V0 values are plotted against theirorresponding T2
min values does not show very clear patterns. Theistogram shows a two-tailed bell curve, meaning that both theery low values and the very high values of Delta-V0 are relativelyncommon.
The patterns become clearer when Extended Delta-V4 andxtended Delta-V8 are used to set the severity of the individualnteractions (Fig. 8 and Fig. 9, respectively). Both histograms show
one-tailed shape with a high number of low values and a few highalues. This pattern is a bit more distinct in the Extended Delta-V8istogram than in the Extended Delta-V4 histogram.
The scatterplots shown in Fig. 8 and Fig. 9 are the same ashe scatterplot of Delta-V0 values (Fig. 7), but interactions withon-zero Extended Delta-V4 and Extended Delta-V8 values are
ighlighted in colour. The colour of these points provides the mag-itude of the Extended Delta-V4 and Extended Delta-V8 values in aategorical way (increments of 2 m/s are chosen because they pro-ide a suitable trade-off between accuracy and readability of thend Prevention 98 (2017) 46–56 51
graphs). Also, the horizontal axis (T2min) has been adjusted to focus
on the range in which these values occur to make the plot morereadable. The dashed lines indicate the trend line of the selectedDelta-V0 versus T2
min values (based on ordinary linear regression)for each category of the Extended Delta-V4 and Extended Delta-V8values and may be seen as a first approximation of the “sever-ity levels” conceptually introduced on Fig. 4 (we omit R2 valuesand regression equations as the trend lines are based on a limitednumber of data points and their purpose is mainly illustrative).
The trend lines of higher categories of Extended Delta-V4 andExtended Delta-V8 values are positioned more to the top left of thegraph than the trend lines of lower categories of Extended Delta-V4 and Extended Delta-V8. This shift towards the top left of thegraph should be interpreted that generally events of higher severitycorrespond with higher values of Extended Delta-V4 and ExtendedDelta-V8. The graphs therefore show that both Extended Delta-V4and Extended Delta-V8 identify quite well what can be believedto be the most dangerous conflicts from the dataset. The events ofhighest severity are a combination of high Delta-V0 values and lowT2
min values and are, as mentioned earlier, assumed to be closest toa severe crash. While Extended Delta-V4 leads to a higher number ofselected events, it seems that Extended Delta-V8 is more selective.Also, it is worth noting that the trend lines for Extended Delta-V8 aresteeper than for Extended Delta-V4 which means that in weighingtogether the two dimensions of the severity more weight is givento T2
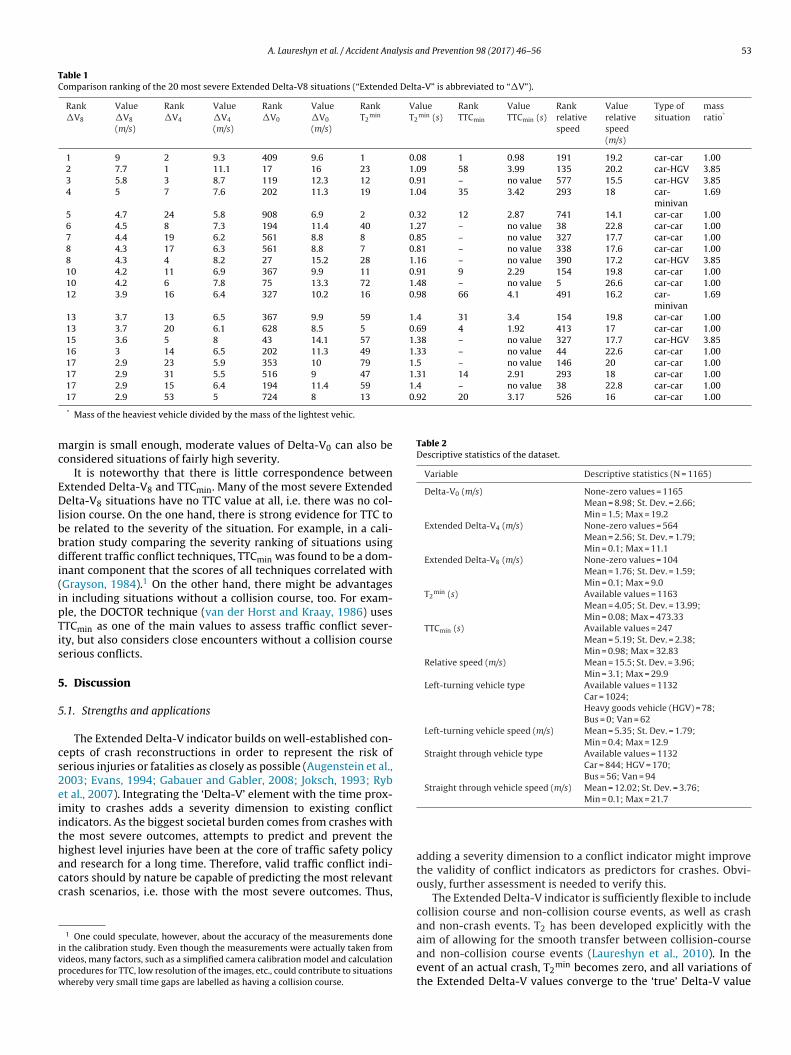
min.Table 1 shows the 20 most severe Extended Delta-V8 situations,
and how these situations rank for a number of other indicators.Quite some disagreement can be seen among the indicators. Themost severe situation according to Extended Delta-V8 is also con-sidered the most severe situation according to TTCmin and T2
min,while this situation is the second most severe situation accordingto Extended Delta-V4. However, according to Extended Delta-V0,this situation is only average; this results from the fact that it isa car–car situation (no differences in mass), with only a moderaterelative speed. The extreme closeness in time most strongly definesthe severity of this situation; a T2
min of 0.08 s implies a very narrowmiss. The value considered the second most severe by ExtendedDelta-V8 is considered the most severe by Extended Delta-V4. Thissituation has a rather high Delta-V0 value, caused by a moderaterelative speed in combination with a large difference in mass (car-HGV situation). There is, however, a slightly higher time margin thatcan still be used to brake, which explains the difference in rankingbetween the two Extended Delta-V indicators.
As a result of the difference in the assumed deceleration ratebetween Extended Delta-V8 and Extended Delta-V4, it can be seenthat the Extended Delta-V4 indicator places a bit more emphasis onthe combination of the relative speed and the mass ratio of the sit-uation, while the closeness in time is a much stronger determinantfor the Extended Delta-V8 situations.
In general, it can be seen that the closeness in time still highlydefines the severity of an interaction. The 20 most severe situationsaccording to Extended Delta-V8 all have a T2
min value of 1.5 s orlower, and all rank in the top 80 most severe situations according toT2
min. A high closeness in time is, therefore, still an important pre-requisite for an encounter to be considered severe by the ExtendedDelta-V indicators. This is an important characteristic from a theo-retical point of view, since medium-severity time margins are notto be considered dangerous. Rather, they represent the normal traf-fic process where road users balance the need to behave sufficientlysafe with the desire to maintain a sufficiently high level of mobility(Hydén, 1987; Laureshyn et al., 2010; Svensson and Hydén, 2006).
On the other hand, a high Extended Delta-V0 value is less essen-tial to be considered a rather severe situation; as long as the time
52 A. Laureshyn et al. / Accident Analysis and Prevention 98 (2017) 46–56
0
50
100
150
200
250
1 2 3 4 5 6 7 8 9 10 11 12 13 14 15 16 17 18 19 20M
ore
Fre
quen
cy
Delta-V0 (m/s )
N = 1,165
0
2
4
6
8
10
12
14
16
18
20
0 2 4 6 8 10
Del
ta- V
0( m
/s)
T2min (sec. )
a) b)
Fig. 7. Delta-V0 values: a) histogram; b) scatterplot against T2min.b.
a) b)
0
20
40
60
80
100
120
140
1 2 3 4 5 6 7 8 9 10
Mor
e
Fre
quen
cy
Extended Delta-V4 (m/s)
N = 564
0
2
4
6
8
10
12
14
16
18
20
0 1 2 3 4 5
Del
ta-V
0(m
/s)
T2min (sec.)
0 < Extended Delta-V4 < 2
2 < Extended Delta-V4 < 4
4 < Extended Delta-V4 < 6
6 <Extended Delta-V4
Fig. 8. Extended Delta-V4 values: a) histogram; b) marked on Delta-V0 scatterplot.
Fig. 9. Extended Delta-V8 values: a) histogram; b) marked on Delta-V0 scatterplot.
A. Laureshyn et al. / Accident Analysis and Prevention 98 (2017) 46–56 53
Table 1Comparison ranking of the 20 most severe Extended Delta-V8 situations (“Extended Delta-V” is abbreviated to “�V”).
Rank�V8
Value�V8
(m/s)
Rank�V4
Value�V4
(m/s)
Rank�V0
Value�V0
(m/s)
RankT2
minValueT2
min (s)RankTTCmin
ValueTTCmin (s)
Rankrelativespeed
Valuerelativespeed(m/s)
Type ofsituation
massratio*
1 9 2 9.3 409 9.6 1 0.08 1 0.98 191 19.2 car-car 1.002 7.7 1 11.1 17 16 23 1.09 58 3.99 135 20.2 car-HGV 3.853 5.8 3 8.7 119 12.3 12 0.91 – no value 577 15.5 car-HGV 3.854 5 7 7.6 202 11.3 19 1.04 35 3.42 293 18 car-
minivan1.69
5 4.7 24 5.8 908 6.9 2 0.32 12 2.87 741 14.1 car-car 1.006 4.5 8 7.3 194 11.4 40 1.27 – no value 38 22.8 car-car 1.007 4.4 19 6.2 561 8.8 8 0.85 – no value 327 17.7 car-car 1.008 4.3 17 6.3 561 8.8 7 0.81 – no value 338 17.6 car-car 1.008 4.3 4 8.2 27 15.2 28 1.16 – no value 390 17.2 car-HGV 3.8510 4.2 11 6.9 367 9.9 11 0.91 9 2.29 154 19.8 car-car 1.0010 4.2 6 7.8 75 13.3 72 1.48 – no value 5 26.6 car-car 1.0012 3.9 16 6.4 327 10.2 16 0.98 66 4.1 491 16.2 car-
minivan1.69
13 3.7 13 6.5 367 9.9 59 1.4 31 3.4 154 19.8 car-car 1.0013 3.7 20 6.1 628 8.5 5 0.69 4 1.92 413 17 car-car 1.0015 3.6 5 8 43 14.1 57 1.38 – no value 327 17.7 car-HGV 3.8516 3 14 6.5 202 11.3 49 1.33 – no value 44 22.6 car-car 1.0017 2.9 23 5.9 353 10 79 1.5 – no value 146 20 car-car 1.0017 2.9 31 5.5 516 9 47 1.31 14 2.91 293 18 car-car 1.0017 2.9 15 6.4 194 11.4 59 1.4 – no value 38 22.8 car-car 1.00
0.92 20 3.17 526 16 car-car 1.00
mc
EDlbbdi(ipTis
5
5
cs2eiithacc
ivpw
Table 2Descriptive statistics of the dataset.
Variable Descriptive statistics (N = 1165)
Delta-V0 (m/s) None-zero values = 1165Mean = 8.98; St. Dev. = 2.66;Min = 1.5; Max = 19.2
Extended Delta-V4 (m/s) None-zero values = 564Mean = 2.56; St. Dev. = 1.79;Min = 0.1; Max = 11.1
Extended Delta-V8 (m/s) None-zero values = 104Mean = 1.76; St. Dev. = 1.59;Min = 0.1; Max = 9.0
T2min (s) Available values = 1163
Mean = 4.05; St. Dev. = 13.99;Min = 0.08; Max = 473.33
TTCmin (s) Available values = 247Mean = 5.19; St. Dev. = 2.38;Min = 0.98; Max = 32.83
Relative speed (m/s) Mean = 15.5; St. Dev. = 3.96;Min = 3.1; Max = 29.9
Left-turning vehicle type Available values = 1132Car = 1024;Heavy goods vehicle (HGV) = 78;Bus = 0; Van = 62
Left-turning vehicle speed (m/s) Mean = 5.35; St. Dev. = 1.79;Min = 0.4; Max = 12.9
Straight through vehicle type Available values = 1132Car = 844; HGV = 170;Bus = 56; Van = 94
Straight through vehicle speed (m/s) Mean = 12.02; St. Dev. = 3.76;
17 2.9 53 5 724 8 13
* Mass of the heaviest vehicle divided by the mass of the lightest vehic.
argin is small enough, moderate values of Delta-V0 can also beonsidered situations of fairly high severity.
It is noteworthy that there is little correspondence betweenxtended Delta-V8 and TTCmin. Many of the most severe Extendedelta-V8 situations have no TTC value at all, i.e. there was no col-
ision course. On the one hand, there is strong evidence for TTC toe related to the severity of the situation. For example, in a cali-ration study comparing the severity ranking of situations usingifferent traffic conflict techniques, TTCmin was found to be a dom-
nant component that the scores of all techniques correlated withGrayson, 1984).1 On the other hand, there might be advantagesn including situations without a collision course, too. For exam-le, the DOCTOR technique (van der Horst and Kraay, 1986) usesTCmin as one of the main values to assess traffic conflict sever-ty, but also considers close encounters without a collision courseerious conflicts.
. Discussion
.1. Strengths and applications
The Extended Delta-V indicator builds on well-established con-epts of crash reconstructions in order to represent the risk oferious injuries or fatalities as closely as possible (Augenstein et al.,003; Evans, 1994; Gabauer and Gabler, 2008; Joksch, 1993; Rybt al., 2007). Integrating the ‘Delta-V’ element with the time prox-mity to crashes adds a severity dimension to existing conflictndicators. As the biggest societal burden comes from crashes withhe most severe outcomes, attempts to predict and prevent theighest level injuries have been at the core of traffic safety policy
nd research for a long time. Therefore, valid traffic conflict indi-ators should by nature be capable of predicting the most relevantrash scenarios, i.e. those with the most severe outcomes. Thus,1 One could speculate, however, about the accuracy of the measurements donen the calibration study. Even though the measurements were actually taken fromideos, many factors, such as a simplified camera calibration model and calculationrocedures for TTC, low resolution of the images, etc., could contribute to situationshereby very small time gaps are labelled as having a collision course.
Min = 0.1; Max = 21.7
adding a severity dimension to a conflict indicator might improvethe validity of conflict indicators as predictors for crashes. Obvi-ously, further assessment is needed to verify this.
The Extended Delta-V indicator is sufficiently flexible to includecollision course and non-collision course events, as well as crashand non-crash events. T2 has been developed explicitly with theaim of allowing for the smooth transfer between collision-course
and non-collision course events (Laureshyn et al., 2010). In theevent of an actual crash, T2min becomes zero, and all variations ofthe Extended Delta-V values converge to the ‘true’ Delta-V value

5 lysis a
ettosuam
csaptlh(ccdso
craGt2
5
Eas
1
2
3
4
4 A. Laureshyn et al. / Accident Ana
xperienced by the vehicles involved in the actual crash. This seemso make the indicator flexible enough to cover the whole spec-rum of safety relevant situations, ranging from normal encountersver serious conflicts up to and including crashes. This is a majortrength of the developed indicator, and it is an adaptation towardsse in real-world observations (that often have no collision course)s well as an extension of the Delta-V concept as it has been imple-ented in microsimulation (Gettman et al., 2008).A noticeable feature of the indicator is that the severity of some
onflicts, those with high Extended Delta-V values, may be con-idered higher than the severity of some actual crashes. Imagine
collision between two cars manoeuvring at very low speeds in aarking lot. In this situation, the risk for a severe injury is low andhe actual Delta-V values that take place during the crash are alsoow. On the other hand, a narrow miss between two vehicles withigh differences in mass and speed is likely to have a much highercalculated) Extended Delta-V value. Although there is no actualrash, the situation is still severe since the road users come verylose to a situation with a high risk of serious injury. However, thisoes make sense if one’s purpose is to assess the severity of a trafficituation, not only in terms of its proximity to a crash, but in termsf its closeness to a serious injury.
The suggested indicator can be used in fully automated trafficonflict analyses, since all required parameters (speeds, trajecto-ies, road user type estimates) can be retrieved from video footage,nd with slight alterations, also from data from other sensors.iven the rapid evolution of the traffic conflict observation domain
owards automated analyses (Laureshyn et al., 2010; Saunier et al.,010), this is an important advantage of the indicator.
.2. Challenges and future research
For reasons of feasibility, this first operationalisation of thextended Delta-V indicator accepted a number of simplifiedssumptions. Making them reflect realistic situations more closelyhould improve the performance of the indicator:
) The assumed braking force is now a constant. The true maximumbraking force, however, depends on the maximum tyre-roadwayfriction which, in turn, depends on the weather, the type andcondition of the pavement, the vehicle type, the type and condi-tion of the tyres, the speed of the vehicle, etc. (Roe et al., 1991;Warner et al., 1983). While it will not be feasible to include allof these aspects (for instance, video footage does not allow forretrieving information about the tyres of the vehicle), a numberof refinements can be introduced;
) While it is expected that Extended Delta-V will especially high-light vulnerable road user (VRU)-related conflicts, the evasiveactions of pedestrians and cyclists are not the same as motorvehicles. For example, cyclists were found to swerve rather thanbrake (Laureshyn et al., 2016) while pedestrians have an abilityto literally stop in a fraction of a second and even change direc-tion to the opposite (jump back). Assumptions of ‘a tyre brakingon dry asphalt’ are definitely not ideal here;
) Only four different vehicle masses were distinguished (car, HGV,bus, minivan). These assumptions can be refined. Informationabout the mass of vehicles can usually be retrieved from variousdatabases. For efficiency reasons, it would be best if the esti-mated mass of vehicles could be retrieved automatically by thevideo analysis software. One possibility could be to relate themass of the vehicle to its length, which is a feature that can be
retrieved automatically relatively easily;) In the current calculations, a completely inelastic collision isassumed. This can be seen as a collision between two clay balls,which will stick together after the point of collision and proceed
nd Prevention 98 (2017) 46–56
along the same post-collision trajectory. While this is a reason-able approximation, in reality, motor vehicle crashes exhibit asomewhat elastic effect, where the vehicles slightly rebound offeach other again (Shelby, 2011). This effect is modelled usinga so-called coefficient of restitution, which equals zero (0.0)for completely inelastic collisions (as was assumed here), andone (1.0) for completely elastic collisions. In practice, low speedcollisions have a coefficient of restitution of around 0.4, whilethis coefficient decreases at higher impact speeds to around 0.1(Nordhoff, 2005);
5) It should be pointed out that, while there is a clear correlationbetween the (actual) Delta-V endured by a road user duringa crash and the likelihood of (severe) injury, the relationshipbetween crash impact and injury outcome is quite complex andthe resulting severity of injuries from a crash are affected bymany factors. For example, elderly vehicle occupants are morelikely than younger occupants to be severely injured in similarcrashes (Evans, 2001; Farmer et al., 1997; Li et al., 2003). Thecrashworthiness of a vehicle (including passive safety systems)also significantly affects the probability and severity of injuriesin a given crash. Additionally, motor vehicles can absorb moreimpact energy in frontal impacts than in side impacts due tothe presence of crumple zones in the front of the vehicle. Occu-pants who are seated more closely to the point of impact have ahigher probability of sustaining severe injuries than occupantsfarther away from the impact point (Evans and Frick, 1988).While some of these aspects could be taken into account whenfurther advancing the conflict indicator, others cannot.
Apart from optimising the theoretical framework and theparameters of the calculation, validation research is needed tocheck whether a traffic conflict indicator can be used as a true mea-sure of safety. This implies that a sufficiently large body of evidencemust be found, showing close correlations between crashes andconflicts. This need for validity research does not only apply to theExtended Delta-V indicator as it was introduced in this paper, butalso to many of the indicators that are applied today (Laureshynet al., 2016; Zheng et al., 2014).
While this paper shows that the applied Extended Delta-V indi-cators allow for ranking the severity of traffic encounters, it is notyet clear how the values should be interpreted from a safety per-spective. For instance, it is unclear whether a border should bedefined between what is considered a serious or a non-serious con-flict, or that the results should be interpreted from a continuousperspective.
One of the approaches in surrogate safety analysis is the use ofextreme value theory, i.e. calculations of probabilities to get veryextreme (having low probability) values of an indicator based onthe distribution of the ‘normal’ values (Songchitruksa and Tarko,2006). For example, if the PET indicator is used, one could formulatethe problem as ‘what is the probability of observing PET < 0 s’, whichmeans a collision. While studying the Delta-Vs from actual colli-sions, one can find a threshold after which severe injuries becomevery probable; however, in the case of a hypothetical ExtendedDelta-V value, it is not clear how the threshold should be defined,and once defined, how it should be interpreted.
The case study only applied to one type of manoeuvre, one typeof intersection, and only to motorised vehicles. It will be necessaryto test the indicator in other circumstances and for other types ofroad users. It will be especially relevant to see how the indicator
will behave when applied to situations with VRUs. Existing trafficconflict techniques are usually optimised for encounters among cardrivers, but are often less suitable for applying to VRUs (Shbeeb,2000).
lysis a
6
sstmcttmasbeaitl
D
Ci
A
Hab
R
A
A
A
BB
D
E
E
E
E
E
E
F
G
G
A. Laureshyn et al. / Accident Ana
. Conclusions
We suggest Extended Delta-V as a measure of traffic conflicteverity that takes into account both proximity to a crash andeverity of its potential consequences. The indicator is applicableo situations in which two road users are heading towards a com-
on conflict area. Extended Delta-V is calculated as the expectedhange of velocity experienced by a road user in the event thathe conflict would have resulted in a crash. The relevant value ishe one that applies to the moment T2
min takes place, which is theoment when the expected time for the last-to-arrive road user to
rrive at the common conflict point becomes minimal. A first casetudy suggests that the indicator succeeds quite well at integratingoth dimensions of conflict severity and selecting the most severevents in traffic. While this is a promising first step towards oper-tionalising an improved traffic conflict indicator, further researchs needed on the development of the indicator itself as well as onhe validity of selected events as predictors for the eventual safetyevel.
eclaimer
This publication reflects only the authors’ view. The Europeanommission is not responsible for any use that may be made of the
nformation it contains.
cknowledgments
This work has received funding from the European Union’sorizon 2020 research and innovation programme under grantgreement No 635895. The data was collected in a project financedy Vinnova, Sweden’s innovation agency.
eferences
llen, B.L., Shin, B.T., Cooper, P.J., 1978. Analysis of traffic conflicts and collisions.Transp. Res. Rec. 667, 67–74.
ugenstein, J., Perdeck, E., Stratton, J., Digges, K., Bahouth, G., 2003. Characteristicsof crashes that increase the risk of serious injuries. Assoc. Adv. Automot. Med.Ann. Proc. 47, 561–576.
utey, J., Sayed, T., Zaki, M.H., 2012. Safety evaluation of right-turn smart channelsusing automated traffic conflict analysis. Accid. Anal. Prevent. 45, 120–130,http://dx.doi.org/10.1016/j.aap.2011.11.015.
rown, G.R., 1994. Traffic conflicts for road user safety studies. Can. J. Civ. Eng.urg, H., Moser, H., 2007. Handbuch verkehrsunfallrekonstruktion −
unfallaufnahme − fahrdynamik − simulation. In: Handbook in AccidentReconstruction. GWV Fachverlage GmbH, Wiesbaden (in German).
avis, G.A., 2004. Possible aggregation biases in road safety research and amechanism approach to accident modeling. Accid. Anal. Prevent. 36 (6),1119–1127, http://dx.doi.org/10.1016/j.aap.2004.04.002.
l-Basyouny, K., Sayed, T., 2013. Safety performance functions using trafficconflicts. Saf. Sci. 51 (1), 160–164, http://dx.doi.org/10.1016/j.ssci.2012.04.015.
lvik, R., Erke, A., Christensen, P., 2009. Elementary units of exposure. In: 88th TRBAnnual Meeting, Washington D. C., USA, January 2009, pp. 11–15.
lvik, R., 2007. Operational criteria of causality for observational road safetyevaluation studies. Transp. Res. Rec: J. Transp. Res. Board 2019, 74–81, http://dx.doi.org/10.3141/2019-10.
vans, L., Frick, M.C., 1988. Seating position in cars and fatality risk. Am. J. PublicHealth 78 (11), 1456–1459, http://dx.doi.org/10.2105/AJPH.78.11.1456.
vans, L., 1994. Driver injury and fatality risk in two-car crashes versus mass ratioinferred using Newtonian mechanics. Accid. Anal. Prevent. 26 (5), 609–616,http://dx.doi.org/10.1016/0001-4575(94)90022-1.
vans, L., 2001. Age and fatality risk from similar severity impacts. J.Traffic Med. 29(1-2), 10–19.
armer, C.M., Braver, E.R., Mitter, E.L., 1997. Two-vehicle side impact crashes: therelationship of vehicle and crash characteristics to injury severity. Accid. Anal.Prevent. 29 (3), 399–406, http://dx.doi.org/10.1016/S0001-4575(97)00006-7.
abauer, D.J., Gabler, H.C., 2006. Comparison of delta-V and occupant impact
velocity crash severity metrics using event data recorders. Assoc. Adv.Automot. Med. Ann. Proc. 50, 57–71.abauer, D.J., Gabler, H.C., 2008. Comparison of roadside crash injury metrics usingevent data recorders. Accid. Anal. Prevent. 40 (2), 548–558, http://dx.doi.org/10.1016/j.aap.2007.08.011.
nd Prevention 98 (2017) 46–56 55
Gettman, D., Pu, L. Sayed, T., Shelby, S., 2008. Surrogate Safety Assessment Modeland Validation. U. S. Department of Transportation Federal HighwayAdministration. Report No. FHWA-HRT-08–051.
Glauz, W.D., Migletz, D.J., 1980. Application of traffic conflict analysis atintersection: Transportation Research Board. Report NCHRP 219.
Grayson, G.B., 1984. The Malmö study: a calibration of traffic conflict techniquesSWOV. R-84–12.
Hauer, E., 2010. Cause, effect and regression in road safety: a case study. Accid.Anal. Prevent. 42 (4), 1128–1135, 16/j.aap.2009.12.027.
Hayward, J.C., 1972. Near-miss determination through use of a scale of danger.Highway Res. Rec. 384, 22–34.
Hydén, C., 1987. The Development of a Method for Traffic Safety Evaluation: theSwedish Traffic Conflict Technique Doctoral Thesis. Lund University,Department of Traffic Planning and Engineering.
Ismail, K., Sayed, T., Saunier, N., 2010. Automated safety analysis using videosensors: technology and case studies. In: Canadian Multidisciplinary RoadSafety Conference, Ontario, Canada.
Johansson, R., 2009. Vision Zero − implementing a policy for traffic safety. Saf. Sci.47, 826–831, http://dx.doi.org/10.1016/j.ssci.2008.10.023.
Johnson, N.S., Gabler, H.C., 2012. Accuracy of a damage-based reconstructionmethod in NHTSA side crash tests. Traffic Inj. Prev. 13 (1), 72–80, http://dx.doi.org/10.1080/15389588.2011.636592.
Joksch, H.C., 1993. Velocity change and fatality risk in a crash − a rule of thumb.Accid. Anal. Prevent. 25 (1), 103–104, http://dx.doi.org/10.1016/0001-4575(93)90102-3.
Kraay, J.H., van der Horst, A.R.A., Oppe, S., 1986. Handleiding voor deconflictobservatietechniek DOCTOR (in Dutch) Manual for conflict observationtechnique DOCTOR SWOV. Report R-86-3.
Laureshyn, A., Svensson, Å., Hydén, C., 2010. Evaluation of traffic safety, based onmicro-level behavioural data: theoretical framework and first implementation.Accid. Anal. Prevent. 42, 1637–1646, http://dx.doi.org/10.1016/j.aap.2010.03.021.
Laureshyn, A., Goede, M.d., Saunier, N., Fyhri, A., 2016. Cross-comparison of threesurrogate safety methods to diagnose cyclist safety problems at intersectionsin Norway. Accid. Anal. Prevent. (in press).
Li, G., Braver, E.R., Chen, L.H., 2003. Fragility versus excessive crash involvement asdeterminants of high death rates per vehicle-mile of travel among olderdrivers. Accid. Anal. Prevent. 35 (2), 227–235.
Lord, D., 1996. Analysis of pedestrian conflicts with left-turning traffic. Transp. Res.Rec. 1538.
Migletz, D.J., Glauz, W.D., Bauer, K.M., 1985. Relationships between traffic conflictsand accidents. U.S. Department of Transportation Federal HighwayAdministration. FHWA/RD-84/042.
Minderhoud, M.M., Bovy, P.H.L., 2001. Extended time-to-collision measures forroad traffic safety assessment. Accid. Anal. Prevent. 33 (1), 89–97, http://dx.doi.org/10.1016/S0001-4575(00)00019-1.
Nordhoff, L.S., 2005. Motor Vehicle Collision Injuries: Biomechanics, Diagnosis, andManagement. Jones & Bartlett Publisher, Sudbury, Massachusetts, USA.
O’Day, J. Flora, J., 1982. Alternative measures of restraint system effectiveness:interaction with crash severity factors SAE International. Technical Paper No.820798.
Roe, P.G., Webster, D.C., West, G., 1991. The Relation Between the Surface Textureof Roads and Accidents. Transport and Road Research Laboratory.
Ryb, G.E., Dischinger, P.C., Kufera, J.A., Burch, C.A., 2007. Delta V, principal directionof force, and restraint use contributions to motor vehicle crash mortality. J.Trauma: Inj. Infect. Crit. Care 63 (5), 1000–1005, http://dx.doi.org/10.1097/TA.0b013e31815885c8.
Sacchi, E., Sayed, T., de Leur, P., 2013. A comparison of collision-based andconflict-based safety evaluations: the case of right-turn smart channels. Accid.Anal. Prevent. 59, 260–266, http://dx.doi.org/10.1016/j.aap.2013.06.002.
Saunier, N., Sayed, T., Ismail, K., 2010. Large scale automated analysis of vehicleinteractions and collisions. Transp. Res. Rec. 2147, 42–50.
Sayed, T., Zaki, M.H., Autey, J., 2013. Automated safety diagnosis of vehicle-bicycleinteractions using computer vision analysis. Saf. Sci. 59, 163–172, http://dx.doi.org/10.1016/j.ssci.2013.05.009.
Shbeeb, L., 2000. Development of a Traffic Conflicts Technique for DifferentEnvironments ? a Comparative Study of Pedestrian Conflicts in Sweden andJordan. Doctoral Thesis. University of Lund, Lund Institute of Technology,Department of Technology and Society, Traffic Engineering.
Shelby, S.G., 2011. Delta-V as a measure of traffic conflict severity. In: 90th TRBAnnual Meeting, Washington DC, USA, 23–27 January 2011.
Songchitruksa, P., Tarko, A., 2006. The extreme value theory approach to safetyestimation. Accid. Anal. Prev. 38, 811–822, http://dx.doi.org/10.1016/j.aap.2006.02.003.
Svensson, Å., 1998. A Method for Analysing the Traffic Process in a SafetyPerspective. Doctoral Thesis. University of Lund, Lund Institute of Technology,Department of Traffic Planning and Engineering.
Svensson, Å., Hydén, C., 2006. Estimating the severity of safety related behaviour.Accid. Anal. Prevent. 38, 379–385, http://dx.doi.org/10.1016/j.aap.2005.10.009.
T-Analyst, 2016. Software for semi-automated video processing www.tft.lth.se/software, (Accessed 18.02.16.).
Tarko, A., Davis, G., Saunier, N., Sayed, T., Washington, S., 2009. White papersurrogate measures of safety.
Tarko, A.P., 2012. Use of crash surrogates and exceedance statistics to estimateroad safety. Accid. Anal. Prevent. 45, 230–240, http://dx.doi.org/10.1016/j.aap.2011.07.008.

5 lysis a
W
Z
Z
van der Horst, R., Kraay, R.J., 1986. The Dutch Conflict Technique −DOCTOR. ICTCTWorkshop, Budapest.
van der Horst, A.R.A., 1990. A Time-based Analysis of Road User Behaviour in
6 A. Laureshyn et al. / Accident Ana
arner, C.Y., Smith, G.C., James, M.B., Germane, G.J., 1983. Friction applications inaccident reconstruction SAE International. Technical Paper No. 830612.
ha, L., Songchitruksa, P., Balke, K.N., 2014. Next Generation Safety Performance
Monitoring at Signalized Intersections Using Connected Vehicle TechnologyTexas A&M Transportation Institute. Report 161303-1.heng, L., Ismail, K., Meng, X., 2014. Traffic conflict techniques for road safetyanalysis: open questions and some insights. Can. J. Civ. Eng. 41 (7), 633–641,http://dx.doi.org/10.1139/cjce-2013-0558.
nd Prevention 98 (2017) 46–56
Normal and Critical Encounters Doctoral Thesis. Delft University of Technology.


![Accident Prevention[ Kalyani ].doc](https://img.pdfslide.net/doc/110x75/55cf8ff7550346703ba1d5df/accident-prevention-kalyani-doc.jpg)