Embed Size (px)
Citation preview
EN EN
EUROPEAN COMMISSION
Brussels, 21.11.2018
SWD(2018) 524 final
COMMISSION STAFF WORKING DOCUMENT
Analysis of the Draft Budgetary Plan of Portugal
Accompanying the document
COMMISSION OPINION
on the Draft Budgetary Plan of Portugal
{C(2018) 8024 final}
1
COMMISSION STAFF WORKING DOCUMENT
Analysis of the Draft Budgetary Plan of Portugal
Accompanying the document
COMMISSION OPINION
on the Draft Budgetary Plan of Portugal
1. INTRODUCTION
Portugal submitted its Draft Budgetary Plan for 2019 on 16 October 2018 in accordance with
Regulation (EU) No 473/2013 of the Two-Pack. Portugal is subject to the preventive arm of
the Pact and should ensure sufficient progress towards its medium term budgetary objective
(MTO).
As the debt ratio was 129.2% of GDP in 2016, exceeding the 60% of GDP reference value,
during the three years following the correction of the excessive deficit Portugal is subject to
the transitional arrangements to make sufficient progress towards compliance with the debt
reduction benchmark.
Section 2 of this document presents the macroeconomic outlook underlying the Draft
Budgetary Plan and provides an assessment based on the Commission 2018 autumn forecast.
The following section presents the recent and planned fiscal developments, according to the
Draft Budgetary Plan, including an analysis of risks to their achievement based on the
Commission 2018 autumn forecast. In particular, it also includes an assessment of the
measures underpinning the Draft Budgetary Plan. Section 4 assesses the recent and planned
fiscal developments in 2018-2019 (also taking into account the risks to their achievement)
against the obligations stemming from the Stability and Growth Pact. Section 5 provides an
analysis of implementation of fiscal-structural reforms in response to the latest country-
specific recommendations in the context of the European Semester adopted by the Council in
July 2018, including those to reduce the tax wedge. Section 6 summarises the main
conclusions of the present document.
2. MACROECONOMIC DEVELOPMENTS UNDERLYING THE DRAFT BUDGETARY PLAN
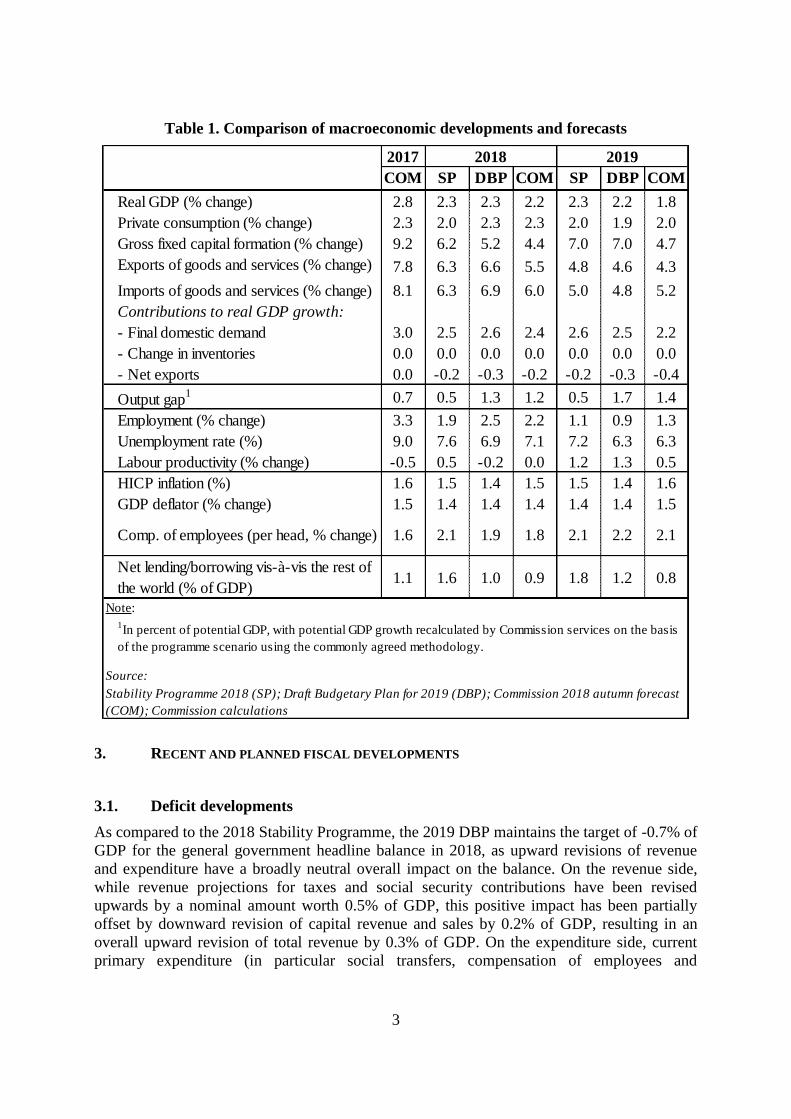
After peaking at a growth rate of GDP of 2.8% in 2017, Portugal's economic expansion is
expected to decelerate to 2.3% in 2018 and 2.2% in 2019, according to the country's 2019
Draft Budgetary Plan (DBP). In this scenario, the overall GDP growth remains broadly
2
unchanged as compared to the macroeconomic projections in the 2018 Stability Programme
where it was set at 2.3% in both 2018 and 2019. However, there has been some change in the
composition of GDP components. The upward revision in private consumption in 2018
reflects a continued increase in disposable income and some deterioration in household
savings. This contrasts with a downward revision in investment due to the postponement of
some investment projects. In 2019, private consumption is expected to decelerate following
some moderation in labour market improvement while investment is forecast to accelerate.
Exports are set to slow down further in line with weaker external demand and the net external
contribution is projected to drag on growth in both 2018 and 2019. At the same time, the
inflation forecast is revised slightly downwards to 1.4% in 2018 and 1.4% in 2019.
The DBP macroeconomic scenario appears broadly consistent with the Commission 2018
autumn forecast for 2018 but more optimistic for 2019. The main difference for 2019
originates from lower investment in the Commission forecast reflecting more negative
assumptions on the external environment and their impact on business dynamics in Portugal.
Net exports are set to have a slightly more negative contribution to growth due to weaker
projections on external demand. The Commission also expects a slightly lower employment
growth in 2018 and 2019. In contrast, private consumption is expected to increase at a slightly
higher rate in the Commission scenario for both 2018 and 2019. The Commission's HICP
inflation forecast is slightly higher in both years, while the GDP deflator is only marginally
higher in 2019.
Overall, the DBP macroeconomic scenario appears plausible in 2018 and favourable in 2019.
The risks are related mostly to the country's vulnerability to potential external shocks.
Box 1: The macro economic forecast underpinning the budget in Portugal
The macroeconomic forecast underlying Portugal's DBP for 2019 has been prepared by the
Department of Planning, Strategy, Evaluation and International Relations within the Ministry
of Finance. The Public Finance Council (Conselho das Finanças Públicas, CFP) assessed and
endorsed the macroeconomic forecast.
The CFP was established through the May 2011 reform of the Budgetary Framework Law
(Article 12-I BFL) as an independent body with a mandate that includes the analysis of
government forecasts.
The endorsement by the CFP is attached to the DBP publication and is available on the
institution's website since the day of the DBP submission to the Commission.
The CFP opinion concludes that the DBP macroeconomic scenario is plausible for 2018 but
favourable for 2019, i.e. it cannot be considered the most probable or a most prudent scenario.
This is due to certain downside risks to economic growth, particularly those related to the
investment projections, which were also considered difficult to fully assess absent a timely
provision of data to the CFP.
3
Table 1. Comparison of macroeconomic developments and forecasts
3. RECENT AND PLANNED FISCAL DEVELOPMENTS
3.1. Deficit developments
As compared to the 2018 Stability Programme, the 2019 DBP maintains the target of -0.7% of
GDP for the general government headline balance in 2018, as upward revisions of revenue
and expenditure have a broadly neutral overall impact on the balance. On the revenue side,
while revenue projections for taxes and social security contributions have been revised
upwards by a nominal amount worth 0.5% of GDP, this positive impact has been partially
offset by downward revision of capital revenue and sales by 0.2% of GDP, resulting in an
overall upward revision of total revenue by 0.3% of GDP. On the expenditure side, current
primary expenditure (in particular social transfers, compensation of employees and
2017
COM SP DBP COM SP DBP COM
Real GDP (% change) 2.8 2.3 2.3 2.2 2.3 2.2 1.8
Private consumption (% change) 2.3 2.0 2.3 2.3 2.0 1.9 2.0
Gross fixed capital formation (% change) 9.2 6.2 5.2 4.4 7.0 7.0 4.7
Exports of goods and services (% change) 7.8 6.3 6.6 5.5 4.8 4.6 4.3
Imports of goods and services (% change) 8.1 6.3 6.9 6.0 5.0 4.8 5.2
Contributions to real GDP growth:
- Final domestic demand 3.0 2.5 2.6 2.4 2.6 2.5 2.2
- Change in inventories 0.0 0.0 0.0 0.0 0.0 0.0 0.0
- Net exports 0.0 -0.2 -0.3 -0.2 -0.2 -0.3 -0.4
Output gap1 0.7 0.5 1.3 1.2 0.5 1.7 1.4
Employment (% change) 3.3 1.9 2.5 2.2 1.1 0.9 1.3
Unemployment rate (%) 9.0 7.6 6.9 7.1 7.2 6.3 6.3
Labour productivity (% change) -0.5 0.5 -0.2 0.0 1.2 1.3 0.5
HICP inflation (%) 1.6 1.5 1.4 1.5 1.5 1.4 1.6
GDP deflator (% change) 1.5 1.4 1.4 1.4 1.4 1.4 1.5
Comp. of employees (per head, % change) 1.6 2.1 1.9 1.8 2.1 2.2 2.1
Net lending/borrowing vis-à-vis the rest of
the world (% of GDP)1.1 1.6 1.0 0.9 1.8 1.2 0.8
Stability Programme 2018 (SP); Draft Budgetary Plan for 2019 (DBP); Commission 2018 autumn forecast
(COM); Commission calculations
Source:
1In percent of potential GDP, with potential GDP growth recalculated by Commission services on the basis
of the programme scenario using the commonly agreed methodology.
Note:
2018 2019
4
intermediate consumption) has been revised upwards by an overall 0.3% of GDP. While
capital expenditure has remained broadly stable, a downward revision by around 0.2% of
GDP in gross fixed capital formation has been broadly offset by an upward revision in other
capital expenditure. Similarly, the Commission 2018 autumn forecast projects a deficit of
0.7% of GDP for 2018. Compared to the 2019 DBP, the Commission autumn forecast
projects a slightly higher current expenditure, in particular for compensation of employees,
which is broadly offset by slightly higher tax revenue and slightly lower capital expenditure.
The 2019 DBP maintains the headline deficit target for 2019 unchanged as compared to the
Stability Programme at 0.2% of GDP. The overall deficit-reducing impact of around 0.8% of
GDP from upward revisions of current revenue from taxes (0.4% of GDP), social security
contributions (0.1% of GDP) and sales and other current revenue (0.4% of GDP), is broadly
offset by increases in primary current expenditure (0.7% of GDP, in particular for social
transfers and compensation of employees) and in capital expenditure (0.2% of GDP). The
downward revision of capital revenue by 0.1% of GDP is broadly compensated by a
corresponding downward revision of interest expenditure.
The Commission 2018 autumn forecast projects a headline deficit of 0.6% of GDP in 2019,
i.e. 0.4% of GDP worse than the 2019 DBP deficit target of 0.2% of GDP. The difference
stems from more conservative assumptions regarding the evolution of some revenue items
and higher pressures for some expenditure items. On the revenue side, the Commission
projects 0.1% of GDP of lower indirect taxes and social security contributions in line with the
Commission's more prudent macroeconomic forecast for 2019. The Commission forecast also
has more conservative assumptions for revenue from sales and other current revenue (overall
0.1% of GDP), based on the recent track record for these items. On the expenditure side,
higher spending is expected in particular on compensation of employees (0.2% of GDP based
on the track record of continuously rising public employment in 2016-2018, the ongoing
unfreezing of careers and the extension of the 35 hours in the health sector to private
contracts). Risks to the budgetary targets are tilted to the downside, linked to uncertainties
surrounding the macroeconomic outlook and the potential deficit-increasing impact of a
further activation of the Novo Banco contingent capital mechanism that could exceed the
0.2% of GDP already included in the DBP 2019 headline deficit target.
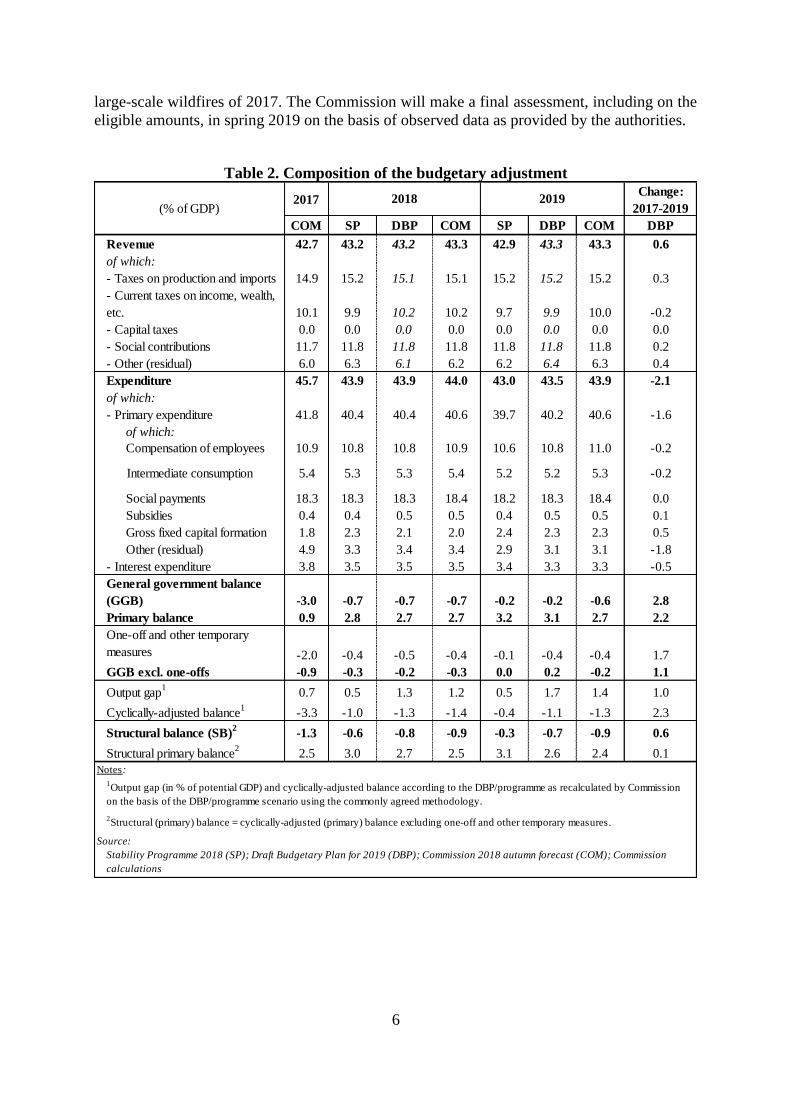
The DBP projects the structural balance1 to improve by 0.4% of GDP from a deficit of 1.3%
of GDP in 2017 to 0.9% of GDP in 2018. It thus maintains the same improvement of 0.4% of
GDP projected in the SP, albeit from a different starting point2. For 2019 the DBP plans an
improvement of the (recalculated) structural balance by 0.2% of GDP to -0.7% of GDP, as
compared to the 0.3% of GDP improvement to -0.3% of GDP targeted in the Stability
Programme. The lower improvement of the structural balance as compared to the Stability
Programme is mainly due to a more positive variation of the output gap in the DBP that is
only partially offset by a more negative variation of the impact of one-off measures. While for
2018 the Commission 2018 autumn forecast's structural balance projection is broadly in line
with the DBP, for 2019 the Commission 2018 autumn forecast projects the structural balance
to remain broadly unchanged at 0.9% of GDP, resulting in a difference of 0.2% of GDP with
1 Cyclically adjusted balance net of one-off and temporary measures, recalculated by the Commission using the
commonly agreed methodology. 2 While the projected variation of the structural balance in 2018 has remained the same, the revised output gap
calculations taking into account inter alia recent upward revisions of real GDP growth in 2016 and 2017 have led
to an upward revision of the structural deficit in 2017 from 1.0% of GDP in the SP to 1.3% of GDP in the DBP
2019.
5
the DBP. The difference in the structural balance variation in 2019 mainly reflects the 0.4% of
GDP difference in the headline deficit projection in the Commission forecast, which is
partially offset (by 0.2% of GDP) by a lower cyclical adjustment3 in the Commission forecast
than in the DBP, and a less positive variation of the impact of one-off measures4.
Against the background of falling interest expenditure, the projected improvement in the
(recalculated) structural balance in 2018-2019 (0.4% and 0.2%, respectively) is accompanied
by no improvement in the (recalculated) structural primary balance (0.0% of GDP) in both
2018 and 2019 according to the DBP. As was the case for the structural balance, also the
structural primary balance of the Commission forecast is broadly in line with the DBP for
2018. For 2019, the Commission forecast however projects a deterioration of the structural
primary balance by 0.2% of GDP instead of the stabilisation in the DBP. The difference is
related to the Commission forecasts' less favourable evolution of the structural balance as
compared to the DBP.
Euro area sovereign bond yields remain at historically low levels, with 10-year rates in
Portugal currently standing at 2.00%5. As a consequence, total interest payments by the
general government have continued to decrease as a share of GDP. Based on the information
included in the Draft Budgetary Plan, interest expenditure in Portugal is expected to fall from
3.8% of GDP in 2017 to 3.5% in 2018 and is projected to decrease further next year, to 3.3%
of GDP, well below the 4.9% recorded back in 2012 at the peak of the euro area sovereign
debt crisis. The picture stemming from Portugal's DBP is broadly confirmed by the
Commission 2018 autumn forecast.
As regards compliance with national numerical fiscal rules, the assessment of the 2019 Draft
Budget by the Portuguese Fiscal Council of 13 November 2018 points to risks of non-
compliance with the rule of a minimum annual adjustment of the structural balance by 0.5%
of GDP and with the expenditure benchmark as long as the MTO is not reached, as laid down
in Article 12-C (6) of the currently applicable Budget Framework Law (BFL)6.
The Portuguese authorities indicated in the 2018 Stability Programme that the budgetary
impact of the large-scale wildfires that occurred in 2017 was significant and should be
considered as an unusual event outside the control of the government, as defined in Article 5.1
and Article 6.3 of Regulation (EC) No 1466/97. More specifically, providing adequate
evidence of the scope and nature of these additional budgetary costs, Portugal requested a
temporary deviation from the adjustment path towards the MTO of 0.07% of GDP in 2018 in
relation to exceptional expenditure for preventive measures to protect the national territory
against wildfires. The Stability Programme set out expenditure related to the emergency
management, classified as one-off measures, and to prevention. Due to the integrated nature
of these expenditures and due to the direct link with the large-scale wildfires of 2017, the
specific treatment of wildfire-prevention expenditure could be considered in application of the
‘unusual event clause’. The Commission provisionally assessed Portugal to be eligible for an
allowance of 0.07% of GDP in relation to costs considered by the Commission to have a clear
and direct link to exceptional wildfire-prevention expenditure following the unprecedented
3 As a result of the less positive variation of the output gap in the Commission forecast
4 The DBP includes the impact of the unusual event clause-related expenditure as one-off expenditure (see
below) 5 10-year bond yields as of 24 October 2018. Source: Bloomberg.
6 Law n.º 41/2014 of 10 July (Eighth modification of Law n.º 91/2001, of 20 August) (Budget Framework Law)
6
large-scale wildfires of 2017. The Commission will make a final assessment, including on the
eligible amounts, in spring 2019 on the basis of observed data as provided by the authorities.
Table 2. Composition of the budgetary adjustment
2017Change:
2017-2019
COM SP DBP COM SP DBP COM DBP
Revenue 42.7 43.2 43.2 43.3 42.9 43.3 43.3 0.6
of which:
- Taxes on production and imports 14.9 15.2 15.1 15.1 15.2 15.2 15.2 0.3
- Current taxes on income, wealth,
etc. 10.1 9.9 10.2 10.2 9.7 9.9 10.0 -0.2
- Capital taxes 0.0 0.0 0.0 0.0 0.0 0.0 0.0 0.0
- Social contributions 11.7 11.8 11.8 11.8 11.8 11.8 11.8 0.2
- Other (residual) 6.0 6.3 6.1 6.2 6.2 6.4 6.3 0.4
Expenditure 45.7 43.9 43.9 44.0 43.0 43.5 43.9 -2.1
of which:
- Primary expenditure 41.8 40.4 40.4 40.6 39.7 40.2 40.6 -1.6
of which:
Compensation of employees 10.9 10.8 10.8 10.9 10.6 10.8 11.0 -0.2
Intermediate consumption 5.4 5.3 5.3 5.4 5.2 5.2 5.3 -0.2
Social payments 18.3 18.3 18.3 18.4 18.2 18.3 18.4 0.0
Subsidies 0.4 0.4 0.5 0.5 0.4 0.5 0.5 0.1
Gross fixed capital formation 1.8 2.3 2.1 2.0 2.4 2.3 2.3 0.5
Other (residual) 4.9 3.3 3.4 3.4 2.9 3.1 3.1 -1.8
- Interest expenditure 3.8 3.5 3.5 3.5 3.4 3.3 3.3 -0.5
General government balance
(GGB) -3.0 -0.7 -0.7 -0.7 -0.2 -0.2 -0.6 2.8
Primary balance 0.9 2.8 2.7 2.7 3.2 3.1 2.7 2.2
One-off and other temporary
measures -2.0 -0.4 -0.5 -0.4 -0.1 -0.4 -0.4 1.7
GGB excl. one-offs -0.9 -0.3 -0.2 -0.3 0.0 0.2 -0.2 1.1
Output gap1
0.7 0.5 1.3 1.2 0.5 1.7 1.4 1.0
Cyclically-adjusted balance1
-3.3 -1.0 -1.3 -1.4 -0.4 -1.1 -1.3 2.3
Structural balance (SB)2
-1.3 -0.6 -0.8 -0.9 -0.3 -0.7 -0.9 0.6
Structural primary balance2
2.5 3.0 2.7 2.5 3.1 2.6 2.4 0.1
1Output gap (in % of potential GDP) and cyclically-adjusted balance according to the DBP/programme as recalculated by Commission
on the basis of the DBP/programme scenario using the commonly agreed methodology.
2Structural (primary) balance = cyclically-adjusted (primary) balance excluding one-off and other temporary measures.
Notes:
(% of GDP)2018 2019
Source:
Stability Programme 2018 (SP); Draft Budgetary Plan for 2019 (DBP); Commission 2018 autumn forecast (COM); Commission
calculations
7
3.2. Debt developments
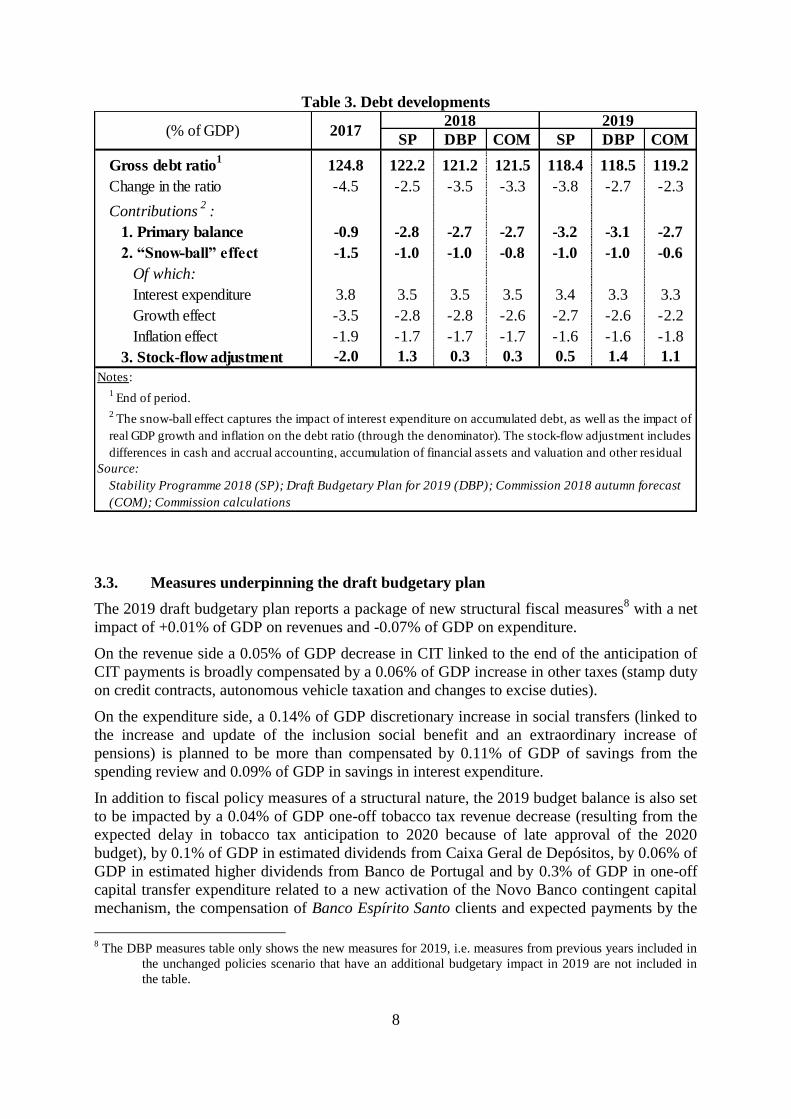
Following a decrease by 4.5 percentage points in 2017 to 124.8% of GDP, the debt-to-GDP
ratio is forecast to continue a downward path by an average 3 percentage points in 2018 and
2019 according to both the DBP and, albeit slightly less pronounced, the Commission 2018
autumn forecast. As compared to the Stability Programme, the decrease in the ratio is
expected to remain broadly the same7 for 2018 but is projected to decelerate by around one
percentage point in 2019, mostly due to higher stock-flow adjustments (resulting in particular
from a higher cash deficit projection) and lower growth. The lower decrease in the debt-to-
GDP ratio in the Commission 2018 autumn forecast, as compared to the DBP, mostly reflects
the lower projected nominal GDP growth and higher headline deficit projection for 2019.
Some limited risk to the debt reduction profile could arise from a further activation of the
contingent capital mechanism included in the Novo Banco sales agreement that could exceed
the 0.2% of GDP (however up to a yearly limit of 0.4% of GDP) already included in the DBP
2019 headline deficit target.
As regards compliance with national fiscal rules, the assessment of the 2019 Draft Budget by
the Portuguese Fiscal Council of 13 November 2018 points to compliance with the debt-
related provisions of Article 10-G(1) of the currently applicable BFL referring to the
applicable provisions of Article 2 of Council Regulation (EC) 1467/97 for the preventive arm,
i.e. currently the transitional debt rule requirements.
7 Following an upward revision of 2016 and 2017 GDP, the debt-to-GDP ratio at the end of 2017 has decreased
by 0.9 percentage points as compared to the Stability Programme estimate which explains the lower change in
the ratio by 2.5% in 2018 for the Stability Programme shown in table 3.
8
Table 3. Debt developments
3.3. Measures underpinning the draft budgetary plan
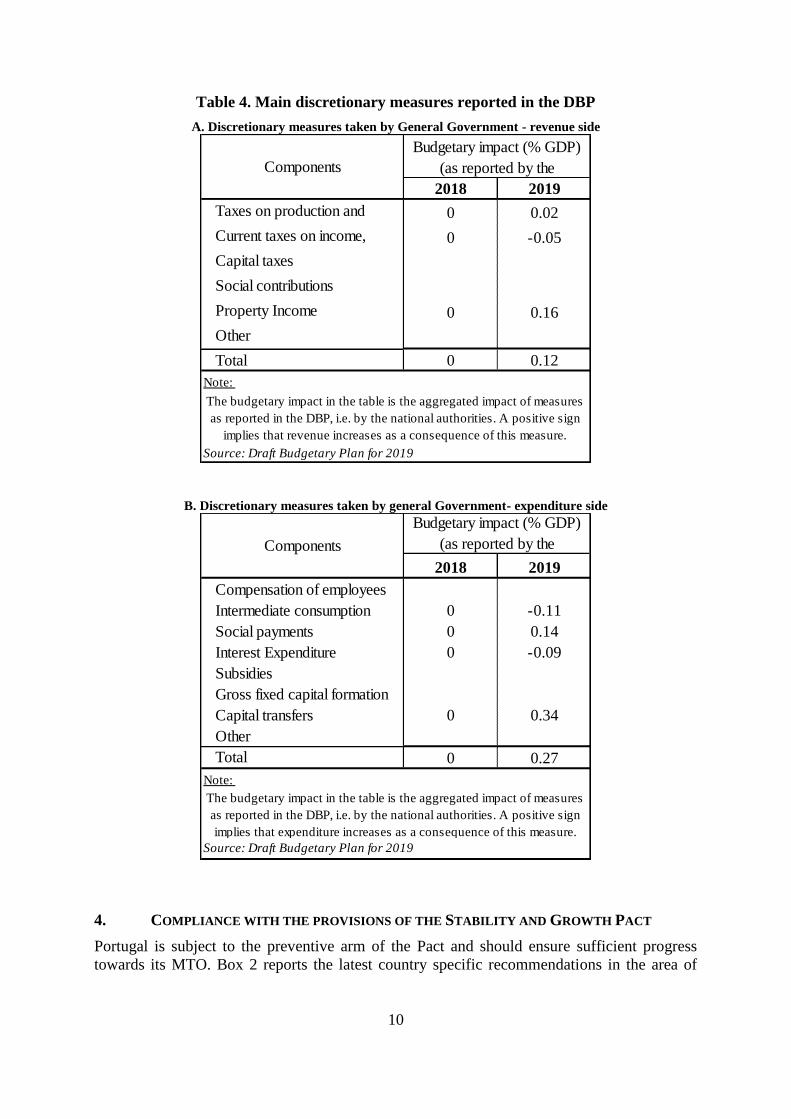
The 2019 draft budgetary plan reports a package of new structural fiscal measures8 with a net
impact of +0.01% of GDP on revenues and -0.07% of GDP on expenditure.
On the revenue side a 0.05% of GDP decrease in CIT linked to the end of the anticipation of
CIT payments is broadly compensated by a 0.06% of GDP increase in other taxes (stamp duty
on credit contracts, autonomous vehicle taxation and changes to excise duties).
On the expenditure side, a 0.14% of GDP discretionary increase in social transfers (linked to
the increase and update of the inclusion social benefit and an extraordinary increase of
pensions) is planned to be more than compensated by 0.11% of GDP of savings from the
spending review and 0.09% of GDP in savings in interest expenditure.
In addition to fiscal policy measures of a structural nature, the 2019 budget balance is also set
to be impacted by a 0.04% of GDP one-off tobacco tax revenue decrease (resulting from the
expected delay in tobacco tax anticipation to 2020 because of late approval of the 2020
budget), by 0.1% of GDP in estimated dividends from Caixa Geral de Depósitos, by 0.06% of
GDP in estimated higher dividends from Banco de Portugal and by 0.3% of GDP in one-off
capital transfer expenditure related to a new activation of the Novo Banco contingent capital
mechanism, the compensation of Banco Espírito Santo clients and expected payments by the
8 The DBP measures table only shows the new measures for 2019, i.e. measures from previous years included in
the unchanged policies scenario that have an additional budgetary impact in 2019 are not included in
the table.
SP DBP COM SP DBP COM
Gross debt ratio1
124.8 122.2 121.2 121.5 118.4 118.5 119.2
Change in the ratio -4.5 -2.5 -3.5 -3.3 -3.8 -2.7 -2.3
Contributions2
:
1. Primary balance -0.9 -2.8 -2.7 -2.7 -3.2 -3.1 -2.7
2. “Snow-ball” effect -1.5 -1.0 -1.0 -0.8 -1.0 -1.0 -0.6
Of which:
Interest expenditure 3.8 3.5 3.5 3.5 3.4 3.3 3.3
Growth effect -3.5 -2.8 -2.8 -2.6 -2.7 -2.6 -2.2
Inflation effect -1.9 -1.7 -1.7 -1.7 -1.6 -1.6 -1.8
3. Stock-flow adjustment -2.0 1.3 0.3 0.3 0.5 1.4 1.1
Notes:
1 End of period.
Source:
2017
2 The snow-ball effect captures the impact of interest expenditure on accumulated debt, as well as the impact of
real GDP growth and inflation on the debt ratio (through the denominator). The stock-flow adjustment includes
differences in cash and accrual accounting, accumulation of financial assets and valuation and other residual
(% of GDP)2018 2019
Stability Programme 2018 (SP); Draft Budgetary Plan for 2019 (DBP); Commission 2018 autumn forecast
(COM); Commission calculations
9
Lisbon Municipality resulting from a court ruling. Taking into account all fiscal measures, the
DBP measures table thus reports a slightly negative budgetary impact of revenue and
expenditure measures of -0.15% of GDP on the headline balance in 2019.
The Commission 2018 autumn forecast takes into account all measures at their yield specified
in the DBP. While not considering them discretionary fiscal measures, the forecast also
factors in the estimates for higher dividends and interest expenditure savings.
Overall, based on the reported measures table, the consolidation strategy would be based
slightly more on the expenditure-side relying on containment of intermediate consumption via
the spending review and savings in interest expenditure. However, the overall volume of the
reported measures appears limited in view of meeting the fiscal country-specific
recommendation. Windfall gains from lower interest expenditure and expected higher
dividends from Banco de Portugal and Caixa Geral de Depósitos do not appear to be used for
accelerating the reduction of the general government debt-to-GDP ratio but to compensate for
reductions in tax revenue and increases in primary expenditure. As regards the fiscal-
structural country-specific recommendations, the measures reflect the expenditure-decreasing
impact of the spending review. As regards the health sector, it remains unclear to what extent
the expected savings can help to reduce the hospital arrears.
10
Table 4. Main discretionary measures reported in the DBP
A. Discretionary measures taken by General Government - revenue side
B. Discretionary measures taken by general Government- expenditure side
4. COMPLIANCE WITH THE PROVISIONS OF THE STABILITY AND GROWTH PACT
Portugal is subject to the preventive arm of the Pact and should ensure sufficient progress
towards its MTO. Box 2 reports the latest country specific recommendations in the area of
2018 2019
Taxes on production and
imports
0 0.02
Current taxes on income,
wealth, etc.
0 -0.05
Capital taxes
Social contributions
Property Income 0 0.16
Other
Total 0 0.12
Note:
Budgetary impact (% GDP)
(as reported by the
The budgetary impact in the table is the aggregated impact of measures
as reported in the DBP, i.e. by the national authorities. A positive sign
implies that revenue increases as a consequence of this measure.
Source: Draft Budgetary Plan for 2019
Components
2018 2019
Compensation of employees
Intermediate consumption 0 -0.11
Social payments 0 0.14
Interest Expenditure 0 -0.09
Subsidies
Gross fixed capital formation
Capital transfers 0 0.34
Other
Total 0 0.27
Note:
Source: Draft Budgetary Plan for 2019
Components
Budgetary impact (% GDP)
(as reported by the
The budgetary impact in the table is the aggregated impact of measures
as reported in the DBP, i.e. by the national authorities. A positive sign
implies that expenditure increases as a consequence of this measure.
11
public finances. Portugal is also subject to the transitional arrangements to make sufficient
progress towards compliance with the debt reduction benchmark.
Box 2. Council recommendations addressed to Portugal9
On 13 July 2018, the Council addressed recommendations to Portugal in the context of the
European Semester. In particular, in the area of public finances the Council recommended that
Portugal take action to ensure that the nominal growth rate of net primary government
expenditure does not exceed 0.7 % in 2019, corresponding to an annual structural adjustment
of 0.6 % of GDP, and to use windfall gains to accelerate the reduction of the general
government debt ratio.
4.1. Compliance with the debt criterion
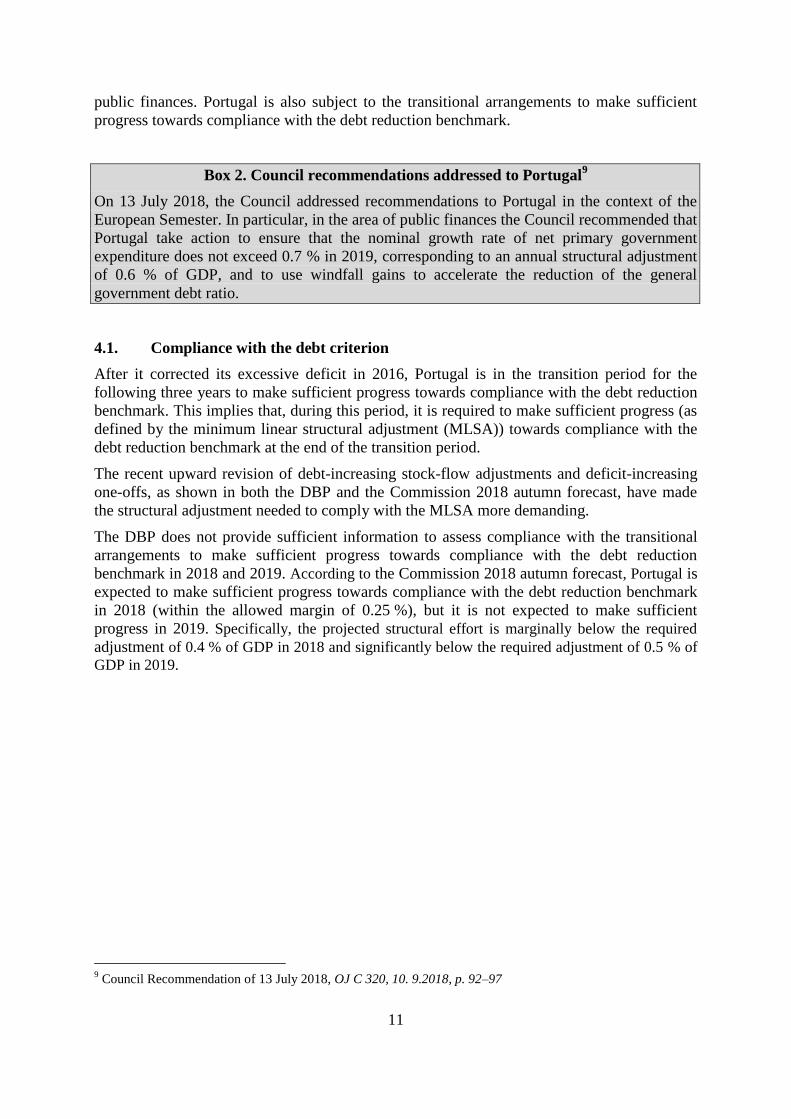
After it corrected its excessive deficit in 2016, Portugal is in the transition period for the
following three years to make sufficient progress towards compliance with the debt reduction
benchmark. This implies that, during this period, it is required to make sufficient progress (as
defined by the minimum linear structural adjustment (MLSA)) towards compliance with the
debt reduction benchmark at the end of the transition period.
The recent upward revision of debt-increasing stock-flow adjustments and deficit-increasing
one-offs, as shown in both the DBP and the Commission 2018 autumn forecast, have made
the structural adjustment needed to comply with the MLSA more demanding.
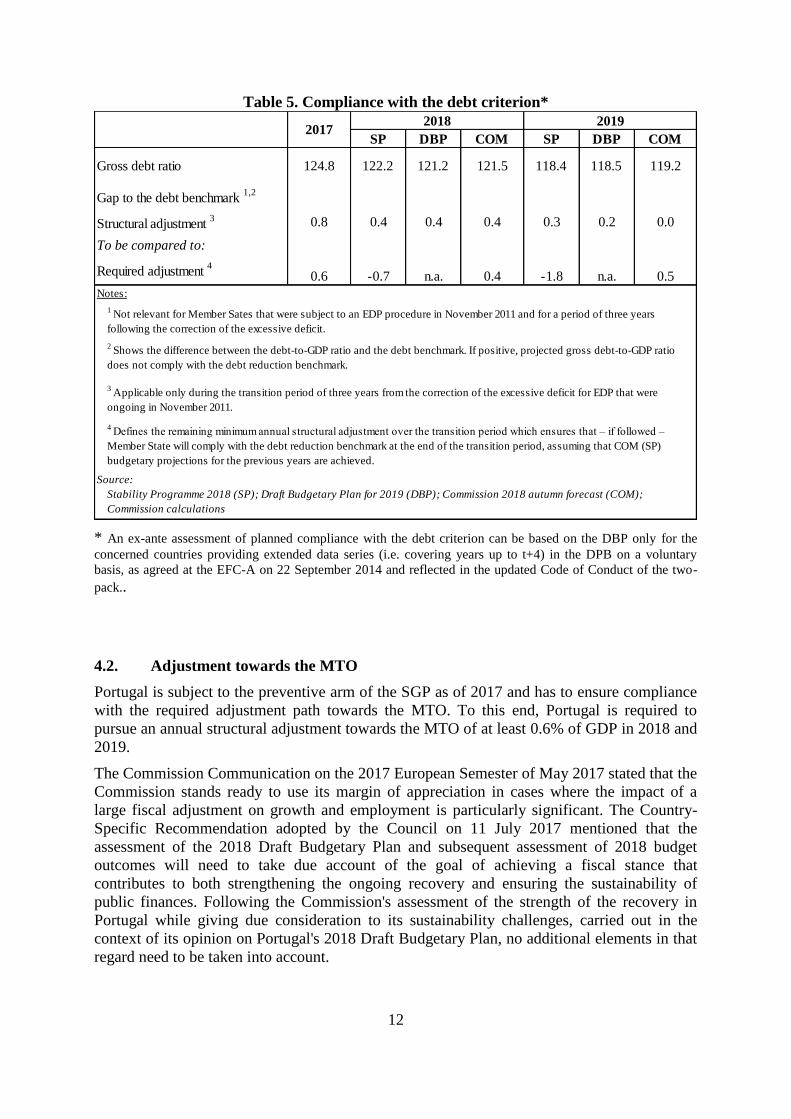
The DBP does not provide sufficient information to assess compliance with the transitional
arrangements to make sufficient progress towards compliance with the debt reduction
benchmark in 2018 and 2019. According to the Commission 2018 autumn forecast, Portugal is
expected to make sufficient progress towards compliance with the debt reduction benchmark
in 2018 (within the allowed margin of 0.25 %), but it is not expected to make sufficient
progress in 2019. Specifically, the projected structural effort is marginally below the required
adjustment of 0.4 % of GDP in 2018 and significantly below the required adjustment of 0.5 % of
GDP in 2019.
9 Council Recommendation of 13 July 2018, OJ C 320, 10. 9.2018, p. 92–97
12
Table 5. Compliance with the debt criterion*
* An ex-ante assessment of planned compliance with the debt criterion can be based on the DBP only for the
concerned countries providing extended data series (i.e. covering years up to t+4) in the DPB on a voluntary
basis, as agreed at the EFC-A on 22 September 2014 and reflected in the updated Code of Conduct of the two-
pack..
4.2. Adjustment towards the MTO
Portugal is subject to the preventive arm of the SGP as of 2017 and has to ensure compliance
with the required adjustment path towards the MTO. To this end, Portugal is required to
pursue an annual structural adjustment towards the MTO of at least 0.6% of GDP in 2018 and
2019.
The Commission Communication on the 2017 European Semester of May 2017 stated that the
Commission stands ready to use its margin of appreciation in cases where the impact of a
large fiscal adjustment on growth and employment is particularly significant. The Country-
Specific Recommendation adopted by the Council on 11 July 2017 mentioned that the
assessment of the 2018 Draft Budgetary Plan and subsequent assessment of 2018 budget
outcomes will need to take due account of the goal of achieving a fiscal stance that
contributes to both strengthening the ongoing recovery and ensuring the sustainability of
public finances. Following the Commission's assessment of the strength of the recovery in
Portugal while giving due consideration to its sustainability challenges, carried out in the
context of its opinion on Portugal's 2018 Draft Budgetary Plan, no additional elements in that
regard need to be taken into account.
SP DBP COM SP DBP COM
124.8 122.2 121.2 121.5 118.4 118.5 119.2
0.8 0.4 0.4 0.4 0.3 0.2 0.0
0.6 -0.7 n.a. 0.4 -1.8 n.a. 0.5
Notes:
3 Applicable only during the transition period of three years from the correction of the excessive deficit for EDP that were
ongoing in November 2011.
4 Defines the remaining minimum annual structural adjustment over the transition period which ensures that – if followed –
Member State will comply with the debt reduction benchmark at the end of the transition period, assuming that COM (SP)
budgetary projections for the previous years are achieved.
Source:
Stability Programme 2018 (SP); Draft Budgetary Plan for 2019 (DBP); Commission 2018 autumn forecast (COM);
Commission calculations
Structural adjustment 3
To be compared to:
Required adjustment 4
1 Not relevant for Member Sates that were subject to an EDP procedure in November 2011 and for a period of three years
following the correction of the excessive deficit.
2 Shows the difference between the debt-to-GDP ratio and the debt benchmark. If positive, projected gross debt-to-GDP ratio
does not comply with the debt reduction benchmark.
20172018 2019
Gap to the debt benchmark 1,2
Gross debt ratio
13
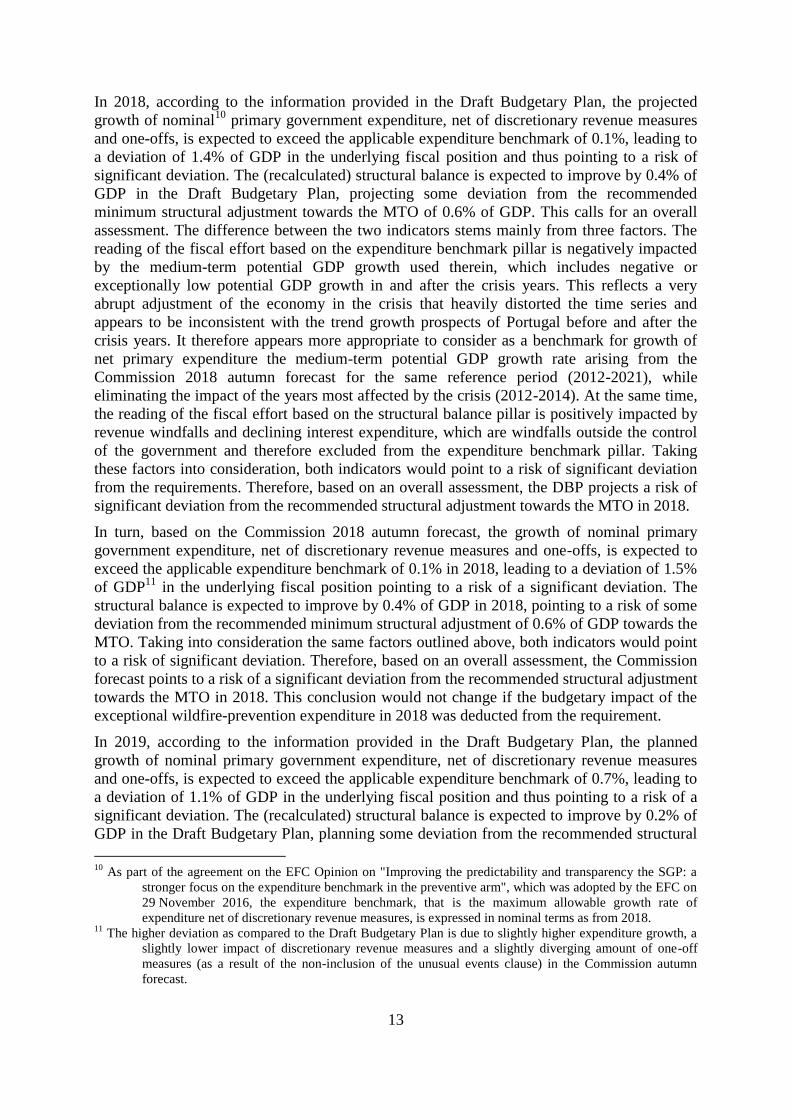
In 2018, according to the information provided in the Draft Budgetary Plan, the projected
growth of nominal10
primary government expenditure, net of discretionary revenue measures
and one-offs, is expected to exceed the applicable expenditure benchmark of 0.1%, leading to
a deviation of 1.4% of GDP in the underlying fiscal position and thus pointing to a risk of
significant deviation. The (recalculated) structural balance is expected to improve by 0.4% of
GDP in the Draft Budgetary Plan, projecting some deviation from the recommended
minimum structural adjustment towards the MTO of 0.6% of GDP. This calls for an overall
assessment. The difference between the two indicators stems mainly from three factors. The
reading of the fiscal effort based on the expenditure benchmark pillar is negatively impacted
by the medium-term potential GDP growth used therein, which includes negative or
exceptionally low potential GDP growth in and after the crisis years. This reflects a very
abrupt adjustment of the economy in the crisis that heavily distorted the time series and
appears to be inconsistent with the trend growth prospects of Portugal before and after the
crisis years. It therefore appears more appropriate to consider as a benchmark for growth of
net primary expenditure the medium-term potential GDP growth rate arising from the
Commission 2018 autumn forecast for the same reference period (2012-2021), while
eliminating the impact of the years most affected by the crisis (2012-2014). At the same time,
the reading of the fiscal effort based on the structural balance pillar is positively impacted by
revenue windfalls and declining interest expenditure, which are windfalls outside the control
of the government and therefore excluded from the expenditure benchmark pillar. Taking
these factors into consideration, both indicators would point to a risk of significant deviation
from the requirements. Therefore, based on an overall assessment, the DBP projects a risk of
significant deviation from the recommended structural adjustment towards the MTO in 2018.
In turn, based on the Commission 2018 autumn forecast, the growth of nominal primary
government expenditure, net of discretionary revenue measures and one-offs, is expected to
exceed the applicable expenditure benchmark of 0.1% in 2018, leading to a deviation of 1.5%
of GDP11
in the underlying fiscal position pointing to a risk of a significant deviation. The
structural balance is expected to improve by 0.4% of GDP in 2018, pointing to a risk of some
deviation from the recommended minimum structural adjustment of 0.6% of GDP towards the
MTO. Taking into consideration the same factors outlined above, both indicators would point
to a risk of significant deviation. Therefore, based on an overall assessment, the Commission
forecast points to a risk of a significant deviation from the recommended structural adjustment
towards the MTO in 2018. This conclusion would not change if the budgetary impact of the
exceptional wildfire-prevention expenditure in 2018 was deducted from the requirement.
In 2019, according to the information provided in the Draft Budgetary Plan, the planned
growth of nominal primary government expenditure, net of discretionary revenue measures
and one-offs, is expected to exceed the applicable expenditure benchmark of 0.7%, leading to
a deviation of 1.1% of GDP in the underlying fiscal position and thus pointing to a risk of a
significant deviation. The (recalculated) structural balance is expected to improve by 0.2% of
GDP in the Draft Budgetary Plan, planning some deviation from the recommended structural
10
As part of the agreement on the EFC Opinion on "Improving the predictability and transparency the SGP: a
stronger focus on the expenditure benchmark in the preventive arm", which was adopted by the EFC on
29 November 2016, the expenditure benchmark, that is the maximum allowable growth rate of
expenditure net of discretionary revenue measures, is expressed in nominal terms as from 2018. 11
The higher deviation as compared to the Draft Budgetary Plan is due to slightly higher expenditure growth, a
slightly lower impact of discretionary revenue measures and a slightly diverging amount of one-off
measures (as a result of the non-inclusion of the unusual events clause) in the Commission autumn
forecast.

14
adjustment towards the MTO of 0.6% of GDP. This calls for an overall assessment. The fiscal
effort based on the structural balance pillar is positively impacted by revenue windfalls and
declining interest expenditure, which are excluded from the expenditure benchmark pillar.
Furthermore, the difference between the two indicators also stems from differences between
the potential growth underlying the structural balance and the medium-term potential growth
rate used to set the expenditure benchmark. An overall assessment confirms that both
indicators would point to a risk of significant deviation from the requirements in 2019. Over
2018 and 2019 taken together, both the expenditure benchmark and the structural balance
point to a risk of significant deviation, albeit by a small margin for the structural balance. An
overall assessment confirms that both indicators would point to a risk of significant deviation
from the requirements over 2018 and 2019 taken together. Therefore, an overall assessment
based on the DBP points to a risk of significant deviation from the recommended structural
adjustment towards the MTO in 2019 and over 2018 and 2019 taken together.
In turn, based on the Commission 2018 autumn forecast, the growth of nominal primary
government expenditure, net of discretionary revenue measures and one-offs, is expected to
exceed the applicable expenditure benchmark of 0.7%, leading to a deviation of 1.4% of
GDP12
in the underlying fiscal position pointing to a risk of a significant deviation in 2019.
The structural balance is expected to remain unchanged in 2019, thus also pointing to a risk of
a significant deviation by 0.6% of GDP from the recommended structural adjustment of 0.6%
of GDP towards the MTO. Over 2018 and 2019 taken together, both indicators also point to a
risk of a significant deviation from the requirements. An overall assessment taking into
consideration the above-mentioned effects confirms the risk of a significant deviation from
the requirements in both 2019 and over 2018 and 2019 taken together according to the
Commission forecast.
12
The higher deviation as compared to the Draft Budgetary Plan is mainly due to higher expenditure growth and
lower discretionary revenue measures in the Commission autumn forecast.
15
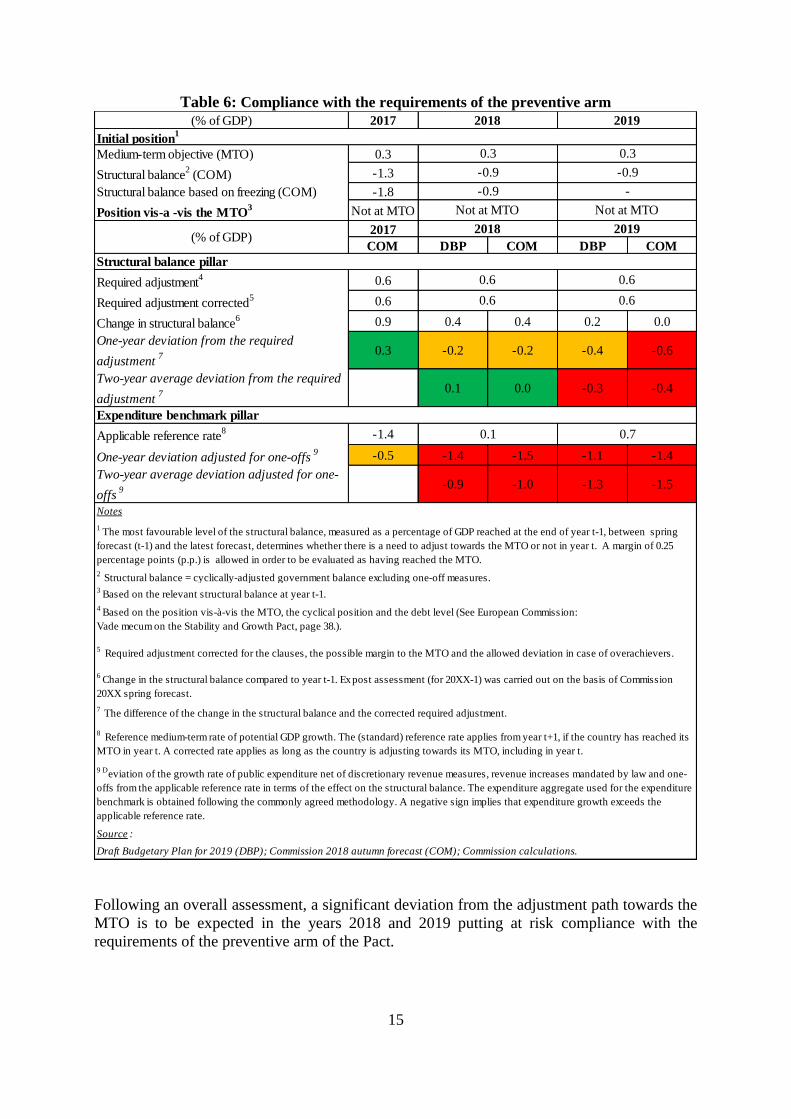
Table 6: Compliance with the requirements of the preventive arm
Following an overall assessment, a significant deviation from the adjustment path towards the
MTO is to be expected in the years 2018 and 2019 putting at risk compliance with the
requirements of the preventive arm of the Pact.
(% of GDP) 2017
Medium-term objective (MTO) 0.3
Structural balance2
(COM) -1.3
Structural balance based on freezing (COM) -1.8
Position vis-a -vis the MTO3 Not at MTO
2017
COM DBP COM DBP COM
Required adjustment4 0.6
Required adjustment corrected5 0.6
Change in structural balance6 0.9 0.4 0.4 0.2 0.0
One-year deviation from the required
adjustment7 0.3 -0.2 -0.2 -0.4 -0.6
Two-year average deviation from the required
adjustment7 0.0 0.1 0.0 -0.3 -0.4
Applicable reference rate8 -1.4
One-year deviation adjusted for one-offs9 -0.5 -1.4 -1.5 -1.1 -1.4
Two-year average deviation adjusted for one-
offs9 -0.5 -0.9 -1.0 -1.3 -1.5
Source :
0.3 0.3
(% of GDP)2018 2019
Structural balance pillar
Draft Budgetary Plan for 2019 (DBP); Commission 2018 autumn forecast (COM); Commission calculations.
2018 2019
Initial position1
-0.9 -0.9
-0.9 -
Not at MTO Not at MTO
5 Required adjustment corrected for the clauses, the possible margin to the MTO and the allowed deviation in case of overachievers.
6 Change in the structural balance compared to year t-1. Ex post assessment (for 20XX-1) was carried out on the basis of Commission
20XX spring forecast.
7 The difference of the change in the structural balance and the corrected required adjustment.
0.6 0.6
Expenditure benchmark pillar
0.1 0.7
9 Deviation of the growth rate of public expenditure net of discretionary revenue measures, revenue increases mandated by law and one-
offs from the applicable reference rate in terms of the effect on the structural balance. The expenditure aggregate used for the expenditure
benchmark is obtained following the commonly agreed methodology. A negative sign implies that expenditure growth exceeds the
applicable reference rate.
0.6 0.6
Notes
1 The most favourable level of the structural balance, measured as a percentage of GDP reached at the end of year t-1, between spring
forecast (t-1) and the latest forecast, determines whether there is a need to adjust towards the MTO or not in year t. A margin of 0.25
percentage points (p.p.) is allowed in order to be evaluated as having reached the MTO.
8 Reference medium-term rate of potential GDP growth. The (standard) reference rate applies from year t+1, if the country has reached its
MTO in year t. A corrected rate applies as long as the country is adjusting towards its MTO, including in year t.
2 Structural balance = cyclically-adjusted government balance excluding one-off measures.
3 Based on the relevant structural balance at year t-1.
4 Based on the position vis-à-vis the MTO, the cyclical position and the debt level (See European Commission:
Vade mecum on the Stability and Growth Pact, page 38.).
16
5. COMPOSITION OF PUBLIC FINANCES AND IMPLEMENTATION OF FISCAL
STRUCTURAL REFORMS
The composition of the planned adjustment between revenues and primary expenditure in
2019 in per cent of GDP is based on a 0.1 percentage point increase in revenue (as the
expected increase of other current revenue outweighs a small decrease in projected tax
revenue in per cent of GDP) and a 0.4 percentage points decrease in expenditure. Half of the
decrease in expenditure is due to to a decreasing share of interest expenditure and the other
half due to decreasing primary expenditure (where a 0.2 percentage points increase for gross
fixed capital formation is more than offset by decreases in other expenditure (-0.3pp) and
intermediate consumption (-0.1pp).
Portugal plans a strong increase in public investment in 2019 that contrasts with the strong
decrease in the share in total expenditure of investment during the period 2011-2016.
In terms of fiscal-structural reforms, the 2018 country-specific recommendations include two
main issues: i) strengthen expenditure control, cost effectiveness and adequate budgeting, in
particular in the health sector with a focus on the reduction of arrears in hospitals, and ii)
improve the financial sustainability of state-owned enterprises, in particular by increasing
their overall net income and by reducing debt.
As regards expenditure control and cost effectiveness, many initiatives aimed at improving
the quality of public expenditure continue to be developed across the public sector, many of
which are included within the framework of the spending review exercise. The latter is
expected to yield savings of EUR 236 million (0.1% of GDP) across several parts of the
public sector in 2019. Around half of the expected savings are expected to come from health
and education, while measures in the justice system, internal administration as well as the
more efficient use of public assets and the growing use of centralised procurement are
expected to contribute the other half.
Hospital arrears have remained high in 2018, rising by EUR 86 million in September to reach
a stock of EUR 859 million (as compared to EUR 961 million in September 2017). This is
despite injections of additional appropriations of EUR 400 million in December 2017 and a
capital injection of EUR 500 million between March and April 2018. An additional injection
of EUR 500 million has been committed to reduce the level of arrears before the end of this
year. A mission structure was set up in 2018 by the Ministries of Health and Finance to
provide recommendations on the sustainability of the health system. As a result of their work,
a new pilot project for public hospitals has been included in the 2019 draft budget which
plans to reinforce the budgets of more efficient hospitals and give them more autonomy, but
to also make their management more accountable for their performance through incentives
and penalties. The less efficient hospitals shall face increasing levels of scrutiny and
recommendations according to the gravity of their shortfalls, with only conditional access to
budget reinforcements. The initiative represents an attempt to minimise moral hazard,
increase accountability and ensure more adequate budgeting for public hospitals. Overall,
while the proposed plans represent an ambitious step towards strengthening expenditure
control, cost effectiveness and adequate budgeting, in particular in the health sector, the early
stage of some of the measures and the continued high level of hospital arrears point to limited
progress to date.
17
On the improvement of the financial sustainability of state-owned enterprises (SOEs), in
particular by increasing their overall net income and by reducing debt, the authorities project
SOEs as a whole to approach a balanced net income by the end of 2019, which was
previously already planned for 2018. A range of measures is being implemented to enhance
the monitoring of SOEs and to ensure compliance with their budgetary plans. This includes
the completion of an information system to collect information directly from the accounting
systems of public companies. New incentives for employees and managers to improve
performance and good governance will also be introduced. SOEs that have fulfilled their
purposes, that are economically unviable or that can be merged to generate savings shall be
liquidated, while improvements in the capital structure are planned to be prioritised for those
SOEs that have positive operational results but high levels of debt. Overall, limited progress
has been made to date in improving the financial sustainability of state-owned enterprises.
Box 4 – Addressing the tax burden on labour in the euro area
The tax burden on labour in the euro area is relatively high, which weighs on economic activity and
employment. Against this background, the Eurogroup has expressed a commitment to reduce the tax
burden on labour. On 12 September 2015, the Eurogroup agreed to benchmark euro area Member
States' tax burden on labour against the GDP-weighted EU average, relying in the first instance on
indicators measuring the tax wedge on labour for a single worker at average wage and a single worker
at low wage. It also agreed to relate these numbers to the OECD average for purposes of broader
comparability.
The tax wedge on labour measures the difference between the total labour costs to employ a worker
and the worker’s net earnings. It is made up of personal income taxes and employer and employee
social security contributions. The higher the tax wedge, the higher the disincentives to take up work or
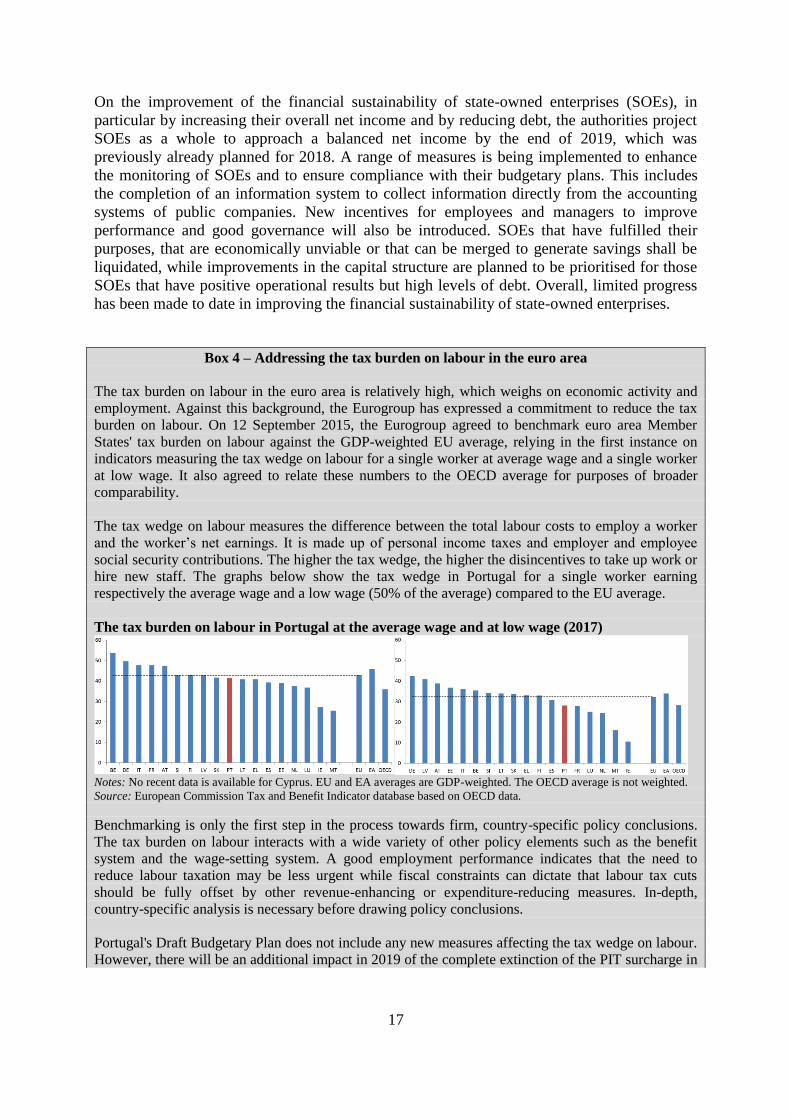
hire new staff. The graphs below show the tax wedge in Portugal for a single worker earning
respectively the average wage and a low wage (50% of the average) compared to the EU average.
The tax burden on labour in Portugal at the average wage and at low wage (2017)
Notes: No recent data is available for Cyprus. EU and EA averages are GDP-weighted. The OECD average is not weighted.
Source: European Commission Tax and Benefit Indicator database based on OECD data.
Benchmarking is only the first step in the process towards firm, country-specific policy conclusions.
The tax burden on labour interacts with a wide variety of other policy elements such as the benefit
system and the wage-setting system. A good employment performance indicates that the need to
reduce labour taxation may be less urgent while fiscal constraints can dictate that labour tax cuts
should be fully offset by other revenue-enhancing or expenditure-reducing measures. In-depth,
country-specific analysis is necessary before drawing policy conclusions.
Portugal's Draft Budgetary Plan does not include any new measures affecting the tax wedge on labour.
However, there will be an additional impact in 2019 of the complete extinction of the PIT surcharge in
18
2018 and the change in PIT brackets in 2018 (both measures were already included in the Draft
Budgetary Plan's no-policy change scenario and are therefore not included in the DBP 2019
measures). The carry-over effect of these measures from previous years appears to be only partially
compensated by an increase of other taxes (stamp tax, excise duty, vehicle taxation).
6. OVERALL CONCLUSION
Based on the Commission 2018 autumn forecast, Portugal makes sufficient progress towards
compliance with the debt reduction benchmark in 2018 but is not projected to make sufficient
progress in 2019. Following an overall assessment of the DBP, the planned structural
adjustment points to a risk of significant deviation from the adjustment path towards the MTO
recommended by the Council in both 2018 and 2019. An overall assessment based on the
Commission 2018 autumn forecast also points to a risk of significant deviation from the
adjustment path towards the MTO recommended by the Council in both 2018 and 2019.