Embed Size (px)
Citation preview

ARTICLE
ACCORDION MIND: results of the observational extensionof the ACCORD MIND randomised trial
Anne M. Murray1,2 & Fang-Chi Hsu3& Jeff D. Williamson4
& R. Nick Bryan5&
Hertzel C. Gerstein6,7& Mark D. Sullivan8
& Michael E. Miller3 & Iris Leng3 &
Laura L. Lovato3& Lenore J. Launer9 & for the Action to Control Cardiovascular Risk in
Diabetes Follow-On Memory in Diabetes (ACCORDION MIND) Investigators
Received: 17 May 2016 /Accepted: 30 August 2016 /Published online: 20 October 2016# Springer-Verlag Berlin Heidelberg 2016
AbstractAims/hypothesis The Memory in Diabetes (MIND) substudyof the Action to Control Cardiovascular Risk in Diabetes(ACCORD) study, a double 2x2 factorial parallel-grouprandomised clinical trial, tested whether intensive comparedwith standard management of hyperglycaemia, BP or lipidlevels reduced cognitive decline and brain atrophy in 2977people with type 2 diabetes. We describe the results of theobservational extension study, ACCORDION MIND(ClinicalTrials.gov registration no. NCT00182910), whichaimed to measure the long-term effects of the threeACCORD interventions on cognitive and brain structure out-comes approximately 4 years after the trial ended.Methods Participants (mean diabetes duration 10 years; meanage 62 years at baseline) received a fourth cognitive
assessment and a third brain MRI, targeted at 80 monthspost-randomisation. Primary outcomes were performance onthe Digit Symbol Substitution Test (DSST) and total brainvolume (TBV). The contrast of primary interest comparedglycaemic intervention groups at the ACCORDION visit; sec-ondary contrasts were the BP and lipid interventions.Results Of the surviving ACCORD participants eligible forACCORDION MIND, 1328 (68%) were re-examined at theACCORDION follow-up visit, approximately 47months afterthe intensive glycaemia intervention was stopped. The signif-icant differences in therapeutic targets for each of the threeinterventions (glycaemic, BP and lipid) were not sustained.We found no significant difference in 80 month mean changefrom baseline in DSST scores or in TBV between theglycaemic intervention groups, or the BP and lipid
A list of Action to Control Cardiovascular Risk in Diabetes Follow-On(ACCORDION) investigators is given in the electronic supplementarymaterial (ESM).
Electronic supplementary material The online version of this article(doi:10.1007/s00125-016-4118-x) contains peer-reviewed but uneditedsupplementary material, which is available to authorised users.
* Anne M. [email protected]
4 Geriatic Medicine, Department of Internal Medicine, J. Paul StichtCenter for Healthy Aging and Alzheimer_s Prevention, Wake ForestSchool of Medicine, Winston Salem, NC, USA
5 Department of Radiology, University of Pennsylvania HealthSystem, Philadelphia, PA, USA
6 Department of Medicine, McMaster University, Hamilton, ON,Canada
7 Population Health Research Institute, Hamilton Health Sciences,Hamilton, ON, Canada
8 Department of Psychiatry and Behavioural Sciences, University ofWashington, Seattle, WA, USA
9 Laboratory of Epidemiology and Population Sciences, IntramuralResearch Program, National Institute on Aging, Bethesda, MD, USA
Diabetologia (2017) 60:69–80DOI 10.1007/s00125-016-4118-x
1 Division of Geriatrics, Department of Medicine, Hennepin CountyMedical Center and University of Minnesota, Minneapolis, MN,USA
2 Berman Center for Clinical Research, Hennepin County MedicalCenter, 701 Park Avenue, Suite PPC4-440, Minneapolis, MN 55415,USA
3 Department of Biostatistical Sciences, Wake Forest School ofMedicine, Winston Salem, NC, USA

interventions. Sensitivity analyses of the sites with ≥70% par-ticipation at 80 months revealed consistent results.Conclusions/interpretation The ACCORD interventions didnot result in long-term beneficial or adverse effects on cogni-tive or brain MRI outcomes at approximately 80 months fol-low-up. Loss of separation in therapeutic targets betweentreatment arms and loss to follow-up may have contributedto the lack of detectable long-term effects.Trial registration: ClinicalTrials.gov NCT00182910
Keywords Abnormal white matter volume . BrainMRI .
Cognitive impairment . Total brain volume . Type 2 diabetes
AbbreviationsACCORD Action to Control Cardiovascular Risk in
DiabetesAWM Abnormal white matter volumeCCN Clinical centre networkCVD Cardiovascular diseaseDSST Digit Symbol Substitution TestEDIC Epidemiology of Diabetes Interventions and
ComplicationsHDL-C HDL-cholesterolM80 80 month follow-upMAR Missing at randomMIND Memory in DiabetesML Maximum likelihoodMMSE Mini-Mental State ExaminationNHLBI National Heart, Lung, and Blood InstituteNIA National Institute on AgingNIH National Institutes of HealthRAVLT Rey Auditory Verbal Learning TestSBP Systolic blood pressureTBV Total brain volumeTICS Telephone Interview Cognitive StatusUKPDS UK Prospective Diabetes Study
Introduction
Type 2 diabetes mellitus increases the risk of cognitive impair-ment and structural brain abnormalities [1–3]. Hypertension anddyslipidaemia are common comorbidities in type 2 diabetes.Evidence suggests that individuals with diabetes and elevatedBP are more likely to have prevalent cognitive impairment andmore brain atrophy than those with diabetes alone [4–7].
This report describes the results of ACCORDIONMIND, theobservational extension of the Action to Control CardiovascularRisk in Diabetes Memory in Diabetes (ACCORD MIND) trial(ClinicalTrials.gov NCT00182910 (see the ACCORDIONFollow-on Study Group members listed in the electronic supple-mentary material [ESM]). The Action to Control Cardiovascular
Risk in Diabetes (ACCORD) study was a double 2×2 factorialclinical trial (ClinicalTrials.gov NCT00000620 ) initiated to testwhether intensive compared with standard management ofhyperglycaemia, BP or lipid levels reduced cardiovascularevents or mortality, and secondarily total mortality [8]. TheMemory in Diabetes (MIND) trial was embedded in the largertrial to test whether these same interventions also reduced declinein brain function and structure over a 40 month period [9].ACCORD targeted people with long-standing diabetes at highrisk of cardiovascular events with HbA1c levels of ≥7.5%(≥58 mmol/mol).
In ACCORD MIND, cognitive tests were administered atbaseline (n = 2977), 20 months and 40 months post-randomisation. The primary cognitive outcome in MIND was40 month performance on the Digit Symbol Substitution Test(DSST) [10]. The DSST was chosen because it is a test ofpsychomotor function and speed, domains believed to bereflective of vascular cognitive impairment, but it alsoincludes aspects of learning and working memory [10],domains also affected by diabetes. The DSST has a widedistribution of scores in the target population, avoidingceiling or floor effects.
Brain MRI was acquired in a subset of theMIND sample atbaseline (n=614) and 40 months. The primary brain MRIoutcome was total brain volume (TBV), which was chosenbased on evidence that diabetes can lead to mixed vascularand neurodegenerative changes [11, 12] and changes in TBVover time [13], and can affect the relationship between TBVand cognitive function. The secondary brain MRI outcomewas abnormal white matter volume (AWM), which is indica-tive of diffuse and focal ischaemic, demyelinating and inflam-matory processes that can lead to small vessel disease, and isassociated with diabetes and impaired cognition [14, 15].
The results of ACCORDMIND were as follows. We foundno differences in mean DSST scores between the standard andintensive glycaemic groups at 40 months [14, 15]. There was amodest but significant beneficial effect on TBV at 40 months,whereby the intensive group had a higher TBV (mean 4.6 cm3)than the standard group. We also found no significant differ-ences in cognition between the treatment arms of the BP orlipid interventions [16]. Intensive BP control was associatedwith significantly lower TBV at 40 months follow-up.Interestingly, participants receiving the combination of inten-sive glycaemic and standard antihypertensive therapy experi-enced ∼62% less TBV loss compared with the loss in the otherthree treatment arms (∼−11.0 cm3 vs −17.8 cm3; p<0.0007) at40 months follow-up. At 40 months, there was also significant-ly more AWM in the intensive glycaemic treatment group(mean 1.89 cm3 [95% CI 1.78, 2.0]) compared with the stan-dard treatment group (1.71 cm3 [1.62, 1.80]; ratio of means1.10 cm3 [1.02, 1.19]; p=0.0156). However, this effect seemedto be restricted to participants <60 years (interaction betweenthe glycaemia intervention and baseline age; p=005) [16].
70 Diabetologia (2017) 60:69–80
Previous extension studies of clinical trials in persons withdiabetes have reported a sustained effect of an interventionbeyond the period of exposure [17, 18]. With ACCORDIONMIND we sought to determine whether there were sustainedor delayed long-term effects of the ACCORDMIND intensiveinterventions on the primary outcomes of the DSST and TBV,and the secondary cognitive endpoints and AWV MRI end-point at ∼80 months follow-up (or 40 months after theACCORD MIND study end). Specifically, we sought todetermine whether: (1) the mean change from baseline in cog-nitive function as measured by the DSSTwas less; and (2) themean change from baseline in TBV was lower in the grouprandomised to intensive glycaemic control compared with thegroup randomised to standard glycaemic control. We also pur-sued similar analyses comparing changes in DSST and TBV,and secondary outcomes between the BP and lipid intensiveand standard intervention arms, and measured possible inter-actions between the BP and glycaemia interventions.
Methods
Original ACCORD study design
The ACCORD and ACCORD MIND studies have been de-scribed previously [8, 9]. Briefly, ACCORD was a NorthAmerican randomised, multicentre, double 2×2 factorial trialof 10,251 middle-aged and older participants with type 2 dia-betes. All participants in the main ACCORD trial were enrolledin the glycaemia trial to compare a therapeutic strategy targetedto a HbA1c level of <6.0% (42.1 mmol/mol) (intensive therapyarm) vs a strategy that targeted HbA1c levels of 7.0–7.9%(53.0–62.8 mmol/mol) (standard therapy arm). The BP trialincluded 46.2% of all participants and compared a therapeuticstrategy targeting a systolic BP (SBP) of <120 mmHg (inten-sive therapy) to one targeting an SBP of <140 mmHg (standardtherapy). Participants meeting inclusion/exclusion criteria withan SBP of 130–180 mmHg and taking no more than threeantihypertensives were eligible for the BP trial. The remainingparticipants (53.8% of the total sample) were assigned to thelipid trial. The lipid trial compared masked administration ofplacebo or fenofibrate on HDL-cholesterol (HDL-C) levels inpersons with HDL-C levels of <2.6 mmol/l (100 mg/dl)achieved through study-supplied simvastatin.
In February 2008, an increased mortality risk in the inten-sive glycaemia intervention arm was reported, leading to thetermination of that arm and transition of those participants tothe standard glycaemic intervention protocol [19]. In theMIND subcohort, this resulted in an average treatment periodof 40 months for those in the intensive glycaemia interventiongroup. The lipid and BP trials continued to the planned com-pletion date in June 2009, providing 56 months of exposure tothe BP or lipid interventions. Similar to the larger ACCORD
trial, in ACCORD MIND there was excellent separation be-tween treatment groups for HbA1c, SBP and HDL in the glu-cose, BP and lipid trials, respectively.
ACCORDION MIND study design
Eligibility criteria To be eligible for inclusion in the ACCORDMIND subcohort participants had to meet the following criteriaat baseline: age ≥55 years; HbA1c ≥7.5% (≥58 mmol/mol); highrisk for cardiovascular events due to prevalent cardiovasculardisease (CVD) or additional cardiovascular risk factors; and noclinical evidence of cognitive impairment or dementia.
Ethics All par t ic ipants in ACCORD MIND andACCORDION MIND provided informed consent, and bothstudies were approved by the institutional review boards of thesponsors and each clinical site was approved to collect addi-tional cognitive and MRI outcomes beginning in June 2011.
Recruitment and follow-up
For the ACCORD MIND trial, participants were recruitedbetween January 2001 and October 2005. Follow-up ofACCORD MIND ended in June 2009. For the ACCORDIONMIND study, one additional follow-up cognitive assessmentwas added, targeted to be at 80 months (mean 86months, range69–116 months from baseline), providing four measures ofcognition over an average of 7 years. An additional MRI wasalso acquired at the targeted 80 month follow-up (mean84 months, range 69–112 months from baseline), providingthree measures of brain structure during the study period. TheACCORDION follow-up visits occurred from 1 May 2011(approximately 24 months post-ACCORD MIND) through to31 October 2014 (60 months post-ACCORD MIND).
Cognitive function outcome measures Cognitive functionwas assessed in ACCORDION MIND using the same meth-odology as in ACCORD MIND as described previously [9].The primary cognitive outcome remained the DSST score, de-fined as the number of correctly completed symbols in 120 sec-onds [10]. Secondary cognitive outcomes were: (1) the ReyAuditory Verbal Learning Test [20], reported as the sum ofthe number of words (0–15) recalled during the immediate-,short- and delayed-recall trials; (2) modified Stroop Colour-Word Test [21] reported as the interference score (a higherscore indicates worse function); and (3) the 30-point Mini-Mental State Examination (MMSE) [22] administered to as-sess global cognitive function and to provide a metric to com-pare the MIND cohort with other study groups. Additionally,the Physician’s Health Questionnaire [23] was administered toscreen for depression, a frequent comorbidity in individualswith type 2 diabetes and a factor that also influences cognitivetest performance. Participants who were unable to come into
Diabetologia (2017) 60:69–80 71
study centres for cognitive testing were offered the option oftaking the validated Telephone Interview Cognitive Status(TICS) [24, 25], an adaptation of the MMSE that is relativelywell-correlated with MMSE items.
BrainMRI outcomemeasures and acquisition The primaryMRI outcome remained the TBV, and the secondary MRIoutcome was AWM. The MRI acquisition and processing inACCORDION followed the previously described protocol forthe ACCORD MIND substudy [9, 26, 27]. Monthly MRIquality control procedures followed the American College ofRadiology’s (ACR’s) MRIQC programme (www.acr.org/quality-safety/accreditation/mri, accessed 2 May 2016).The performance of the MRI scanners was consistent acrossstudy sites and throughout the duration of the study asreflected by ACR phantom measurements that always met orexceeded study thresholds.
Analytical methods
The mean and standard deviation for continuous baseline char-acteristics, as well as the counts and percentages for discretebaseline characteristics were compared between participantswith andwithout anACCORDIONDSST, andwith andwithoutan MRI. To investigate whether the separation of physiologicalmeasures was maintained after the trial, we plotted the mean and95% CI for HbA1c, SBP, and HDL-C and triacylglycerol levelsover the ACCORDION follow-up by respective intervention.
Cognitive function The primary glycaemia hypothesis inACCORDION MIND was tested within the framework of arepeated measures analysis of covariance (ANCOVA), with anunstructured covariance matrix using Proc Mixed of SAS (SAS,Cary, NC, USA). Maximum likelihood (ML) was used to esti-mate fixed effects. The ML techniques accounted for the correla-tion of measures within individuals and the possibility that miss-ing outcomes depended on either observed covariates or on pre-viously observed outcomes (missing at random [MAR]) [28, 29].
To test the primary hypotheses, we compared randomisedgroups on the achieved mean change from baseline at the20 month, 40 month and 80 month cognitive assessments.Our model for change included measurements from all cogni-tive assessment visits, terms for the baseline value of the out-come, the glycaemia intervention, factors used to stratifyrandomisation (prior history of CVD, clinical centre network(CCN), allocation to BP or lipid trial, randomisation to theintensive BP group, and randomisation to the fibrate lipidgroup), a time factor (20 month, 40 month or 80 month visit),and the interaction between the time factor and the glycaemiaeffect. The hypothesis test of the glycaemia effect at the20 month, 40 month or 80 month visits was performed usinga linear contrast to compare the mean changes betweenrandomised groups at each visit.
To investigate whether the rate of decline within interven-tion groupswas different duringACCORD vsACCORDION,we also estimated change-point regression models for repeat-ed measures to allow different slopes for the ACCORD andACCORDION periods [30]. The 40 month measure waschosen as the change-point of the slope set to be at 40 monthsof follow-up and a compound symmetric covariance matrixwas used [30]. Finally, we investigated whether the rate ofdecline in the intensive glycaemia arm was the same as thatin the standard glycaemia group, within each of the ACCORDand ACCORDION study periods. To do this, we added inter-action terms between the intervention groups and rate of de-cline in the specific time period to the models.
Models to test the BP and lipid interventions were similarto those described for the glycaemia interventions. The possi-ble interactions between the BP and glycaemia interventionswas tested by adding this term into the above models.
The secondary cognitive function outcomes were analysedusing repeated measures models similar to those used for theDSST. Interactions between glycaemia and either BP or lipidintervention effects on cognitive functionwere investigated byadding two- and three-way interaction terms between the timeeffect and the intervention effects to the models. Within thesemodels, linear contrasts were used to test for interaction effectsat specific time points.
Brain MRI analysesMRI measures, including TBVand sec-ondarily, AWM, were analysed using a similar modellingapproach to that used for cognitive function. As AWM washighly skewed in our data, it was log-transformed for theanalysis (log (AWM+0.1)).
Missing outcomes sensitivity analysis As we were not ableto re-measure all ACCORD MIND participants inACCORDION, the effects of missing data on the conclusionsdrawn in these analyses need to be understood. To gain insightinto this effect we conducted three sensitivity analyses (seeESM Methods for further details).
Results
Participants
Of the 2572 (86% of baseline enrolment) surviving ACCORDMIND participants, 1962 (76%) consented to take part in theACCORDION main study (not shown). Of these MIND par-ticipants, 1328 (68% of eligible; 52% of the baseline sample)completed the 80 month visit (Fig. 1). Of the 544 (89% ofbaseline enrolment) surviving participants enrolled in theMIND-MRI portion of the study, 432 (79%) consented tothe ACCORDION main study (not shown). Of these, 292
72 Diabetologia (2017) 60:69–80

(68% of eligible and 54% of all surviving ACCORD MINDparticipants) had an MRI at 80 months (Fig. 2).
On average, the cognitive tests in ACCORDION MINDwere completed 47±4 months (range 40–66) after the inten-sive glycaemia intervention was stopped, 31 ± 4 months(range 24–50) after final follow-up of the BP and lipid trials,86±8 months (range 69–116) after randomisation, and 46±8months (range 27–74) after the final ACCORD assessmentat 40 months post-randomisation.
The mean age of the ACCORDION cohort at baseline was62.1±5.5 years, 43.1% were female and the mean duration ofdiabetes was 10.3±7.0 years (Table 1). At baseline, partici-pants missing the ACCORDION DSST measurement wereslightly more likely to be female, less likely to be white, hadlower education, a higher prevalence of previous CVD, weremore likely to be current smokers and almost twice as likely tobe uninsured. They also had a slightly higher mean HbA1c
(8.4±1.1 vs 8.2±1.0; 68.3 vs 66.1 mmol/mol), and were lesslikely to be in the intensive glycaemic group and more likelyto be in the BP trial than in the lipid trial.
The differences in characteristics between ACCORDIONMIND participants with and without an MRI were very sim-ilar to those with and without complete DSST outcomes(Table 2). In addition, those without a follow-up MRI hadlonger duration of diabetes (10.1±7.5 vs 9.7±6.8 years).
Long-term effects of the glycaemia intervention
Separation of HbA1c measures The substantial separation inmean HbA1c achieved between the treatment arms duringACCORD and ACCORD MIND was not sustained duringACCORDION MIND (6.5% intensive vs 7.6% standard[47.5 vs 59.6 mmol/mol] at 36 months, and 7.6%(59.6 mmol/mol) in both arms at the final ACCORDIONMIND visit; see ESM Fig. 1).
Cognitive test scores We found no significant difference be-tween the two glycaemic intervention groups in the adjusted80 month DSST mean change scores (Table 3), or in the meanchange scores for the MMSE, RAVLT or Stroop tests,adjusting for prior history of CVD, CCN, allocation to BP orlipid trial, randomisation to the intensive BP group, andrandomisation to the fibrate lipid group. The results for theMMSE outcome, including observations with the convertedTICS-41 scores, were similar to the results from the originalMMSE assessments (data not shown). The addition of base-line factors predictive of missing outcomes provided resultsthat were consistent with the results from the primary analysis(data not shown). In addition, sensitivity subgroup analysesconducted among sites with ≥70% participation at 80 months
10,251 ACCORD participants
5575 ACCORD participants eligible for the MIND study
2977 enrolled in MIND at the 1 month ACCORD follow-up visit
1469 participants randomly assigned to intensive glycaemia intervention in ACCORD included in MIND
1460 completed baseline measurement
9 missing
ACCORDION MIND intensive glycaemia
N=684 with 80 month follow-up
Follow-up patterns:
671 with month 20, 40 and 80 (full follow-up)
80 with only month 20 follow-up
21 with only month 40 follow-up
7 with only month 80 follow-up
600 with month 20 and month 40 follow-up
5 with month 40 and month 80 follow-up
1 with month 20 and month 80 follow-up
78 with no follow-up
1508 participants randomly assigned to standard glycaemia intervention in ACCORD included in MIND
1497 completed baseline measurement
11 missing
ACCORDION MIND standard glycaemia
N=644 with 80 month follow-up
Follow-up patterns:
634 with month 20, 40 and 80 (full follow-up)
82 with only month 20 follow-up
17 with only month 40 follow-up
4 with only month 80 follow-up
677 with month 20 and month 40 follow-up
4 with month 40 and month 80 follow-up
2 with month 20 and month 80 follow-up
79 with no follow-up
Fig. 1 Consort diagram for ACCORDION MIND cognitive function assessments
Diabetologia (2017) 60:69–80 73

revealed similar results for all cognitive analyses (ESMTable 1).
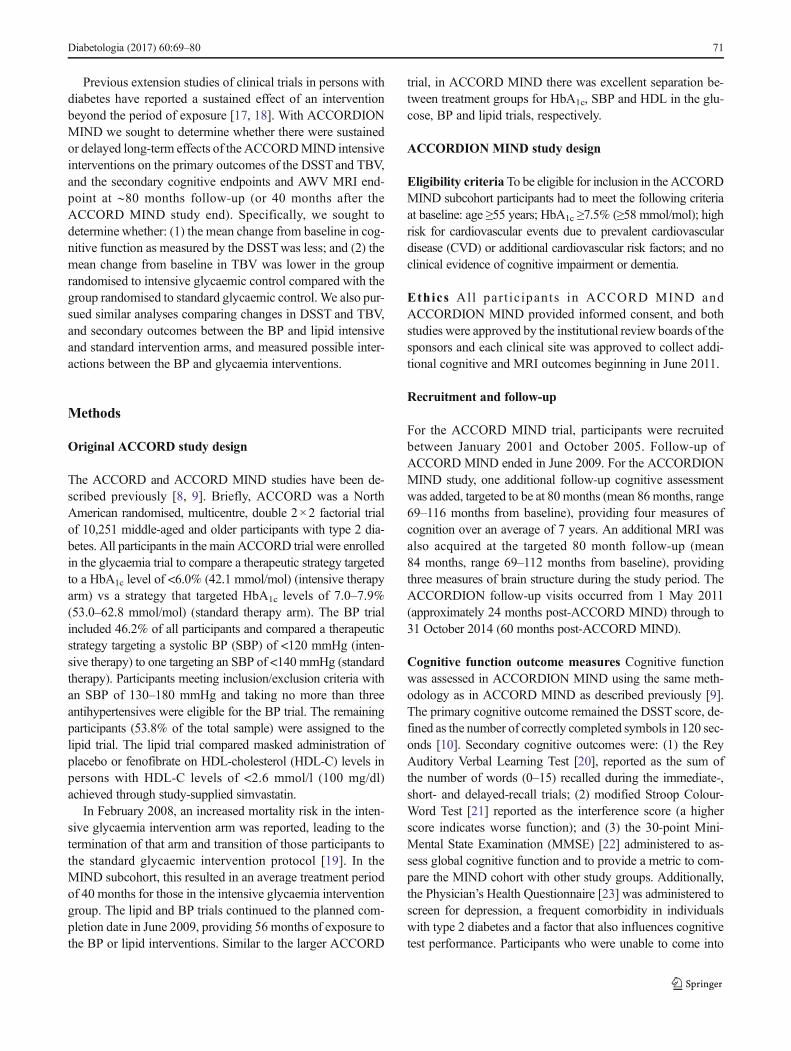
MRI outcomes Although a significantly smaller decline inTBVwas seen for the intensive vs standard glycaemic therapygroup at 40 months (4.6 cm3 [95%CI 2.0, 7.3]) less comparedwith baseline; p=0.0006), it did not persist at 80 months(p=0.91). The interaction between glycaemia interventionand time was significant (p=0.02 for equality of 40- and80 month effects). Likewise, although logAWM was signifi-cantly higher in the intensive glycaemic therapy group at40 months (p = 0.01), this difference did not persist at80 months (p=0.41) (Table 4) and the interaction with timewas not significant (p=0.30). Additionally, at the sites with≥70% participation at 80 months, results for all MRI analyseswere similar (ESM Table 2).
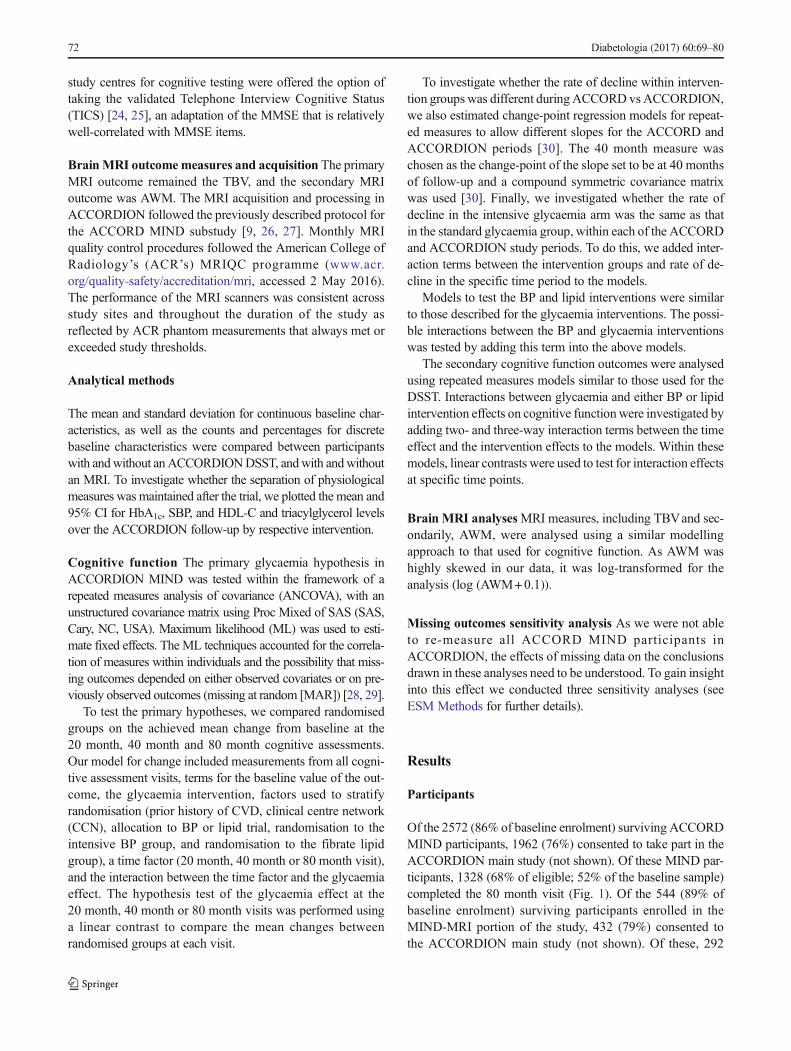
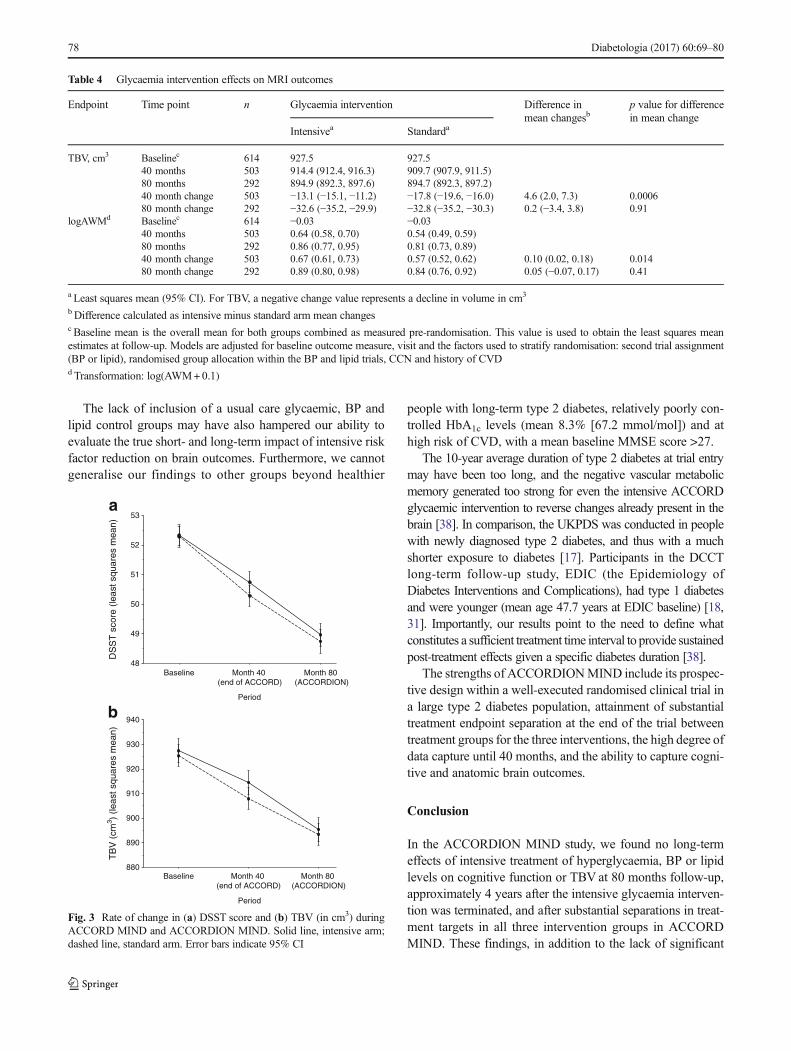
Comparisons of ACCORD and ACCORDION rates ofchange Within intervention groups, there was no evidence ofa different annual rate of decline in DSST between theACCORD and ACCORDION periods (intensive glycaemia:−0.48 and −0.46 DSST units/year, respectively, p=0.90; stan-dard glycaemia: −0.60 and 0.40 DSST units/year, respectively,p=0.10; see Fig. 3a). The total decline in DSST score of ∼3.5
points in both groups over 80 months was −0.23 standard de-viations from baseline. Additionally, the rates of decline werenot significantly different between intensive and standardglycaemia groups within each period (ACCORD periodp=0.20; ACCORDION period p=0.56). In contrast, we didfind significant differences in the rate of TBV decline duringthe ACCORD and ACCORDION periods (intensiveglycaemia: −3.86 and −5.34 cm3/year, respectively, p=0.03;standard glycaemia: −5.24 and −4.03 cm3/year, respectively,p=0.02; see Fig. 3b). However, these changes were in thereverse direction, essentially countering the previous apparentbeneficial effect on TBVof the intensive vs standard glycaemictreatment. This reversal is also captured in the significant dif-ferences in rate of TBV loss between the two groups withineach period (ACCORD period significantly less decline in theintensive glycaemic group p=0.002; ACCORDION periodsignificantly less decline in the standard group p=0.014).
Long-term effects of the BP and lipid interventions
Separation of BP and lipid measures The separations in BPand lipid treatment targets that were achieved duringACCORD (ESM Figs 2 [SBP], 3 [HDL] and, 4 [triacylglyc-erol]) were not sustained during ACCORDION.
10,251 ACCORD participants
5575 ACCORD participants eligible for the MIND study
632 enrolled in MIND-MRI at the 1 month ACCORD follow-up visit
301 intensive glycaemia intervention
participants with baseline MRI
294 participants with baseline TBV measurement
7 missing
ACCORDION MIND intensive glycaemia
N=135 with 80 month MRI
Follow-up patterns:
129 with month 40 and month 80 (full follow-up)
101 with only month 40 follow-up
6 with only month 80 follow-up
58 with no follow-up
331 standard glycaemia intervention
participants with baseline MRI
320 participants with baseline TBV measurement
11 missing
ACCORDION MIND standard glycemia
N=157 with 80 month MRI
Follow-up patterns:
156 with month 40 and month 80 (full follow-up)
117 with only month 40 follow-up
1 with only month 80 follow-up
46 with no follow-up
Fig. 2 Consort diagram for ACCORDION MIND-MRI
74 Diabetologia (2017) 60:69–80

Cognitive test scores There were no significant differencesin adjusted mean change in DSST scores at 80 months orfor the MMSE, RAVLT or Stroop tests (ESM Table 3)between intensive vs standard BP therapy or betweenthe fibrate vs placebo lipid groups. However, when miss-ing MMSE scores were replaced by converting TICS-41scores to MMSE scores, there was a significant, but clin-ically negligible, difference in adjusted mean change inMMSE scores at 80 months (p = 0.047) between thefibrate (−0.21 [95% CI −0.39, −0.03]) vs placebo (0.06[95% CI −0.13, 0.25]) lipid groups, but not between theBP arms (results not shown). In addition, in sensitivityanalyses that added depression to the primary models foreach cognitive test score there was no appreciable changein any of the glycaemia, BP or lipid intervention results.There was also no significant interaction between the
glycaemia and BP arms for any of the cognitive tests atany visit (ESM Table 4).
MRI outcomes Despite previous results of a significantlylarger decline in TBV in the intensive BP therapy vs stan-dard BP therapy group at 40 months (−4.5 cm3 [95% CI−7.9, −1.2]; p= 0.01) [10], there was no significant differ-ence in TBV decline between the groups at 80 months.TBV declined by −32.4 cm3 in the intensive group and−34.4 cm3 in the standard group (p= 0.29) (ESM Table 5).There was also no significant interaction between theglycaemic and BP arms on brain MRI measures forTBV or logAWM at 80 months (ESM Table 6); thus theapparent protective effect of the interaction of the inten-sive glycaemic treatment protocol with standard BP ther-apy at 40 months did not persist.
Table 1 Baseline characteristicscomparing participants with andwithout a DSST score atACCORDION 80 month visit
Overall(n= 2977)
No M80 measurement(n= 1649)
M80 measurementcomplete(n= 1328)
Age, years 62.5 ± 5.8 62.8 ± 6.0 62.1 ± 5.5
Sex, female 1388 (46.6) 815 (49.4) 573 (43.1)
Intensive glycaemia arm 1469 (49.3) 785 (47.6) 684 (51.5)
Subcohort
BP trial 1439 (48.3) 857 (52.0) 582 (43.8)
Lipid trial 1538 (51.7) 792 (48.0) 746 (56.2)
Race/ethnicity
White only 2074 (69.7) 1095 (66.4) 979 (73.7)
Spanish/Hispanic 212 (7.1) 120 (7.3) 92 (6.9)
Black, non-Hispanic 484 (16.3) 302 (18.3) 182 (13.7)
Asian, not Hispanic orblack
67 (2.3) 43 (2.6) 24 (1.8)
Other 140 (4.7) 89 (5.4) 51 (3.8)
Education
< High school graduate 392 (13.2) 262 (15.9) 130 (9.8)
High school graduate/GED 769 (25.8) 462 (28.0) 307 (23.1)
Some college/tech 1027 (34.5) 554 (33.6) 473 (35.6)
College graduate or more 789 (26.5) 371 (22.5) 418 (31.5)
Prior CVD 869 (29.2) 521 (31.6) 348 (26.2)
Live with someone 2320 (77.9%) 1253 (76.0%) 1067 (80.3%)
Uninsured 516 (17.3%) 361 (21.9%) 155 (11.7%)
Alcohol >8 drinks per week 257 (8.6%) 115 (7.0%) 142 (10.7%)
Depression 872 (29.3%) 503 (30.5%) 369 (27.8%)
Smoking status
Never 1327 (44.6) 726 (44.1) 601 (45.3)
Former 1295 (43.5) 699 (42.5) 596 (44.9)
Current 352 (11.8) 221 (13.4) 131 (9.9)
SF-36 General health 36.9 ± 12.8 37.4 ± 13.3 36.3 ± 12.1
Diabetes duration 10.4 ± 7.3 10.5 ± 7.6 10.3 ± 7.0
HbA1c, % (mmol/mol) 8.3 ± 1.1 (67.2) 8.4 ± 1.1 (68.3) 8.2 ± 1.0 (66.1)
Data presented are mean ± SD or n (%)
Diabetologia (2017) 60:69–80 75

Discussion
We found no long-term effects of the intensive glycaemic, BP orlipid interventions on cognition or brain structure outcomes at80months follow-up inACCORDIONMIND.Most noteworthyis the lack of a sustained effect on TBVof any of the treatmentarms, despite significantMRI findings at 40months. Specifically,at 80 months of follow-up there was no longer evidence for lessatrophy associated with intensive glycaemic therapy, or increasedatrophy associated with intensive BP control, nor any persistenceof an interactive effect for the combination of standard antihyper-tensive therapy plus intensive glycaemic control being associatedwith the least atrophy. However, the lack of any long-term effectalso means the intensive treatment arms did not have long-lastingdetrimental effects on cognition or TBV, despite the overall in-creased risk of mortality in the intensive glycaemic group that ledto early ACCORD termination.
We sought to determine whether there was a long-termeffect of the initial glycaemic intervention because previousstudies in people with diabetes, including the UK ProspectiveDiabetes Study (UKPDS) and DCCT [18, 31], had demon-strated a delayed effect of glycaemic control on microvascularoutcomes. In addition, the initial ACCORD glycaemia resultsshowed a benefit in some microvascular outcomes, includingdelayed onset of albuminuria, some measures of neuropathy(loss of ankle jerk and light touch) and cataract surgery (ad-justed OR 0.89 [95% CI 0.80, 0.99]; p= 0.03) [32]. TheACCORDION EYE study also recently reported a delayedbeneficial effect of a mean of 3.7 years of intensive glycaemiccontrol on the progression of diabetic retinopathy during the8-year follow-up in ACCORDION Eye (n = 1310) [33].Diabetic retinopathy progressed in 5.8% of individuals in theintensive glycaemic treatment group vs 12.7% in the standardgroup (adjusted OR 0.42 [95% CI 0.28, 0.63]; p<0.0001).
Table 2 Baseline characteristicscomparing participants with andwithout anMRI at ACCORDION80 month visit
Overall (n = 614) No M80 MRI (n= 322) M80 MRIcomplete (n= 292)
Age, years 62.4 ± 5.7 62.7 ± 6.1 62.0 ± 5.3
Sex, female 273 (44.5) 144 (44.7) 129 (44.2)
Intensive glycaemia arm 294 (47.9) 159 (49.4) 135 (46.2)
Subcohort
BP trial 378 (61.6) 202 (62.7) 176 (60.3)
Lipid trial 236 (38.4) 120 (37.3) 116 (39.7)
Race/ethnicity
White only 420 (68.4) 213 (66.1) 207 (70.9)
Spanish/Hispanic 39 (6.4) 18 (5.6% 21 (7.2)
Black, non-Hispanic 103 (16.8) 55 (17.1) 48 (16.4)
Asian, not Hispanic or black 9 (1.5) 6 (1.9) 3 (1.0)
Other 43 (7.0) 30 (9.3) 13 (4.5)
Education
< High school graduate 62 (10.1) 41 (12.7) 21 (7.2)
High school graduate/GED 148 (24.1) 79 (24.5) 69 (23.6)
Some college/tech 210 (34.2) 113 (35.1) 97 (33.2)
College graduate or more 194 (31.6) 89 (27.6) 105 (36.0)
Prior CVD 160 (26.1) 97 (30.1) 63 (21.6)
Live with someone 468 (76.2) 242 (75.2) 226 (77.4)
Uninsured 103 (16.8) 64 (19.9) 39 (13.4)
Alcohol >8 drinks per week 56 (9.1) 31 (9.6) 25 (8.6)
Depression 192 (31.3) 106 (32.9) 86 (29.5)
Smoking status
Never 275 (44.9) 136 (42.4) 139 (47.6)
Former 258 (42.1) 134 (41.7) 124 (42.5)
Current 80 (13.1) 51 (15.9) 29 (9.9)
SF-36 General health 37.0 ± 12.9 37.2 ± 13.1 36.7 ± 12.7
Diabetes duration 9.9 ± 7.2 10.1 ± 7.5 9.7 ± 6.8
HbA1c, % (mmol/mol) 8.2 ± 1.0 (66.1) 8.3 ± 1.1 (67.2) 8.1 ± 0.9 (65.0)
Data presented are mean ± SD or n (%)
76 Diabetologia (2017) 60:69–80

Therefore, we hypothesised that we might observe a delayedbeneficial effect on cognition if there were metabolic changesinduced by the glycaemic intervention, and that the differencein TBV would be maintained or increased.
There may be several explanations for the lack ofobserved long-term effects in ACCORDION. Importantly,the substantial differences in therapeutic targets of each ofthe three interventions (glycaemic, BP and lipid) were notsustained during ACCORDION. The provision of freemedications and frequent follow-up clinic visits duringthe study intervention may have reinforced treatment com-pliance and consequently treatment arm separation. The
substantial loss to follow-up at 80 months limited powerto discern differences in outcomes, even if effects had beensustained. In addition, participants with the greatest risk forcognitive change and TBV decline were more likely to missthe DSST at 80 months; on average, they were less educat-ed, of non-white race/ethnicity, and had a longer duration ofdiabetes, higher HbA1c levels and more CVD, all of whichare factors known to impact on the trajectory of cognitivedecline [34–37]. Therefore, there was a bias towards ahealthier cohort. However, our missing data sensitivityanalyses suggest that this bias would not substantially alterthe conclusions.
Table 3 Glycaemia intervention effect on cognitive function outcome
Endpoint Time point n Glycaemia intervention Difference in mean changesb p value for difference inmean change
Intensivea Standarda
DSST Baselinec 2957 52.55 52.55
20 months 2747 51.52 (51.10, 51.94) 50.98 (50.56, 51.39)
40 months 2629 50.93 (50.51, 51.36) 50.61 (50.18, 51.03)
80 months 1323 49.10 (48.52, 49.69) 48.79 (48.19, 49.38)
20 month change 2747 −1.03 (−1.45, −0.61) −1.57 (−1.99, −1.16) 0.54 (−0.04, 1.13) 0.07
40 month change 2629 −1.62 (−2.04, −1.19) −1.94 (−2.37, −1.52) 0.33 (−0.27, 0.93) 0.29
80 month change 1323 −3.45 (−4.03, −2.86) −3.76 (−4.36, −3.17) 0.32 (−0.52, 1.15) 0.46
RAVLT Baselinec 2968 7.52 7.52
20 months 2762 7.88 (7.79, 7.97) 7.85 (7.76, 7.94)
40 months 2629 8.00 (7.90, 8.10) 7.99 (7.90, 8.09)
80 months 1307 7.45 (7.32, 7.59) 7.51 (7.38, 7.65)
20 month change 2762 0.36 (0.27, 0.45) 0.33 (0.24, 0.42) 0.03 (−0.10, 0.16) 0.63
40 month change 2629 0.48 (0.38, 0.58) 0.47 (0.38, 0.57) −0.01 (−0.13, 0.14) 0.92
80 month change 1307 −0.07 (−0.20, 0.07) −0.01 (−0.14, 0.13) −0.06 (−0.25, 0.13) 0.54
Stroop Baselinec 2941 32.0 32.0
20 months 2705 30.86 (30.19, 31.54) 31.46 (30.78, 32.12)
40 months 2590 31.46 (30.70, 32.22) 32.07 (31.32, 32.82)
80 months 1286 35.21 (34.14, 36.28) 35.80 (34.71, 36.89)
20 month change 2705 −1.14 (−1.81, −0.46) −0.54 (−1.20, 0.12) −0.60 (−1.54, 0.35) 0.22
40 month change 2590 −0.54 (−1.30, 0.22) 0.07 (−0.68, 0.82) −0.61 (−1.67, 0.45) 0.26
80 month change 1286 3.21 (2.14, 4.28) 3.80 (2.71, 4.89) −0.59 (−2.12, 0.94) 0.45
MMSE Baselinec 2977 27.39 27.39
20 months 2777 27.27 (27.16, 27.37) 27.27 (27.17, 27.37)
40 months 2654 27.04 (26.90, 27.18) 27.05 (26.92, 27.19)
80 months 1320 26.96 (26.82, 27.11) 27.00 (26.85, 27.14)
20 month change 2777 −0.12 (−0.23, −0.02) −0.12 (−0.22, −0.02) −0.01 (−0.15, 0.14) 0.94
40 month change 2654 −0.35 (−0.49, −0.21) −0.34 (−0.47, −0.20) −0.01 (−0.21, 0.18) 0.90
80 month change 1320 −0.43 (−0.57, −0.28) −0.39 (−0.54, −0.25) −0.03 (−0.24, 0.17) 0.75
a Least squares mean (95% CI). For DSST, RAVLT and MMSE a negative change value represents a decline in cognitive score; for the Stroop test, apositive change value represents a worsening scoreb Difference calculated as intensive minus standard arm mean changesc Baseline mean is the overall mean for both groups combined as measured pre-randomisation. This value is used to obtain the least squares meanestimates at follow-up. Models are adjusted for baseline outcome measure, visit and the factors used to stratify randomisation: second trial assignment(BP or lipid), randomised group allocation within the BP and lipid trials, CCN and history of CVD
Diabetologia (2017) 60:69–80 77
The lack of inclusion of a usual care glycaemic, BP andlipid control groups may have also hampered our ability toevaluate the true short- and long-term impact of intensive riskfactor reduction on brain outcomes. Furthermore, we cannotgeneralise our findings to other groups beyond healthier
people with long-term type 2 diabetes, relatively poorly con-trolled HbA1c levels (mean 8.3% [67.2 mmol/mol]) and athigh risk of CVD, with a mean baseline MMSE score >27.
The 10-year average duration of type 2 diabetes at trial entrymay have been too long, and the negative vascular metabolicmemory generated too strong for even the intensive ACCORDglycaemic intervention to reverse changes already present in thebrain [38]. In comparison, the UKPDS was conducted in peoplewith newly diagnosed type 2 diabetes, and thus with a muchshorter exposure to diabetes [17]. Participants in the DCCTlong-term follow-up study, EDIC (the Epidemiology ofDiabetes Interventions and Complications), had type 1 diabetesand were younger (mean age 47.7 years at EDIC baseline) [18,31]. Importantly, our results point to the need to define whatconstitutes a sufficient treatment time interval to provide sustainedpost-treatment effects given a specific diabetes duration [38].
The strengths of ACCORDIONMIND include its prospec-tive design within a well-executed randomised clinical trial ina large type 2 diabetes population, attainment of substantialtreatment endpoint separation at the end of the trial betweentreatment groups for the three interventions, the high degree ofdata capture until 40 months, and the ability to capture cogni-tive and anatomic brain outcomes.
Conclusion
In the ACCORDION MIND study, we found no long-termeffects of intensive treatment of hyperglycaemia, BP or lipidlevels on cognitive function or TBV at 80 months follow-up,approximately 4 years after the intensive glycaemia interven-tion was terminated, and after substantial separations in treat-ment targets in all three intervention groups in ACCORDMIND. These findings, in addition to the lack of significant
Table 4 Glycaemia intervention effects on MRI outcomes
Endpoint Time point n Glycaemia intervention Difference inmean changesb
p value for differencein mean change
Intensivea Standarda
TBV, cm3 Baselinec 614 927.5 927.540 months 503 914.4 (912.4, 916.3) 909.7 (907.9, 911.5)80 months 292 894.9 (892.3, 897.6) 894.7 (892.3, 897.2)40 month change 503 −13.1 (−15.1, −11.2) −17.8 (−19.6, −16.0) 4.6 (2.0, 7.3) 0.000680 month change 292 −32.6 (−35.2, −29.9) −32.8 (−35.2, −30.3) 0.2 (−3.4, 3.8) 0.91
logAWMd Baselinec 614 −0.03 −0.0340 months 503 0.64 (0.58, 0.70) 0.54 (0.49, 0.59)80 months 292 0.86 (0.77, 0.95) 0.81 (0.73, 0.89)40 month change 503 0.67 (0.61, 0.73) 0.57 (0.52, 0.62) 0.10 (0.02, 0.18) 0.01480 month change 292 0.89 (0.80, 0.98) 0.84 (0.76, 0.92) 0.05 (−0.07, 0.17) 0.41
a Least squares mean (95% CI). For TBV, a negative change value represents a decline in volume in cm3
bDifference calculated as intensive minus standard arm mean changesc Baseline mean is the overall mean for both groups combined as measured pre-randomisation. This value is used to obtain the least squares meanestimates at follow-up. Models are adjusted for baseline outcome measure, visit and the factors used to stratify randomisation: second trial assignment(BP or lipid), randomised group allocation within the BP and lipid trials, CCN and history of CVDdTransformation: log(AWM+0.1)
48
49
50
51
52
53a
b
Baseline Month 40 (end of ACCORD)
Month 80 (ACCORDION)
DS
ST
sco
re (
leas
t squ
ares
mea
n)
Period
880
890
900
910
920
930
940
Baseline Month 40 (end of ACCORD)
Month 80 (ACCORDION)
TB
V (
cm3 )
(leas
t squ
ares
mea
n)
Period
Fig. 3 Rate of change in (a) DSST score and (b) TBV (in cm3) duringACCORD MIND and ACCORDION MIND. Solid line, intensive arm;dashed line, standard arm. Error bars indicate 95% CI
78 Diabetologia (2017) 60:69–80
cognitive outcomes in ACCORDMIND at 40 months, do notsupport aggressive glycaemic, BP and lipid control to preventcognitive decline in older people who have had type 2 diabetesfor, on average, 10 years.
Acknowledgements The authors wish to thank M. Bartkoske, and S.Pederson, both at the Berman Center for Clinical Research, and N. Booth,at the Chronic Disease Research Group, all at the Minneapolis MedicalResearch Foundation, Hennepin CountyMedical Center, Minneapolis fortheir assistance in manuscript preparation.
Funding ACCORD was funded by the National Heart, Lung, andBlood Institute (NHLBI) contracts N01-HC-95178, N01-HC-95179,N01-HC-95180, N01-HC-95181, N01-HC-95182, N01-HC-95183,N01-HC-95184, IAA#Y1-HC-9035 and IAA#Y1-HC-1010.ACCORDION MIND was funded through an intra-agency agreementbetween the National Institute on Aging (NIA) and NHLBI (AG-0008),NIA contract (HSN271201000023C) and the NIA Intramural ResearchProgram. Other components of the National Institutes of Health, includ-ing the National Institute of Diabetes, and Digestive and Kidney Diseasesand the National Eye Institute, contributed funding. The Centers forDisease Control and Prevention funded ACCORD substudies of cost-effectiveness and health-related quality of life. General ClinicalResearch Centers provided support at many sites.
The following companies provided study medications, equipment orsupplies: Abbott Laboratories (Abbott Park, IL, USA); AmylinPharmaceutical (San Diego, CA, USA); AstraZeneca PharmaceuticalsLP (Wilmington, DE, USA); Bayer HealthCare LLC (Tarrytown, NY,USA); Closer Healthcare Inc. (Tequesta, FL, USA); GlaxoSmithKlinePharmaceuticals (Philadelphia, PA, USA); King Pharmaceuticals, Inc.(Bristol, TN, USA); Merck & Co., Inc. (Whitehouse Station, NJ, USA);Novartis Pharmaceuticals, Inc. (East Hanover, NJ, USA); Novo Nordisk,Inc. (Princeton, NJ, USA); Omron Healthcare, Inc. (Schaumburg, IL,USA); Sanofi U.S. (Bridgewater, NJ, USA); Schering-PloughCorporation (Kenilworth, NJ, USA). The donors of medications and de-vices had no role in the study design, data accrual and analysis, or man-uscript preparation.
Duality of interest The authors declare that there is no duality of inter-est associated with this manuscript.
Author contributions All authors made substantial contributions to (1)conception and design, acquisition of data, or analysis and interpretationof data; (2) drafting the article or revising it critically for important intel-lectual content; and (3) gave final approval of the version to be published.JDW and MEM are the guarantors of this work and, as such, had fullaccess to all the data in the study and take responsibility for the integrityof the data and the accuracy of the data analysis.
References
1. Biessels GJ, Stakenborg S, Brunner E, Brayne C, Scheltens P(2006) Risk of dementia in diabetes mellitus: a systematic review.Lancet Neurol 5:64–74
2. Ramirez A,Wolfsgruber S, Lange C et al (2014) Elevated HbA1c isassociated with increased risk of incident dementia in primary carepatients. J Alzheimers Dis 44:1203–1212
3. Jongen C, van der Grond J, Kappelle LJ, Biessels GJ, ViergeverMA, Pluim JP (2007) Automated measurement of brain and white
matter lesion volume in type 2 diabetes mellitus. Diabetologia 50:1509–1516
4. Elias PK, EliasMF, D’Agostino RB et al (1997) NIDDMand bloodpressure as risk factors for poor cognitive performance. TheFramingham Study. Diabetes Care 20:1388–1395
5. Schmidt R, Launer LJ, Nilsson LG et al (2004) Magnetic resonanceimaging of the brain in diabetes: the Cardiovascular Determinantsof Dementia (CASCADE) study. Diabetes 53:687–692
6. Ahtiluoto S, Polvikoski T, Peltonen M et al (2010) Diabetes,Alzheimer’s disease, and vascular dementia: a population-basedneuropathologic study. Neurology 75:1195–1202
7. Wardlaw JM, Allerhand M, Doubal FN et al (2014) Vascular riskfactors, large-artery atheroma, and brain white matterhyperintensities. Neurology 82:1331–1338
8. Buse JB, Bigger JT, Byington RP et al (2007) Action to ControlCardiovascular Risk in Diabetes (ACCORD) trial: design andmethods. Am J Cardiol 99:21i–33i
9. Williamson JD, Miller ME, Bryan RN et al (2007) TheAction to Control Cardiovascular Risk in Diabetes Memoryin Diabetes Study (ACCORD-MIND): rationale, design, andmethods. Am J Cardiol 99:112i–122i
10. Wechsler D (1981) The Wechsler adult intelligence scale-revised.The Psychological Corporation, New York, NY
11. Vernooij MW, de Groot M, van der Lugt A et al (2008) Whitematter atrophy and lesion formation explain the loss of structuralintegrity of white matter in aging. Neuroimage 43:470–477
12. Fox NC, Schott JM (2004) Imaging cerebral atrophy: normal age-ing to Alzheimer’s disease. Lancet 363:392–394
13. Resnick S, Inaba K, Karamanos E et al (2014) Clinical relevance ofmagnetic resonance imaging in cervical spine clearance: a prospec-tive study. JAMA Surg 149:934–939
14. van Harten B, de Leeuw FE, Weinstein HC, Scheltens P, BiesselsGJ (2006) Brain imaging in patients with diabetes: a systematicreview. Diabetes Care 29:2539–2548
15. Debette S, Markus HS (2010) The clinical importance of whitematter hyperintensities on brain magnetic resonance imaging: sys-tematic review and meta-analysis. BMJ 341:c3666
16. Launer LJ, Miller ME, Williamson JD et al (2011) Effects of inten-sive glucose lowering on brain structure and function in people withtype 2 diabetes (ACCORD MIND): a randomised open-labelsubstudy. Lancet Neurol 10:969–977
17. Holman RR, Paul SK, Bethel MA, Matthews DR, Neil HA (2008)10-year follow-up of intensive glucose control in type 2 diabetes.N Engl J Med 359:1577–1589
18. White NH, Sun W, Cleary PA et al (2008) Prolonged effect ofintensive therapy on the risk of retinopathy complications in pa-tients with type 1 diabetes mellitus: 10 years after the DiabetesControl and Complications Trial. Arch Ophthalmol 126:1707–1715
19. Gerstein HC, Miller ME, Byington RP et al (2008) Effects of in-tensive glucose lowering in type 2 diabetes. N Engl J Med 358:2545–2559
20. Lezak MD (1995) Neuropsychological Assessment, 3rd edn.Oxford University Press, New York, NY
21. Houx PJ, Jolles J, Vreeling FW (1993) Stroop interference: agingeffects assessed with the Stroop Color-Word Test. Exp Aging Res19:209–224
22. Folstein MF, Folstein SE, McHugh PR (1975) "Mini-mental state".A practical method for grading the cognitive state of patients for theclinician. J Psychiatr Res 12:189–198
23. Kroenke K, Spitzer RL,Williams JB (2001) The PHQ-9: validity ofa brief depression severity measure. J Gen Intern Med 16:606–613
24. Brandt J, Spencer M, Folstein MF (1988) The telephone interviewfor cognitive status. Neuropsychiatry Neuropsychol Behav Neurol1:111–117
Diabetologia (2017) 60:69–80 79
25. Fong TG, Fearing MA, Jones RN et al (2009) Telephone Interviewfor Cognitive Status: creating a crosswalk with the Mini-MentalState Examination. Alzheimers Dement 5:492–497
26. Goldszal AF, Davatzikos C, Pham DL, Yan MX, Bryan RN,Resnick SM (1998) An image-processing system for qualitativeand quantitative volumetric analysis of brain images. J ComputAssist Tomogr 22:827–837
27. Lao Z, Shen D, Liu D et al (2008) Computer-assisted segmentationof white matter lesions in 3D MR images using support vectormachine. Acad Radiol 15:300–313
28. Little RJA, Rubin DB (2002) Statistical analysis with missing data,3rd edn. John Wiley & Sons, Hoboken, NJ
29. Molenberghs G, Kenward MG (eds) (2007)Missing data in clinicalstudies. Wiley & Sons, Chichester
30. Hudson DJ (1966) Fitting segmented curves whose join pointes tohave to be estimated. JASA 61:1097–1129
31. Martin CL, Waberski BH, Pop-Busui R et al (2010) Vibration per-ception threshold as a measure of distal symmetrical peripheralneuropathy in type 1 diabetes: results from the DCCT/EDIC study.Diabetes Care 33:2635–2641
32. Ismail-Beigi F, Craven T, Banerji MA et al (2010) Effect of inten-sive treatment of hyperglycaemia on microvascular outcomes intype 2 diabetes: an analysis of the ACCORD randomised trial.Lancet 376:419–430
33. Action to Control Cardiovascular Risk in Diabetes Follow-On(ACCORDION) Eye Study Group and the Action to ControlCardiovascular Risk in Diabetes Follow-On (ACCORDION)Study Group (2016) Persistent effects of intensive glycemic controlon retinopathy in type 2 diabetes in the Action to ControlCardiovascular Risk in Diabetes (ACCORD) follow-on study.Diabetes Care 39:1089–1100
34. Norton S, Matthews FE, Barnes DE, Yaffe K, Brayne C (2014)Potential for primary prevention of Alzheimer’s disease: an analysisof population-based data. Lancet Neurol 13:788–794
35. Yaffe K, Falvey C, Harris TB et al (2013) Health ABC Study. Effectof socioeconomic disparities on incidence of dementia among bira-cial older adults: prospective study. BMJ 19:347
36. Rawlings AM, Sharrett AR, Schneider AL et al (2014) Diabetes inmidlife and cognitive change over 20 years: a cohort study. AnnIntern Med 161:785–793
37. Haring B, Leng X, Robinson J et al (2013) Cardiovascular diseaseand cognitive decline in postmenopausal women: results from theWomen’s Health Initiative Memory Study. J Am Heart Assoc 2,e000369
38. Bianchi C, Miccoli R, Del PS (2013) Hyperglycemia and vascularmetabolic memory: truth or fiction? Curr Diab Rep 13:403–410
80 Diabetologia (2017) 60:69–80