Embed Size (px)
Citation preview
Accounting for absorption saturationeffects in pulsed infrared laser-excitedphotothermal spectroscopy
Stephen E. Bialkowski
Equations that relate photothermal lens focal lengths and photothermal deflection angles to saturationabsorption coefficients are derived. These equations are derived for two-level absorbers with bothhomogeneously and inhomogeneously broadened transitions. Initial and time-dependent photothermallens signals are calculated. Equations describing the zero-time signals are exact to within thesimplifying assumptions of the derivation, while the time-dependent signals are approximate. Theapproximation is performed by the use of a finite series of Gaussian functions to model the temperaturechange profile distorted by nonlinear absorption. The excitation irradiance-dependent signal behaviorfor rectangular and exponential excitation pulse time profiles for homogeneously and inhomogeneouslybroadened transitions are compared. Absorbed energies are used to calculate effective absorbancesobtained by the use of conventional and photothermal lensing spectrometry. The conclusions drawnfrom these comparisons are that pulsed laser photothermal spectroscopy is sensitive to the excitationlaser's pulse temporal profile and the transition broadening mechanism.
1. Introduction
Nonlinear absorption spectroscopy can yield informa-tion about atomic and molecular structures anddynamics that cannot be obtained by conventionalspectroscopic techniques.' But in addition to thebeneficial aspects, nonlinear absorptions measure-ments can be plagued by experimental artifacts thatare difficult to describe and characterize.2 3 Thereare several causes of experimental artifacts. First,optical power delivered to the sample with continuous-wave lasers can result in significant sample heating.This heating results in a change in energy-levelpopulations2 4 and can also cause photothermal lens-ing. Also, the attenuation varies along the samplepathlength for highly absorbing samples with nonlin-ear absorption. This gives rise to complicated nonlin-ear irradiance-dependent absorption behavior.4 Thisproblem is further complicated if the excitation sourcealso has a spatially varying beam profile.
Among the most successful methods for measuringnonlinear absorption are the pulsed laser photother-mal spectroscopy (PL-PTS) techniques.5 PL-PTS is
The author is with the Department of Chemistry and Biochemis-try, Utah State University, Logan, Utah 84322-0300.
Received 22 January 1992.0003-6935/93/183177-13$06.00/0.c 1993 Optical Society of America.
an ultrasensitive technique used to measure sampleabsorption. Because of the high sensitivity, samplesthat are dilute in the absorbing species are utilized.Optically thin samples result in negligible irradianceattenuation through the length of the sample.Nonlinear optical absorption is common in pulsedlaser-excited photothermal spectroscopy. Twar-owski and Kliger realized the importance of pulsedlaser-excited photothermal lens spectroscopy (PL-PLS) for measuring multiphoton transitions.6 7 Theresult of their study showed that multiphoton absorp-tion can enhance the PL-PLS signal by narrowing thespatial temperature change profile. Long and Bi-alkowski3 89 have examined some of the implicationsof optical saturation in gas-phase infrared PL-PTS.They predicted that saturation of homogeneouslybroadened transitions flattens the temperature changeprofile and thereby decreases in the initial, zero-timesignal magnitude over that expected.8 However, op-tical saturation can actually increase the signal andthe precision of the measurements in pulsed laserphotothermal deflection spectroscopy (PL-PDS).2
Multiphoton and optical saturation absorption wereobserved in infrared PL-PDS of gas-phase chlorofluo-rocarbon species.9 However, the excitation energy-dependent signals were used only in terms of theirutility for species discrimination. More recently,Poston and Harris10 estimated saturation irradi-
20 June 1993 / Vol. 32, No. 18 / APPLIED OPTICS 3177
ances, energy-transfer kinetics, and enthalpies oftriplet benzophenone in condensed-phase samples byexamining time-dependent PL-PDS signals over arange of excitation irradiances.
Quantitative information on condensed-phase sam-ples has also come from photothermal wave-mixingtechniques. McGraw, et al. " and Zhu and Har-ris12"13 have examined nonlinear absorption in con-densed-phase species by using thermal gratings. Inthis technique a volume phase grating is made bycrossing two coherent pump laser beams in thesample. By examining the relative signal powers ofthe probe laser diffracted through different orders ofthe distorted grating, nonlinear absorption and ki-netic parameters were estimated. The main draw-back to this technique is the experimental complexity.Measurements must be made at several probe beamangles in order to extract the information necessaryto estimate the nonlinear parameters.
The simplest experiments are those that use amicrophone to detect the photoacoustic spectroscopy(PAS) signal generated by the absorbed energy.Cox14 has measured saturation and multiphoton ab-sorption in SF6. Chin et al.15 have measured multi-photon absorptions for SF6 and CH30H. Seder andWeitz16 have measured excitation irradiance-depen-dent absorption parameters for a number of gas-phase alkyl chlorides and hexadienes. The draw-back to the PAS technique is in signal interpretation.The signal is a function of the energy absorbed, theexcitation beam profile, and the response of themicrophone. Chin et al. raised questions over signalinterpretation in 1982.15 There has been substan-tial progress made in signal interpretation since thattime.16 But the change in the absorbed energy pro-file over that of the excitation beam profile has notbeen accounted for in PAS absorption.
The purpose of this study is develop a quantitativetheory for irradiance-dependent PL-PTS signals whenoptical saturation occurs. Although saturation ef-fects are commonly observed, details of how satura-tion affects the resultant experimental observationshave not been previously addressed. These detailsmay be critical to the understanding of how experi-mental observations can be used to elucidate nonlin-ear absorption behavior. Equations are derived withthe vibrational excitation of gas-phase species inmind. But the results should be applicable to elec-tronic excitation and condensed-phase samples aswell.
In infrared laser-excited spectroscopy, calculationof the quantity of light deposited as heat in thesample is difficult owing to the larger number ofrotational and vibrational states available to all butthe simplest of molecules.124 In order to gain someinsight into the effects of saturation, this studyexamines a hypothetical two-level system. The twolevels are the specific rovibrational states coupled byexcitation radiation. These states are broadened byhomogeneous and inhomogeneous mechanisms.Inhomogeneous broadening includes Doppler broad-
ening and the rotational level envelope. Thus rovi-brational states not radiatively coupled are treated asbackground states that make up the inhomogenouslybroadened line. Two limiting categories of rovibra-tional energy levels are treated. For small, lightmolecules, the rovibrational transition spacing islarge compared with the homogeneous linewidth, andthe transition linewidth is homogeneous. In largemolecules, rovibrational transition spacing is smallcompared with the homogeneous linewidth, althoughthe absorption band is wider than the homogeneouslinewidth. In this case the transition is dominatedby the inhomogeneous linewidth. If rotational relax-ation is slow, the transition linewidth will be strictlyinhomogeneous.
Intramolecular energy transfer may be either slowor fast relative to pulsed laser excitation. Treatmentof saturation is simplified in either of these twolimits. If the background to radiatively coupledstate energy-transfer times are long compared withthe excitation pulse duration, then individual rovibra-tional levels, and optical transitions between them,are effectively isolated on the time scale of excitation.If, on the other hand, background to radiativelycoupled state energy transfer is fast, then all levelsare effectively connected on the time scale of excita-tion. In this case, inhomogenously broadened tran-sitions are ineffective for isolating individual states.In terms of the dynamics of excitation, the transitionsare effectively homogeneous. The latter case is appli-cable to high-pressure gas and condensed-phase sam-ples.
In PL-PTS, a pulsed excitation laser is used to excitthe sample, and a continuous probe laser is used tomonitor the refractive-index change that results fromsample heating. Sample heating is spatially aniso-tropic because of the spatially anisotropic pump laserbeam profile. The process resulting in the produc-tion and decay of the PL-PTS signals can be thoughtof as occurring in steps. First, pulsed excitationresults in the production of excited-state species.The net energy of the sample has increased. Relax-ation of excited-state species results in a temperatureincrease. Relaxation occurs both during excitationand after excitation in the case of long-lived excitedstates. The temperature increase results in a changeof the refractive index. Finally, the temperaturereturns to that of the surrounding medium by ther-mal diffusion. There are thus three time-dependentprocesses: excitation, excited-state relaxation, andthermal diffusion. The time scale for thermal diffu-sion is generally long compared with either excitationor relaxation.5
Spectrometers are designed such that PL-PLS mon-itors an increase in probe laser beam divergence, andPL-PDS monitors changes in the position of thespatially averaged beam spot. PL-PDS signals areproportional to the off-axis spatial gradient in therefractive index caused by sample heating. The gra-dient is similar to a prism. PL-PLS signals areproportional to the inverse focal length of the photo-
3178 APPLIED OPTICS / Vol. 32, No. 18 / 20 June 1993
thermal lens. This lens in turn is related to theon-axis spatial curvature of the refractive-index per-turbation caused by spatially dependent sample heat-ing. For an undistorted Gaussian beam profile, re-fractive-index gradients and curvatures are bothproportional to the magnitude of the index perturba-tion and inversely proportional to the squared excita-tion laser beam waist radius. When the sample isexcited by laser with an undistorted Gaussian beamprofile, the two techniques are similar and yieldequivalent results.
Central to calculating the PL-PTS signals is adetermination of the gradient and the curvature ofthe spatially dependent refractive-index perturbation.The profile of the absorbed energy is distorted overthat of the excitation laser when saturation occurs.The resulting refractive-index perturbations are nolonger Gaussian. This results in changes of thegradients and the curvatures that are not necessarilyrelated to each other. In fact, the maximum off-axisgradient increases while the on-axis curvature de-creases.
In this paper, equations for PL-PLS and PL-PDSsignals at saturating irradiances are derived, and theresults are discussed. Two limiting types of satura-tion behavior are considered. These depend on theparticular broadening mechanisms involved in a tran-sition and the relative rates of excitation and relax-ation to nonresonant states. The derivations followthe usual order. The spatially dependent energydeposited in the sample during the laser pulse is firstcalculated. Next the initial PL-PLS and PL-PDSsignal magnitudes are found. Finally, the time-dependent signals are calculated. These derivationsstart with a discussion of optical saturation on thetwo limiting cases. The usual assumptions appliedto PL-PTS are used.5 6 In particular, the excitationlaser beam is Gaussian, the beam waist radius isconstant over the length of the sample, and the laserpulse is shorter than the time scale for thermaldiffusion.
2. Optical Saturation of Two-Level Transitions
Optical saturation occurs when the stimulated emis-sion rate competes with that of relaxation. In thelimit in which dephasing time T2 is much shorterthan either optical pumping or relaxation times T1,the so-called incoherent system can be treated bycoupled rate expressions.' The net result is that theoptical absorption coefficient can be recast in a formthat is dependent on the strength of the excitationsource.
The optical frequency-dependent absorption coeffi-cient is given by the convolution of the homogeneouslinewidth with the inhomogeneous band shape:
a(v) ao(vo) p(v)g(vo - v)dv, (1)
where ao(vo) (in inverse meters) is the small-signalabsorption coefficient at the homogeneous line-band
center, p(v) is the normalized inhomogeneous line-shape function, and g(vo - v) is the Lorentzian line-shape function,
g(vo - V) =
1
(2'TrT)2
1 + E/E(vo -v)
2+(27,T)2(2)
The homogeneous linewidth has contributions fromboth relaxation time and power broadening 1 +E/Es, where E is the irradiance (in watts per metersquared), and Es, the saturation irradiance, is definedby
hvo2u(vo)T(
The absorption cross section, u(v) (in meters squared),is related to the small-signal absorption coefficient by
ato(v) = (N - Njo,(v), (4)
where N - N,, is the number density difference (ininverse meters cubed) between lower and upper levelsof the transition. Relaxation times used to definethe saturation irradiance generally include both T,and T2 processes.' However, the rate equations usedto derive Eq. (2) are valid only when T 2 < T1. In thiscase relaxation time T will be that of the limitingkinetic process returning excited-state species to theground state.
Equation (2) can be integrated for two importantlimits. For small molecules with rovibrational tran-sition spacing wider than the homogeneous line-width, the inhomogeneous line shape may be approxi-mated as a delta function at band center v. Theexponential absorption coefficient for the homoge-neous line is just c(v) = aLo(vo)g(v - vo), and
ato(v)
a() 1 + E(Es(v)
where ato(v) = (x(v)/[1 + 8(v)], Es(v) = Es[1 + 8(v)],and 8(v) = [271T(V - Vo)]
2.
Large molecules have rovibrational transition spac-ings that are narrower than the homogeneous line-width, and the absorption is inhomogeneously broad-ened. By definition, inhomogeneous line broadeningmeans that the molecules exist in several uncon-nected states. If the time scale for nonresonantstate relaxation into the resonant state is shorterthan that of excitation to the excited state, every statein the inhomogeneously broadened transition is, ineffect, coupled. This results in the depletion of theentire population of lower states by excitation throughthe resonant state. In other words, the transition iseffectively homogeneously broadened since all statesare connected on a time scale shorter than that of theexcitation. This is a common situation in solution
20 June 1993 / Vol. 32, No. 18 / APPLIED OPTICS 3179
(3)
(5)
phase samples17 and probably occurs in gas-phasesamples of moderate pressure. 2
On the other hand, if the time scales for relaxationinto the levels excited by the laser are longer thanthat of excitation, then the effects of the inhomoge-neously broadened transition on the effective satura-tion absorption coefficient must be taken into ac-count. Thus the second saturation limit is of inhomo-geneously broadened transitions with relatively longbackground state relaxation times. For large mole-cules with a wide inhomogeneous absorption, theline-shape function is essentially constant over thehomogeneous linewidth excited by the narrow-bandlaser. In this case the irradiance-dependent absorp-tion coefficient is
ot~v) - ao(v) 6a(v) = (1 + E/Es)1/ 2 (6)
where the inhomogeneous band center absorptioncoefficient is ao(v) = act(v)p(v)/4T.
The inhomogeneous absorption coefficient does notdecrease as rapidly with irradiance as the homoge-neous one because of the square-root power depen-dence in the denominator. This effect is due to theincreased number of species that can be excited athigh irradiances because of power broadening.Thus, although saturation may occur between stateswith energy differences at or near the excitationenergy, i.e., homogeneous saturation, the total num-ber of species excited increases as a result of powerbroadening of the excitation source linewidth. Inho-mogeneous broadening is more likely at lower gaspressures since rotational relaxation is limited bycollision rates.
3. Absorbed Energy
In deriving the spatial temperature changesprofile itis assumed that the radial profile does not changealong the axis of propagation of the excitation beam,i.e., the cylindrical symmetry approximation. Thisassumption is implicit in most derivations of photo-thermal signals. For this assumption to be valid thesample must be optically thin, and the sample celllength along the axis of propagation must be suchthat the excitation beam waist does not vary signifi-cantly through the cell. The cylindrical symmetryapproximation is quite good if the cell length isshorter than the Rayleigh range of the focused beam.
An excitation source propagating in the fundamen-tal TEMOO mode has an instantaneous irradiance atradius r from the beam center of
EO(r, t) 2(>(t) exp -2r2 (7)
where @D(t) is the instantaneous radiant power inwatts (W), and w is the electric-field beam waistradius parameter. The absorbance law must bemodified to include the irradiance-dependent absorp-tion coefficient. The differential expression for the
irradiance along sample path z is dependent on theirradiance-dependent absorption coefficient:
- dEz(r, t) = E2(r, t)a(v) Ez(r, t)o(v)
[1 + E(r, t)IES]f(8)
From Eqs. (5) and (6), exponential factor f is 1 forhomogeneously and /2 for inhomogeneously broad-ened transitions. Use of this factor permits thederivations to be independent of the broadeningmechanism. Photothermal spectroscopy is nor-mally performed on samples that are optically thinwith respect to absorption. For an optically thinsample, i.e., sample transmission over 99%, the irradi-ance is essentially constant along the path dz and the[1 + Ez(r, t)/ES]f term can be ignored in the integra-tion. This, along with the fact that for small a,exp[-a(v)lj = 1 - a(v)l, results in
E1(r, t) - EO(r, t) -Eo(r, t)a(v)l, (9)
where EO(r, t) is the instantaneous irradiance of thepulsed laser entering the sample, and E(r, t) is theirradiance that exits after passing through a sampleof path length 1. The a(v) is one of the saturationabsorption coefficients. The amount of heat depos-ited in the sample per unit volume per pulse isintegrated irradiance U(r) (in joules per meter cubed).This is found by integrating the irradiance differenceper unit length:
U(r) = fa(v)Eo(r, t)dt. (10)
Because of the nonlinear irradiance dependence inEq. (10), the result must be obtained for specifictemporal pulse shapes. Constant EO(r, t) from t = 0to t = rp is a rectangular pulse. This pulse durationmay be obtained in electro-optically chopped laserpulses. The energy deposited in the sample over thepulse is
(11)Ur~) = ao(v)H exp( 2r)
1 + (E/Es)exp( 2j)]
where subscript r is used to indicate a rectangularpulse. An average irradiance of E = 2(0)1,mw2(W/m2 ), and a time-integrated irradiance of H =2Tp(O)/rw2 (J/m 2 ) is defined for a rectangular pulseduration of Tp and a constant radiant power of D(0).
Another important case is an exponential temporalprofile that may be used in order to resemble moreclosely the output of transverse discharged laserssuch as transversely excited atmospheric CO2 and theexcimers. In this case,
4>(t) = CD(O)exp(-t/rp). (12)
The exponentially averaged power is 'F(O) = Qp,
3180 APPLIED OPTICS / Vol. 32, No. 18 / 20 June 1993
where Q is the total pusle energy (in joules). Theenergies absorbed by the sample are
Ue(r) = (o(V)Estp ln|1 + (1/Es~eX~t 2 ) (U c() tov1 sr1, n[1 (E/E 8 )exp (13)
for homogeneously broadened transitions and
Ue(r) = 2o(v)EsTp{[1 + (E/Es)exp W2 ) 1 - 1]
for inhomogeneously broadened transitions. Be-cause the irradiance varies with time for the exponen-tial pulse, an average irradiance is defined as E =2Q/pTrW 2.
4. Initial Deflection Angles and Focal Lengths
The initial PL-PDS and PL-PLS signals are thoseoccurring shortly after pulsed laser excitation andrelaxation of those -species remaining in the excitedstate but before thermal diffusion of excess thermalenergy away from the region excited by the pulsedlaser. For a thermal diffusion time constant T thatis much greater than either 7p or the time required forexcited-state energy relaxation, radial-dependent tem-perature change 5T(r) is simply absorbed energy U(r)divided by the heat capacity of the sample. This isgenerally a valid assumption since T' are typically ofthe order of milliseconds.5 Finite signal rise timesthat are due to excited-state species that relax afterthe excitation pulse can be observed in certain cases.But the heat capacity approximation still holds aslong as the time required for the maximum signals todevelop is much shorter than that of the thermaldecay. Thus, although the maximum signal maytake a finite amount of time to develop, the maximumtemperature change is still approximated well by theabsorbed energy divided by the heat capacity. Initialtemperature changes for saturation absorption areshown in Table 1.
PL-PTS signals are generated as a direct conse-quence of the spatially dependent refractive-indexperturbations that arise because of sample heating.The PL-DPS signal is proportional to the deflectionangle and the PL-PLS signal is related to the inverse
Table 1. Temperature Changes for Saturation Absorption
Rectangular pulse
8Tr(r) = [ao(v)H/pCp]exp(-2r 2 /w2 )[1 + (E/ES)exp(-2r2/W2)]-f
(15)
Exponential pulse, homogeneous line
BTe(r) = [o(v)EsTp/pCplln[1 + (E/Es)exp(-2r 2 /w 2 )] (16)
Exponential pulse, inhomogeneous line
8Te(r) = [2ao(v)EsTp/pCp]{[1 + (E/Es)exp(-2r 2 /w2)]1/2 - 11
focal length of the thermal lens.5 6 These elementsare calculated from the refractive-index gradient andthe second spatial derivative of the index for PL-PDSand PL-PLS, respectively. The refractive-indexchange usually occurs only because of a change insample density. Sample density is in turn related tothe temperature change at constant pressure. Thedensity-dependent refractive-index change and thetemperature-dependent density change are combinedinto a temperature-dependent refractive-index change.Temperature is found from the absorbed energy andthe heat capacity of the sample, and the initial signalis taken to be the maximum signal that occurs beforethermal decay.
In the limit of small probe ray path perturbations,the deflection angle and inverse focal lengths are3 5
I dn dn=pCp \ dTpdr U(r),
-I /dn d 2
F-'- = - - U(r)nopCp dT, Idr 2 )r=O)
(18)
(19)
respectively. In these equations n is the refractiveindex of the sample, pCp is the heat capacity made upof density p and specific heat capacity Cp, and (dn/dT)pis the change in the refractive index with a change intemperature at constant pressure.
The deflection angle and thus the PL-PDS signalchange with radial offset from the pump laser beamcenter. The equation for calculating the energy-dependent PL-PDS used here is
I dn d2
(I = _ d I - U(r)\~~pd dr r=W/2(20)
since, in the absence of saturation, the photothermaldeflection signal is a maximum when the probe laseris offset by half of the pump laser electric-field beamwaist radius. The deflection angles for rectangularpulse excitation are
-1 dn 2o(v)lH4=no dT p wpp
exp(f/2)[1 + exp(-1/2)(1 - f)E/Es][exp(1/2) + E/Es]f+l (21)
The inverse focal length of the simple thermal lens iscalculated by the use of Eq. (12) in Eq. (20):
1 dn 4(v)lH 1 + (1 - f)E/ESr- no dT/p W2pCp (1 + E/ES)f+1' (22)
For the exponential shaped excitation laser pulsethe initial deflection angle for a probe beam offset ofr = w/2 is
-1 /dn 2(v)lH exp(-1/2)4)e no dTp wpCp [1 + exp(-1/2)E/Es]f (23)
20 June 1993 / Vol. 32, No. 18 / APPLIED OPTICS 3181
The inverse focal length is
= 1 dn) 4o(v)H 1no dTp w 2pCp (1 + E/Es)f
The integrated irradiance H = E is defined forexponential pulse expressions.
5. Time-Dependent Signals
The time-dependent behavior of the photothermaldeflection angles and focal lengths is found by solvingthe thermal diffusion equation for the absorbed irra-diance. Time-dependent PL-PDS and PL-PLS sig-nals are relatively easy to derive for initial absorbedirradiance profiles that are Gaussian in form. Solu-tions to the diffusion equation can be found byintegration over the Green's function for a radiallysymmetric source or by transform techniques. Butanalytical solutions for the time-dependent signalsare not known in cases in which saturation distortsthe initial Gaussian profile. These time-dependentsignals can be approximated by first finding a set ofGaussians that, when superimposed, accurately de-scribe the initial spatially absorbed irradiance profile.The heat transfer law is additive with respect to thethermal sources. Thus the individual Gaussian pro-files in the superposition approximation can be treatedas a separate heat source. The time-dependent sig-nal is then the sum of the time-dependent signalsfrom each of the component Gaussian heat sources.
The thermal diffusion equation,
dtdt ST(x, y, z, t) - KV2 ST(x, y, z, t) + O(x, y, z, t), (25)
where K is the thermal diffusion coefficient, and 0 isthe time rate of temperature change of the source, issolved for a cylindrically symmetric source in anisotropic medium and has a solution5
5T(r, t) = dt' f G(r, r', t')dr'. (26)
The Green's function, G(r, r', t'), for the Gaussiansource is
G~r r' t' =r'Q '(r', t') [ (r2 + I r2 )]rr'~G(r, r', t') = ex Io e x p °(K
2pCpKt' ep 4KtJ'kMl~)
(27)
where Q '(r', t) is the time rate of heat release and Io( )is the modified zero-order Bessel's function. Integra-tion over time is performed first. Since the rate ofheat release is assumed to be much faster thanthermal diffusion the time integral over any fastexcitation will appear as a delta function on the timescale of the thermal decay. Q'(r, t) is just U(r, t)8(t)
(24) 8T(r, t) = 1 | 5T(r')exp 4K(r2t Ir°2) (Io r'dr'.
(28)
Integration can be performed if BT(r) can be expandedas a series of N Gaussian exponents:NT~r) [ ak kr2-8T(r) = iak exp 2I.
k=i LW(29)
The time-dependent temperature change profile isthen
N ak -kr 2
5T(r, t) = 71 + kt/T p W2(1 + kt/T) X (30)
where Tc = W2 /4K is the characteristic thermal decaytime. The PL-PDS signal with a probe beam offsetat radius r = w/2 is
21 dn N kak -kl(t) = - k I (1+ kt/T) exPL2(1 + kt/T)J'
(31)
and the PL-PLS signal is
' 41 (dn~ + kak
W 2no dT)Pk= (1 + kt/Tr,) 2 (32)
Expansion coefficients ak are found by linear regres-sion. Ten terms are usually adequate to model theinitial temperature change profile to a high degree ofaccuracy. Accuracy is checked by inspection of theX2 parameter of the regression. Different models,i.e., the use of different exponential dependencies ofthe basis Gaussian functions, give similar results.
6. Discussion
A. Initial Temperature Change Profiles
Equations that describe the initial radially dependenttemperature change profile for the four differentcases involving homogeneously and inhomogeneouslybroadened transitions excited with rectangular andexponential pulses appear to be quite different.However, all cases have the same low irradiance limit.For irradiances that are much less than those re-quired for saturation, the temperature change resultsall converge to
oto(v)H =-2r 2)lim 5T(r)= - expII'Do- PCp 2)
(33)
As expected, all cases converge to the same spatialform, that of the excitation laser beam profile, whensaturation is not occurring.
When the excitation irradiance approaches or ex-
3182 APPLIED OPTICS / Vol. 32, No. 18 / 20 June 1993
and
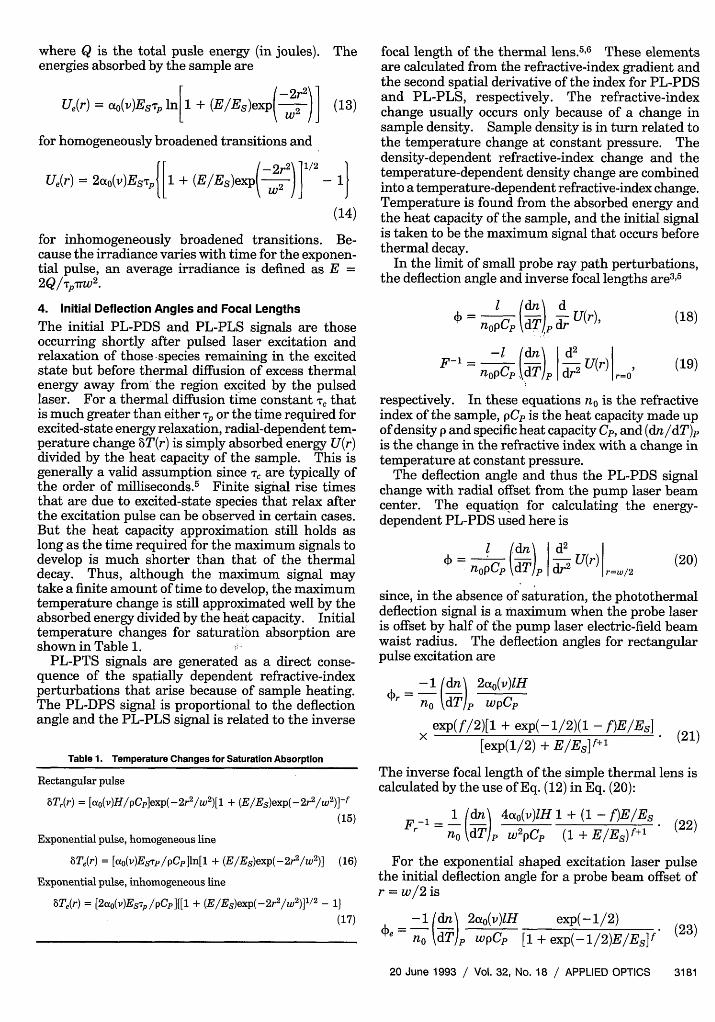
ceeds that required for saturation, the initial spatialtemperature change profile becomes distorted fromthat of the excitation laser profile. Radially depen-dent initial temperature change profiles for severaldifferent saturation and excitation pulse types areillustrated in Figs. 1-3. The homogeneously broad-ened transition excited with a rectangular temporalpulse, illustrated in Fig. 1, has the most markedchange in the temperature change profile with re-spect to irradiance. As E exceeds ES, the top of theprofile becomes flatter because of saturation near thebeam center, where the irradiance is highest. Thisbehavior will result in a decreased thermal lens signalat irradiances in excess of ES since this signal isproportional to the second derivative with respect toradius. In fact, the limiting temperature change is
lim Tr(r) ao(v)'r Es (34)
Since the high irradiance-limited temperature changeis independent of radius, there will be no initialPL-PLS signal. But there is a temperature increase.The profile of the temperature increase will changewith time as a consequence of thermal diffusion.The radial diffusion process is Gaussian, and a finitePL-PLS signal will develop over time. This behavioris shown below.
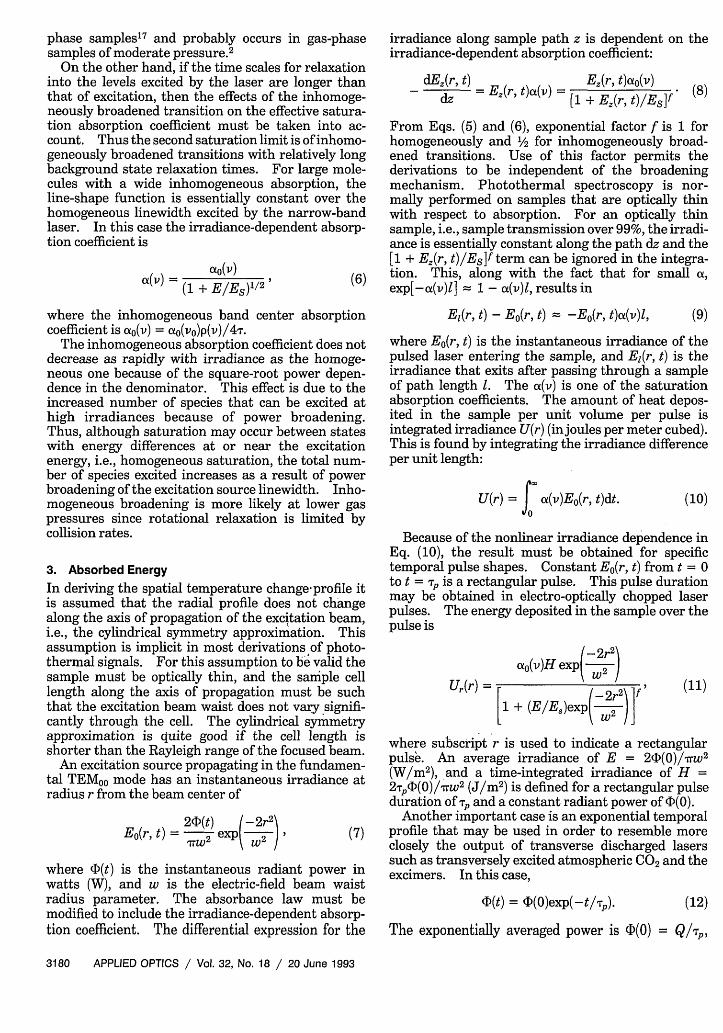
The difference between the exponential pulse tem-perature change and that of the rectangular pulse issignificant for a homogeneously broadened transitions.The spatial profile of the thermal perturbation for ahomogeneously broadened transition being excitedwith an exponential shaped temporal profile is illus-trated in Fig. 2. For exponential pulse excitation,the radially dependent on-axis temperature changefor irradiances far in excess of that for saturation is
lim 8Te(r) aO(v)'rES(Do PCP
[ln(E/Es)- 2]Wi (35)
E-4
W0
9
M;D
9L49F-4
0.0 0.5 1.0 1.5 2.0 2.5 3.0
RELATIVE RADIUS (r/w)
Fig. 2. Plot of the scaled temperature change profiles for homoge-neously broadened transition excited with an exponential pulsewith E/Es's of 0.1, 1, 2, 5, and 10, from the narrowest to thewidest.
for a homogeneously broadened transition. Sincethe radial dependence becomes isolated from theirradiance in this limit, the PL-PLS signal strengthwill reach a maximum value that is independent ofexcitation irradiance. This can be seen by taking thesecond derivative of the limiting profile in approxima-tion (35):
d 2 [lim 6Te(r)l -dr 2 [DO-.c
4aot (v)TpEs
w 2pCP(36)
In this limit the PL-PLS signal depends on only thenumber density of molecules and the excited-staterelaxation time constant since (o(v) Ntotu(v) andEs = hv/2u(v)T. This feature of optical saturationcould be used to increase the accuracy of the PL-PLSexperiment. In this limit, the signal would not haveto be corrected for pulsed laser irradiance variations
0.6-\\ \J0.4-\ < t
0.0-_0.0
Ed0
W
0.5 1.0 1.5 2.0 2.5 3.0
RELATIVE RADIUS (r/w)
Fig. 1. Plot of the scaled temperature change profiles for ahomogeneously broadened transition by a rectangular pulsedexcitation. The profiles correspond to E/Es's of 0.1, 1, 2, 5, and10, from the narrowest to the widest.
1.0
0.8
0.6
0.4
0.2
0.0 I 4 | I0.0 0.5 1.0 1.5 2.0 2.5 3.0
RELATIVE RADIUS (r/w)
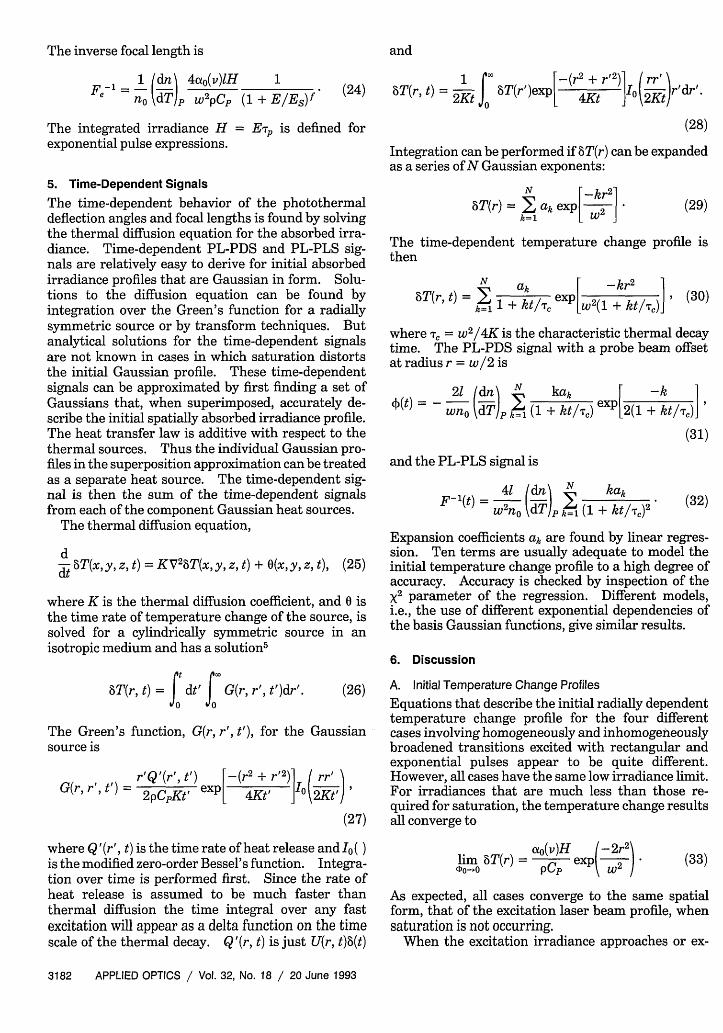
Fig. 3. Plot of the scaled temperature change profiles for aninhomogeneously broadened transition by a rectangular pulse forE/Es's of 0.1, 1, 2, 5, and 10, from the narrowest to the widest.
20 June 1993 / Vol. 32, No. 18 / APPLIED OPTICS 3183
in order to obtain the sample absorbance or analyteconcentration.
Differences in the radially dependent temperaturechanges of homogeneously broadened transitions forrectangular and exponential pulse shapes can be seenby examining Fig. 1 and 2. The fact that differenttemporal pulse shapes influence the radial depen-dence of the temperature change indicates that theexperimental determination of saturation behaviormust be performed with well-characterized pulses.
Rectangular pulse excitation of inhomogeneouslybroadened transitions results in temperature changeprofiles that do not flatten with increasing irradiance.Initial spatial profiles for inhomogeneously broad-ened saturation are shown in Fig. 3. The limitingtemperature change profiles in this case are
lim BTr(r) ao(v) (EES) 1 /2 exp(-r 2 /w 2 ). (37)
The radial dependence has changed but is still Gauss-ian in form. As indicated by the temperature changeprofiles in Table 1, inhomogeneously broadened tran-sitions will always have an initial, on-axis curvature.Because the diffusion process broadens a Gaussian,this will result in a PL-PLS signal that is a maximumat zero time. The radius of the initial temperaturechange effectively increases by a factor of /2 in thehigh irradiance saturation limit.
The limiting spatial profile of thermal perturbationfor an inhomogeneously broadened transition beingexcited with an exponential shaped temporal profile is
lim 8Te(r) 2a°(V) , (EES)'/ 2exp(-r 2 /W2 ). (38)
The form of this limiting profile is the same as thatwhich would be obtained with the rectangular pulse.But there is a factor of 2 difference in the magnitude.The factor of 2 may be due to the different way theirradiance is defined for rectangular and exponentialpulses. The form of the radially dependent tempera-ture change is nearly identical to that shown in Fig. 3.In both cases the resulting temperature change pro-file is a Gaussian with the same radial width. Thusthe temperature change profile is apparently notdependent on pulse shape for inhomogeneously broad-ened transitions.
B. Irradiance-Dependent Initial Time PL-PTS Signals
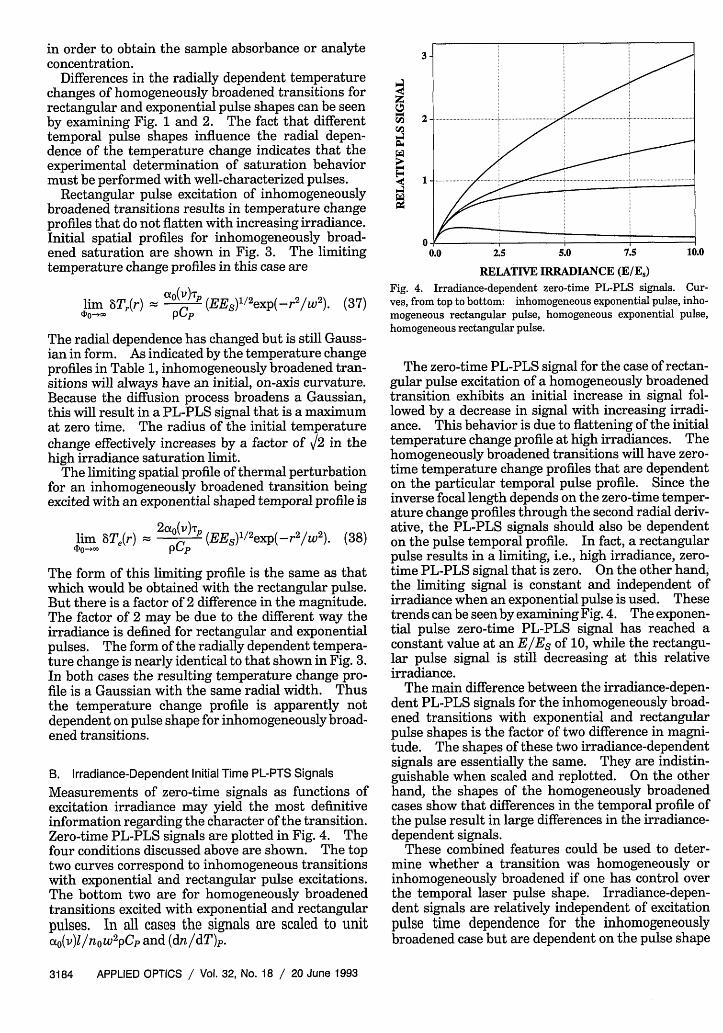
Measurements of zero-time signals as functions ofexcitation irradiance may yield the most definitiveinformation regarding the character of the transition.Zero-time PL-PLS signals are plotted in Fig. 4. Thefour conditions discussed above are shown. The toptwo curves correspond to inhomogeneous transitionswith exponential and rectangular pulse excitations.The bottom two are for homogeneously broadenedtransitions excited with exponential and rectangularpulses. In all cases the signals are scaled to unitcot0 (v)l/nowpCp and (dn/dT)p.
z
U
voA
EW
.
10.0
RELATIVE IRRADIANCE (E/Es)
Fig. 4. Irradiance-dependent zero-time PL-PLS signals. Cur-ves, from top to bottom: inhomogeneous exponential pulse, inho-mogeneous rectangular pulse, homogeneous exponential pulse,homogeneous rectangular pulse.
The zero-time PL-PLS signal for the case of rectan-gular pulse excitation of a homogeneously broadenedtransition exhibits an initial increase in signal fol-lowed by a decrease in signal with increasing irradi-ance. This behavior is due to flattening of the initialtemperature change profile at high irradiances. Thehomogeneously broadened transitions will have zero-time temperature change profiles that are dependenton the particular temporal pulse profile. Since theinverse focal length depends on the zero-time temper-ature change profiles through the second radial deriv-ative, the PL-PLS signals should also be dependenton the pulse temporal profile. In fact, a rectangularpulse results in a limiting, i.e., high irradiance, zero-time PL-PLS signal that is zero. On the other hand,the limiting signal is constant and independent ofirradiance when an exponential pulse is used. Thesetrends can be seen by examining Fig. 4. The exponen-tial pulse zero-time PL-PLS signal has reached aconstant value at an E/ES of 10, while the rectangu-lar pulse signal is still decreasing at this relativeirradiance.
The main difference between the irradiance-depen-dent PL-PLS signals for the inhomogeneously broad-ened transitions with exponential and rectangularpulse shapes is the factor of two difference in magni-tude. The shapes of these two irradiance-dependentsignals are essentially the same. They are indistin-guishable when scaled and replotted. On the otherhand, the shapes of the homogeneously broadenedcases show that differences in the temporal profile ofthe pulse result in large differences in the irradiance-dependent signals.
These combined features could be used to deter-mine whether a transition was homogeneously orinhomogeneously broadened if one has control overthe temporal laser pulse shape. Irradiance-depen-dent signals are relatively independent of excitationpulse time dependence for the inhomogeneouslybroadened case but are dependent on the pulse shape
3184 APPLIED OPTICS / Vol. 32, No. 18 / 20 June 1993
in the case of the homogeneously broadened transi-tion. So an experiment comparing the irradiance-dependent zero-time signals for two or more laserpulse shapes would allow one to determine whetherthe transition is homogeneously or inhomogeneouslybroadened.
There are significant differences in the shapes ofthe irradiance-dependent zero-time signal curves fora particular laser pulse shape but with differentbroadening mechanisms. Thus, with the use of aparticular laser, the mechanism may be elucidated byexamining the shape of the irradiance-dependentzero-time PL-PLS signals. In particular, homoge-neously broadened transitions have irradiance-depen-dent zero-time PL-PLS signals that either decrease orstop increasing with increasing irradiance. Inhomo-geneously broadened transitions have irradiance-dependent PL-PLS signals that increase with increas-ing irradiance past saturation.
The equations describing the PL-PDS signals aresimilar to those for PL-PLS. The time- and irradi-ance-dependent signals are nearly equivalent for theconditions used to derive the equations. But PL-PDS introduces another degree of freedom, that ofthe pump-probe laser beam offset. This extra de-gree of freedom means that additional measurementsmust be made if the signals are to be used for thequantitative measurement of nonlinear effects. Mea-suring the exact pump-probe laser beam offset isdifficult, and attempting to adjust the offset by maxi-mizing the signal when saturation is occurring isbound to be problematic since the offset to themaximum gradient changes with the degree of satura-tion. One solution is to adjust the pump-probe laserbeam offset for maximum signal when saturation isnot occurring. In the Fourier law of diffusive heattransfer, the temperature diffusion rate is propor-tional to the gradient. Thermal diffusion occurs in adirection such as to decrease this gradient. Conse-quently, the maximum gradient must occur at zerotime, and thermal diffusion can only decrease thismaximum gradient. Thus the deflection angle thatis due to the maximum gradient must also decreasewith time. On the other hand, time-dependent gra-dients at locations other than that where the maxi-mum initial gradient occurs may increase in time incases in which E exceeds ES. Subsequently, a rangeof time-dependent PL-PDS signals should be ob-served as the pump-probe beam offset is changedwhen the irradiance exceeds ES. The potential mea-surement problems associated with the interpreta-tion of the time domain PL-PDS signal would leadone to conclude the PL-PLS is better suited forphotothermal studies when optical saturation occurs.
However, even with these potential measurementproblems, PL-PDS has a potential application inquantitative analysis. Optical saturation ultimatelylimits conventional absorption spectrophotometry.Optical saturation, along with shot-noise statistics,has been used to calculate ultimate limits of detectionin analytical spectroscopy.18 PL-PDS can circum-
vent these limits both by the use of an indirectmeasure of optical absorbance, thereby circumvent-ing the shot-noise limitation, and by producing asignal that increases with irradiances well beyondthose required for saturation. As seen in Fig. 1,there is an increase in the slope of the scaled tempera-ture change profiles with increasing irradiance.However, increasing the irradiance also increases theradial offset to the maximum gradient. Thus thelocation of the maximum gradient changes in space asa function of the degree of saturation. Subsequent-ly, in order to benefit from the larger signals producedby the increased gradients under saturation condi-tions, the probe beam must be offset to the maximumgradient position. This may be accomplished if thePL-PDS signal is maximized by adjusting the pump-probe laser offset for a species that is being saturated.
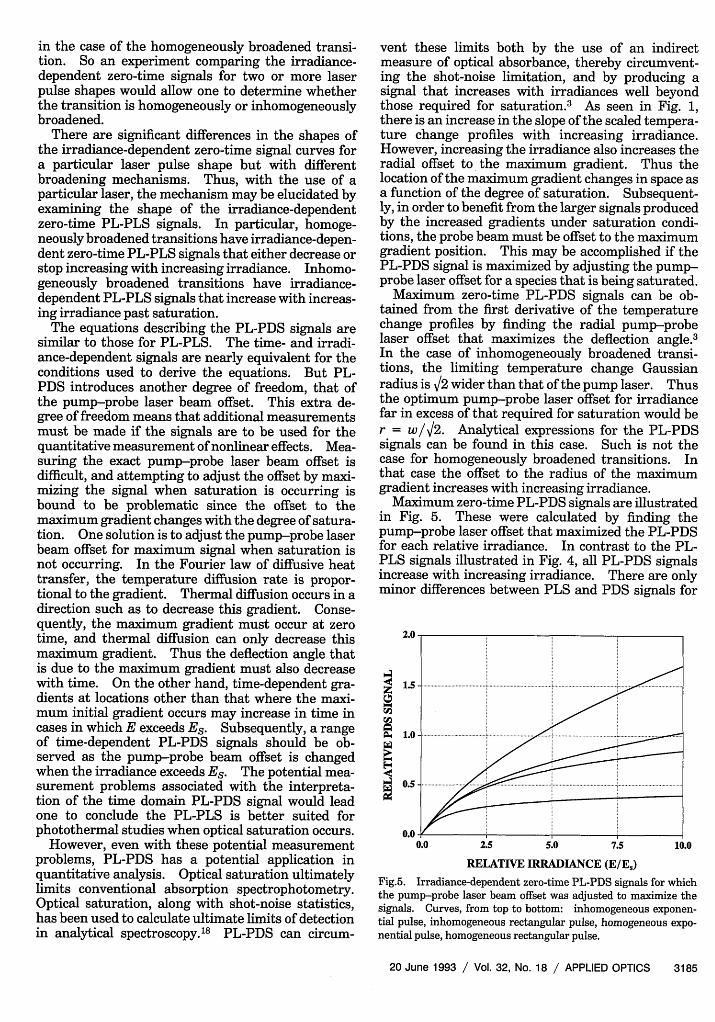
Maximum zero-time PL-PDS signals can be ob-tained from the first derivative of the temperaturechange profiles by finding the radial pump-probelaser offset that maximizes the deflection angle.3In the case of inhomogeneously broadened transi-tions, the limiting temperature change Gaussianradius is V2 wider than that of the pump laser. Thusthe optimum pump-probe laser offset for irradiancefar in excess of that required for saturation would ber = w/V2. Analytical expressions for the PL-PDSsignals can be found in this case. Such is not thecase for homogeneously broadened transitions. Inthat case the offset to the radius of the maximumgradient increases with increasing irradiance.
Maximum zero-time PL-PDS signals are illustratedin Fig. 5. These were calculated by finding thepump-probe laser offset that maximized the PL-PDSfor each relative irradiance. In contrast to the PL-PLS signals illustrated in Fig. 4, all PL-PDS signalsincrease with increasing irradiance. There are onlyminor differences between PLS and PDS signals for
2.0
zA
IA
1.5
1.0
0.5
0.010.0
RELATIVE IRRADIANCE (E/E,)
Fig.5. Irradiance-dependent zero-time PL-PDS signals for whichthe pump-probe laser beam offset was adjusted to maximize thesignals. Curves, from top to bottom: inhomogeneous exponen-tial pulse, inhomogeneous rectangular pulse, homogeneous expo-nential pulse, homogeneous rectangular pulse.
20 June 1993 / Vol. 32, No. 18 / APPLIED OPTICS 3185
the inhomogeneously broadened transitions. ButPL-PDS signals produced for the homogeneouslybroadened transitions show enhanced signals andsensitivities at higher irradiance. The exponentialpulse case does not level off, and the rectangular pulsecase does not decrease, with increasing irradiance, aswas the case for PLS.
C. Time-Dependent PL-PLS Signals
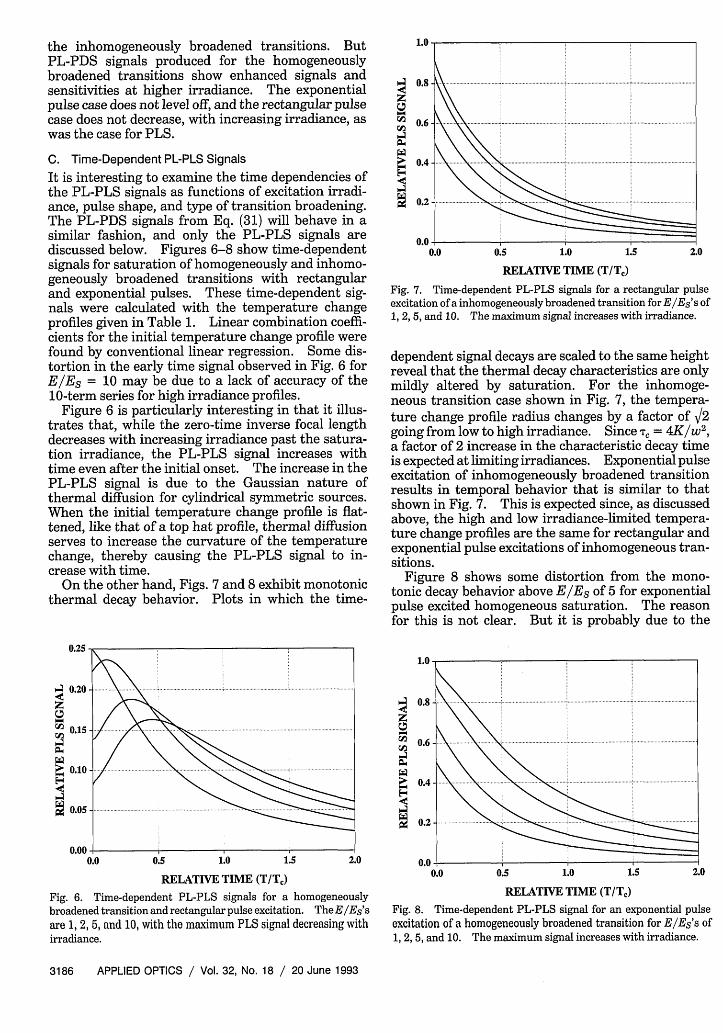
It is interesting to examine the time dependencies ofthe PL-PLS signals as functions of excitation irradi-ance, pulse shape, and type of transition broadening.The PL-PDS signals from Eq. (31) will behave in asimilar fashion, and only the PL-PLS signals arediscussed below. Figures 6-8 show time-dependentsignals for saturation of homogeneously and inhomo-geneously broadened transitions with rectangularand exponential pulses. These time-dependent sig-nals were calculated with the temperature changeprofiles given in Table 1. Linear combination coeffi-cients for the initial temperature change profile werefound by conventional linear regression. Some dis-tortion in the early time signal observed in Fig. 6 forE/ES = 10 may be due to a lack of accuracy of the10-term series for high irradiance profiles.
Figure 6 is particularly interesting in that it illus-trates that, while the zero-time inverse focal lengthdecreases with increasing irradiance past the satura-tion irradiance, the PL-PLS signal increases withtime even after the initial onset. The increase in thePL-PLS signal is due to the Gaussian nature ofthermal diffusion for cylindrical symmetric sources.When the initial temperature change profile is flat-tened, like that of a top hat profile, thermal diffusionserves to increase the curvature of the temperaturechange, thereby causing the PL-PLS signal to in-crease with time.
On the other hand, Figs. 7 and 8 exhibit monotonicthermal decay behavior. Plots in which the time-
0.25-
0 0.15-/ \ \ t 0 .1 - ........... ............... . . .............................
0.10 - .........................
0.05 ...... ..
0.00 ,0.0 0.5 1.0 1.5 2.0
RELATIVE TIME (T/T,)
Fig. 6. Time-dependent PL-PLS signals for a homogeneouslybroadened transition and rectangular pulse excitation. TheE/Es'sare 1, 2, 5, and 10, with the maximum PLS signal decreasing withirradiance.
1.0
Z0W(40 �04W
E-4-!4. 4
0.8
0.6
0.4
0.2
0.00.0 0.5 1.0 1.5 2.0
RELATIVE TIME (T/T)
Fig. 7. Time-dependent PL-PLS signals for a rectangular pulseexcitation of a inhomogeneously broadened transition for E/Es's of1, 2, 5, and 10. The maximum signal increases with irradiance.
dependent signal decays are scaled to the same heightreveal that the thermal decay characteristics are onlymildly altered by saturation. For the inhomoge-neous transition case shown in Fig. 7, the tempera-ture change profile radius changes by a factor of V2going from low to high irradiance. Since T, = 4K/W 2
,
a factor of 2 increase in the characteristic decay timeis expected at limiting irradiances. Exponential pulseexcitation of inhomogeneously broadened transitionresults in temporal behavior that is similar to thatshown in Fig. 7. This is expected since, as discussedabove, the high and low irradiance-limited tempera-ture change profiles are the same for rectangular andexponential pulse excitations of inhomogeneous tran-sitions.
Figure 8 shows some distortion from the mono-tonic decay behavior above E/ES of 5 for exponentialpulse excited homogeneous saturation. The reasonfor this is not clear. But it is probably due to the
1.0 -
Q 0.8-\
&O 0.6 X . . .
i; 0.4 .. .
§ 0.2 >
-- __.
0.0 0.5 1.0 1.5 2.0
RELATIVE TIME (T/T,)
Fig. 8. Time-dependent PL-PLS signal for an exponential pulseexcitation of a homogeneously broadened transition for E/Es's of1, 2,5, and 10. The maximum signal increases with irradiance.
3186 APPLIED OPTICS / Vol. 32, No. 18 / 20 June 1993
............................ .................................... ......................... ............. ..............
........................... ............................................................... . .............................................
................................. . ............................................. ..............................................
...............................
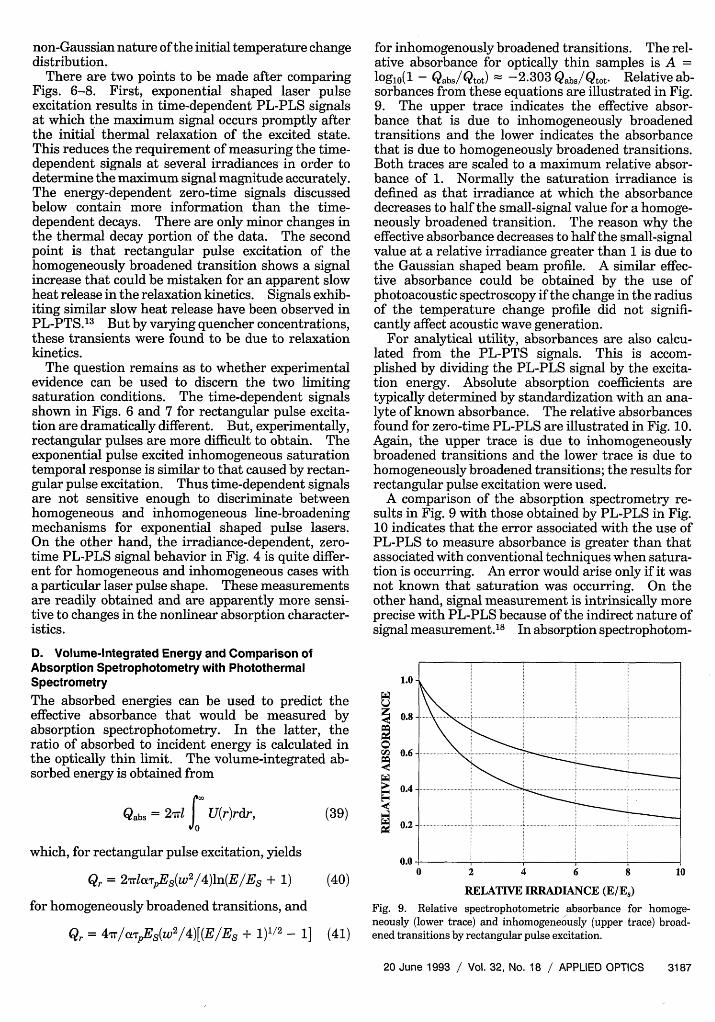
non-Gaussian nature of the initial temperature changedistribution.
There are two points to be made after comparingFigs. 6-8. First, exponential shaped laser pulseexcitation results in time-dependent PL-PLS signalsat which the maximum signal occurs promptly afterthe initial thermal relaxation of the excited state.This reduces the requirement of measuring the time-dependent signals at several irradiances in order todetermine the maximum signal magnitude accurately.The energy-dependent zero-time signals discussedbelow contain more information than the time-dependent decays. There are only minor changes inthe thermal decay portion of the data. The secondpoint is that rectangular pulse excitation of thehomogeneously broadened transition shows a signalincrease that could be mistaken for an apparent slowheat release in the relaxation kinetics. Signals exhib-iting similar slow heat release have been observed inPL-PTS.' 3 But by varying quencher concentrations,these transients were found to be due to relaxationkinetics.
The question remains as to whether experimentalevidence can be used to discern the two limitingsaturation conditions. The time-dependent signalsshown in Figs. 6 and 7 for rectangular pulse excita-tion are dramatically different. But, experimentally,rectangular pulses are more difficult to obtain. Theexponential pulse excited inhomogeneous saturationtemporal response is similar to that caused by rectan-gular pulse excitation. Thus time-dependent signalsare not sensitive enough to discriminate betweenhomogeneous and inhomogeneous line-broadeningmechanisms for exponential shaped pulse lasers.On the other hand, the irradiance-dependent, zero-time PL-PLS signal behavior in Fig. 4 is quite differ-ent for homogeneous and inhomogeneous cases witha particular laser pulse shape. These measurementsare readily obtained and are apparently more sensi-tive to changes in the nonlinear absorption character-istics.
D. Volume-integrated Energy and Comparison ofAbsorption Spetrophotometry with PhotothermalSpectrometry
The absorbed energies can be used to predict theeffective absorbance that would be measured byabsorption spectrophotometry. In the latter, theratio of absorbed to incident energy is calculated inthe optically thin limit. The volume-integrated ab-sorbed energy is obtained from
Qabs = 2,ml U(r)rdr, (39)
which, for rectangular pulse excitation, yields
Qr = 2'rlaTpEs(W 2 /4)ln(E/Es + 1)
for homogeneously broadened transitions, and
Qr = 4rr/uxTEs(W 2/4)[(E/Es + 1)1/2 - 1]
(40)
(41)
for inhomogenously broadened transitions. The rel-ative absorbance for optically thin samples is A =°0glO(1 - Qabs/Qtot) -2.303 Qabs/Qtot. Relative ab-
sorbances from these equations are illustrated in Fig.9. The upper trace indicates the effective absor-bance that is due to inhomogeneously broadenedtransitions and the lower indicates the absorbancethat is due to homogeneously broadened transitions.Both traces are scaled to a maximum relative absor-bance of 1. Normally the saturation irradiance isdefined as that irradiance at which the absorbancedecreases to half the small-signal value for a homoge-neously broadened transition. The reason why theeffective absorbance decreases to half the small-signalvalue at a relative irradiance greater than 1 is due tothe Gaussian shaped beam profile. A similar effec-tive absorbance could be obtained by the use ofphotoacoustic spectroscopy if the change in the radiusof the temperature change profile did not signifi-cantly affect acoustic wave generation.
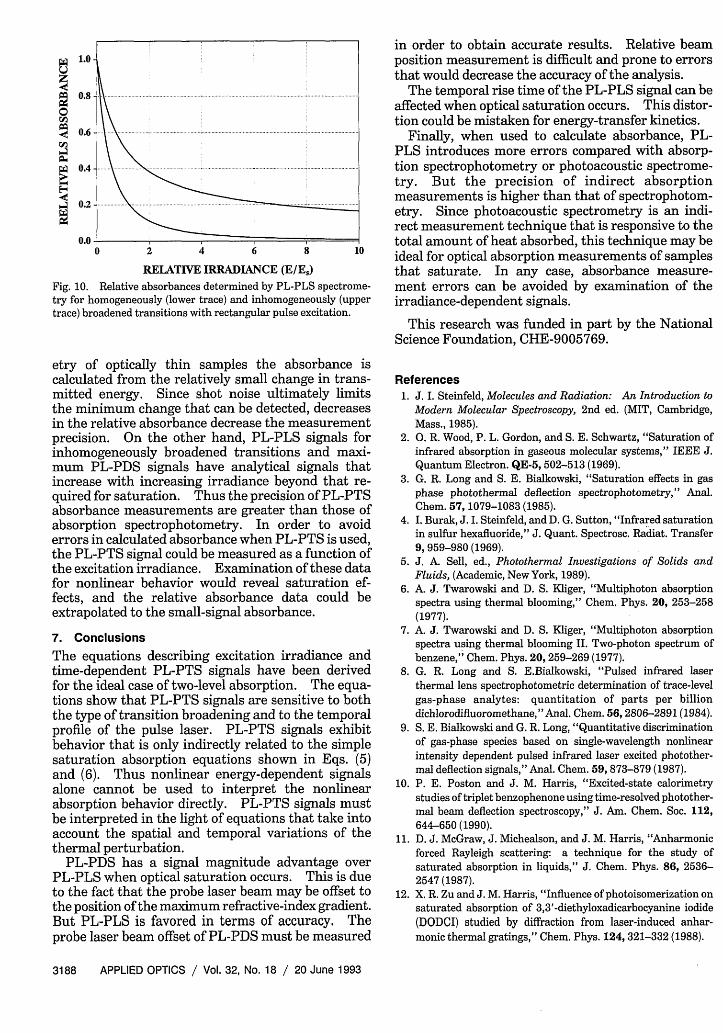
For analytical utility, absorbances are also calcu-lated from the PL-PTS signals. This is accom-plished by dividing the PL-PLS signal by the excita-tion energy. Absolute absorption coefficients aretypically determined by standardization with an ana-lyte of known absorbance. The relative absorbancesfound for zero-time PL-PLS are illustrated in Fig. 10.Again, the upper trace is due to inhomogeneouslybroadened transitions and the lower trace is due tohomogeneously broadened transitions; the results forrectangular pulse excitation were used.
A comparison of the absorption spectrometry re-sults in Fig. 9 with those obtained by PL-PLS in Fig.10 indicates that the error associated with the use ofPL-PLS to measure absorbance is greater than thatassociated with conventional techniques when satura-tion is occurring. An error would arise only if it wasnot known that saturation was occurring. On theother hand, signal measurement is intrinsically moreprecise with PL-PLS because of the indirect nature ofsignal measurement. 8 In absorption spectrophotom-
WU3
0
It
0 2 4 6 8 10
RELATIVE IRRADIANCE (E/Es)
Fig. 9. Relative spectrophotometric absorbance for homoge-neously (lower trace) and inhomogeneously (upper trace) broad-ened transitions by rectangular pulse excitation.
20 June 1993 / Vol. 32, No. 18 / APPLIED OPTICS 3187
WU
0U�M_-!trA04
1.4
9
1.0-
0.8 -
0.6 -
0.4 -
0.2-
0 2 4 6
RELATIVE IRRADIANCE (E/i
Fig. 10. Relative absorbances determined by PL-Ptry for homogeneously (lower trace) and inhomogertrace) broadened transitions with rectangular pulse
etry of optically thin samples the abEcalculated from the relatively small chantmitted energy. Since shot noise ultim,the minimum change that can be detectecin the relative absorbance decrease the mlprecision. On the other hand, PL-PLSinhomogeneously broadened transitionsmum PL-PDS signals have analytical sincrease with increasing irradiance beyoquired for saturation. Thus the precisionabsorbance measurements are greater thabsorption spectrophotometry. In ordEerrors in calculated absorbance when PL-1the PL-PTS signal could be measured as athe excitation irradiance. Examination ofor nonlinear behavior would reveal satfects, and the relative absorbance datextrapolated to the small-signal absorban
7. Conclusions
The equations describing excitation irratime-dependent PL-PTS signals have bfor the ideal case of two-level absorption.tions show that PL-PTS signals are sensithe type of transition broadening and to tlprofile of the pulse laser. PL-PTS sigrbehavior that is only indirectly related tosaturation absorption equations shownand (6). Thus nonlinear energy-dependalone cannot be used to interpret theabsorption behavior directly. PL-PTS sibe interpreted in the light of equations thaccount the spatial and temporal variatthermal perturbation.
PL-PDS has a signal magnitude advePL-PLS when optical saturation occurs.to the fact that the probe laser beam maythe position of the maximum refractive-indBut PL-PLS is favored in terms of accuprobe laser beam offset of PL-PDS must b
in order to obtain accurate results. Relative beamposition measurement is difficult and prone to errorsthat would decrease the accuracy of the analysis.
The temporal rise time of the PL-PLS signal can beaffected when optical saturation occurs. This distor-tion could be mistaken for energy-transfer kinetics.
Finally, when used to calculate absorbance, PL-PLS introduces more errors compared with absorp-tion spectrophotometry or photoacoustic spectrome-try. But the precision of indirect absorptionmeasurements is higher than that of spectrophotom-etry. Since photoacoustic spectrometry is an indi-rect measurement technique that is responsive to thetotal amount of heat absorbed, this technique may be
8 10 ideal for optical absorption measurements of samplesEs.1) that saturate. In any case, absorbance measure-LS spectrome- ment errors can be avoided by examination of theieously (upper irradiance-dependent signals.excitation.
This research was funded in part by the NationalScience Foundation, CHE-9005769.
sorbance isge in trans- Referencesitely limits 1. J. I. Steinfeld, Molecules and Radiation: An Introduction to1, decreases Modern Molecular Spectroscopy, 2nd ed. (MIT, Cambridge,easurement Mass., 1985).signals for 2. 0. R. Wood, P. L. Gordon, and S. E. Schwartz, "Saturation ofand maxi- infrared absorption in gaseous molecular systems," IEEE J.
ignals that Quantum Electron. QE-5, 502-513 (1969).nd that re- 3. G. R. Long and S. E. Bialkowski, "Saturation effects in gasLof PL-PTS phase photothermal deflection spectrophotometry," Anal.an those of Chem. 57, 1079-1083 (1985).er to avoid 4. I. Burak, J. I. Steinfeld, and D. G. Sutton, "Infrared saturationTSsu sedon oin sulfur hexafluoride," J. Quant. Spectrosc. Radiat. Transfer
fution ofed 9, 959-980 (1969).
f these data 5. J. A. Sell, ed., Photothermal Investigations of Solids and;uation f- Fluids, (Academic, New York, 1989).urat on e- 6. A. J. Twarowski and D. S. Kliger, "Multiphoton absorption;a could be spectra using thermal blooming," Chem. Phys. 20, 253-258ce. (1977).
7. A. J. Twarowski and D. S. Kliger, "Multiphoton absorptionspectra using thermal blooming II. Two-photon spectrum of
diance and benzene," Chem. Phys. 20, 259-269 (1977).,en derived 8. G. R. Long and S. E.Bialkowski, "Pulsed infrared laser
The equa- thermal lens spectrophotometric determination of trace-leveltive to both gas-phase analytes: quantitation of parts per billionhe temporal dichlorodifluoromethane,"Anal. Chem. 56,2806-2891 (1984).ials exhibit 9. S. E. Bialkowski and G. R. Long, "Quantitative discrimination
the simple of gas-phase species based on single-wavelength nonlinear
in Eqs. (5) intensity dependent pulsed infrared laser excited photother-.ent signals mal deflection signals," Anal. Chem. 59, 873-879 (1987).
nonlinear 10. P. E. Poston and J. M. Harris, "Excited-state calorimetry*uals must studies of triplet benzophenone using time-resolved photother-
tgnals must mal beam deflection spectroscopy," J. Am. Chem. Soc. 112,
ionseiof h 644-650 (1990).tions of the 11. D. J. McGraw, J. Michealson, and J. M. Harris, "Anharmonic
forced Rayleigh scattering: a technique for the study ofantage over saturated absorption in liquids," J. Chem. Phys. 86, 2536-This is due 2547 (1987).be offset to 12. X. R. Zu and J. M. Harris, "Influence of photoisomerization onex gradient. saturated absorption of 3,3'-diethyloxadicarbocyanine iodidetracy. The (DODCI) studied by diffraction from laser-induced anhar-e measured monic thermal gratings," Chem. Phys. 124,321-332 (1988).
3188 APPLIED OPTICS / Vol. 32, No. 18 / 20 June 1993
ULH.U
........................................................ ............ .................... ............ ........................
... ............... ................ ................ .......... .................
....................... ............................... ..................................
................ ....................................... .......... ..
13. X. R. Zu and J. M. Harris, "Nonlinear absorption by all-trans-p-carotene studied by diffraction from laser-induced anhar-monic thermal gratings," J. Phys. Chem. 93, 75-83 (1989).
14. D. M. Cox, "Pulsed optoacoustic detection of multiple photonexcitation in molecules," Opt. Commun. 24, 336-340 (1987).
15. S. L. Chin, D. K. Evans, R. D. McAlpine, and W. N. Selander,"Single-pulse photoacoustic technique for measuring IR multi-photon absorption by polyatomic molecules," Appl. Opt. 21,65-68 (1982).
16. T. A. Seder and E. Weitz, "Photoacoustic measurements of
multiple-photon infrared absorption by alkyl chlorides andhexadienes," Chem. Phys. Lett. 104, 545-551 (1984).
17. C. R. Giuliano and L. D. Hess, "Nonlinear absorption of light:optical saturation of electronic transitions in organic mole-cules with high intensity laser radiation," IEEE J. QuantumElectron. QE-3, 358-367 (1967).
18. J. D. Winefordner and M. Rutledge, "Comparison in calculateddetection limits in molecular absorption, molecular lumines-cencej Raman, molecular ionization, and photothermalspectrometry," Appl. Spectrosc. 30, 377-391 (1985).
20 June 1993 / Vol. 32, No. 18 / APPLIED OPTICS 3189